taming intermittent plasticity at small scales
TRANSCRIPT
1
Taming intermittent plasticity at small scales Peng Zhanga,*, Oguz Umut Salmanb,*, Jin-Yu Zhanga,*, Gang Liua, Jérôme Weissc,
Lev Truskinovskyd, Jun Suna
aState Key Laboratory for Mechanical Behavior of Materials, Xi’an Jiaotong University, Xi’an, 710049, China bCNRS, LSPM UPR3407, Université Paris 13, Sorbonne Paris Cité , 93430 Villetaneuse, France cIsTerre, CNRS/Université Grenoble Alpes, 38401 Grenoble, France d PMMH, CNRS -- UMR 7636, ESPCI ParisTech, 10 Rue Vauquelin, 75005 Paris
Abstract ─The extreme miniaturization in modern technology calls for deeper insights into the
non-conventional, fluctuation dominated mechanics of materials at micro- to nano-scales. Both
experiments and simulations show that sub-micron face-centered-cubic (FCC) crystals exhibit high
yield strength, which is, however, compromised by intermittent, power law distributed strain
fluctuations, typical of ‘wild plasticity’. At macro-scales, the same bulk materials show ‘mild
plasticity’ characterized by bounded, uncorrelated fluctuations. Both anomalous strength and
intermittency appear therefore as size effects. While the former is highly desirable, the latter is
detrimental because stochastic dislocation avalanches interfere with forming processes and endanger
structural stability. In this paper we show that defectiveness, which is used in classical metallurgy to
harden materials, can be used at sub-micron scales to suppress intermittent fluctuations. We quantify
the coexistence of ‘wild’ and ‘mild’ fluctuations in compressed Al alloys micro-pillars, demonstrate
that the statistical nature of fluctuations is determined by sample size, and propose quantitative
strategies allowing one to temper plastic intermittency by artificially tailored disorder. Our
experimental results are rationalized using a theoretical framework which quantifies the competition
between external (size related) and internal (disorder related) length scales.
Key words: Dislocation dynamics; size effects; plastic fluctuations; hardening
*: These authors contributed equally to this work
Correspondence and requests for materials should be addressed to [email protected] (GL)
or [email protected] (JW) or [email protected] (LT) or
[email protected] (JS)
2
1. Introduction
The classical paradigm of dislocation-mediated plasticity in crystalline solids is that of a smooth
flow [1, 2] where strain fluctuations are small and uncorrelated. This vision of mild plasticity was
fundamentally challenged by the discovery that plastic fluctuations may be power law distributed in
size and energy [3-6], with clustering in space [7] and time [8]. The fact that dislocations self-organize
and plasticity proceeds through collective avalanches implies that the flow is wild in the sense of
Mandelbrot [9].
The two apparently conflicting pictures of smooth and rough plasticity have been recently
reconciled as it was shown that, in bulk materials, mild and wild fluctuations can coexist, with a
degree of wildness depending on crystal structure [9]. In hexagonal close-packed (HCP) crystals,
long-ranged elastic interactions dominate, leading to cooperative behavior of dislocations. Instead, in
face-centered cubic (FCC) crystals, short-range interactions, enhanced by the multiplicity of slip
systems, quench plastic avalanches. Plastic flow then proceeds through mainly small and uncorrelated
dislocation motions, confined inside the transient microstructural features (e.g. dislocation cells),
which give rise to Gaussian (mild) fluctuations. Those coexist with rare power-law distributed (wild)
fluctuations associated with brutal rearrangements [9].
In view of the growing interest towards building progressively smaller technological devices,
classical approaches of size-independent material engineering have to be reconsidered [1]. In
particular, metal plasticity has to be reassessed to meet the demands posed by the manufacturing of
components at the micro/nano scales [10] and experiments with ultra-small pillars have become a
standard tool in the study of the corresponding fluctuations and size effects [6, 11-14]. Besides the
initial observation that “smaller is stronger” [11], it has been recently argued that “smaller is wilder”
[9], as, in contrast to Gaussian distributed, small plastic fluctuations in bulk FCC materials [9],
scale-free intermittency has been confirmed at micro and nano scales for the same materials by a
wealth of experiments [6, 12, 14-16] and simulations [10, 17]. The abrupt strain jumps in
quasi-statically loaded micro-/nano-components endanger structural stability and the associated
unpredictability raises serious challenges for plastic-forming processes [17]. It has been realized that
tempering plastic deformation at ultra-small scales requires new approaches going beyond the
3
phenomenological continuum theory [18].
In bulk materials, grain boundaries (GBs) hinder the propagation of dislocation avalanches,
introducing grain-size related upper cut-offs on their size distribution [19]. At micro- and nano-scales,
the level of poly-crystallinity cannot be controlled with the same confidence as in bulk materials [20],
which limits our ability to use GB for mitigating size-induced intermittency. Considering these
limitations, we focus on a different strategy, motivated by recent simulation which showed that
quenched disorder may suppress scale-free behavior in bulk materials [21]. We use the fact that the
pinning strength of solutes and precipitates can be artificially tailored within metals by simple aging
treatments [22]. At sub-micro scales, quenched disorder gives the potential of smoothing plastic flow
[23-26]. However, this effect has not been quantified so far in terms of avalanche statistics.
To explore this strategy, we systematically study the effects of miniaturization on strain
fluctuations in Al-alloys single crystals strengthened by different types of solutes or precipitates in
the conditions when the grain size is not a relevant length scale of the problem. We experimentally
quantify the “smaller is wilder” effect in pure crystals, reporting an evolution from mild plastic
behavior at large pillar diameters 𝐿, to wild plasticity at small 𝐿. We then provide evidence that the
transition between mild to wild regimes shifts towards smaller 𝐿 with the increase of the pinning
strength of quenched disorder. Translating the pinning strength into a characteristic length scale 𝑙,
we show that the competition between external (due to 𝐿) and internal (due to 𝑙) scale effects can
be quantified by a single nondimensional parameter 𝑅 = 𝐿/𝑙 allowing one to collapse the data for
materials with different degree of defectiveness on a single curve. We rationalize this collapse within
a simple theoretical framework that builds an unexpected bridge between wildness and strength. Our
study suggests specific quantitative strategies for controlling intermittency in sub-µm plasticity.
2. Experimental procedures
2.1 Materials
The experiments were performed on four different types of Al crystals: (i) pure Al, (ii)
Al-0.3wt.%Sc alloy with Sc solute clusters (referred to as Al-Sc cluster in Fig. 1a), (iii)
Al-0.3wt.%Sc alloy with fine sphere-like Al3Sc precipitates of size ~ 3-8 nm (referred to as Al-Sc
precipitate in Fig. 1b), and (iv) Al-2.5wt.%Cu-0.1wt.%Sn with coarse plate-like θ′-Al2Cu precipitates
4
of diameter ~ 10-40 nm (referred to as Al-Cu-Sn in Fig. 1c). The pure Al, Al-0.3wt.%Sc alloy, and
Al-2.5wt.%Cu-0.1wt.%Sn alloys were respectively melted and cast in a stream argon, by using 99.99
wt.% pure Al, mast Al-50 wt.% Cu alloy, 99.99 wt.% pure Sn, and mast Al-2.0 wt.% Sc alloy. The
cast Al-Sc ingots were solutionized at 921 K for 3 h and then quenched in cold water. Immediately
after quenching, one part of the Al-Sc ingots was aged at relatively low temperature of 523 K for 8 h
to form Sc clusters. The other part of the Al-Sc ingots was aged at high temperature of 623 K for
duration of 24 h, in order to precipitate Al3Sc particles. The cast Al-Cu-Sn ingots were solutionized
at 823 K for 3 h, followed by a cold water quench and subsequently aged at 473 K for 8 h to
precipitate plate-like θ′-Al2Cu particles. Minor addition of micro-alloying element Sn was used to
catalyze the precipitation of θ′-Al2Cu particles with relatively uniform size and homogeneous
distribution.
2.2 Microstructure characterization
Three-dimensional atom probe tomography (3DAP) analyses were performed using an Imago
Scientific Instruments 3000HR local electrode atom probe (LEAP) to examine the three-dimensional
distribution of Sc atoms in the Al-Sc cluster alloy (Fig. 1a). The 3DAP experiments routine can be
found elsewhere [27]. The reconstruction and quantitative analysis of 3DAP data were performed
using the IVAS 3.4.3 software. The precipitates in aged alloys were quantitatively characterized by
using transmission electron microscope (TEM) and high resolution TEM (HRTEM) (Fig. 1). TEM
foils were prepared following standard electro-polishing techniques for Al alloys. Quantitative
measures of number density and size of the precipitates are reported as average values over more
than 200 measurements. The foil thickness in the beam direction was determined through convergent
beam electron diffraction pattern [28]. Volume fraction of the particles was determined by using
corrected projection method [29]. Details about the microstructural measurements can be found in
our previous publications [2, 22].
5
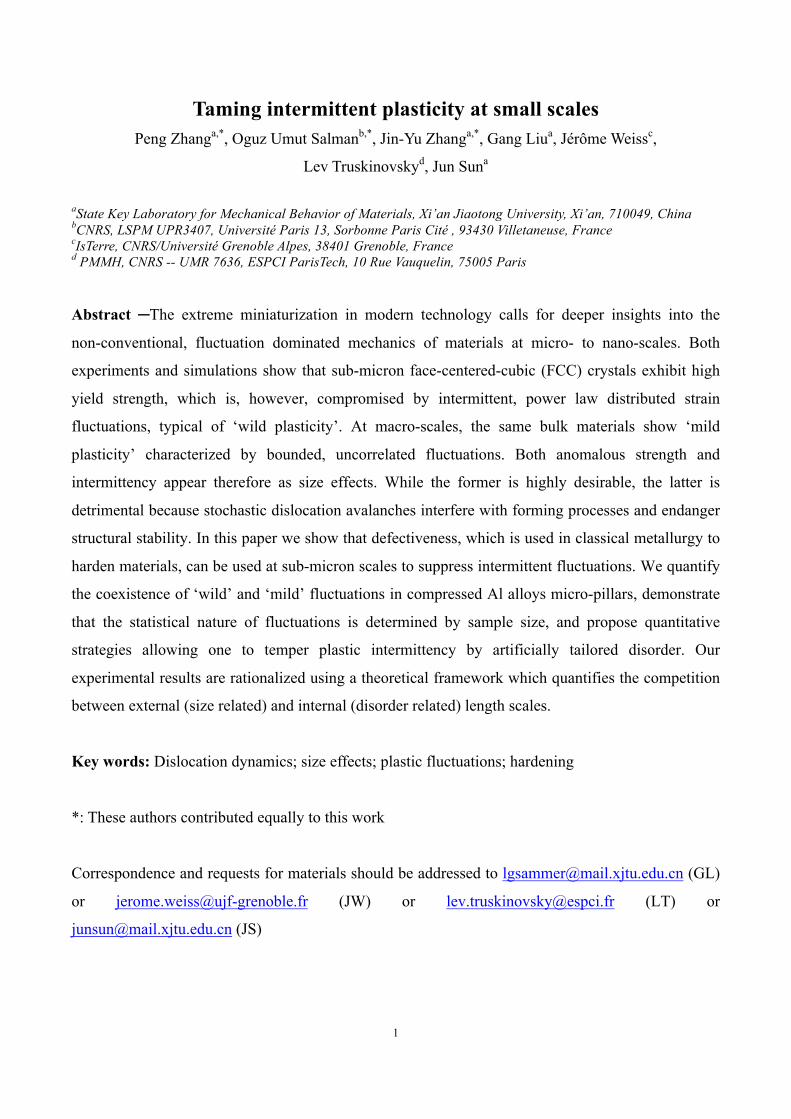
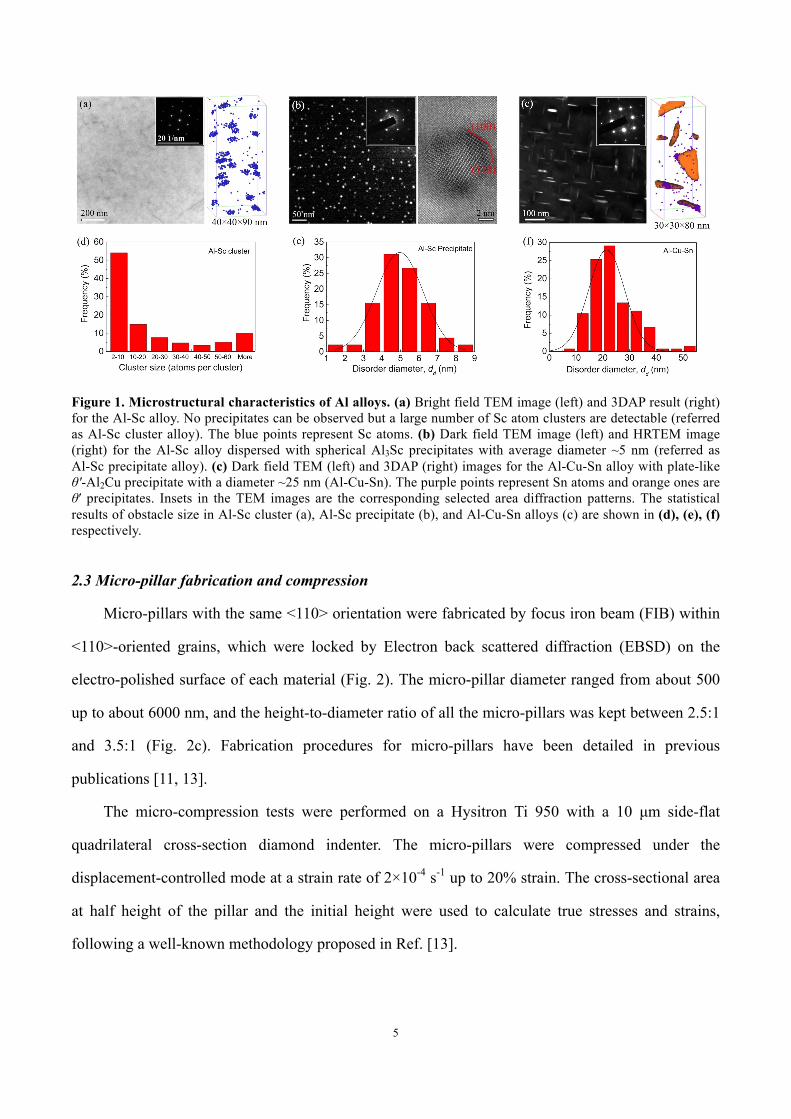
Figure 1. Microstructural characteristics of Al alloys. (a) Bright field TEM image (left) and 3DAP result (right) for the Al-Sc alloy. No precipitates can be observed but a large number of Sc atom clusters are detectable (referred as Al-Sc cluster alloy). The blue points represent Sc atoms. (b) Dark field TEM image (left) and HRTEM image (right) for the Al-Sc alloy dispersed with spherical Al3Sc precipitates with average diameter ~5 nm (referred as Al-Sc precipitate alloy). (c) Dark field TEM (left) and 3DAP (right) images for the Al-Cu-Sn alloy with plate-like θ′-Al2Cu precipitate with a diameter ~25 nm (Al-Cu-Sn). The purple points represent Sn atoms and orange ones are θ′ precipitates. Insets in the TEM images are the corresponding selected area diffraction patterns. The statistical results of obstacle size in Al-Sc cluster (a), Al-Sc precipitate (b), and Al-Cu-Sn alloys (c) are shown in (d), (e), (f) respectively.
2.3 Micro-pillar fabrication and compression
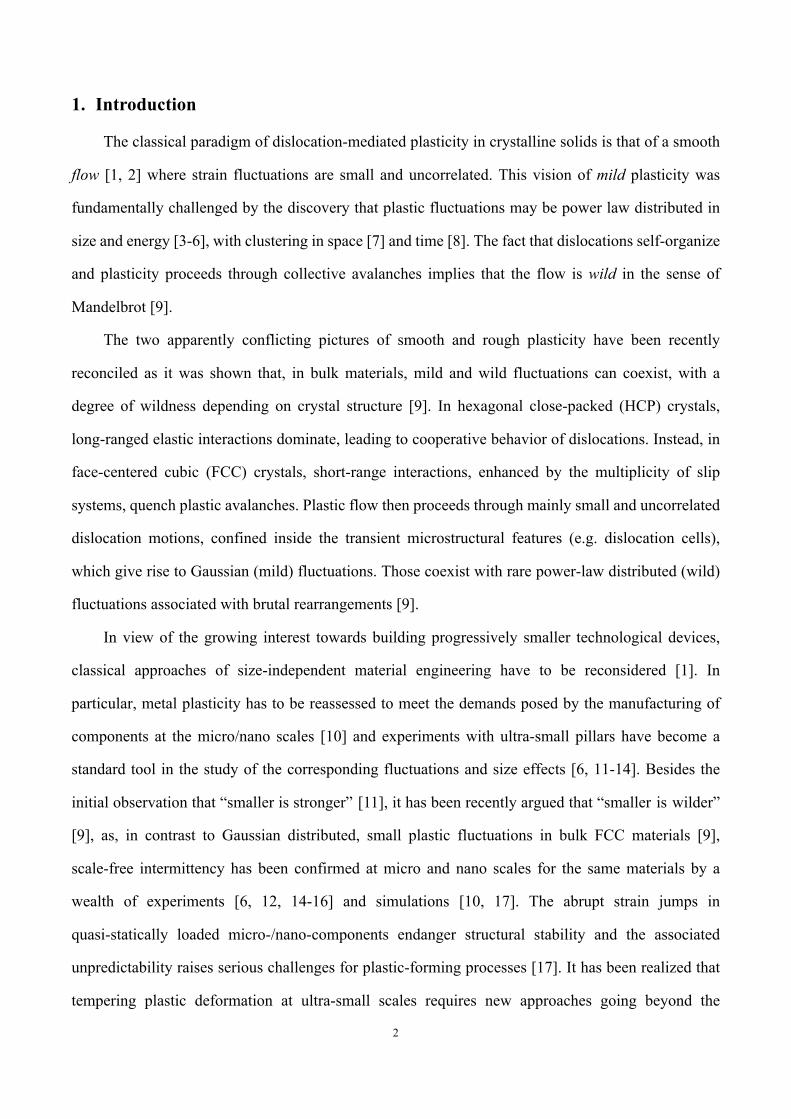
Micro-pillars with the same <110> orientation were fabricated by focus iron beam (FIB) within
<110>-oriented grains, which were locked by Electron back scattered diffraction (EBSD) on the
electro-polished surface of each material (Fig. 2). The micro-pillar diameter ranged from about 500
up to about 6000 nm, and the height-to-diameter ratio of all the micro-pillars was kept between 2.5:1
and 3.5:1 (Fig. 2c). Fabrication procedures for micro-pillars have been detailed in previous
publications [11, 13].
The micro-compression tests were performed on a Hysitron Ti 950 with a 10 µm side-flat
quadrilateral cross-section diamond indenter. The micro-pillars were compressed under the
displacement-controlled mode at a strain rate of 2×10⁻⁴ s-1 up to 20% strain. The cross-sectional area
at half height of the pillar and the initial height were used to calculate true stresses and strains,
following a well-known methodology proposed in Ref. [13].

6
Figure 2. Fabrication methodology of micro-pillar. (a) Representative EBSD orientation map of Al-Cu-Sn alloy, from which the <110>-orientated grain, marked by dash lines along the grain boundaries, is locked to fabricate micro-pillar inside. (b) A series of micropillars are fabricated within the <110>-orientated grain marked in (a). (c) Magnified SEM image to show the morphology of micro-pillar.
3. Characterization of tested materials
3.1 Microstructure of aged Al alloys
Fig. 1a, b and c show representative microstructural images of Al-Sc cluster, Al-Sc precipitate,
and Al-Cu-Sn alloys, respectively. In the Al-Sc cluster alloy, careful examinations found no
perceptible precipitates formed (TEM image of Fig. 1a). According to previous works [30], the aging
temperature should be greater than ~ 623 K in order to precipitate Al3Sc second phase particles. In
the present work, the Al-Sc cluster alloy was aged at a much lower temperature (523 K). However,
abundant Sc solute clusters can be detected from 3DAP analyses, as shown in Fig. 1a. Core-Linkage
(CL) algorithm [27] was used to quantify the size of Sc clusters. The statistical results given in Fig.
1d show that most of the detected Sc clusters contain less than 10 Sc atoms. As the dislocations can
shear through the solute clusters, the interaction between the solute clusters and dislocations is
relatively weak.
In the Al-Sc precipitate alloy that was aged at 623 K for 24 hours, a large number of nano-sized
Al3Sc particles are precipitated and dispersed in the matrix, see the TEM image of Fig. 1b. The
coherent Al3Sc precipitates have an equilibrium shape of Great Rhombicuboctahedron [30], with a
total of 26 facets on the {100}, {110} and {111} planes (refer to the HRTEM image of Fig. 1b).
Considering these precipitates as spherical particles, their diameter distributions were quantitatively
measured. The statistical results are presented in Fig. 1e, with an average diameter of about 5.0 nm.
Previous work on Al3Sc particle strengthening [31] has shown that the transition from dislocation
Figure 2. Fabrication methodology of micro-pillar. (a) Representative EBSD orientation map of Al-Cu-Sn alloy, from which the <110>-orientated grain, marked by dash lines along the grain boundaries, is locked to fabricate micro-pillar inside. (b) A series of micropillars are fabricated within the <110>-orientated grain marked in (a). (c) Magnified SEM image to show the morphology of micro-pillar.
(a) (b) (c)
4 µm 3 mm 200 µm
7
shearing of precipitates to Orowan’s looping occurs for a critical precipitate diameter of about 4.2 nm.
Hence, in the present case, the interactions between dislocations and the Al3Sc precipitates,
dominated by bypassing mechanisms, are strong.
The Al-Cu-Sn alloy was aged at 473 K for 8 h, which led to the precipitation of plate-like
θ′-Al2Cu particles (see the TEM image of Fig. 1c). The micro-alloying element Sn was doped to
refine the distribution of θ′ precipitates by promoting θ′ nucleation [29]. Representative 3DAP results
shown on Fig. 1c illustrate the micro-alloying mechanism: fine Sn particles are firstly formed by Sn
atoms segregation, and then these Sn particles provide preferential nucleation sites for the θ′
precipitates. Due to the Sn micro-alloying effect, the θ′ precipitates in the Al-Cu-Sn alloy have much
reduced sizes compared with those in the Al-Cu counterpart [32]. In addition, the Sn-promoted θ′
precipitates also have a narrower distribution in size. This optimization of the size of precipitates
improves the repeatability of micro-pillar testing, and therefore is suitable for investigating the
precipitate-dislocation interactions at small length scales. The statistical results in Fig. 1f show an
average diameter of ~25 nm for the θ′ precipitates. Since the θ′ precipitates are intrinsically
shear-resistant [29, 32], the θ′ precipitates exhibit a typical bypassing strengthening mechanism with
a strong precipitate-dislocation interaction.
The measured parameters of the precipitates/solute clusters, including sizes, density, volume
fraction, have been summarized in Table 1.
3.2 Evaluation of obstacle resistance to dislocation motion
We will show that obstacle resistance to dislocations motion, which arises from disorders
(solution atoms, clusters and precipitates), forest dislocations, and lattice friction for the studied
materials, is an important controlling parameter in the following analysis. This pinning strength to
dislocation motion can be evaluated from experimental measurements of the yield strength at 0.2%
offset under tension in bulk polycrystalline samples. We used bulk sample testing rather than
micro-pillar testing to determine pinning strengths in order to eliminate the inevitable external size
effect on strength that exists in case of micro-pillars. The bulk samples were cut from as-cast ingots
that were exposed only to heat treatments and underwent no warm/cold deformation. This resulted in:
(a) nearly equiaxial grains, free of texture, ensuring a relatively homogeneous and isotropic
8
deformation, and (b) a large average grain size (𝐿&~ 1 mm, Fig. 2a), leading to a small grain
boundary strengthening. For coarse-grained materials, we can evaluate the pinning strength (𝜏()*) as
follows:
𝜏()* ≈ 𝜎- 𝑀 − 𝑘𝐿&12 3 (1)
where 𝜎- is the bulk yield strength derived from the stress-strain curves under uniaxial tension
(right half of Fig. 3a), 𝑀 the Taylor factor (3.06 for FCC metals [33]), and 𝑘 the Hall-Petch
constant for Al alloy (60 MPa µm1/2 [34]). The evaluated values are listed in Table 1. Note that these
values are effective strengths, including the contributions from disorder strengthening, forest
dislocation strengthening, and lattice friction.
To support these experimental estimates, we also calculated the pinning strength based on
dislocation strengthening theory and microstructural statistics. The lattice friction stress 𝜏4 is ~1.4
MPa [35]; the forest dislocation strengthening 𝜏5~𝛼𝐺𝑏 𝜌; is around 3.45MPa (taking an initial
forest dislocation density of ~1012 m-2 for the well annealed crystals), where 𝐺 is the shear modulus
of Al (24.7 GPa [32]), 𝑏 the Burgers vector (0.286 nm) and 𝛼 ≈ 0.5. Thus, the pinning strength in
pure Al is ~ 4.85 MPa. For Al alloys, the main contribution comes from disorders. In case of
non-shearable precipitates, the pinning strength is [22, 29]:
𝜏( =@A
3B 21C2Dln BGH
IA (for sphere-like precipitates) (2a)
𝜏( =@A
3B 21C2Dln J.KL2 GHMH
A (for plate-like precipitates) (2b)
, where υ is the Poisson’s ratio (0.33 [32]), and 𝜆 the interparticle spacing. The value of 𝜆 can
be obtained by using the experimentally measured precipitate parameters in Table. 1 [29]:
𝜆 = 2.JQRSTGH
− BGHI
(for sphere-like precipitates) (3a)
𝜆 = 2.3UUKSTGH
− BGHL− 1.061𝑡G (for plate-like precipitates) (3b)
where 𝑁Z is the number density, 𝑑G is the precipitates’ diameter, and 𝑡G the thickness of plate-like
precipitates. Note that, for all alloys, the average interparticle spacing is significantly smaller than the
micro-pillar diameters (from 500 nm to 3500 nm) (Table 1). This ensures that atom clusters and
precipitates dispersed within the micro-pillars can effectively pin the dislocations. The microscopic

9
estimates of pinning strength 𝜏()* = 𝜏(+𝜏4+𝜏5 for Al-Sc precipitate (38.05 MPa) and Al-Cu-Sn
(70.25 MPa) are in excellent agreement with the estimates based on experimental measurements
mentioned above.
Table 1∣Statistical results on microstructure features and evaluation of internal scale.
4. Statistics of intermittent plasticity
4.1 Deformation behaviors of micro-pillars
The ordering of obstacle pinning strengths (pure Al (~ 4.5 MPa) < Al-Sc cluster (~ 28 MPa) <
Al-Sc precipitate (~38 MPa) < Al-Cu-Sn(~ 70 MPa) dictates the hierarchy of flow stresses for both
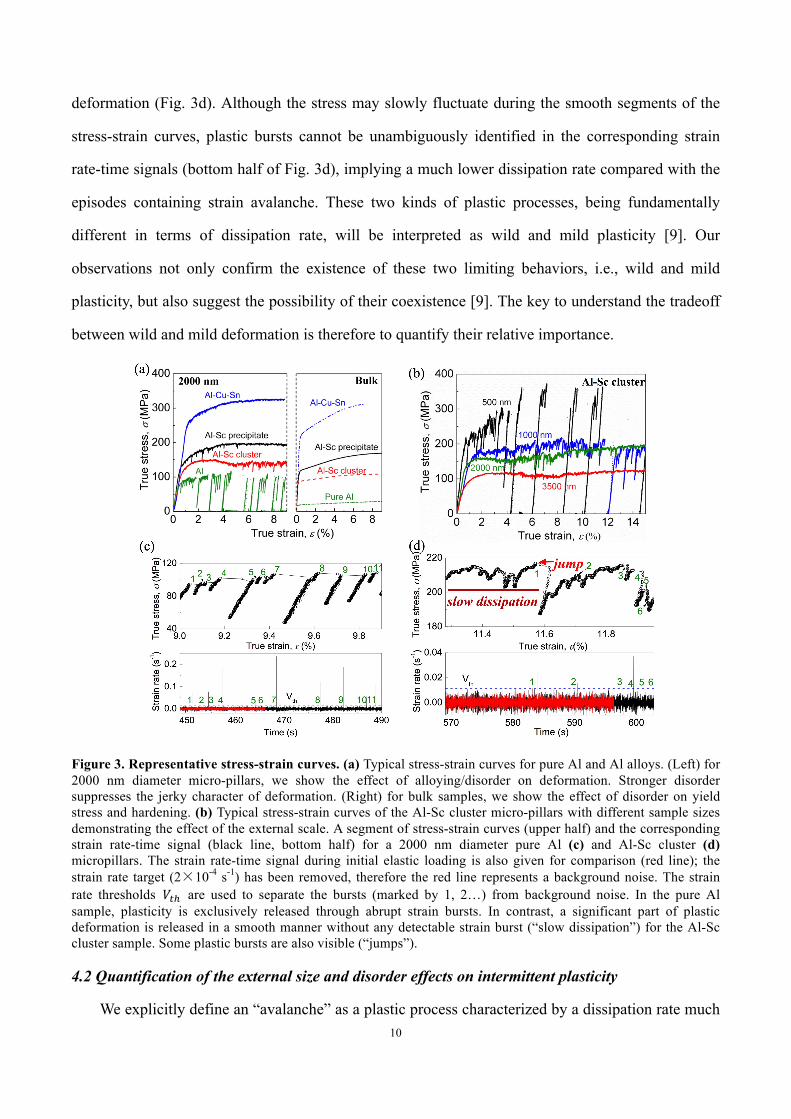
bulk materials and micro-pillars (Fig. 3a). The stress-strain curves for pure Al micro-pillars, showing
almost no bulk-like strain hardening, appear jerky over the pillar diameter range analyzed in our
experiments. A representative deformation curve for pure Al micro-pillar with 2000 nm diameter is
presented in Fig. 3a, illustrating the frequent occurrence of strain bursts. In contrast, Al-Cu-Sn
crystals deform (flow) smoothly and strain-harden within the same diameter range, as shown on Fig.
3a. The behavior of Al-Sc cluster and Al-Sc precipitate micro-pillars lay in between these two
end-member scenarios, with a jerkiness clearly decreasing with increasing pillar diameter (typically
shown in Fig. 3b).
Moving beyond the “jerky” or “smooth” terminologies generally used in the literature to
describe these stress-strain curves, we propose below an objective quantification of the difference
between these two behaviors. While clearly different from the highly discontinuous deformation
where plasticity reveals itself through abrupt strain bursts (Fig. 3c), smoother deformation curves
also reveal some strain bursts scattered among extended segments of seemingly continuous
Table 1∣Statistical results on microstructure features and evaluation of internal scale.
Materials Disorder
Diameter dd
(nm)
Disorder Thickness td
(nm)
Number density NX
(1022 m-3)
Volume fraction
%
Disorder spacing λ
(nm)
Shearing or bypassing
Pinning strength (MPa)
internal scale l
(nm)
Pure Al - - - - -- -- 4.5(0.7) 1536.9
Al-Sc cluster 1.81(0.04)+ - 131.00(5.01) 0.41(0.04) 20.6(0.6) Shearing 27.6(2.2) 250.6(18.5)
Al-Sc precipitate 5.08(0.24) - 1.86(0.11) 0.13(0.03) 107.0(6.0) Bypassing 38.3(1.3) 180.6(5.9)
Al-Cu-Sn 24.51(3.02) 2.31(0.21) 0.99(0.05) 1.21(0.42) 66.4(6.1) Bypassing 70.5(3.5) 98.1(4.6)
+: Individual cluster diameters were calculated as the Guinier’s diameter ( ), where is the diameter of gyration27. The values in the bracket stand for the measurement error of TEM examination (microstructural parameter) and bulk tension tests (pinning strength).
Table(s)
10
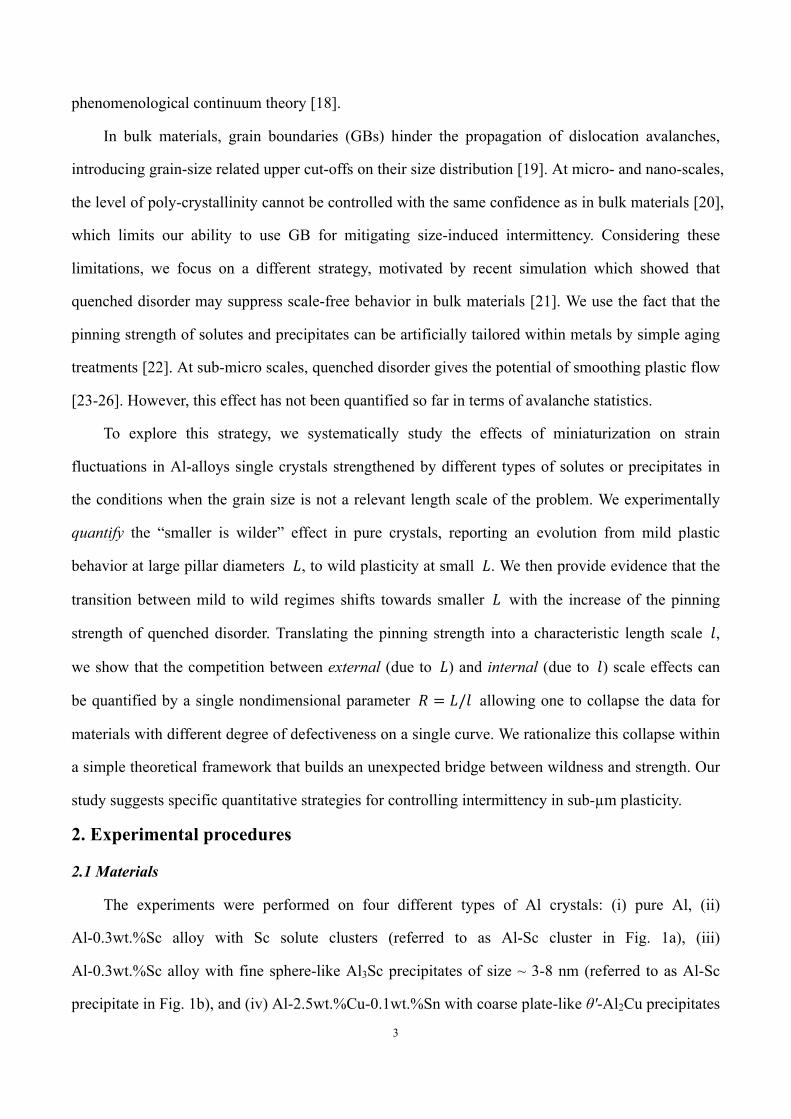
deformation (Fig. 3d). Although the stress may slowly fluctuate during the smooth segments of the
stress-strain curves, plastic bursts cannot be unambiguously identified in the corresponding strain
rate-time signals (bottom half of Fig. 3d), implying a much lower dissipation rate compared with the
episodes containing strain avalanche. These two kinds of plastic processes, being fundamentally
different in terms of dissipation rate, will be interpreted as wild and mild plasticity [9]. Our
observations not only confirm the existence of these two limiting behaviors, i.e., wild and mild
plasticity, but also suggest the possibility of their coexistence [9]. The key to understand the tradeoff
between wild and mild deformation is therefore to quantify their relative importance.
Figure 3. Representative stress-strain curves. (a) Typical stress-strain curves for pure Al and Al alloys. (Left) for 2000 nm diameter micro-pillars, we show the effect of alloying/disorder on deformation. Stronger disorder suppresses the jerky character of deformation. (Right) for bulk samples, we show the effect of disorder on yield stress and hardening. (b) Typical stress-strain curves of the Al-Sc cluster micro-pillars with different sample sizes demonstrating the effect of the external scale. A segment of stress-strain curves (upper half) and the corresponding strain rate-time signal (black line, bottom half) for a 2000 nm diameter pure Al (c) and Al-Sc cluster (d) micropillars. The strain rate-time signal during initial elastic loading is also given for comparison (red line); the strain rate target (2×10⁻⁴ s-1) has been removed, therefore the red line represents a background noise. The strain rate thresholds 𝑉M^ are used to separate the bursts (marked by 1, 2…) from background noise. In the pure Al sample, plasticity is exclusively released through abrupt strain bursts. In contrast, a significant part of plastic deformation is released in a smooth manner without any detectable strain burst (“slow dissipation”) for the Al-Sc cluster sample. Some plastic bursts are also visible (“jumps”). 4.2 Quantification of the external size and disorder effects on intermittent plasticity
We explicitly define an “avalanche” as a plastic process characterized by a dissipation rate much
11
greater than the imposed loading rate. Based on this definition and in view of the control mode
provided by the loading device [36] (Hysitron Ti 950, see details in Supplement Materials (SM)), a
dislocation avalanche manifests itself by both (i) a displacement/strain burst away from the
strain-rate target (Fig. S1a, b and Fig. S2a in SM) and (ii) an abrupt stress drop (Fig. S1a, c and Fig.
S2c in SM). These two different manifestations can be separately used to distinguish wild from mild
fluctuations through an objective methodology detailed in SM. The cumulative effect of extracted
wild fluctuations, normalized by the total imposed deformation, will be used as the wildness
parameter 𝑊. The results obtained via displacement-rate signals (Fig. S2a and b) and force-rate
signals (Fig. S2c and d) are in close agreement (compare Fig. 4 with Fig. S3 in SM), arguing for the
robustness of our methodology. We focus on the role of external size and defectiveness on plastic
fluctuations, comparing samples of different size and/or different materials, and all the results
presented below (wildness 𝑊, distributions of strain bursts,..) correspond to signals integrated over
the entire stress-strain curves. Some characteristics, such as the forest dislocation density, may be
expected to evolve with deformation, whereas a possible evolution of the distribution of strain
avalanches with increasing strain has been discussed recently in Refs. [4, 6, 37]. We do not address
these points here, which are left for future work.
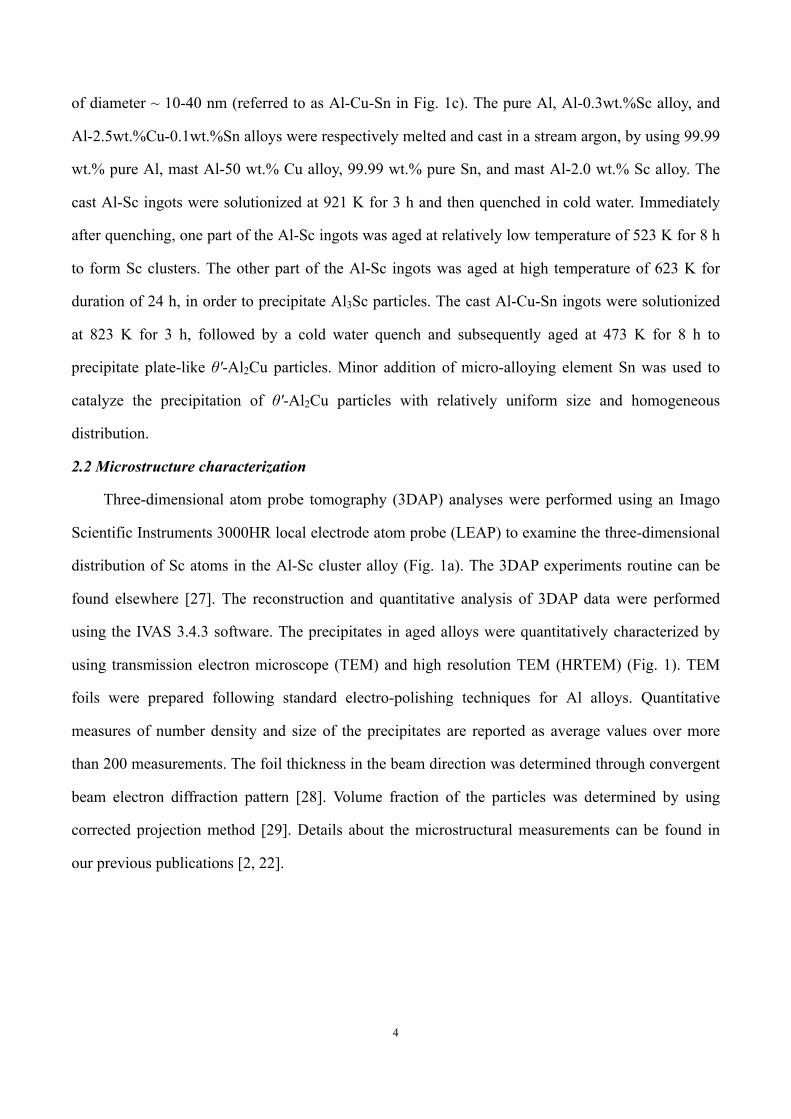
Fig. 4a summarizes two main results of our work. First, we experimentally quantify the “smaller
is wilder” phenomenon, which we interpret as an external size effect. Second, we show that the
crossover range between wild (large 𝑊) and mild (small 𝑊) plasticity can be shifted (or even
suppressed down to sub-µm scales, see Al-Cu-Sn) by introducing high pinning-strength disorder.
Such “dirtier is milder” phenomenon reveals the presence of a disorder-related characteristic scale
and shows that the corresponding internal size effect competes with the more conventional external
size effect. Recall that in bulk materials, a stronger degree of wildness correlates with a smaller value
of a non-universal exponent 𝜅 in the power law distribution of strain bursts 𝑃 𝑠 ~𝑠1c [9]. The
maximum likelihood analysis [38] of plastic avalanches in micro-pillars confirms this trend down to
sub-µm scales (Fig. 5) and reveals a universal (material independent) relation between 𝑊 and 𝜅
(Fig. 4b). This crossover behavior illustrates the gradual transition between Gaussian (mild) and
power-law (wild) fluctuation regimes, and provides a unifying perspective on micro-plasticity. The

12
limiting behaviors are observed in Al-Cu-Sn alloy, where the distribution of the (few) detected strain
bursts is almost Gaussian, and in pure Al (≤3500 nm), showing almost purely power-law distributed
bursts with exponent 𝜅 approaching (for the smallest sizes) the previously reported value [6, 17, 39,
40] close to the one predicted by the mean field theory, 𝜅=1.5 [3].
Note that this transition from power-law to Gaussian distributions should not be confused with
an upper cut-off of a power law scaling. Indeed, we could expect a “trivial” finite-size effect to
impact our displacement burst distributions from the upper side [4, 17]. However, in this case, this
cut-off should be more pronounced upon decreasing the sample size, in opposition with what is
shown on Fig. 5. In addition, comparing the likelihoods between power-law and power-law with
upper cut-off distributions (𝑃 𝑠 ~𝑠1c and 𝑃 𝑠 ~𝑠1c𝑒𝑥 𝑝 − hhijk
, where 𝑠lmn is the upper
cut-off amplitude) by the likelihood ratio test [38], possible upper cut-offs were hardly detectable.
This is likely due to the limited statistics of our datasets, but also reinforces the reliability of our
estimation of the exponent 𝜅.
Figure 4. The dependence of the fraction of plasticity released by wild fluctuations, 𝑾, on the nature of the disorder, micro-pillar diameter (a) and power law exponent 𝜿 − 𝟏 = 𝑪/𝑫 (b). (a) Fraction of plasticity released by wild fluctuations, 𝑊, as a function of sample diameter (𝐿) for the pure Al and Al alloys micro-pillars. “Smaller is wilder” and “dirtier is milder” phenomena can be clearly observed. The plotted 𝑊 𝐿 solid lines are calculated from our model, using quantitative estimates for the parameters 𝐶 and 𝐷 (see section 6.2.2). Error bars are derived from measurements on multiple samples. (b) Universal (material independent) relationship between 𝑊 and the power law exponent 𝜅 − 1 = 𝐶/𝐷 (see text for details). Error bars represent the uncertainty of power law exponents fitted by the maximum likelihood analysis [38].
1000 100000.0
0.2
0.4
0.6
0.8
1.0 Pure Al Al-Sc cluster Al-Sc precipitate Al-Cu-Sn
Frac
tion
of p
last
icity
rele
ased
by
wild
fluc
tuat
ions
, W
Diameter, L (nm) 0.1 1 10
0.0
0.2
0.4
0.6
0.8
1.0
Fr
actio
n of
pla
stic
ity re
leas
ed b
y w
ild fl
uctu
atio
ns, W
Pure Al Al-Sc cluster Al-Sc precipitate K=0.13 K=0.25 K=0.37
κ-1, or C/D Figure 4. The dependence of the fraction of plasticity released by wild fluctuations, !, on the nature of the disorder, micro-pillar diameter (a) and power law exponent " − $ = &/( (b). (a) Fraction of plasticity released by wild fluctuations, ), as a function of sample diameter (*) for the pure Al and Al alloys micro-pillars. “Smaller is wilder” and “dirtier is milder” phenomena can be clearly observed. The plotted ) * solid lines are calculated from our model, using quantitative estimates for the parameters + and , (see section 6.2.2). Error bars are derived from measurements on multiple samples. (b) Universal (material independent) relationship between ) and the power law exponent - − 1 = +/, (see text for details). Error bars represent the uncertainty of power law exponents fitted by the maximum likelihood analysis [38].
(a) (b)
13
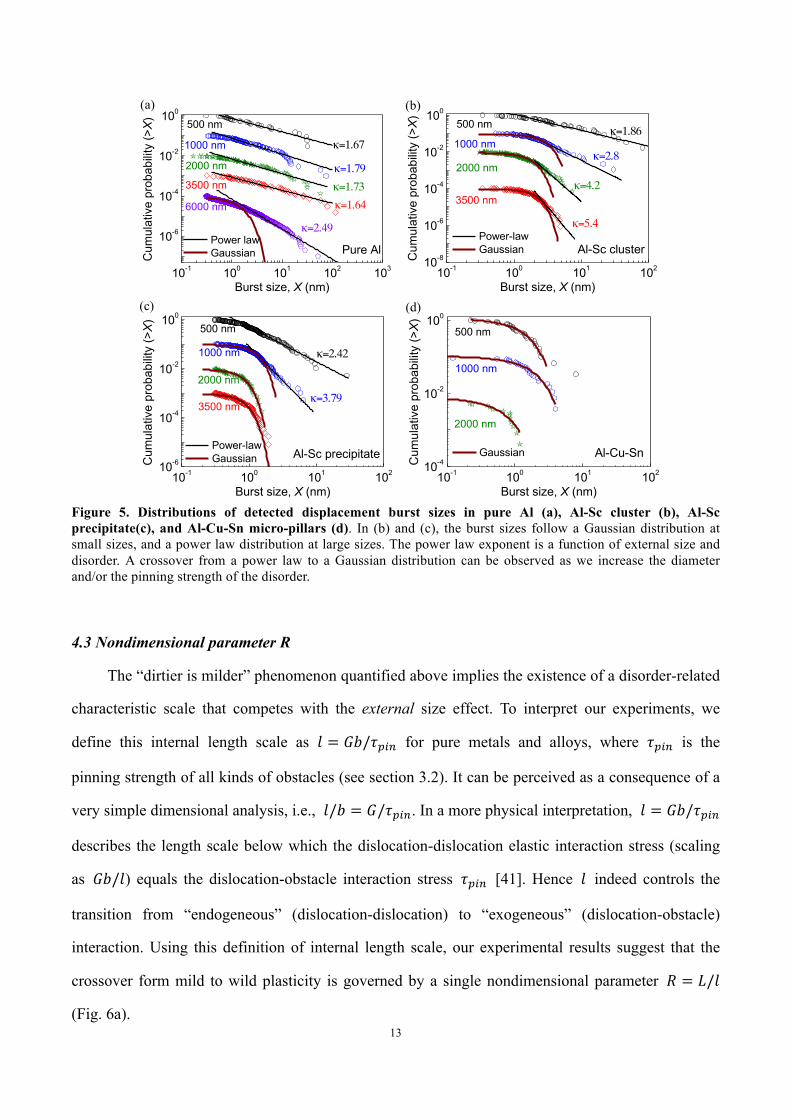
Figure 5. Distributions of detected displacement burst sizes in pure Al (a), Al-Sc cluster (b), Al-Sc precipitate(c), and Al-Cu-Sn micro-pillars (d). In (b) and (c), the burst sizes follow a Gaussian distribution at small sizes, and a power law distribution at large sizes. The power law exponent is a function of external size and disorder. A crossover from a power law to a Gaussian distribution can be observed as we increase the diameter and/or the pinning strength of the disorder.
4.3 Nondimensional parameter R
The “dirtier is milder” phenomenon quantified above implies the existence of a disorder-related
characteristic scale that competes with the external size effect. To interpret our experiments, we
define this internal length scale as 𝑙 = 𝐺𝑏/𝜏()* for pure metals and alloys, where 𝜏()* is the
pinning strength of all kinds of obstacles (see section 3.2). It can be perceived as a consequence of a
very simple dimensional analysis, i.e., 𝑙/𝑏 = 𝐺/𝜏()*. In a more physical interpretation, 𝑙 = 𝐺𝑏/𝜏()*
describes the length scale below which the dislocation-dislocation elastic interaction stress (scaling
as 𝐺𝑏/𝑙) equals the dislocation-obstacle interaction stress 𝜏()* [41]. Hence 𝑙 indeed controls the
transition from “endogeneous” (dislocation-dislocation) to “exogeneous” (dislocation-obstacle)
interaction. Using this definition of internal length scale, our experimental results suggest that the
crossover form mild to wild plasticity is governed by a single nondimensional parameter 𝑅 = 𝐿/𝑙
(Fig. 6a).
10-1 100 101 102 103
10-6
10-4
10-2
100
κ=2.49
6000 nm
Power law Gaussian
3500 nm
κ=1.64
2000 nm
1000 nm
κ=1.73
κ=1.79
κ=1.67C
umul
ativ
e pr
obab
ility
(>X
)
Burst size, X (nm)
500 nm
Pure Al
10-1 100 101 10210-8
10-6
10-4
10-2
100
3500 nm
2000 nm
1000 nm
Power-law Gaussian
κ=5.4
κ=4.2
κ=2.8
κ=1.86
Cum
ulat
ive
prob
abilit
y (>X
)
Burst size, X (nm)
500 nm
Al-Sc cluster
10-1 100 101 10210-6
10-4
10-2
100
κ=2.42
κ=3.79
Power-law GaussianC
umul
ativ
e pr
obab
ility
(>X
)
Burst size, X (nm)
500 nm
1000 nm
2000 nm
3500 nm
Al-Sc precipitate
10-1 100 101 10210-4
10-2
100
Gaussian
Cum
ulat
ive
prob
abilit
y (>X
)
Burst size, X (nm)
500 nm
1000 nm
2000 nm
Al-Cu-Sn
Figure 5.�Distributions of detected displacement burst sizes in pure Al (a), Al-Sc cluster (b), Al-Sc precipitate(c), and Al-Cu-Sn micro-pillars (d). In (b) and (c), the burst sizes follow a Gaussian distribution at small sizes, and a power law distribution at large sizes. The power law exponent is a function of external size and disorder. A crossover from a power law to a Gaussian distribution can be observed as we increase the diameter and/or the pinning strength of the disorder.
(a) (b)
(c) (d)
14
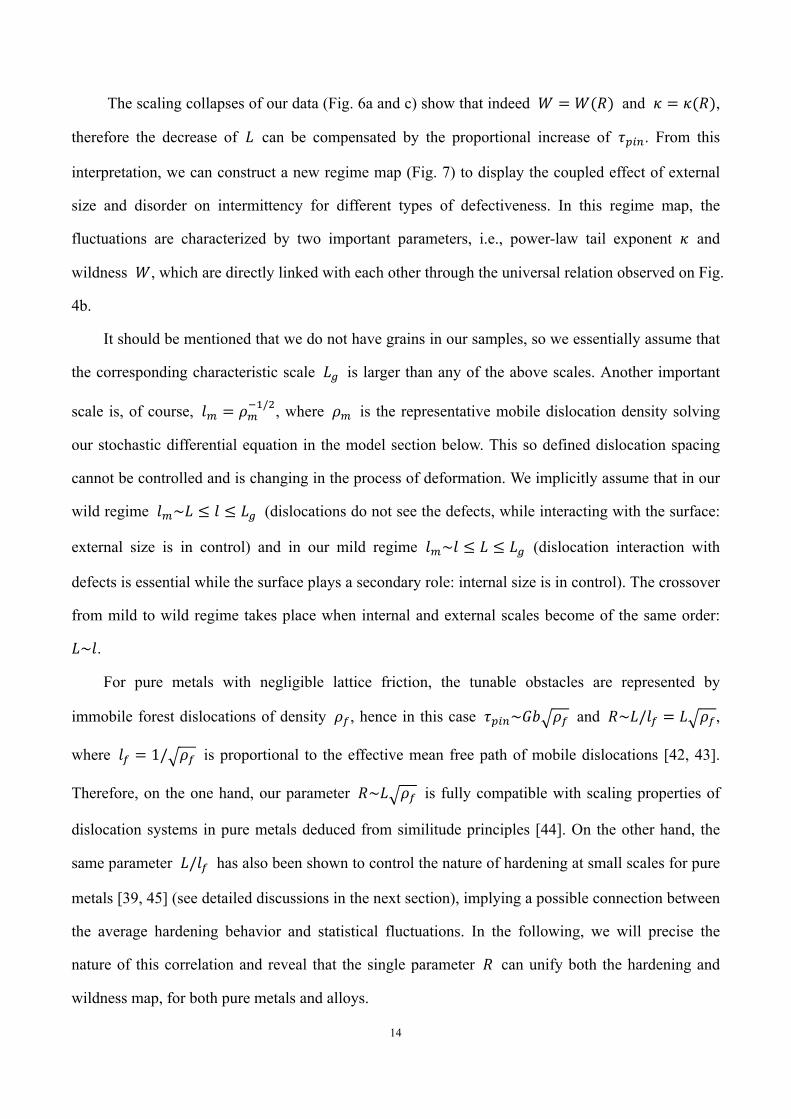
The scaling collapses of our data (Fig. 6a and c) show that indeed 𝑊 = 𝑊(𝑅) and 𝜅 = 𝜅(𝑅),
therefore the decrease of 𝐿 can be compensated by the proportional increase of 𝜏()*. From this
interpretation, we can construct a new regime map (Fig. 7) to display the coupled effect of external
size and disorder on intermittency for different types of defectiveness. In this regime map, the
fluctuations are characterized by two important parameters, i.e., power-law tail exponent 𝜅 and
wildness 𝑊, which are directly linked with each other through the universal relation observed on Fig.
4b.
It should be mentioned that we do not have grains in our samples, so we essentially assume that
the corresponding characteristic scale 𝐿& is larger than any of the above scales. Another important
scale is, of course, 𝑙l = 𝜌l12/3, where 𝜌l is the representative mobile dislocation density solving
our stochastic differential equation in the model section below. This so defined dislocation spacing
cannot be controlled and is changing in the process of deformation. We implicitly assume that in our
wild regime 𝑙l~𝐿 ≤ 𝑙 ≤ 𝐿& (dislocations do not see the defects, while interacting with the surface:
external size is in control) and in our mild regime 𝑙l~𝑙 ≤ 𝐿 ≤ 𝐿& (dislocation interaction with
defects is essential while the surface plays a secondary role: internal size is in control). The crossover
from mild to wild regime takes place when internal and external scales become of the same order:
𝐿~𝑙.
For pure metals with negligible lattice friction, the tunable obstacles are represented by
immobile forest dislocations of density 𝜌;, hence in this case 𝜏()*~𝐺𝑏 𝜌; and 𝑅~𝐿/𝑙; = 𝐿 𝜌;,
where 𝑙; = 1/ 𝜌; is proportional to the effective mean free path of mobile dislocations [42, 43].
Therefore, on the one hand, our parameter 𝑅~𝐿 𝜌; is fully compatible with scaling properties of
dislocation systems in pure metals deduced from similitude principles [44]. On the other hand, the
same parameter 𝐿/𝑙; has also been shown to control the nature of hardening at small scales for pure
metals [39, 45] (see detailed discussions in the next section), implying a possible connection between
the average hardening behavior and statistical fluctuations. In the following, we will precise the
nature of this correlation and reveal that the single parameter 𝑅 can unify both the hardening and
wildness map, for both pure metals and alloys.
15
Figure 6. The fraction of plasticity released by wild fluctuations, 𝑾, the normalized strain hardening rate by the bulk counterpart, 𝜣𝒑𝒊𝒍𝒍𝒂𝒓/𝜣𝒃𝒖𝒍𝒌 , and the power law exponent, 𝜿 − 𝟏 = 𝑪/𝑫 , as a function of dimensionless ratio, 𝑹. (a) All data of Fig. 4a collapse into a master curve. The solid curves in (a) are calculated from the model, using values of parameter 𝐾 = 0.25. (b) The hardening transition occurs around 𝑅 ≈ 5, regardless of special materials and in excellent agreement with the wild-to-mild transition in (a). (c) A linear relationship between 𝑅 and 𝜅 − 1 or 𝐶/𝐷 is observed.
Figure 7. Tuning map showing the 𝑾 and 𝜿 contours as a function of external size 𝑳/𝒃 and pinning strength 𝝉𝒑𝒊𝒏/𝑮. Corresponding to the pinning strength, a defectiveness spectrum is developed by unifying the unshearable particles (UP, like the Al2Cu and Al3Sc precipitates in present work), shearable particles (SP, like fine and coherent Al3Sc precipitates), forest dislocations (FD, like in the present pure Al), and solute clusters (SC, like the Sc solute cluster in present work; 𝑁Z is the cluster number density). The numbers inside the brackets represent 𝑊 and 𝜅 respectively. The color bar below illustrate the range of 𝑊 and 𝜅 at 𝐿/𝑏 = 2×10I.
0.1 1 100.0
0.2
0.4
0.6
0.8
1.0
Pure Al Al-Sc cluster Al-Sc precipitate Al-Cu-Sn
Mild
Dimensionless ratio, R=L/l
Frac
tion
of p
last
icity
rele
ased
by
wild
fluc
tuat
ions
, W
Wild
0.1 1 10Value of C/D
0.1 1 10
0
10
20
30
40
Dimensionless ratio, R=L/l
Forest hardening
Source-exhaustion hardening
Nor
mal
ized
stra
in h
arde
ning
ra
te, Q
pilla
r/Qbu
lk
Pure Al Al-Sc cluster Al-Sc precipitate Al-Cu-Sn
0 2 4 6 8 10
0
1
2
3
4
5 Pure Al Al-Sc cluster Al-Sc precipitate
k-1,
or C
/D
Dimensionless ratio, R=L/l Figure 6.�The fraction of plasticity released by wild fluctuations, !, the normalized strain hardening rate by the bulk counterpart, "#$%%&'/")*%+, and the power law exponent, , − . = 0/1, as a function of dimensionless ratio, 2. (a) All data of Fig. 4a collapse into a master curve. The solid curves in (a) are calculated from the model, using values of parameter 3 = 0.25. (b) The hardening transition occurs around 4 ≈ 5, regardless of special materials and in excellent agreement with the wild-to-mild transition in (a). (c) A linear relationship between 4 and 6 − 1 or 8/9 is observed.
(a) (b)
(c)
0.1 1 10
0.0
0.2
0.4
0.6
0.8
1.0
Pure Al Al-Sc cluster Al-Sc precipitate Al-Cu-Sn
Mild
Dimensionless ratio, R=L/l
Frac
tion
of p
last
icity
rele
ased
by
wild
fluc
tuat
ions
, W
Wild
0.1 1 10Value of C/D
0.1 1 10
0
10
20
30
40
Dimensionless ratio, R=L/l
Forest hardening
Source-exhaustion hardening
Nor
mal
ized
stra
in h
arde
ning
ra
te, Q
pilla
r/Qbu
lk
Pure Al Al-Sc cluster Al-Sc precipitate Al-Cu-Sn
0 2 4 6 8 100
1
2
3
4
5 Pure Al Al-Sc cluster Al-Sc precipitate
k-1,
or C
/D
Dimensionless ratio, R=L/l
Figure 6.�The fraction of plasticity released by wild fluctuations, !, the normalized strain hardening rate by the bulk counterpart, "#$%%&'/")*%+, and the power law exponent, , − . = 0/1, as a function of dimensionless ratio, 2. (a) All data of Fig. 4a collapse into a master curve. The solid curves in (a) are calculated from the model, using values of parameter 3 = 0.25. (b) The hardening transition occurs around 4 ≈ 5, regardless of special materials and in excellent agreement with the wild-to-mild transition in (a). (c) A linear relationship between 4 and 6 − 1 or 8/9 is observed.
(a)
(b)
(c)
16
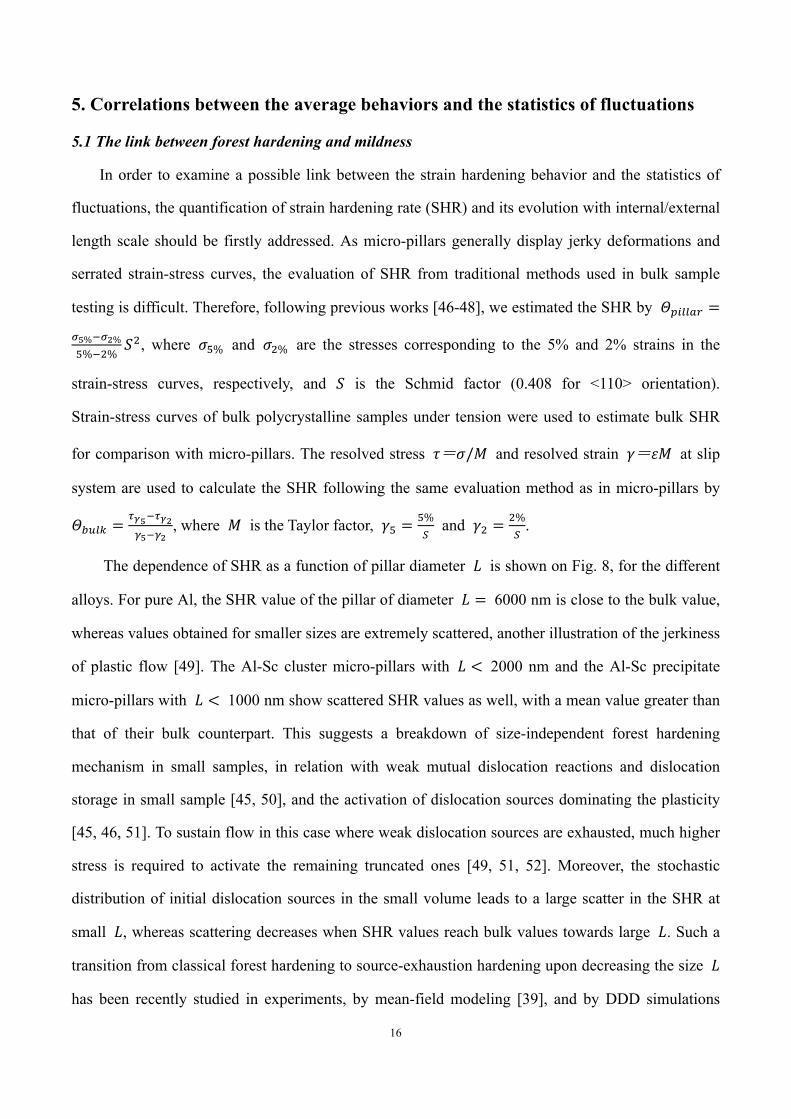
5. Correlations between the average behaviors and the statistics of fluctuations
5.1 The link between forest hardening and mildness
In order to examine a possible link between the strain hardening behavior and the statistics of
fluctuations, the quantification of strain hardening rate (SHR) and its evolution with internal/external
length scale should be firstly addressed. As micro-pillars generally display jerky deformations and
serrated strain-stress curves, the evaluation of SHR from traditional methods used in bulk sample
testing is difficult. Therefore, following previous works [46-48], we estimated the SHR by 𝛩()44m� =
��%1��%R%13%
𝑆3, where 𝜎R% and 𝜎3% are the stresses corresponding to the 5% and 2% strains in the
strain-stress curves, respectively, and 𝑆 is the Schmid factor (0.408 for <110> orientation).
Strain-stress curves of bulk polycrystalline samples under tension were used to estimate bulk SHR
for comparison with micro-pillars. The resolved stress 𝜏=𝜎/𝑀 and resolved strain 𝛾=𝜀𝑀 at slip
system are used to calculate the SHR following the same evaluation method as in micro-pillars by
𝛩A�4� =���1�����1��
, where 𝑀 is the Taylor factor, 𝛾R =R%�
and 𝛾3 =3%�
.
The dependence of SHR as a function of pillar diameter 𝐿 is shown on Fig. 8, for the different
alloys. For pure Al, the SHR value of the pillar of diameter 𝐿 = 6000 nm is close to the bulk value,
whereas values obtained for smaller sizes are extremely scattered, another illustration of the jerkiness
of plastic flow [49]. The Al-Sc cluster micro-pillars with 𝐿 < 2000 nm and the Al-Sc precipitate
micro-pillars with 𝐿 < 1000 nm show scattered SHR values as well, with a mean value greater than
that of their bulk counterpart. This suggests a breakdown of size-independent forest hardening
mechanism in small samples, in relation with weak mutual dislocation reactions and dislocation
storage in small sample [45, 50], and the activation of dislocation sources dominating the plasticity
[45, 46, 51]. To sustain flow in this case where weak dislocation sources are exhausted, much higher
stress is required to activate the remaining truncated ones [49, 51, 52]. Moreover, the stochastic
distribution of initial dislocation sources in the small volume leads to a large scatter in the SHR at
small 𝐿, whereas scattering decreases when SHR values reach bulk values towards large 𝐿. Such a
transition from classical forest hardening to source-exhaustion hardening upon decreasing the size 𝐿
has been recently studied in experiments, by mean-field modeling [39], and by DDD simulations
17
[45]. Our results shown on Fig. 8 are fully consistent with these studies.
However, beyond the effect of external size 𝐿 on the hardening mechanisms, we show here that
strong disorder can also shift this transition towards smaller 𝐿, as it does for the wild-to-mild
transition (see Fig. 4a). Indeed, we show in Fig. 8 that the hardening transition scale, larger than
3500 nm for pure Al, decreases from about 2000 nm for Al-Sc cluster micro-pillars to about 1000 nm
for the Al-Sc precipitate samples, and less than 500 nm for Al-Cu-Sn. The hierarchy observed for the
mildness transition is recovered and, although a precise estimation of the hardening transition scale is
difficult from these results, the values given above are in good agreement with the length scales at
which most of the wild fluctuations are suppressed (see Fig. 4a). In other words, a material starts to
strain-harden when it becomes mild. This correspondence is further supported by the scaling collapse
of Fig. 6a and b, showing that our non-dimensional parameter 𝑅 controls both the wild-to-mild
transition and the nature of hardening.
The results shown in Fig. 6 suggest that these two transitions are the manifestations of the same
underlying phenomenon. In case of pure single crystal, Alcalá et al. [39] proposed that the
non-dimensional ratio 𝐿/𝑙�;; controls the transition from forest hardening to source-exhaustion
hardening, where 𝑙�;; is an “effective” mean free path for dislocations. These authors estimated
𝑙�;; from an expression accounting for different types of dislocation interactions. In their case, given
that one can neglect the effect of lattice friction on 𝜏()*, the mean free path for mobile dislocations
𝑙�;;, which scales as 1/ 𝜌; [42, 43], can be identified with our internal length scale 𝑙 (see section
4.3). Consequently, for pure metals, the ratio 𝐿/𝑙�;;, which controls the nature of hardening [39],
can be identified with our parameter 𝑅 = 𝐿/𝑙. This parameter, in turn, accounts for the wild-mild
transition (Fig. 6a), arguing in favor of a non-incidental overlap of the wild-to-mild transition and the
transition between two different hardening mechanisms.
Our Fig. 6 extends this correlation beyond pure metals, and suggests that alloying increases
dislocation storage capacity, favoring the formation of dislocation entanglements and enhancing
forest hardening. Instead, it disfavors dislocation avalanches and wild plastic fluctuations. In
summary, according to our unified scenario, external and internal size effects control, through the
non-dimensional ratio 𝑅 = 𝐿/𝑙 , the nature of both the average behavior (hardening) and the
18
statistics of fluctuations.
1000 100000.0
0.3
0.0
0.3
0.0
0.3
0.0
0.3
Diameter, L (nm)
Al-Cu-Sn
Stra
in h
arde
ning
rate
, Qpillar (
GPa
)
Forest hardening
Al-Sc precipitate
Source-exhaustion hardening
Al-Sc cluster
Pure Al
Figure 8. Strain hardening rate for micro-pillars. The small samples with weak obstacles display more likely source-exhaustion hardening, characterized by L-dependent SHRs in high value and large scattering. Introducing obstacles suppresses source-exhaustion hardening, and extends forest hardening to small diameter. The dotted lines represent the SHR of bulk samples for comparison. The critical diameter for hardening transition is in good agreement with the wild-to-mild transition diameter (as shown in Fig. 4a).
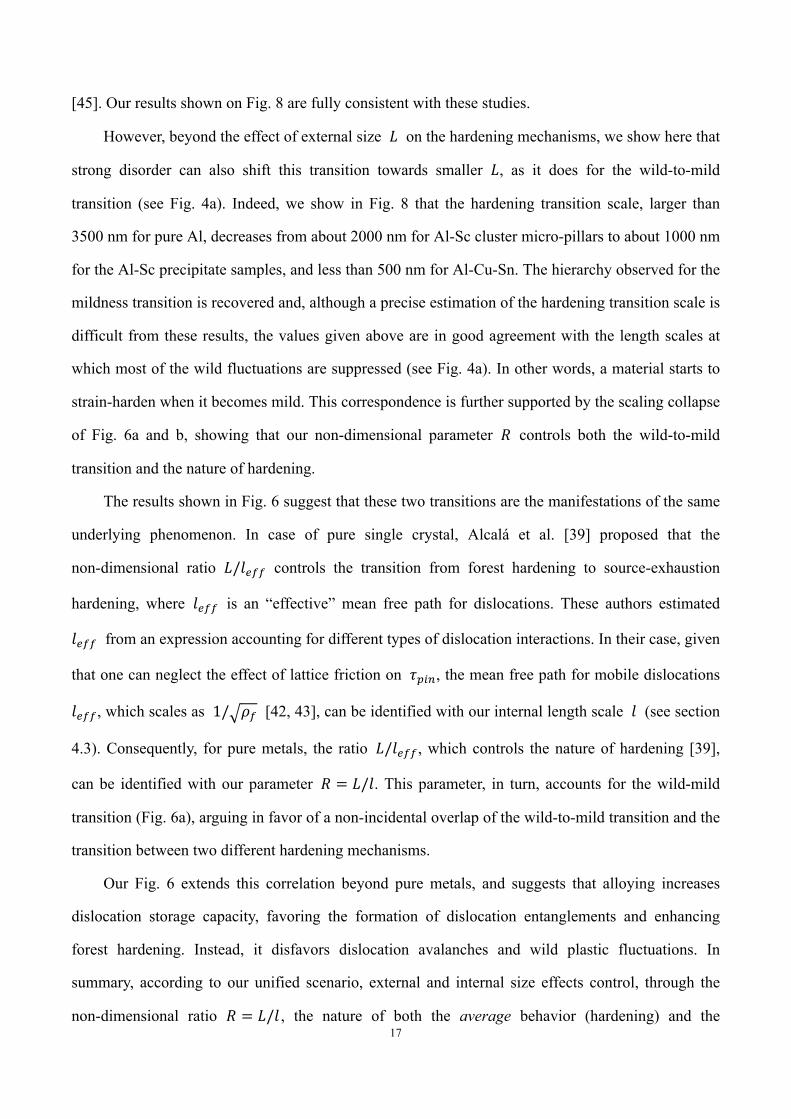
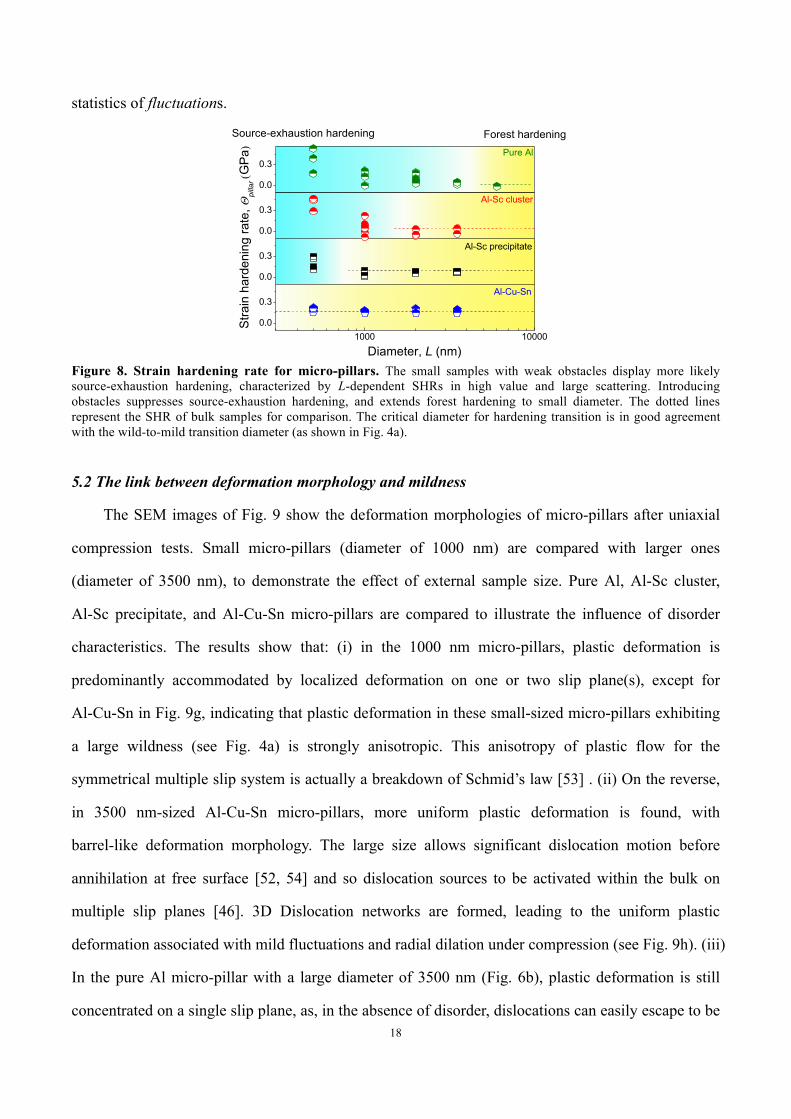
5.2 The link between deformation morphology and mildness
The SEM images of Fig. 9 show the deformation morphologies of micro-pillars after uniaxial
compression tests. Small micro-pillars (diameter of 1000 nm) are compared with larger ones
(diameter of 3500 nm), to demonstrate the effect of external sample size. Pure Al, Al-Sc cluster,
Al-Sc precipitate, and Al-Cu-Sn micro-pillars are compared to illustrate the influence of disorder
characteristics. The results show that: (i) in the 1000 nm micro-pillars, plastic deformation is
predominantly accommodated by localized deformation on one or two slip plane(s), except for
Al-Cu-Sn in Fig. 9g, indicating that plastic deformation in these small-sized micro-pillars exhibiting
a large wildness (see Fig. 4a) is strongly anisotropic. This anisotropy of plastic flow for the
symmetrical multiple slip system is actually a breakdown of Schmid’s law [53] . (ii) On the reverse,
in 3500 nm-sized Al-Cu-Sn micro-pillars, more uniform plastic deformation is found, with
barrel-like deformation morphology. The large size allows significant dislocation motion before
annihilation at free surface [52, 54] and so dislocation sources to be activated within the bulk on
multiple slip planes [46]. 3D Dislocation networks are formed, leading to the uniform plastic
deformation associated with mild fluctuations and radial dilation under compression (see Fig. 9h). (iii)
In the pure Al micro-pillar with a large diameter of 3500 nm (Fig. 6b), plastic deformation is still
concentrated on a single slip plane, as, in the absence of disorder, dislocations can easily escape to be
19
annihilated at free surfaces.
In order to quantify the strain homogeneity as a function of external size and disorder, the
expanding ratio, defined as the percentage change of diameter after 20% deformation, is used. The
diameter measurements were always performed at the half height of the pillars, before deformation
and after 20% deformation respectively. All the measurements on diameter were performed along the
same <001> orientation to avoid the possible influence of expanding anisotropy. A clear trend is
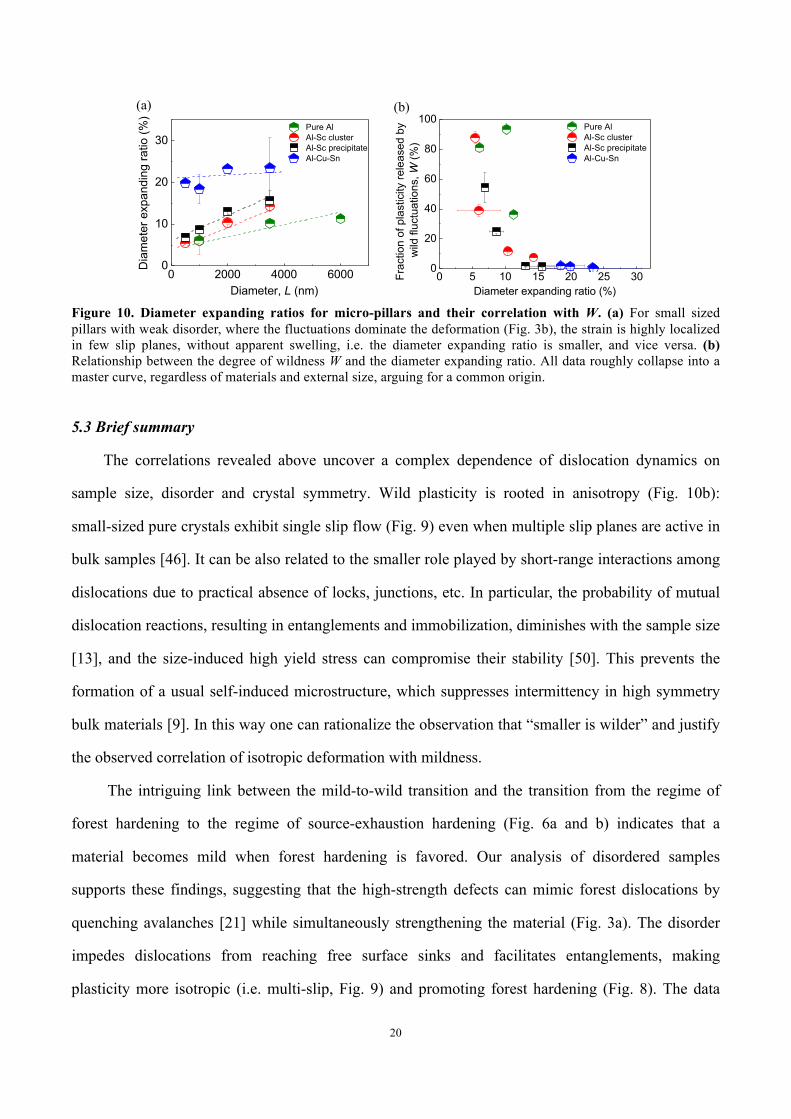
shown in Fig. 10, that is, larger is the diameter or stronger is the disorder, more homogenous is the
deformation, consistent with the direct SEM observations.
Further exploring the correlation between expanding ratio and mildness, it is strikingly found
that all data roughly collapse into a master curve, regardless of the materials and external size (Fig.
10b). This indicates a same origin for strain homogeneity and mildness, linked to the hindering of
avalanches and the prevalence of short-range interactions.
Figure 9. Effects of external size and internal disorder on deformation morphology. SEM images showing the deformation morphology of pure Al ((a) and (b)), Al-Sc cluster ((c) and (d)), Al-Sc precipitate ((e) and (f)), and Al-Cu-Sn ((g) and (h)) micro-pillars with diameter of 1000 nm ((a), (c), (e), and (g)) and of 3500 nm ((b), (d), (f), and (h)). The diameter expanding ratio is given at the top right corner.
Figure 9. Effects of external size and internal disorder on deformation morphology. SEM images showing the deformation morphology of pure Al ((a) and (b)), Al-Sc cluster ((c) and (d)), Al-Sc precipitate ((e) and (f)), and Al-Cu-Sn ((g) and (h)) micro-pillars with diameter of 1000 nm ((a), (c), (e), and (g)) and of 3500 nm ((b), (d), (f), and (h)). The diameter expanding ratio is given at the top right corner.
1061 nm 1036 nm 1085 nm 1288 nm
3761 nm 4000 nm 4131 nm 4455 nm
(a) (c)
(b) (d)
(e)
(f)
(g)
(h)
6.1% 3.6% 8.5% 22.8%
7.5% 14.3% 18.0% 27.0%
20
Figure 10. Diameter expanding ratios for micro-pillars and their correlation with W. (a) For small sized pillars with weak disorder, where the fluctuations dominate the deformation (Fig. 3b), the strain is highly localized in few slip planes, without apparent swelling, i.e. the diameter expanding ratio is smaller, and vice versa. (b) Relationship between the degree of wildness W and the diameter expanding ratio. All data roughly collapse into a master curve, regardless of materials and external size, arguing for a common origin.
5.3 Brief summary
The correlations revealed above uncover a complex dependence of dislocation dynamics on
sample size, disorder and crystal symmetry. Wild plasticity is rooted in anisotropy (Fig. 10b):
small-sized pure crystals exhibit single slip flow (Fig. 9) even when multiple slip planes are active in
bulk samples [46]. It can be also related to the smaller role played by short-range interactions among
dislocations due to practical absence of locks, junctions, etc. In particular, the probability of mutual
dislocation reactions, resulting in entanglements and immobilization, diminishes with the sample size
[13], and the size-induced high yield stress can compromise their stability [50]. This prevents the
formation of a usual self-induced microstructure, which suppresses intermittency in high symmetry
bulk materials [9]. In this way one can rationalize the observation that “smaller is wilder” and justify
the observed correlation of isotropic deformation with mildness.
The intriguing link between the mild-to-wild transition and the transition from the regime of
forest hardening to the regime of source-exhaustion hardening (Fig. 6a and b) indicates that a
material becomes mild when forest hardening is favored. Our analysis of disordered samples
supports these findings, suggesting that the high-strength defects can mimic forest dislocations by
quenching avalanches [21] while simultaneously strengthening the material (Fig. 3a). The disorder
impedes dislocations from reaching free surface sinks and facilitates entanglements, making
plasticity more isotropic (i.e. multi-slip, Fig. 9) and promoting forest hardening (Fig. 8). The data
0 2000 4000 60000
10
20
30 Pure Al Al-Sc cluster Al-Sc precipitate Al-Cu-Sn
Dia
met
er e
xpan
ding
ratio
(%)
Diameter, L (nm) 0 5 10 15 20 25 30
0
20
40
60
80
100 Pure Al Al-Sc cluster Al-Sc precipitate Al-Cu-Sn
Frac
tion
of p
last
icity
rele
ased
by
wild
fluc
tuat
ions
, W (%
)
Diameter expanding ratio (%) Figure 10. Diameter expanding ratios for micro-pillars and their correlation with W. (a) For small sized pillars with weak disorder, where the fluctuations dominate the deformation (Fig. 3b), the strain is highly localized in few slip planes, without apparent swelling, i.e. the diameter expanding ratio is smaller, and vice versa. (b) Relationship between the degree of wildness W and the diameter expanding ratio. All data roughly collapse into a master curve, regardless of materials and external size, arguing for a common origin.
(a) (b)
21
collapse suggests that both hardening-related and fluctuations-related transitions are controlled by the
competition between the external scale 𝐿 and the internal scale 𝑙 which can be quantified in terms
of a single nondimensional parameter 𝑅 = 𝐿/𝑙 (Fig. 6).
The correlations between strain hardening mechanisms, deformation morphology and
fluctuation behavior are rooted in a common origin of all these effects which can be quantified in
terms of the probability of mutual dislocation reactions and the feasibility of the formation of
dislocation entanglements.
6. Model
6.1 Model structure and prediction of the universal relation 𝑾-𝜿
Our experimental results find a simple interpretation in the framework of a mean field model for
the density of mobile dislocations 𝜌l, where the dynamics under constant stress is described by the
stochastic equation [9]:
G5iG�
= 𝐴 − 𝐶𝜌l + 2𝐷𝜌l𝜉 𝛾 (4)
Here the time-like parameter 𝛾 is chosen to coincide with the applied shear strain, 𝐴 > 0 is the net
nucleation rate taking into account a negative contribution from surface annihilation, 𝐶 > 0 is the
rate of mutual annihilation/immobilization of the dislocation pairs, 𝐷 is the intensity of self-induced
fluctuations and 𝜉 𝛾 is a standard white noise with 𝜉(𝛾) = 0, 𝜉 𝛾2 𝜉(𝛾3) = 𝛿 𝛾2−𝛾3 . The
heuristic model (4), where we focus on fluctuations at a fixed stress and do not address strain
hardening, can be viewed as a spatially resolved mesoscopic closure of the continuum mechanical
model of plasticity. We assume that the local yielding thresholds depend on a single dislocation
density and long range stochastic interactions are implemented in the form of a multiplicative
mechanical noise. Similar approaches, relying on the idea of ‘mechanical temperature’ as a
description of the fluctuating local stress, have been used in the modeling of athermal amorphous
plasticity [55] and in the representations of crystal plasticity as a noise induced transition [56].
Various ways of representing correlations in the mechanical action of the noise in such models are
expected to capture the persistent nonlocal rearrangements and avalanche-like processes triggered by
local instabilities [57]. In crystal plasticity such stochastic constitutive relations still await to be
validated by the rigorous upscaling procedures based on microscopic models [57, 58]. To link our

22
model with mechanical measurements, we can use Orowan’s relation 𝑑𝛾 = 𝜌l𝑏𝑣𝑑𝑡. Recalling that
we consider a fixed external stress condition, the average dislocation velocity v, set by the applied
stress [59], can be taken as a constant. Thus, the distribution of strain fluctuations will be exactly
reflected by the fluctuations of mobile dislocation density 𝜌l solved in our model.
The stationary probability distribution predicted by Eq. (4) takes the form 𝑃 𝜌l =
�
¡/ �¢ � £i5i
¢ ¤¥¡
¦ ¡ ,J
, where 𝛤 𝑧, 𝑥 = 𝑡©12𝑒1Mªn 𝑑𝑡. We can then write 𝜅 − 1 = 𝐶/𝐷 and define
the degree of wildness as 𝑊 = 𝑃 𝜌l 𝑑𝜌lª5i«¬
where 𝜌l)* is the threshold distinguishing
between wild and mild fluctuations. It is natural to specify 𝜌l)* by the condition exp − °±5i«¬
=
𝐾 where 𝐾 = 1 corresponds to a pure power law. At fixed 𝐾 we obtain an important relation
between the degree of wildness 𝑊 and the power law exponent 𝜅 − 1 = 𝐶/𝐷 of the long tail
describing intermittent fluctuations of the dislocation density
𝑊 = 1 −² ¡
,4³&¤´
² ¡ ,J
(5)
The fact that the ratio 𝐴 𝐷 drops from Eq. (5) is in agreement with the experimental scaling
collapse, indicating that the degree of wildness 𝑊 depends only on the exponent 𝜅 (see Fig. 4b).
Quite remarkably, the predicted curves 𝑊(𝐶 𝐷) have the same sigmoidal shape as experimental
data, and by choosing the value 𝐾 = 0.25, we achieve an almost perfect fit; the K dependence in the
range of interest is relatively weak (Fig. 4b).
6.2 The external size and disorder effect in the model
So far, an analytical study of Eq. (4) allowed to give specific predictions in terms of scaling
exponent 𝜅 and degree of wildness 𝑊. In this section, we will relate our model parameters to L and
l in order to rationalize the main results from our experiments, i.e., the sample size and disorder
effect on 𝑊 and 𝜅.
6.2.1 The interpretation of the model parameters
The model has two characteristic densities 𝜌µ = 𝐴 𝐶 and 𝜌± = 𝐴 𝐷, which gives rise to two
characteristic lengths 𝑙µ =25¡= 𝐶/𝐴 and 𝑙± =
25 = 𝐷/𝐴. The ratio of these two length

23
scales, 𝑟 = 4¡4 = 𝐶/𝐷, is the main dimensionless parameter of the model. Our analytical study
shows that the fraction of strain released in wild fluctuations 𝑊 depends only on 𝑟, in other words
that 𝑊 = 𝑊(𝐶 𝐷). On the other hand, our experimental study shows that 𝑊 = 𝑊(𝑅) where the
parameter 𝑅 = 𝐿 𝑙 is also dimensionless. By comparing the functions 𝑊(𝑟) and 𝑊(𝑅) we find
that 𝑅~𝑟3 which means that 𝜅 − 1 = µ±~ ·
4= 𝑅 . This linear relation has been confirmed
experimentally, as shown in Fig. 6c.
Our parameter 𝐶 characterizes the rate of mutual annihilation/immobilization, which Gilman
calls ‘stalemating’ [60]. It is fundamentally different from surface annihilation of individual
dislocations, which negatively contributes to our parameter 𝐴 (G5iG�
= − 2A·
) [61]. In fact, as we have
shown, 𝐴 does not affect either the degree of wildness 𝑊 or the avalanche distribution. In small
samples, the immobile configurations, such as dislocation dipoles and locks, are hard to form (or
easy to break) under the external size induced high stresses, meaning that an extrinsic size effect
applies on parameter C . Available 3-D discrete dislocation simulations (Fig. 8 in Ref. [50]) suggests
an approximately linear relation between the “dislocation reaction (number) per volume” and the
external size L. Combined with a similar dislocation density during straining for all L (Fig. 5 in Ref.
[50]), this implies that the “dislocation reaction rate” increases linearly with L, that is 𝐶~𝐿/𝑏. In the
next section, we will justify this scaling based on a detailed microscopic approach and estimate the
value of the proportionality coefficient.
The connection between D and classical (non stochastic) models of dislocation dynamics is, by
nature, less straightforward. In view of the interpretation of the parameter 𝐶, i.e., 𝐶~𝐿/𝑏, we can
conclude that in the range where 𝐶/𝐷~𝐿/𝑙 (Fig. 6c), the mechanical temperature of the system [62]
𝐷~𝑙/𝑏 = 𝐺/𝜏()* diminishes with increasing pinning strength of obstacles and increases with
stiffness responsible for the long range interactions.
The proposed interpretation of the model parameters is consistent with the effect of crystal
structure on wildness in bulk materials [9]. For instance, in HCP materials like ice with essentially
single slip plasticity, forest hardening is absent. Therefore 𝐶 accounts for mutual annihilation only
and remain small even at macro scale. Combined with a very small lattice friction, this also implies a
24
small pinning strength and thus 𝐷 is large independently of 𝐿. Hence, bulk ice crystals remain wild,
and most probaly outside the diagram shown in Fig. 6c as the correlation 𝐶/𝐷~𝐿/𝑙 should be valid
only over a limited range of 𝐿/𝑙 . At sufficiently small 𝐿/𝑙 (large degree of wildness), our
exponents for the aggregate distribution (integrated over a range of stress values) appear to be
saturated around 𝐶/𝐷=0.5 (Fig. 6c). This value is close to the prediction of the mean field theory [3,
6] but may also be an indicator of a smaller stress-integrated exponent obtained in recent DDD
modeling [4]. At large values of 𝐿/𝑙 (small degree of wildness), 𝐶 should saturate towards a bulk
value 𝐶A�4� ; the associated departure from the scaling 𝐶/𝐷~𝐿/𝑙 is hardly detectable in our
experimental data, as detected avalanches become too rare to allow an estimation of 𝜅.
6.2.2 The physical expression of the model parameters, and the link with the size effect on
strength
To justify the scaling 𝐶~𝐿/𝑏 and estimate the value of 𝐶, we start by writing the expressions
for the rates of mutual annihilation, dipole formation, or lock formation proposed by Roters et al.
[63]:
𝜌𝑚− 𝑎𝑛𝑛𝑖ℎ𝑖𝑙 = 2𝜒𝑎𝑛𝑛𝑖ℎ𝑖𝑙�𝑏1𝑛 𝜌𝑚 (6a)
𝜌𝑚− 𝑑𝑖𝑝𝑜𝑙 = 2(𝜒𝑑𝑖𝑝𝑜𝑙 − 𝜒𝑎𝑛𝑛𝑖ℎ𝑖𝑙)�𝑏1𝑛 𝜌𝑚 (6b)
𝜌𝑚− 𝑙𝑜𝑐𝑘 = 4𝜒𝑙𝑜𝑐𝑘�𝑏𝑛−1𝑛 𝜌𝑚 (6c)
Here 𝛾 is the shear strain rate, 𝜒𝑎𝑛𝑛𝑖ℎ𝑖𝑙 is a critical distance below which two dislocations with
antiparallel burgers vectors can annihilate, and 𝜒𝑑𝑖𝑝𝑜𝑙 and 𝜒𝑙𝑜𝑐𝑘 are critical distances for the
spontaneous formation of dipoles and locks/junctions, respectively. Annihilation can take place with
the help of cross-slip and/or dislocation climb. As our tests were performed at room temperature,
cross-slip is likely the dominant controlling mechanism in Eq. (6a).𝑛 is the number of active slip
systems, under the assumption of an equal density of moving dislocations on each of these systems.
The combination of terms due to annihilation Eq. (6a) and dipole formation Eq. (6b) yields
𝜌𝑚− 𝑎𝑛𝑛𝑖ℎ𝑖𝑙 + 𝑑𝑖𝑝𝑜𝑙 = 2𝜒𝑑𝑖𝑝𝑜𝑙�𝑏1𝑛 𝜌𝑚. As 𝜌𝑚
−
�=𝑑𝜌𝑚
−
𝑑𝛾 , we get:
𝑑𝜌𝑚−
𝑑𝛾 𝑎𝑛𝑛𝑖ℎ𝑖𝑙 + 𝑑𝑖𝑝𝑜𝑙 =2𝜒𝑑𝑖𝑝𝑜𝑙𝑏
1𝑛 𝜌𝑚 = 𝐶𝑎𝑛𝑛𝑖ℎ𝑖𝑙+𝑑𝑖𝑝𝑜𝑙𝜌𝑚 (7a)
25
𝑑𝜌𝑚−
𝑑𝛾 (𝑙𝑜𝑐𝑘) =4𝜒𝑙𝑜𝑐𝑘𝑏
𝑛−1𝑛 𝜌𝑚 = 𝐶𝑙𝑜𝑐𝑘𝜌𝑚 (7b)
By accounting for the elastic interactions between dislocations, or by invoking line tension
calculations, the critical distances 𝜒𝑑𝑖𝑝𝑜𝑙 and 𝜒𝑙𝑜𝑐𝑘 can be translated into critical effective shear
stresses acting on dislocations, below which dipoles or locks are stable [64]:
𝜏𝑒𝑓𝑓(𝑑𝑖𝑝𝑜𝑙) =𝐺𝑏
8𝜋(1−𝜐)𝜒𝑑𝑖𝑝𝑜𝑙 (8a)
𝜏𝑒𝑓𝑓(𝑙𝑜𝑐𝑘) =𝐺𝑏
2𝜋𝜒𝑙𝑜𝑐𝑘 (8b)
Combining Eq. (7) and (8), we obtain for the mutual annihilation/immobilization rate 𝐶:
𝐶 = @B(2 − 3
*+ 2
I(21Å)*) 2�ÆÇÇ
(9)
We write the effective shear stress allowing to unlock an immobile configuration as 𝜏�;; = 𝜏-)�4G −
𝜏()*, where 𝜏-)�4G is the yield strength of micro-pillars estimated at 0.2% of plastic strain in our
compression experiments. We note that when 𝑛 is large, the contribution of lock/junction formation
in Eq. (9), (2 − 3*
), strongly dominates the contribution due to annihilation and dipole formation,
( 14(1−𝜈)𝑛).
At this stage, a connection between the size effect on wildness, and the well-documented size
effect on strength can be made. Although various power law exponents have been proposed to
describe the scaling relation between 𝜏-)�4G and 𝐿 for different materials [52, 65], our experimental
data justify a material-independent linear relation 𝜏-)�4G − 𝜏()*~𝐺𝑏/𝐿 (Fig. 11a), which is
consistent with the re-evaluation of a large set of published experimental data [66]. Actually, the data
collapse shown in Fig. 11a implicitly supports the source truncation mechanism [46, 67]. In this case,
the effective stress 𝜏-)�4G − 𝜏()* required to activate a dislocation source of length 𝜆h goes as
1/𝜆h [67], whereas recent DDD simulations [68, 69] argue for a dislocation source length scaling as
external size, 𝜆h~𝐿. The combination of these relations yields the observed size effect in Fig. 11a.
The scattering of source lengths contributes to the scatter of measured effective stress [67], but
doesn’t change the overall scaling trend. Combining Eq. (9) and our observed correlation between
𝜏-)�4G − 𝜏()* and 1/𝐿 (Fig. 11a), we verify the scaling 𝐶~𝐿/𝑏.
26
From the knowledge of the proportionality coefficient between 𝜏𝑦𝑖𝑒𝑙𝑑 − 𝜏𝑝𝑖𝑛 and 1/𝐿, equal to
40.8 Pa.m, we obtain the proportionality coefficient in the relation 𝐶~𝐿/𝑏 once 𝑛 is known. Our
micropillars were compressed along the <110> direction, so there are two slip planes and four equal
slip systems ((111) <10-1>, (111) <01-1>, (11-1) <101> and (11-1) <011>) with the same Schmidt
factor. For pure Al, Al-Sc cluster and Al-Sc precipitates, concentrated slip bands are generally
observed (Fig. 9), suggesting 𝑛 ≈ 2. Instead, the much more homogeneous transversal deformation
of Al-Cu-Sn samples suggests that 𝑛 = 4 is more reasonable in this case. The proportionality
coefficient in the relation 𝐶~𝐿/𝑏 changes slightly from 0.065 for 𝑛 = 2 to 0.087 for 𝑛 = 4.
Following these numbers, we obtain for 𝐶 the values ranging from ~100 for pure Al 500
nm-micropillars, to ~1000 for Al-Cu-Sn 3500 nm-micropillars. The observed correlation 𝜅 − 1 =
𝐶/𝐷~𝐿/𝑙, with a dimensionless proportionality coefficient equal to 0.41, yields 𝐷~𝑙/𝑏 with a
proportionality coefficient equal to 0.15 for 𝑛 = 2. Our estimate shows that 𝐷 ranges from ~100
for Al-Sc precipitate to ~800 for pure Al.
The obtained numerical values of the parameter 𝐶 and 𝐷 bring the model in surprisingly good
agreement with experimental data (Fig. 4a). However, the 𝐶/𝐷 value might saturate towards the
mean-field value of 0.5 for very small 𝑅 (Fig. 6c). In this case, the above calculations would
slightly underestimate 𝐶/𝐷 in this range. We also note that the crystal orientation effect on wildness
can be reflected in the parameter n. In case of single-slip orientation where 𝑛 ≈ 1, the formation of
locks/junctions is almost negligible, and the calculated coefficient of 𝐶~𝐿/𝑏 is only 0.020, much
smaller than in our multi-slip orientation case (0.065 to 0.087). This move the wild-to-mild transition
to larger sizes, in agreement with micro-compression experiments of Ni crystals with <-269>
orientation showing power-law distributed plastic bursts [12].
Finally, and most importantly, the observed correlation between the power law exponent 𝜅 −
1 = 𝐶/𝐷 and the ratio 𝜏�;;/𝜏()* shown on Fig. 11b confirms the established relation
𝐶~ ·A~ @�Ê«ÆËH1�Ì«¬
and 𝐷~ 4A= @
�Ì«¬, and builds a conceptual bridge between the size effects on
strength in one hand, and wildness on the other hand. This scaling �ÆÇÇ�Ì«¬
~ ±µ~ 2Í, which shows that our
parameter 𝑅 controls the size effects on wildness (Fig. 6a), hardening mechanism (Fig. 6b) and

27
strength (Fig. 11b), is fully compatible with the approach of Zaiser and Sanfeld [44], who argued
from similitude principles that the increase of flow stress due to external size (i.e., �ÆÇÇ�Ì«¬
in our case)
should, for pure metals, only depend on the product 𝐿 𝜌; (i.e., our R for pure metal). Our results
demonstrate that this can be extended to alloys, using an appropriate definition of the dimensionless
parameter 𝑅 = ·4.
Figure 11. The correlations between the power law exponent, 𝜿 − 𝟏 = 𝑪/𝑫, and size dependent effective shear stress, 𝝉𝒆𝒇𝒇 . (a) The effective shear stress defined as 𝜏�;; = 𝜏-)�4G − 𝜏()* , where 𝜏-)�4G is the yield strength of micro-pillars estimated as the stress at 0.2% of plastic strain, as a function of external size L. The relation 𝜏�;;~1/𝐿 can be identified. (b) The power law exponent, 𝜅 − 1, as a function of 𝜏()*/(𝜏-)�4G − 𝜏()*).
7. Concluding Comments
We performed compression tests on micro-pillars of pure Aluminum and Al-alloys single
crystals strengthened by different types of solutes or precipitates, with diameters ranging from 500 to
6000 nm, and quantified the nature of plastic fluctuations occurring during deformation. From these
data, we showed:
(1) Diminishing the external length scale (miniaturization) intensifies fluctuations and contributes to
criticality. This is the “smaller is wilder” effect, that we quantified through the degree of wildness 𝑊
(the proportion of plastic deformation occurring through plastic avalanches) as well as through the
time averaged scaling exponent of the avalanche size distributions.
(2) Introducing quenched disorder shifts the transition from “wild” to “mild” plasticity towards
smaller external length scales. This illustrates the “dirtier is milder” effect, and opens the possibility
to mitigate plastic instabilities at small length scales.
0.0 0.5 1.0 1.5 2.0 2.50
25
50
75
100
125
Pure Al Al-Sc cluster Al-Sc precipitate Al-Cu-Sn
τ yield−τpin (
MPa
)
L-1 (µm-1)
0.0 0.5 1.0 1.5 2.00
2
4
6
τpin/(τyield−τpin)
κ-1,
or C
/D
Pure Al Al-Sc cluster Al-Sc precipitate
Figure 11. The correlations between the power law exponent, ! − # = %/', and size dependent effective shear stress, ()**. (a) The effective shear stress defined as +,-- = +./,01 − +2/3, where +./,01 is the yield
strength of micro-pillars estimated as the stress at 0.2% of plastic strain, as a function of external size L. The relation +,--~1/6 can be identified. (b) The power law exponent, 7 − 1, as a function of +2/3/(+./,01 − +2/3).
(a) (b)
28
(3) The interplay of these effects reveal itself through a universal (material-independent) relation
between the power law exponent of avalanche size distribution and the degree of wildness.
(4) By translating the pinning strength of obstacles into a characteristic length scale 𝑙, we showed
that a single nondimensional parameter 𝑅 = 𝐿/𝑙 not only distinguishes the transition from
source-exhaustion hardening to forest hardening, but also controls the wild to mild transition and
determines the scaling exponent of avalanche size distribution.
(5) While jerky deformation and high flow stresses have been simultaneously observed at micro- and
nano-scales by many authors, there has been so far no established link between them, either
theoretically or experimentally. We now quantify this link through our dimensionless parameter 𝑅
which appears to be controlling both phenomena.
(6) A mean field model for the stochastic evolution of mobile dislocation density is proposed, which
successfully recovers the universal relationship between the scaling exponent and the degree of
wildness. It also rationalizes the competition between external (size related) and internal (disorder
related) length scales on plastic fluctuations as well as the link between the size effects on strength
and wildness.
In summary, our results provide a new unifying perspective on micro-plasticity linking together
a broad range of relevant phenomena including wildness, avalanche size distribution, hardening
mechanisms, strain heterogeneity, and high flow stresses.
Acknowledgements: Financial support for this work was provided by the Natural Science
Foundation of China (Grant Nos. 51321003, 51322104, 51201123 and 51571157), the 111 Project of
China (Grant No. B06025) and the French ANR-2008 grant EVOCRIT. J.W. and L. T. acknowledge
the hospitality of the Aspen Center for Physics, supported by the NSF Grant
No. PHY-1066293.

29
References
[1] Zaiser M. Scale invariance in plastic flow of crystalline solids. Adv. Phys. 55, (2006) 185-245. [2] Liu G, Zhang GJ, Jiang F, Ding XD, Sun YJ, Sun J, Ma E. Nanostructured high-strength molybdenum alloys
with unprecedented tensile ductility. Nature Mater. 12, (2013) 344-350. [3] Dahmen KA, Ben-Zion Y, Uhl JT. Micromechanical Model for Deformation in Solids with Universal
Predictions for Stress-Strain Curves and Slip Avalanches. Phys. Rev. Lett. 102, (2009). [4] Ispánovity PD, Laurson L, Zaiser M, Groma I, Zapperi S, Alava MJ. Avalanches in 2D dislocation systems:
Plastic yielding is not depinning. Phys. Rev. Lett. 112, (2014) 235501. [5] Weiss J, Richeton T, Louchet F, Chmelik F, Dobron P, Entemeyer D, Lebyodkin M, Lebedkina T, Fressengeas C,
McDonald RJ. Evidence for universal intermittent crystal plasticity from acoustic emission and high-resolution extensometry experiments. Phys. Rev. B 76, (2007).
[6] Friedman N, Jennings AT, Tsekenis G, Kim J-Y, Tao M, Uhl JT, Greer JR, Dahmen KA. Statistics of Dislocation Slip Avalanches in Nanosized Single Crystals Show Tuned Critical Behavior Predicted by a Simple Mean Field Model. Phys. Rev. Lett. 109, (2012).
[7] Weiss J, Marsan D. Three-dimensional mapping of dislocation avalanches: Clustering and space/time coupling. Science 299, (2003) 89-92.
[8] Weiss J, Miguel MC. Dislocation avalanche correlations. Mat. Sci. Eng. A 387, (2004) 292-296. [9] Weiss J, Ben Rhouma W, Richeton T, Dechanel S, Louchet F, Truskinovsky L. From Mild to Wild Fluctuations
in Crystal Plasticity. Phys. Rev. Lett. 114, (2015). [10] Zaiser M. Statistical aspects of microplasticity: experiments, discrete dislocation simulations and stochastic
continuum models. J. Mech. Beh. Mater. 22, (2013) 89-100. [11] Uchic MD, Dimiduk DM, Florando JN, Nix WD. Sample dimensions influence strength and crystal plasticity.
Science 305, (2004) 986-989. [12] Dimiduk DM, Woodward C, LeSar R, Uchic MD. Scale-free intermittent flow in crystal plasticity. Science 312,
(2006) 1188-1190. [13] Greer JR, Oliver WC, Nix WD. Size dependence of mechanical properties of gold at the micron scale in the
absence of strain gradients. Acta Mater. 53, (2005) 1821-1830. [14] Ng KS, Ngan AHW. Stochastic nature of plasticity of aluminum micro-pillars. Acta Mater. 56, (2008)
1712-1720. [15] Brinckmann S, Kim J-Y, Greer JR. Fundamental differences in mechanical behavior between two types of
crystals at the nanoscale. Phys. Rev. Lett. 100, (2008). [16] Ng KS, Ngan AHW. Deformation of micron-sized aluminium bi-crystal pillars. Philos. Mag. 89, (2009)
3013-3026. [17] Csikor FF, Motz C, Weygand D, Zaiser M, Zapperi S. Dislocation avalanches, strain bursts, and the problem of
plastic forming at the micrometer scale. Science 318, (2007) 251-254. [18] Argon AS. Strain avalanches in plasticity. Philos. Mag. 93, (2013) 3795-3808. [19] Richeton T, Weiss J, Louchet F. Breakdown of avalanche critical behaviour in polycrystalline plasticity. Nature
Mater. 4, (2005) 465-469. [20] Valiev RZ, Islamgaliev RK, Alexandrov IV. Bulk nanostructured materials from severe plastic deformation.
Prog. Mater. Sci. 45, (2000) 103-189. [21] Ovaska M, Laurson L, Alava MJ. Quenched pinning and collective dislocation dynamics. Sci. Rep. 5, (2015). [22] Liu G, Zhang G-J, Wang R-H, Hu W, Sun J, Chen K-H. Heat treatment-modulated coupling effect of multi-scale
second-phase particles on the ductile fracture of aged aluminum alloys. Acta Mater. 55, (2007) 273-284. [23] Gu R, Ngan A. Size effect on the deformation behavior of duralumin micropillars. Scripta Mater. 68, (2013)
861-864. [24] Girault B, Schneider AS, Frick CP, Arzt E. Strength Effects in Micropillars of a Dispersion Strengthened
Superalloy. Adv. Eng. Mater. 12, (2010) 385-388. [25] Ghassemi-Armaki H, Maaß R, Bhat SP, Sriram S, Greer JR, Kumar KS. Deformation response of ferrite and
martensite in a dual-phase steel. Acta Mater. 62, (2014) 197-211. [26] Chen W, Zhang J, Cao S, Pan Y, Huang M, Hu Q, Sun Q, Xiao L, Sun J. Strong deformation anisotropies of
ω-precipitates and strengthening mechanisms in Ti-10V-2Fe-3Al alloy micropillars: Precipitates shearing vs precipitates disordering. Acta Mater. 117, (2016) 68-80.
[27] Stephenson LT, Moody MP, Liddicoat PV, Ringer SP. New techniques for the analysis of fine-scaled clustering phenomena within atom probe tomography (APT) data. Microsc. Microanal. 13, (2007) 448-463.
[28] Kelly PM, Jostsons A, Blake RG, Napier JG. Determination of Foil Thickness by Scanning-transmission Electron-microscopy. Phys. Status. Solidi. A 31, (1975) 771-780.
[29] Nie JF, Muddle BC. Strengthening of an Al-Cu-Sn alloy by deformation-resistant precipitate plates. Acta Mater. 56, (2008) 3490-3501.
[30] Marquis EA. Microstructural evolution and strengthening mechanisms in Al-Sc and Al-Mg-Sc alloys Ph. D
30
thesis. Northwestern University, (2003). [31] Seidman DN, Marquis EA, Dunand DC. Precipitation strengthening at ambient and elevated temperatures of
heat-treatable Al(Sc) alloys. Acta Mater. 50, (2002) 4021-4035. [32] Chen BA, Liu G, Wang RH, Zhang JY, Jiang L, Song JJ, Sun J. Effect of interfacial solute segregation on ductile
fracture of Al-Cu-Sc alloys. Acta Mater. 61, (2013) 1676-1690. [33] Justinger H, Hirt G. Estimation of grain size and grain orientation influence in microforming processes by
Taylor factor considerations. J. Mater. Process. Technol. 209, (2009) 2111-2121. [34] Thangaraju S, Heilmaier M, Murty BS, Vadlamani SS. On the Estimation of True Hall-Petch Constants and
Their Role on the Superposition Law Exponent in Al Alloys. Adv. Eng. Mater. 14, (2012) 892-897. [35] Noggle TS, Koehler JS. Electron Microscopy of Aluminum Crystals Deformed at Various Temperatures. J. Appl.
Phys. 28, (1957) 53-62. [36] Maas R, Derlet PM, Greer JR. Small-scale plasticity: Insights into dislocation avalanche velocities. Scripta
Mater. 69, (2013) 586-589. [37] Maas R, Wraith M, Uhl JT, Greer JR, Dahmen KA. Slip statistics of dislocation avalanches under different
loading modes. Phys. Rev. E 91, (2015) 42403. [38] Clauset A, Shalizi CR, Newman MEJ. Power-Law Distributions in Empirical Data. Siam. Rev. 51, (2009)
661-703. [39] Alcala J, Ocenasek J, Nowag K, Esque-de los Ojos D, Ghisleni R, Michler J. Strain hardening and dislocation
avalanches in micrometer-sized dimensions. Acta Mater. 91, (2015) 255-266. [40] Salman OU, Truskinovsky L. Minimal Integer Automaton behind Crystal Plasticity. Phys. Rev. Lett. 106,
(2011). [41] Weiss J, Louchet F. Seismology of plastic deformation. Scripta Mater. 54, (2006) 747-751. [42] Devincre B, Hoc T, Kubin L. Dislocation mean free paths and strain hardening of crystals. Science (New York,
N.Y.) 320, (2008) 1745-1748. [43] Kubin L, Devincre B, Hoc T. Modeling dislocation storage rates and mean free paths in face-centered cubic
crystals. Acta Mater. 56, (2008) 6040-6049. [44] Zaiser M, Sandfeld S. Scaling properties of dislocation simulations in the similitude regime. Model. Simul.
Mater. Sc 22, (2014) 065012. [45] El-Awady JA. Unravelling the physics of size-dependent dislocation-mediated plasticity. Nat. Commun. 6,
(2015). [46] Kiener D, Minor AM. Source-controlled yield and hardening of Cu(100) studied by in situ transmission electron
microscopy. Acta Mater. 59, (2011) 1328-1337. [47] Frick CP, Clark BG, Orso S, Schneider AS, Arzt E. Size effect on strength and strain hardening of small-scale [1
1 1] nickel compression pillars. Materials Science and Engineering: A 489, (2008) 319-329. [48] Volkert CA, Lilleodden ET. Size effects in the deformation of sub-micron Au columns. Philos. Mag. 86, (2006)
5567-5579. [49] Schneider AS, Frick CP, Clark BG, Gruber PA, Arzt E. Influence of orientation on the size effect in bcc pillars
with different critical temperatures. Materials Science and Engineering: A 528, (2011) 1540-1547. [50] Motz C, Weygand D, Senger J, Gumbsch P. Initial dislocation structures in 3-D discrete dislocation dynamics
and their influence on microscale plasticity. Acta Mater. 57, (2009) 1744-1754. [51] Kiener D, Minor A. Source truncation and exhaustion: Insights from quantitative in situ TEM tensile testing.
Nano Lett. 11, (2011) 3816-3820. [52] Greer JR, De Hosson JTM. Plasticity in small-sized metallic systems: Intrinsic versus extrinsic size effect. Prog.
Mater. Sci. 56, (2011) 654-724. [53] Ng KS, Ngan AHW. Breakdown of Schmid’s law in micropillars. Scripta Mater. 59, (2008) 796-799. [54] Hussein AM, Rao SI, Uchic MD, Dimiduk DM, El-Awady JA. Microstructurally based cross-slip mechanisms
and their effects on dislocation microstructure evolution in fcc crystals. Acta Mater. 85, (2015) 180-190. [55] Nicolas A, Martens K, Barrat J-L. Rheology of athermal amorphous solids: Revisiting simplified scenarios and
the concept of mechanical noise temperature. EPL (Europhysics Letters) 107, (2014) 44003. [56] Zaiser M, Hähner P. The flow stress of fractal dislocation arrangements. Materials Science and Engineering: A
270, (1999) 299-307. [57] Lin J, Wyart M. Mean-field description of plastic flow in amorphous solids. Physical Review X 6, (2016)
011005. [58] Groma I, Zaiser M, Ispánovity PD. Dislocation patterning in a two-dimensional continuum theory of
dislocations. Phys. Rev. B 93, (2016) 214110. [59] Christian JW. The stress dependence of dislocation velocity, and its relation to the strain rate sensitivity. Acta
Metallurgica 12, (1964) 99-102. [60] Gillis PP, Gilman JJ. Dynamical Dislocation Theory of Crystal Plasticity. II. Easy Glide and Strain Hardening. J.
Appl. Phys. 36, (1965) 3380-3386. [61] Nix WD, Lee S-W. Micro-pillar plasticity controlled by dislocation nucleation at surfaces. Philos. Mag. 91,

31
(2011) 1084-1096. [62] Cugliandolo LF. The effective temperature. J. Phys. a-Math. Theor. 44, (2011). [63] Roters F, Raabe D, Gottstein G. Work hardening in heterogeneous alloys—a microstructural approach based on
three internal state variables. Acta Mater. 48, (2000) 4181-4189. [64] Amodeo RJ, Ghoniem NM. Dislocation dynamics. I. A proposed methodology for deformation micromechanics.
Phys. Rev. B 41, (1990) 6958. [65] Kraft O, Gruber PA, Mönig R, Weygand D. Plasticity in confined dimensions. Ann. Rev. Mater. Res. 40, (2010)
293-317. [66] Dunstan D, Bushby A. The scaling exponent in the size effect of small scale plastic deformation. Int. J. Plasticity.
40, (2013) 152-162. [67] Parthasarathy TA, Rao SI, Dimiduk DM, Uchic MD, Trinkle DR. Contribution to size effect of yield strength
from the stochastics of dislocation source lengths in finite samples. Scripta Mater. 56, (2007) 313-316. [68] Cui YN, Lin P, Liu ZL, Zhuang Z. Theoretical and numerical investigations of single arm dislocation source
controlled plastic flow in FCC micropillars. Int. J. Plasticity. 55, (2014) 279-292. [69] Ryu I, Cai W, Nix WD, Gao H. Stochastic behaviors in plastic deformation of face-centered cubic micropillars
governed by surface nucleation and truncated source operation. Acta Mater. 95, (2015) 176-183.
32
Supplement Materials (SM)
1. Statistics of wild fluctuations We explicitly defined an “avalanche” as a plastic process characterized by a dissipation rate
much greater than the imposed loading rate. Based on this definition and in view of the control mode
provided by the loading device (Hysitron Ti 950), a dislocation avalanche manifests itself by both (i)
a displacement/strain burst away from the displacement/strain-rate target (Fig. S1a, b and Fig. S2a)
and (ii) a brutal stress drop (Fig. S1a, c and Fig. S2c). These two different manifestations can be
separately used to distinguish wild from mild fluctuations, following a similar methodology (Fig. S2).
The results obtained via the two methods are very similar (comparing Fig. 4 in the main text with Fig.
S3).
The separation of wild from mild fluctuations is performed in two successive steps. The first
step consists in extracting bursts (or avalanches) from a mild “noise”. Once these bursts are extracted,
a statistical analysis of the distributions of burst sizes X, based on a maximum likelihood
methodology [S1], provides a lower bound 𝑋l)* to power law scaling for the burst size distribution.
Only the bursts with size 𝑋 ≥ 𝑋l)* are considered as wild fluctuations. The cumulative effect of
these wild fluctuations, normalized by the total imposed deformation, defines the wildness W.
(1) The response of testing machine during avalanches
The testing machine we used (Hysitron Ti 950) is inherently a load-controlled system. A
feedback control loop is used to impose a constant displacement rate by actively changing the
loading rate. This control mode, which is the same as the one used in previous studies of this type
[S2, 3, 4], works well for mild fluctuations, as the dissipation rate is comparable to the loading rate,
but fails, by nature, to maintain a steady displacement/loading rate when wild fluctuation occur,
leading to an abrupt strain burst or brutal loading drop.
A segment of a stress-strain curve of an Al-Sc cluster micro-pillar with 1000 nm in diameter is
shown on Fig. S1 as an example, where each point represents a data point sampled at 200 Hz. An
abrupt plastic event, which manifests itself by a strain burst, lasting two time intervals, i.e. 0.01 s, is
shown in Fig. S1a. As the result of the sudden release of elastic energy induced by a plastic event, the
control system urgently reduces the loading (i.e. brutal stress drop in Fig. S2c) to trace back to the
target position. However, it still takes ~0.53 s to reach the desired stress level (Fig. S1b and c), in
sharp contrast with the plastic event duration of 0.01 s. The hysteresis in system loading response
during an avalanche makes a constant displacement/strain rate impossible to maintain, explaining the
33
existence of strain bursts such as shown in Fig. S1b and Fig. S2a. It is then reasonable to consider
either the displacement/strain burst, or the brutal load drop as a signature of a dislocation avalanche.
The size of the avalanche is quantified by the axial plastic displacement over the duration of the
strain burst: 𝑋 = 𝐷� − 𝐷h + (𝐹h − 𝐹�)/𝐾(, where 𝐷h, 𝐹h, 𝐷�, and 𝐹� are displacement and force
when a burst starts and ends, respectively, as defined in Fig. S1, and 𝐾( is the stiffness of the
sample. The axial displacement X during an avalanche is proportional to b(∆A/A), where ∆A is the
cumulative area swept by dislocations during the avalanche, A the slip area, and b the Burgers vector.
(2) Methodology of extracting wild avalanches
The following methodology has been adopted to extract displacement bursts and brutal load
drops from the mild noise. A representative displacement rate vs time signal, where the target
displacement rate has been removed, is shown in Fig. S2a. The peaks, which are responsible for the
asymmetry of the fluctuations with respect to the horizontal axis, are signatures of strain bursts. The
distribution of positive displacement rates, measured at the sampling frequency of 200 Hz, is
compared with that of the negative ones (in absolute value) on Fig. S2b in order to determine the
threshold where the two distributions diverge. For the positive displacement rates, a power-law tail is
obtained. Below the threshold value, the two distributions coincide and are Gaussian-like, which
means that all the asymmetry can be explained by the power-law tail of the positive part. This
threshold can then be used to distinguish avalanches from background noise and slow dissipations.
Following an approach similar to that mentioned above for displacement-rate signals, we
determined a threshold from the asymmetry of force/stress-rate distributions (Fig. S2c and d). The
size of the avalanche is then estimated as the load drop (marked in Fig. S2c) divided by the pillar
stiffness, which has the same physical meaning as the axial plastic displacement during an avalanche.
The statistical results derived from the force/stress-based method, shown in Fig. S3, are in excellent
agreement with the results derived from the displacement/strain-based method (see Fig. 4 in the main
text).
(3) Correction for wild fluctuations.
Once these bursts are extracted from the mild noise, their distributions can be analyzed (see Fig.
5 of the main text). For some of these distributions, it is clear that power law scaling breaks down
below a threshold 𝑋l)* . This threshold can be determined by means of maximum likelihood
methodology used to estimate the power law exponent κ [S1]. Consequently, only the events with
size X above 𝑋l)* are considered as true wild fluctuations, and taken into account in the estimation
of wildness. However, it is worth noting that this second step induces only a higher order correction
to the value of wildness and does not change any of the general trends.

34
Figure S1. Zoomed deformation curves of an Al-Sc cluster micro-pillar with 1000 nm diameter. (a) A segment taken from the stress-strain curve, where a strain burst is marked by its starting (red circle) and ending point (blue circle). The sampling time is 0.005 s, which means that the strain burst is finished within 0.01 s, followed by an elastic unloading. The strain burst and the following elastic unloading are indicated by green arrows. (b) The corresponding strain-time curve. The strain burst marked in (a) is shown in a zoomed window to see the jump event and the retracting phase more clearly. (c) The corresponding stress-time curve. The burst starting and ending points are marked by red and blue arrows, respectively. It takes 0.53 s for the loading feedback loop to reach the target position. This means that the rate of wild fluctuation (finished in 0.01 s) is much faster than the loading reaction rate (taking 0.53 s). The hysteresis in system loading reaction leads to the strain burst in (a) and (b).
Figure S2. Displacement/force-rate signals and corresponding distributions. (a) Displacement rate-time signal
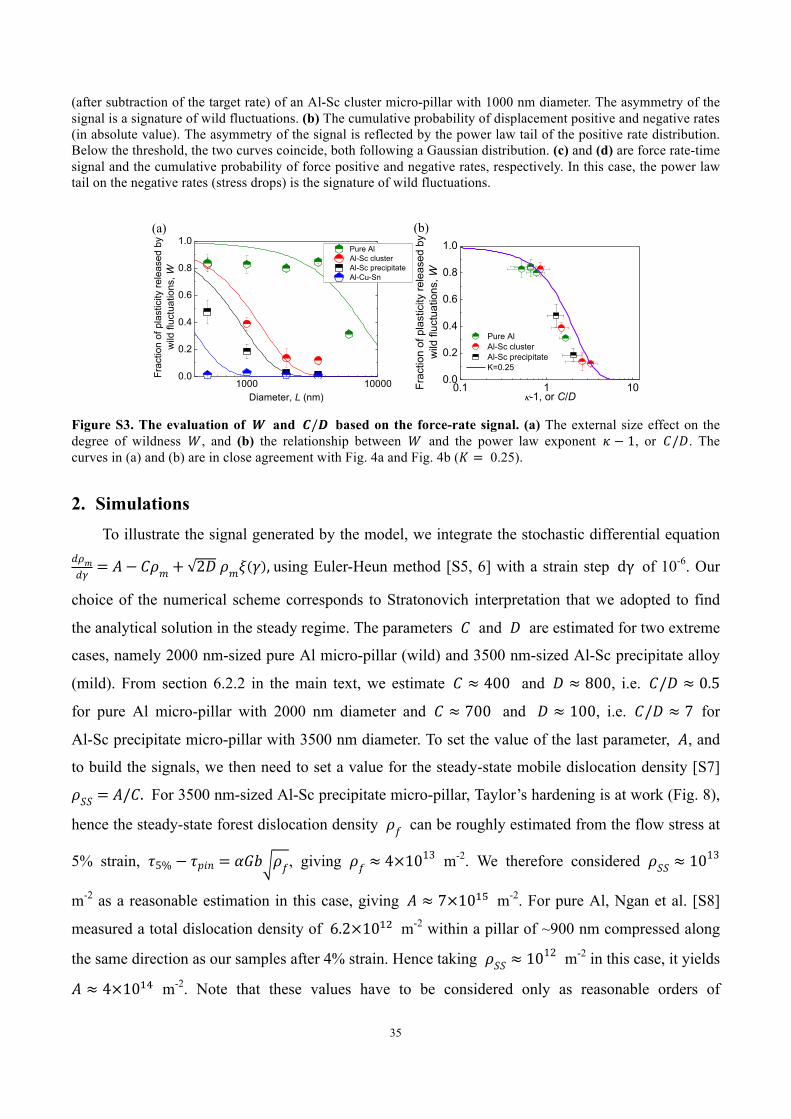
35
(after subtraction of the target rate) of an Al-Sc cluster micro-pillar with 1000 nm diameter. The asymmetry of the signal is a signature of wild fluctuations. (b) The cumulative probability of displacement positive and negative rates (in absolute value). The asymmetry of the signal is reflected by the power law tail of the positive rate distribution. Below the threshold, the two curves coincide, both following a Gaussian distribution. (c) and (d) are force rate-time signal and the cumulative probability of force positive and negative rates, respectively. In this case, the power law tail on the negative rates (stress drops) is the signature of wild fluctuations.
Figure S3. The evaluation of 𝑾 and 𝑪/𝑫 based on the force-rate signal. (a) The external size effect on the degree of wildness 𝑊, and (b) the relationship between 𝑊 and the power law exponent 𝜅 − 1, or 𝐶/𝐷. The curves in (a) and (b) are in close agreement with Fig. 4a and Fig. 4b (𝐾 = 0.25).
2. Simulations To illustrate the signal generated by the model, we integrate the stochastic differential equation
𝑑𝜌𝑚𝑑𝛾 = 𝐴− 𝐶𝜌𝑚 + 2𝐷𝜌𝑚𝜉 𝛾 ,using Euler-Heun method [S5, 6] with a strain step dγ of 10-6. Our
choice of the numerical scheme corresponds to Stratonovich interpretation that we adopted to find
the analytical solution in the steady regime. The parameters 𝐶 and 𝐷 are estimated for two extreme
cases, namely 2000 nm-sized pure Al micro-pillar (wild) and 3500 nm-sized Al-Sc precipitate alloy
(mild). From section 6.2.2 in the main text, we estimate 𝐶 ≈ 400 and 𝐷 ≈ 800, i.e. 𝐶/𝐷 ≈ 0.5
for pure Al micro-pillar with 2000 nm diameter and 𝐶 ≈ 700 and 𝐷 ≈ 100, i.e. 𝐶/𝐷 ≈ 7 for
Al-Sc precipitate micro-pillar with 3500 nm diameter. To set the value of the last parameter, 𝐴, and
to build the signals, we then need to set a value for the steady-state mobile dislocation density [S7]
𝜌𝑆𝑆 = 𝐴/𝐶. For 3500 nm-sized Al-Sc precipitate micro-pillar, Taylor’s hardening is at work (Fig. 8),
hence the steady-state forest dislocation density 𝜌𝑓 can be roughly estimated from the flow stress at
5% strain, 𝜏5% − 𝜏𝑝𝑖𝑛 = 𝛼𝐺𝑏 𝜌𝑓, giving 𝜌𝑓 ≈ 4×10¹³ m-2. We therefore considered 𝜌𝑆𝑆 ≈ 10
13
m-2 as a reasonable estimation in this case, giving 𝐴 ≈ 7×10²R m-2. For pure Al, Ngan et al. [S8]
measured a total dislocation density of 6.2×10²³ m-2 within a pillar of ~900 nm compressed along
the same direction as our samples after 4% strain. Hence taking 𝜌𝑆𝑆 ≈ 1012 m-2 in this case, it yields
𝐴 ≈ 4×10²I m-2. Note that these values have to be considered only as reasonable orders of
1000 100000.0
0.2
0.4
0.6
0.8
1.0 Pure Al Al-Sc cluster Al-Sc precipitate Al-Cu-Sn
Frac
tion
of p
last
icity
rele
ased
by
wild
fluc
tuat
ions
, W
Diameter, L (nm)0.1 1 10
0.0
0.2
0.4
0.6
0.8
1.0
Pure Al Al-Sc cluster Al-Sc precipitate K=0.25
Frac
tion
of p
last
icity
rele
ased
by
wild
fluc
tuat
ions
, W
k-1, or C/D
Figure S3. The evaluation of W and X/Y based on the force-rate signal. (a) The external size effect on the degree of wildness Z, and (b) the relationship between Z and the power law exponent [ − 1, or 7/'. The curves in (a) and (b) are in close agreement with Fig. 4a and Fig. 4b (0 = 0.25).
(a) (b)

36
magnitude, to give illustrative examples of the signals generated by our model.
The illustrations of mobile dislocation density evolution are shown in Fig. S4, where the signals
transform from essentially Gaussian for Al-Sc precipitate (𝐶/𝐷 ≈ 7) to a strongly intermittent one
for pure Al (𝐶/𝐷 ≈ 0.5), as in our experiments.
Figure S4. Evolution of the mobile dislocation density throughout deformation simulated by our model. Taking C and D values for mild 3500 nm-sized Al-Sc precipitate micro-pillar (a) and wild 2000 nm-sized pure Al micro-pillar (b) estimated from section 6.2.2 in the main text. The steady-state mobile dislocation densities are roughly estimated in section 6.4, and should be considered as reasonable orders of magnitude for simple illustrations only. References [S1] Clauset A, Shalizi CR, Newman MEJ. Power-Law Distributions in Empirical Data. Siam. Rev. 51, (2009)
661-703. [S2] Friedman N, Jennings AT, Tsekenis G, Kim J-Y, Tao M, Uhl JT, Greer JR, Dahmen KA. Statistics of Dislocation
Slip Avalanches in Nanosized Single Crystals Show Tuned Critical Behavior Predicted by a Simple Mean Field Model. Phys. Rev. Lett. 109, (2012).
[S3] Greer JR, Oliver WC, Nix WD. Size dependence of mechanical properties of gold at the micron scale in the absence of strain gradients. Acta Mater. 53, (2005) 1821-1830.
[S4] Zhang J, Liu G, Sun J. Strain rate effects on the mechanical response in multi-and single-crystalline Cu micropillars: Grain boundary effects. Int. J. Plasticity. 50, (2013) 1-17.
[S5] Higham DJ. An algorithmic introduction to numerical simulation of stochastic differential equations. Siam. Rev. 43, (2001) 525-546.
[S6] Gilsing H, Shardlow T. SDELab: A package for solving stochastic differential equations in MATLAB. J. Comput. Appl. Math. 205, (2007) 1002-1018.
[S7] Weiss J, Ben Rhouma W, Richeton T, Dechanel S, Louchet F, Truskinovsky L. From Mild to Wild Fluctuations in Crystal Plasticity. Phys. Rev. Lett. 114, (2015).
[S8] Ng KS, Ngan AHW. Stochastic nature of plasticity of aluminum micro-pillars. Acta Mater. 56, (2008) 1712-1720.
Figure S9
0
1x10¹³
2x10¹³
3x10¹³
4x10¹³
5x10¹³
6x10¹³
7x10¹³
8x10¹³
0 0.1 0.2 0.3 0.4 0.5
Mob
ile d
islo
catio
n de
nsity
Strain
C/D=7
0
2x10¹⁴
4x10¹⁴
6x10¹⁴
8x10¹⁴
1x10¹⁵
1.2x10¹⁵
1.4x10¹⁵
1.6x10¹⁵
0 0.1 0.2 0.3 0.4 0.5
Mob
ile d
islo
catio
n de
nsity
Strain
C/D=0.5
Mob
ile d
islo
catio
n de
nsity
, (m
-2)
1
2
×1013
3
4
5
6
7
8
0
Strain0 0.1 0.2 0.3 0.4 0.5
2
4
6
8
10
12
14
16
Mob
ile d
islo
catio
n de
nsity
, (m
-2) ×1014
0 0.1 0.2Strain
0.3 0.4 0.5
(a) (b)