tami c. bond
TRANSCRIPT

1
Air Pollution and the Climate System:Sustainability Now and Later
Tami C. BondDepartment of Civil & Environmental Engineering
University of Illinois at Urbana-Champaign
Photo: NASA
ISTC Seminar SeriesOctober 13, 2009

2
Take-home messages
Many pollutants affect climate… it’s more than just the “greenhouse effect”
A broad portfolio of solutions is available… “when” and “where” are considerations
Small sources matter, especially when emissions depend on process
3
Outline
1. Human effects on earth’s radiation balance Greenhouse gases; bright & dark particles
2. A special case: carbon particlesThe role of small sources
3. Balancing near-term and long-term goals“Sustainability now and later”

4
1. Overview
Human effects on earth’s radiation balanceGreenhouse gases; bright & dark particles

5
Our fire dilemma: we like it, and we don’t like it
Benefits: Warmth Sterilization/preservation Process heat Power Mobility Camaraderie Mysticism
Hazards: Poor air quality Health damages Global change

6
Both complete & incomplete combustion affect the environment
Particulate Matter (PM)
Othergases *
Carbondioxide (CO2)
Indoorair pollution
Outdoorair pollution(smog, ozone, poor visibility)
Climatechange
* Products of incomplete combustion (PICs):Carbon monoxide (CO),Methane (CH4), Volatile organic compounds (VOCs)

7
Many pollutants result in global change
Radiative forcing (W/m2)
warmingcooling
Source:IPCC,2007

8
Photo: V. Ramanathan

9
Photo: NASA (via Robert Charlson)
Aerosol emissions changing the Earth’s reflectivity

10
I’ll contrast three different combustion products.
``
3. combustion-climate links
Other products affect climate also: N2O, ozone, non-soot carbon particles…
O=C=O
Carbon dioxide Sulfate aerosol Soot aerosol
image:Cardiff Univ.

11
These combustion products have different sources & lifetimes.
Carbondioxide
3. combustion-climate links
Sulfateaerosol
Sootaerosol
Emissioncause
Fuel quantity,carboncontent
Sulfurin fuels
Poorcombustion
Emissionrate(metric tonne/year)
6.4billion(2000)
70million
(1995, as S)
8million(2000)

12
The three combustion products have different atmospheric lifetimes & effects.
3. combustion-climate links
Carbondioxide
Sulfateaerosol
Sootaerosol
Lifetime ~100 yrs ~ 4 days ~ 5-7 days
Effect of1 kg onenergy balance
~1 watt/g
~-200 watt/g
~1800 watt/g
Confidence High Medium Low

13
Changing each has different implications.
3. combustion-climate links
Possiblesolutions
Energy withless carbon
Fuel withless sulfur;end-of-pipe
controls
Improvecombustion;end-of-pipe
controls
Carbondioxide
Sulfateaerosol
Sootaerosol
Effect ofchange
Increase:Warming (etc.)
Decrease:Cooling (etc.)
Decrease:Warming (etc.)

14
Implication (1) Radiative forcing (W/m2)
warmingcooling
Source:IPCC,2007
Some of the expected warming due to greenhouse gases has been masked by reflective particles.
(Ocean adjustment is another reason for unrealized warming)

15
Implication (2)
Removing reflective aerosols will increase warming.
This is happening because of air quality policies.
There is some concern that the climate system will proceed past “tipping points.”
Source: Ramanathan and Feng, PNAS (105), 14245

16
GHGs are a poor measure of climate impactwhen products of incomplete combustion are high
100-
year
GW
P10
0-ye
ar G
WP
Bond, Venkataraman and Masera, ESD, 2004Thought process initiated by Smith et al, AREE, 2000
For residential biofuel, climate forcing by products of incomplete combustion is greater than that of greenhouse gases
Many pollutants affect climate… it’s more than just the “greenhouse effect”

17
2. Carbon particles, a special case…
…and the role of small sources

18
Black carbon – a warming particle
Scattering particle
Light is reflected
away from Earth.
Absorbingparticle
Light is absorbed and turned into heat.
Most particles cool the climate system
Black carbon warms it, so…
Black carbon ↓ = Warming ↓
Both warming particles & cooling particles are emitted together!

19
0.1% 6.5% 3.8% 1.1%0.2%
0.8%
19.0%
68.5%
Controllable emissions are dominated by transport & residential solid fuel
Open burning
41%
Residential: Biofuel18%
Residential: Coal4%
Residential: Other1%
Transport: Non-road
9%
Transport: Road16%
Industry11%
Power0%
Black carbon (BC) Organic carbon (OC)
Year 2000 estimates (Bond et al., GBC 2007 + updates for IPCC AR5)

20
Expected sources of black carbon (BC)
Fraction "contained"
% of global "contained"0% 25% 50% 75% 100%
North America
Central/South America
Europe, Former USSR
Asia, Middle East, Pacific
Africa
Total
PowerIndustryTransport: RoadTransport: Non-roadResidential: OtherResidential: CoalResidential: Biofuel
Bond, Streets et al., JGR 109, D14203, doi:10.1029/2003JD003697
BC from solid fuels in residential sector BC from industry BC from transportation/diesel
developmentpath
Note: Energy-related only– excludes open burning (~equal)

21
General rule about BC+OC emitters(for energy-related sources)
Emitter size
For large actors, poor efficiency = greater financial lossesimproved technology or controls are relatively more affordable
More fuel consumed
Greater efficiency
Reporting requirements more stringent
More information
More emissions per fuel
High emissions
from small
sources with little
information
22
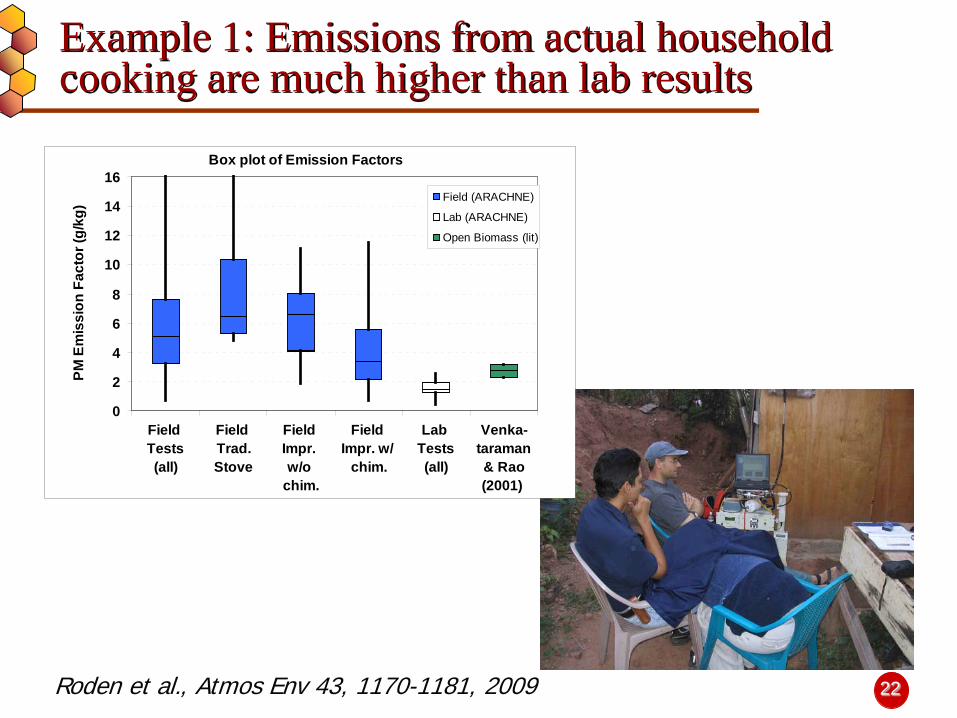
Example 1: Emissions from actual household cooking are much higher than lab results
Box plot of Emission Factors
0
2
4
6
8
10
12
14
16
Field Tests(all)
Field Trad.Stove
Field Impr. w/o
chim.
Field Impr. w/
chim.
Lab Tests(all)
Venka-taraman& Rao(2001)
PM E
mis
sion
Fac
tor (
g/kg
) Field (ARACHNE)
Lab (ARACHNE)
Open Biomass (lit)
Roden et al., Atmos Env 43, 1170-1181, 2009

23
Example 2: High-emitting vehicles contribute a lot to present-day emissions…
0 20 40 60 80 1000
0.2
0.4
0.6
0.8
1
Opacity
Frac
tion
of d
ata
Truck (200)Truck (26)
roadside inspection
lab –dynamometer tests
Subramanian et al., ES&T, 2009Winijkul et al., in prep
They are severely undersampled
in testing programs
24
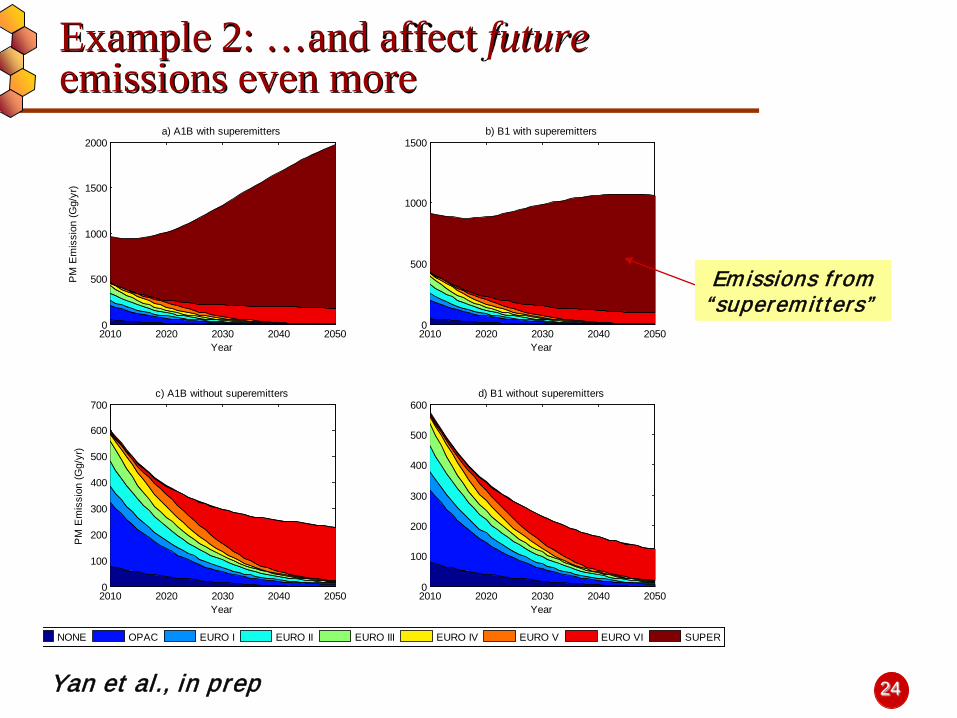
Example 2: …and affect future emissions even more
2010 2020 2030 2040 20500
500
1000
1500
2000a) A1B with superemitters
Year
PM
Em
issi
on (G
g/yr
)
2010 2020 2030 2040 20500
500
1000
1500
Year
b) B1 with superemitters
2010 2020 2030 2040 20500
100
200
300
400
500
600
700
Year
PM
Em
issi
on (G
g/yr
)
c) A1B without superemitters
2010 2020 2030 2040 20500
100
200
300
400
500
600
Year
d) B1 without superemitters
NONE OPAC EURO I EURO II EURO III EURO IV EURO V EURO VI SUPER
Yan et al., in prep
Emissions from“superemitters”
25
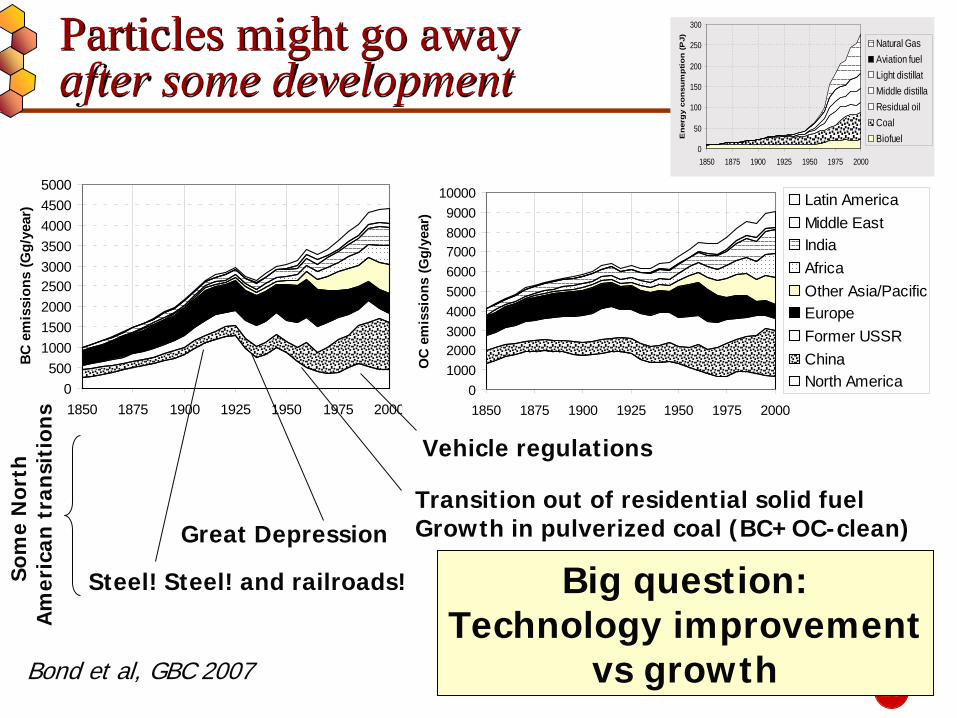
Particles might go awayafter some development
Bond et al, GBC 2007
0500
100015002000250030003500400045005000
1850 1875 1900 1925 1950 1975 2000
BC e
mis
sion
s (G
g/ye
ar)
0100020003000400050006000700080009000
10000
1850 1875 1900 1925 1950 1975 2000O
C em
issi
ons
(Gg/
year
)
Latin America Middle East India Africa Other Asia/PacificEurope Former USSR China North America
Great DepressionTransition out of residential solid fuelGrowth in pulverized coal (BC+OC-clean)
Vehicle regulations
Steel! Steel! and railroads! Big question:Technology improvement
vs growth
Som
e N
orth
A
mer
ican
tra
nsit
ion
s
0
50
100
150
200
250
300
1850 1875 1900 1925 1950 1975 2000
En
erg
y co
nsu
mp
tio
n (
PJ) Natural Gas
Aviation fuelLight distillatMiddle distillaResidual oilCoalBiofuel

26
Carbon particles: summary
Particulate Matter (PM)
Othergases
Carbondioxide (CO2)
Sectors & fractions of sectors: low CO2 but high black carbon Household solid fuel
(cookstoves) High-emitting diesels
Have significant contributions to climate-warming particles & gases But not on the climate-
change radar
Small sources matter, especially when emissions depend on process
27
3. Sustainability – when?
How do we manageclimate change now
vsclimate change later?

28
A devilish dilemma!
Reducing sulfur (cooling) emissions is… GOOD for health (immediate benefits) BAD for climate
(removes “mask” from warming)
Some “climate tipping points”look close
2007 Arctic sea ice, compared with median
Partial solution: Reduce emissions of warming air
pollutants?

29
Reductions in greenhouse gases & black carbon are different solutions to climate change
Greenhouse gases(lifetime = decades)
Will build up in the atmosphere
Reduced emissions affect atmospheric concentration slowly
Affect snow and ice indirectly, by warming ocean & atmosphere
Black carbon(lifetime = days to weeks)
Will vanish eventually Reduced emissions
affect atmospheric concentration immediately
Can melt snow and ice directly, by changing their reflectivity
Long-term management challenge Possible “quick-fix” contribution
30
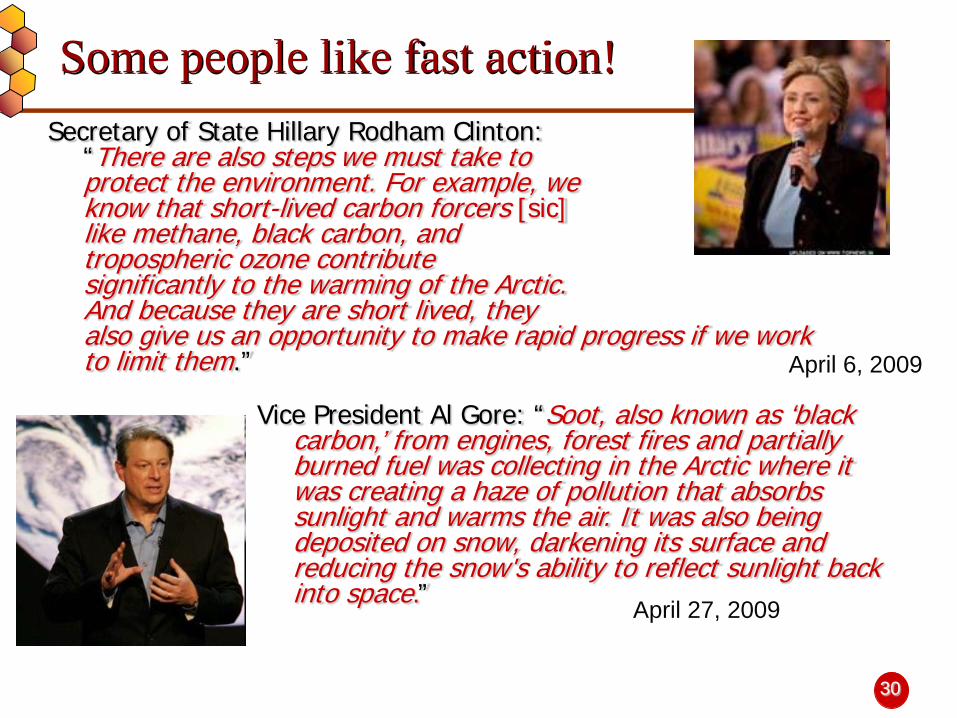
Secretary of State Hillary Rodham Clinton: “There are also steps we must take to protect the environment. For example, we know that short-lived carbon forcers [sic] like methane, black carbon, and tropospheric ozone contribute significantly to the warming of the Arctic. And because they are short lived, they also give us an opportunity to make rapid progress if we work to limit them.”
Vice President Al Gore: “Soot, also known as ‘black carbon,’ from engines, forest fires and partially burned fuel was collecting in the Arctic where it was creating a haze of pollution that absorbs sunlight and warms the air. It was also being deposited on snow, darkening its surface and reducing the snow's ability to reflect sunlight back into space.”
April 6, 2009
April 27, 2009
Some people like fast action!

31
Questions TO YOU:
How might we manage human impacts on climate in the near-term versus long-term?
How might we balance positive and negative steps toward sustainable energy use? example: Improve health but warm climate

32
Take-home messages
Many pollutants affect climate… it’s more than just the “greenhouse effect”
A broad portfolio of solutions is available… “when”, “where” and “who” are considerations
Small sources matter, especially when emissions depend on process

33
Questions?