takashi yamano foundation for advanced studies …yamanota/schoolingfasidwp.pdffasid discussion...
TRANSCRIPT
FASID Discussion Paper Series on International Development Strategies No. 2003-006
WORKING-AGE ADULT MORTALITY AND PRIMARY SCHOOL ATTENDANCE IN RURAL KENYA
Takashi Yamano Foundation for Advanced Studies on International Development, Japan
T. S. Jayne
Michigan State University, USA
November 2003
Foundation for Advanced Studies on International Development
WORKING-AGE ADULT MORTALITY AND PRIMARY SCHOOL ATTENDANCE IN RURAL KENYA
Takashi Yamano and T. S. Jayne
Abstract
The rapid increase in adult mortality due to the AIDS epidemic in sub-Saharan Africa raises great concern about its impact on child welfare. This article estimates the impact of AIDS-related adult mortality on primary school attendance in rural Kenya using a panel of 1,266 households surveyed in 1997, 2000, and 2002. We find a strong correlation between working-age adult mortality and lagged HIV-prevalence rates at nearby sentinel survey sites. School attendance, especially for children in relatively poor households, is negatively correlated with lagged provincial HIV-prevalence rates. Children, especially girls in relatively poor households, are less likely to be in school directly prior to the death of an adult member than children in unafflicted households. By contrast, boys in relatively poor households are less likely to be in school after an adult death. The evidence indicates that rising adult mortality in rural Kenya is adversely affecting primary school attendance especially among the poor. However, these results measure only short-term impacts. Over the longer run, whether school attendance in afflicted household rebounds or deteriorates further is unknown. JEL classification: O12, O15, J10, Q12 Keywords: HIV/AIDS, Education, Kenya
1

1. INTRODUCTION
Education contributes to economic growth (Barro, 1991; Mankiew, Romer, and Weil,
1992). Rising education of the labor force has been identified as a primary ingredient in processes
of structural transformation and economic development (Johnston and Kilby, 1975;
Gabre-Madhin and Johnston, 2002). Education is a primary investment that the poor can make to
escape from poverty over the long run. Recognizing this, many governments and international
organizations put a high priority on education in their development agendas, such as the
Millennium Development Goals (United Nations, 2000).
The onset of the AIDS epidemic in the past two decades raises serious questions about long
term human capital development, including education, and the future quality of the workforce in
areas where the disease is particularly acute, such as in many countries of Africa. There is growing
concern over the effect of high AIDS-related adult mortality and illness on child welfare and the
disease’s effects on their potential over the long run to support themselves as adults and to
contribute to their countries’ development (UNICEF, 1999; Bell, Devarajan, and Gersbach, 2003).
Available empirical evidence indicates that school enrollment rates are lower among AIDS
orphans compared with non-orphans (World Bank, 1999; Ainsworth, Beegle, and Koda, 2002;
Case, Paxson, and Ableidinger, 2002). A long list of anecdotal case studies also supports this
evidence (Gachuhi, 1999; Nyambedha, et al., 2001; Guest, 2001; USAID, 2002). However, using
39 nationally representative data sets collected in the 1990s from 28 countries, mostly in
Sub-Saharan Africa, Ainsworth and Filmer (2002) show that the difference in enrollment rates
between orphaned and non-orphaned children varies greatly across countries and wealth levels
within a country. There are likely to be important conditioning factors affecting the relationship
between parent mortality and child schooling. 2

A major difficulty in measuring the impact of adult mortality, especially mortality
attributable to AIDS, is that it is caused by behavioral choices rather than by random events.
Individuals and households incurring adult mortality are more likely to display certain
characteristics. For example, especially in the early years of the epidemic in sub-Saharan Africa,
evidence suggests that men and women with higher education and income were more likely to
contract HIV than others because they were more able to attract potential sexual partners
(Ainsworth and Semali, 1998; Gregson, Waddell, and Chandiwana, 2001).1 If prime-age
mortality remains correlated with individual and household characteristics such as social status,
wealth, and mobility – which are also important determinants of school enrollment – failure to
control for these characteristics may generate biased estimates of the impact of adult mortality on
school attendance. However, it is possible to overcome this problem by estimating the effect of
adult mortality on school attendance of the same children over time, using child fixed-effects
models. To our knowledge, no study has yet applied child fixed-effects models to overcome this
problem.
The purpose of this paper, therefore, is to identify the effect of adult mortality on school
attendance among primary-school age children (7 to 14 years) in rural Kenya. To address this
question, we first identify potential pathways by which adult mortality may affect child school
attendance and the timing of each pathway. Then, we estimate the impacts of adult mortality on
child school attendance in rural Kenya after stratifying sampled households and their children by
1 As information about HIV transmission spreads, however, it is believed that educated people are
more likely to change their behavior in ways that reduce their vulnerability to the disease
compared to less educated people.
3

wealth and gender. Kenya is one of the most heavily HIV-infected countries in the world: 13.5
percent of adults aged 15 to 49 are estimated to be living with HIV in June 2000 (NASCOP, 2001).
Two sources of data are used: a three-year nationwide panel data set of 1,422 rural
households, collected in 1997, 2000, and 2002, and secondary data on HIV-prevalence rates from
13 sentinel surveillance sites, collected annually between 1990 and 1999 by the National AIDS
and STDs Control Programme (NASCOP). The data are used to estimate the effect of
working-age adult mortality since the first survey on school attendance of children aged 7 to 14 in
the second and third surveys.
The study highlights three major findings: First, children’s school attendance is adversely
affected by the death of working-age adults among the bottom half of sample households ranked
by initial asset levels in 1997, but no significant effects are detected among households in the top
half of the asset distribution. Second, working-age adult mortality negatively affects school
attendance even before the death in poor households. The negative impact is larger among girls
than boys. This suggests that children, especially girls, are sharing the burden of caring for sick
working-age adults and/or that school fees tend to be among the first expenditures curtailed in
relatively poor households after one of their prime-age members becomes chronically ill. By
contrast, school attendance among boys in relatively poor households drops more sharply after the
adult member dies. Third, school attendance among the poor is negatively correlated with lagged
provincial HIV-prevalence rates, even after controlling for child fixed-effects. This result
suggests that AIDS is indirectly affecting child school attendance in ways other than through the
death of household members, or that unobserved time varying factors correlated with changes in
HIV-prevalence rates are impeding school attendance.
4

The next section of the paper describes the sample and panel data used in the analysis.
Section 3 presents the conceptual framework and some descriptive analyses. Estimation strategies
and variables are discussed in Section 4. Estimation results are in Section 5, followed by
conclusions in Section 6.
2. DATA
2.1. Working-age Adult Mortality
The study uses a three-year panel of rural household surveys in 1997, 2000, and 2002. In
April 1997, a total of 1,578 households were randomly selected from 24 districts within the eight
agriculturally-oriented provinces of the country. The sampling frame for the surveys was prepared
in consultation with the Central Bureau of Statistics and implemented by the Tegemeo Institute of
Egerton University. We exclude two pastoral districts (40 households) that differ substantially
from other zones and had high rates of attrition. Thirty-eight households having farm sizes greater
than 20 acres were also excluded, to maintain the study’s focus on small-scale households. Of the
1,500 remaining households, 1,422 households were able to be re-interviewed in 2000, and of
those, 1,266 households were re-interviewed in 2002 (Table 1).2
When enumerators re-visited the 1997 sampled households in 2000 and 2002, they asked
the whereabouts of each individual in the demographic roster of the 1997 survey. If the household
contained new members not listed in the 1997 survey, the enumerators added the new members’
names in the demographic roster, obtained socio-demographic information on these individuals,
2 Please see Yamano and Jayne (2003) for detailed discussions on the sample and analyses on the
impacts of adult mortality on household composition, farm production, and assets.
5

and included them in the roster for subsequent surveys. Similar information was recorded for
members in 1997 who were no longer residents of the household in 2000 or 2002. Through this
process, information was obtained on individuals who had passed away since the preceding
survey.
Our analysis focuses on adults between the years of 15 to 54 for men and 15 to 49 for
women because these correspond to the age ranges reported by the World Health Organization for
HIV prevalence, and are the age ranges hardest hit by the disease (NASCOP, 2001). Between the
1997 and 2000 surveys, 84 adults in these age ranges (which we hereafter refer to as
“working-age” adults for shorthand) passed away among the 1,422 sampled households. In the
2002 survey, we found 42 additional cases of mortality in these age ranges among the 1,266
households since the 2000 survey. Thus, the total number of deceased working-age adult members
is 126. Of those, about 36 percent were found in Nyanza province, where only 12 percent of the
sampled households reside.
In Nyanza province, the survey covered three districts: Kisumu, Siaya, and Kisii districts.
In Kisumu and Siaya districts, 23.7 percent of the sampled households experienced at least one
working-age adult death since the 1997 survey. In Kisii district, which is farther away from the
main highways, more rural, and culturally different from the Luo dominated areas of Kisumu and
Siaya, only 4.7 percent of sampled households had experienced at least one working-age death
since the 1997 survey (Table 1, column C). These differences in death rates across districts are
broadly consistent with the differences in HIV-prevalence among pregnant women testing
HIV-positive at urban sentinel surveillance sites in these district (Table 1, column F).
In Kisumu city, the third largest city in Kenya and the capital of Nyanza province, about 22 percent
of pregnant women tested HIV positive at a sentinel-surveillance site from 1990-94. The five-year 6
period of 1990-94 is matched with the survey data over the 1997-2002 period to reflect the 6-10
year average survival time after HIV sero-conversion as noted by epidemiological studies in the
region (Whitworth et al., 2003; Todd, 2003).
Kisumu and Siaya districts are well connected to Kisumu city with busy highways that also
connect Kisumu with Nairobi to the east and with Kampala, Uganda, to the west. Along highways
in Kenya, especially the Trans-Africa Highway that connects Mombasa with Kampala via Nairobi,
high HIV-seroprevalence rates have been found among high-risk people, e.g., truck drivers and
commercial sex workers (Carswell, Lloyd, and Howells, 1985; Mbugua et al., 1995). HIV appears
to spread into rural communities from truck stops via interactions between high-risk people and
local people, including adolescents who interact with high-risk people (Nzyuko, et al., 1997).
Siaya district is also connected with Busia, a border city with Uganda, where about 20 percent of
pregnant women were found to be HIV positive at a sentinel surveillance site during 1990-94
(NASCOP, 2001).
Additional factors are believed to have contributed to a high HIV prevalence rate in
Kisumu and Siaya districts. Such factors include the relative importance of polygamous
households (which increases HIV transmission between a husband and wives), Luo peoples’
traditional practices, such as widow inheritance (which increases HIV transmission from a widow
to a new husband) and customs associated with fish trading (where sexual favors are common
among fishermen and women traders), and male non-circumcision (which increases men’s risk of
HIV infection per sexual contact).
By contrast, the district town of Kisii, which is further from the Trans-Africa Highway and
home to the Kisii ethnic group, only 3.6 percent of pregnant women tested HIV positive at a
sentinel surveillance site from 1990 to 1994 (NASCOP, 2001). Thus, the difference in the 7

numbers of working-age adult deaths between Kisumu/Siaya districts and Kisii district is
consistent with the difference between the HIV prevalence rates between districts. To examine
this point further, we estimate the association between lagged HIV-prevalence rate at the nearest
urban-sentinel-surveillance site and the probability of experiencing working-age adult death in
Section 5.
2.2. Primary School-Age Children Included in the Analyses
In the 2002 survey, respondents were asked about each household member’s schooling,
including the number of years spent in school prior to the survey and whether each child was
currently attending school. The results on school attendance in columns D and E of Table 1 are
taken from 2,565 and 2,107 children aged 7 to 14, who had yet to complete their primary school
education by the time of the 2000 and 2002 surveys, respectively. This sample includes children
who had left the sampled households since the 1997 survey. Excluding them from the final sample
may cause an under-estimation of the negative impact of adult mortality on school attendance
because it is more likely that children who left (or were sent away from) their households after
experiencing adult mortality were less likely to be attending school than those who remained in the
sampled households. In the 2000 and 2002 survey, enumerators asked about the schooling of
children listed on the 1997 survey even when the children had left the sampled households.
Among the 2,565 and 2,107 children in the 2000 and 2002 sample, 8.3 and 11.8 percent of children
left their households (either permanently or temporarily) since the 1997 survey, respectively.
Second, despite our efforts to keep track of all of the sampled households and individuals,
we lost some children in the final samples due to attrition. For instance, between the 2000 and
2002 surveys, we lost track of 345 children aged 7 to 14 years old. Out of the 345 children, 259 8

children are in the 156 households that could not be re-interviewed in 2002. If these households
suffered a higher incidence of working-age mortality between 1997 and 2002, we would have
sample selection bias when estimating the impact of working-age adult mortality on child
schooling. To examine this attrition bias, we include an attrition dummy variable in the estimation
models.
Finally, to maintain our focus on primary school enrollment, we exclude from the final
sample 28 and 96 children who were between 7 and 14 years old in 2000 and 2002, respectively,
because respondents indicated that they had already completed primary school prior to the
surveys.
3. Impact of Prime-age Adult Mortality on Schooling
3.1. Conceptual Framework
How does working-age mortality reduce child schooling? There are three main economic
factors influencing child school enrollment: (a) the financial costs of schooling, such as school
fees and books, relative to households’ resources; (b) the opportunity costs of children’ time; and
(c) the expected returns from school. The potential effects of working-age mortality on child
schooling depends on how working-age mortality affects these factors (World Bank, 1999).
First, medical expenditure associated with prolonged illness and eventual funeral costs
reduce the financial resources of the household (Barnett and Blaikie, 1992; Lundberg, Over, and
Mujinga, 2000). Depending on the household’s initial income and wealth and impact of death on
these variables, the household may withdraw children from school. Because afflicted households’
financial situation may not recover quickly after the death of the sick member, children’s school
attendance may be affected long after the death occurs. 9

Second, AIDS-related adult mortality is likely to negatively affect child schooling by
increasing the opportunity costs of children’s time. As one family member becomes chronically ill,
another household member (usually a female member and often an older girl) must devote more
time to care giving.3 As a result, a care-giving female member may need to reduce time devoted
to her usual activities. If a girl is expected to help care for the sick, she may stay home instead of
going to school. The increased demand for care-giving labor, however, will disappear if the sick
adult passes away.
The household also experiences an increased demand for labor previously provided by the
sick member. The way in which households adjust to internal labor supply shocks varies
according to the resources of the households. For example, households with sufficient income
may hire additional workers to meet residual labor needs. Some afflicted households are able to
attract additional members to at partially offset the loss of another member (Beegle, 2003;
Ainsworth, Ghosh, and Semali, 1995). Households that are poor and/or face high opportunity
costs on their scarce resources may be most vulnerable to calling upon their children to discontinue
school to provide labor to the household after an adult passes away. An increased demand for
labor among non-sick members will not disappear even after the death of the sick member.
Third, because of its effect on life expectancy, HIV/AIDS in high-prevalence countries
may alter individuals’ time preference for money (McPherson, 2001). Life expectancy in Kenya
3 For instance, Ainsworth and Dayton (2003) found a decline in Body Mass Index among elderly
in non-poor households after an adult death. They suggested that the decline could be explained
by a diversion of household resources to the medical care and/or increased demands on the time
of elderly to care for sick AIDS patients in non-poor households.
10

in 1999, for instance, is 48 years, compared to 58 years in 1993 (World Bank, 1995; 2002). Part
of the decline in life expectancy is due to increased infant mortality caused by mother-to-child
HIV infection, yet there is still a considerable decline in the expected years of work among young
adults. The decline in the expected years of work is expected to change parents’ expectations
about the lifetime return from their children’s education both to themselves (e.g., intergenerational
transfers from children to parents in their old age) and to their children.
We lack suitable instruments to empirically distinguish the impacts of one factor from the
others. However, this conceptual framework provides some insight into the potential pathways by
which adult mortality may affect child schooling. We consider two hypotheses in particular. The
first hypothesis is that children in poor households are more vulnerable to working-age adult
mortality because of the first and second factors. To test this hypothesis we stratify the sample into
two groups based on households’ initial asset levels and compare model results for both groups.
According to this hypothesis, we expect to find larger impacts of working-age adult mortality
among the relatively poor half of the sample than the less-poor half.
The second hypothesis is that adult mortality affects boys and girls differently. In Kenya,
as in most parts of eastern and Southern Africa, girls tend to assume more care giving
responsibilities than boys (Opiyo, 2001). Thus, if the second pathway is important, we expect to
find a larger negative impact on girls’ schooling than that of boys prior to adult mortality. Thus,
we also stratify the sample by gender.
AIDS may affect child schooling not only through direct impacts on afflicted households
but also through community effects. For instance, areas with high HIV prevalence rates suffer
reduced profitability of businesses such as commercial farms, outgrower schemes, and non-farm
businesses relying on wage labor (e.g., Fox et al., 2003; Rugalema, 1999). Reduced economic 11

profitability may translate into wage job contraction, fewer economic opportunities, and lower
household incomes in such areas, which may indirectly affect children's school attendance. For
these reasons, studies measuring the effects of AIDS on child schooling only through the pathway
of how afflicted households themselves respond may underestimate the actual impact of the
disease.
3.2. Descriptive Analysis
Based on data collected from the 2000 and 2002 surveys, we categorize children in the
sample according to whether they incurred the death of a working age adult in their household in
either of the two survey intervals: September 1997- May 2000 and May 2000 – May 2002. In the
following discussion, we call the interval between the 1997 and 2000 surveys as the first period
and the interval between the 2000 and 2002 surveys as the second period.
In Table 2, we group children by whether they suffered the death of a working-age adult in
their household in either the first or second period. Among these different groups of children,
Table 2 shows differences in school attendance rates, years of schooling, age, and numbers of
sample children in each category.
Overall mean attendance rates4 are 89.7 and 88.3 percent in 2000 and 2002, respectively.
But among children who experienced working-age adult mortality in the first period (Table 2,
column C and D), the mean attendance rate declines from 91.1 percent in 2000 to 81.6 percent in
2002. Thus, we find a larger decline in enrollment rates among children who experienced the
4 Throughout this paper, we use the “attendance” to signify whether the child was actually in
school, as opposed to “enrollment,” which does not necessarily imply regular presence in school.
12

mortality than children who did not. This suggests that children are dropping out of school, after
experiencing adult mortality in their households. When we stratify the sample into two groups
ranked by initial value of productive assets – hereafter, poor and non-poor -- we find a larger
decline in enrollment among the poor (from 86.4 to 72.1) than non-poor (from 94.5 to 86.6).
On the other hand, children who experienced working-age adult mortality in the second
period (between 2000 and 2002) were less likely to be in school in 2000 (i.e., before the death
occurred) than in 2002 (Table 2, column E and F). The average attendance rate jumps from 70.0
percent in 2000 to 89.6 percent in 2002, after experiencing the adult mortality. This increase in
attendance is much more drastic among the poor than non-poor. Low attendance rates in 2000
may reflect a combination of the added burden on children to care for the ill member in the first
period, prior to the adult mortality, and/or to provide labor activities formerly performed by the ill
member.
Comparing the years of schooling completed by children, we note that children in poor
households who incurred a working-age adult mortality during the second period have
significantly less schooling, 1.90 years, in 2002 (Column F) than children who did not experience
any working-age adult mortality, 2.66 years, (Column B), although their average ages are very
similar. This suggests that children who experienced working-age mortality in the second period
had delayed enrollment or dropped out temporarily from school, possibly to take care of ill
members. This could explain why we find a relatively low attendance rate in 2000 but a high
attendance rate in 2002 among children who experienced working-age mortality in between 2000
and 2002 (the second period).
The findings in Table 2 suggest a process described in Figure 1. When an adult starts to
become ill from AIDS, the probability drops that a school-age child will attend school. Because 13

medical expenses tend to rise at the same time that earnings from the sick member declines, we
expect that adjustments in school enrollment will be greater for relatively poor households. After
the death of the sick member, the child’s likelihood of being in school rises because care giving
needs have subsided. However, depending on whether the household has been able to attract
additional labor to take over tasks formerly handled by the deceased, the opportunity cost of
children’s labor may still be perceived to be too high to warrant an immediate return to school.
Relatively poor afflicted households may also be less able to continue incurring school fees. By
contrast, children in better-off households are less subject to a dramatic “down-up-down”
movement, because of their households’ greater ability to draw upon savings and assets to
maintain desired expenditures in the face of economic shocks.
The picture emerging from Table 2 and Figure 1 are only bivariate associations, which may
be spuriously driven by regional differences or household characteristics. Thus, to measure the
differences in enrollment rates due to adult mortality, holding other factors constant, we need to
employ multivariate techniques. In addition, because HIV infection is influenced by behavioral
choices of household members, the possible correlation between working-age adult mortality and
unobserved factors in schooling also needs to be controlled for.
4. Estimation Strategies and Variables
Our estimation procedure followed four steps described below. We first develop a working-age
mortality model to identify factors associated with children experiencing the death of a
working-age member in their household over the entire survey period. Next, we estimate primary
school attendance models to examine the effects of mortality on schooling both before and after
the timing of the death. Lastly, to examine the robustness of the findings after controlling for 14
time-invariant unobserved effects, we estimate household- and child- fixed effects conditional
logit models of child school attendance.
4.1. Estimation Strategies
The Working-Age Adult Mortality Model
Before estimating the impact of working-age adult mortality on schooling, we first
estimate the determinants of children’s experience of working-age adult mortality in the first
period (1997-2000). We focus on the first period because the sample in the first period has a less
severe attrition problem than the second period. To examine a relationship between the
lagged-HIV prevalence rate and sample attrition, we include a dummy variable for attrition, Ait.
The attrition variable, Ait, equals one for children whose information is not available in 2002. Thus,
the working-age adult mortality model is
Di1997-2000 = φHIV HIVj 1990-94 + φA Ait + φX Xit + e it (1)
where Di1997-2000 is a dummy variable that takes one if child i experienced working-age adult
morality in 1997-2000; HIVj 1990-94 is the average lagged-HIV-prevalence rate in at the nearest
surveillance site in 1990-94; and Xit is a vector of child, household, and regional characteristics.
We estimate this model with Probit. Because of a long asymptomatic period, we include the
lagged-HIV prevalence information from the period of 1990-1994. By estimating φHIV and
establishing the relationship between working-age adult mortality and the lagged HIV-prevalence
rate, we can examine the extent to which working-age mortality found in the panel data are
influenced by HIV/AIDS.
The Primary-School Enrollment Model 15
The economic theory and estimation models on schooling have been discussed in
numerous papers (Strauss and Thomas, 1995; Glewwe, 2002). Following previous studies, we
write a simple equation of a school enrollment model as:
Sit = βHIV HIVjt-K + βD Dit + βX Xit + u it (2)
where Sit is a dummy which takes one if child i is enrolled in school at time t; other variables are
as defined as before. The lagged-HIV prevalence rate at the nearest surveillance site is expected
to pick up broader community effects of the AIDS epidemic on child school attendance (separate
from the direct effect via afflicted households). However, the lagged HIV-prevalence rate could
be correlated with many regional characteristics. For instance, we know from previous studies
that HIV prevalence rates tend to be high in areas with major trunk roads where there is a steady
influx of outsiders. Thus, we should be cautious when we interpret the results on this variable.
We match the lagged mean HIV-prevalence information from 1990-1994 (1992-1996) with the
observations of the 2000 (2002) survey because of the 6-10 year average survival time after HIV
sero-conversion (Whitworth et al., 2003; Todd, 2003).
Before proceeding, we clarify the notation for survey periods. In the first period (1997 to
2000), which we call t=1, the schooling dummy (Si1) indicates whether child i is in school at the
time of the 2000 survey. Analogously, Si2 indicates whether child i is in school at the time of the
2002 survey. The working-age adult mortality dummy, Di1 (Di2) indicates whether child i resides
in a household experiencing at least one working-age death in the period between the 1997 and
2000 (2000 and 2002) surveys.
We also want to ascertain whether children’s school attendance is affected prior to and/or
after the occurrence of a death. This is because the impact of the adult mortality may manifest long
before the member actually dies, as discussed in Section 2. We therefore include two categorical 16
variables in the models to account for time of death relative to the observations on child schooling.
The post-mortality variable (Dit-1), indicates that child i’s household experiences a working-age
death in the period prior to the observation on schooling. For instance, if a child experiences a
working-age death in the household in the first period, the post mortality variable (Dit-1) takes a
value of one in the second period and zero in the first period. The pre-mortality dummy variable,
on the other hand, indicates that child i experiences a working-age adult death in the next period.
For instance, if a child experiences a working-age death in the household in the second period,
then the pre-mortality variable (Dit+1) takes a value of one in the first period and zero in the second
period.
Finally, we also include the attrition dummy variable in Equation 2 to test whether the
sample attrition problem may cause an attrition bias in model estimation. If the attrition variable
is not significant, then the result indicates that the children whose information is missing in 2002
are not statistically different from other children, after controlling for observed information. This
test is proposed by Fitzgerald, Gottschalk, and Moffitt (1998) and used by others, e.g., Alderman
et al. (2001).
Thus, the estimated schooling equation is
Sit = βHIV HIVjt-K + βD Dit + βpost Dit-1 + βpre Dit+1 + βA Ait + βX Xit + u it (3)
We use pooled data from the 2000 and 2002 surveys in this probit estimation. As discussed in
Section 2, the sample is stratified into two groups ranked by initial wealth in 1997, and by gender,
to obtain better understandings on the pathways that the adult mortality affects the child schooling.
Lastly, we re-estimate Equation 3 using fixed effects. Household fixed effects models
purge the potential correlation between working-age adult mortality variables and unobserved
household-fixed effects from the estimates while still being able to estimate the effects of 17

child-specific characteristics, such as relationship to the household head. Further, we can purge
child-fixed effects from the estimates by using the child-fixed effects model. We estimate these
fixed effects models with conditional logit models.
When estimating Equation 3 with the household- or child-fixed effects model, we cannot
include time-invariant variables. In addition, we need to exclude one of the three working-age
adult mortality variables (pre-, during-, and post-) because we have only two observations for each
child. Therefore, we exclude Dit from Equation 3 when we estimate the household- or child-fixed
effects model. The pre- and post-mortality variables in the child-fixed effects model measure the
difference in probabilities of the same child being in school depending on whether he or she
experiences the working-age adult mortality before or after the observation on school.
4.2. Variables
As discussed in Section 2, we have excluded children who had already completed primary
school. Thus the dependent variable, Sit, is an indicator of whether a child is attending a primary
school who is eligible for enrollment. The dummy variable on working-age mortality, D t, equals
one if there is at least one working-age adult death in a household during a period t. The
HIV-prevalence variable, HIVj t-K, is the average ratio of pregnant women who visited the nearest
urban sentinel surveillance site and tested HIV positive during the five-year period from 1990-94
for the 2000 samples and from 1992-96 for the 2002 samples. Data from 11 such sites, maintained
by the National AIDS and STDs Control Programme (NASCOP), were matched at the
district-level to all households in the sample (Appendix Table A2). While unobserved time
invariant effects are controlled for using child fixed-effects models, it is still possible that the
lagged HIV-prevalence term may be picking up the effects of time variant unobservables. With
18

this caveat, we include lagged HIV-prevalence rates in the models to account for broader
community level effects of AIDS on child schooling.
We also include an attrition variable equalling one for 345 children whose information is
not available in 2002 either because their households were not interviewed in the 2002 survey (75
percent of the 345 children) or they could not be identified by the respondents in their households
(25 percent). The descriptive statistics of these and other variables are presented in Appendix
Table A1.
Child characteristics include the age of the child, its squared term, and a gender dummy
variable for girls. We also include two dummy variables indicating whether the child’s
relationship to the household head is as a grandchild, nephew, or niece, or as a distant relative or
a non-relative who lives in the household.
Because the effects of working-age mortality are potentially devastating, household
characteristics that are usually considered exogenous or fixed in most household models could be
rapidly and severely affected by adult mortality. Because of this, we feel it is inappropriate to
include in the models current values of variables such as asset levels, family size, or landholding
size. For this reason, we use household characteristics based on values from the initial 1997
survey. These household characteristics are the years of schooling for the most educated person in
the household in 1997; a binary variable for polygamous households; a binary variable for
female-headed households in 1997, the acres of land owned in 1997 in logs; and the value of asset
holdings in 1997 in logs.
We also include two community variables designed to control (albeit imperfectly) for access to
markets and services, and interactions outside the village community: distance of the village to the
nearest bus/taxi stop, and distance to the nearest piped water outlet. Finally, five provincial 19

dummies are included, with Eastern Province as the reference province.
5. Results
5.1. Determinants of Experiencing Prime-age Adult Mortality
We first discuss the results from Equation 1, the determinants of the probability of
experiencing at least one working-age adult death in the first and second periods. The binary
dependent variable, D1997-2000, equals one if a child resides in a household experiencing at least one
working-age adult death over this three-year period. Table 3, column A presents the results
without including the lagged-HIV prevalence variable.5 As expected from the results in Table 1,
children in Nyanza province are 8.5 percent more likely to experience working-age adult mortality
in their households than children in Eastern province (the reference group). Once the lagged
HIV-prevalence variable is included in column B, however, the estimated coefficient of Nyanza
province becomes smaller. This provides evidence that working-age adult mortality in Nyanza
province is strongly associated with HIV (and thus AIDS). The lagged-HIV prevalence variable
is highly correlated with a child experiencing adult death in his/her household at the one percent
level of significance.6
5 We report the marginal probabilities in Table 3 and the following tables. For dummy variables,
the “marginal” probabilities are calculated by changing the value of dummy variables from zero to
one, holding other variables constant at their sample means.
6 When we tried the current HIV prevalence rate from 1995-99 instead of the lagged HIV
prevalence rate from 1990-94, the size of the estimated coefficient declined to 0.321 (t-stat =5.19)
from 0.487 (t-stat=5.22). Thus, the lagged HIV prevalence rate is better correlated with the
20

On the attrition variable, we find a positive correlation between the attrition variable and
the probability of experiencing the adult mortality. Thus, this indicates that the attrition did not
occur randomly and suggest a possibility of an attrition bias in the next model where we use the
pooled data from the 2000 and 2002 surveys. As far as the results in Table 3 are concerned, we do
not need to worry about the attrition bias because we only use the cross-section data from the 2000
survey, before the attrition occurs.
Turning to the other variables in the model, we find that children who are away from bus
stops are less likely to experience adult mortality in their households. This is consistent with
previous studies that HIV-prevalence rates are relatively high along the major highways, as
discussed in section 2.2.
We also find that children in polygamous households have a lower probability of
experiencing working-age adult mortality than children in monogamous households. This could
be because we do not count polygamous husbands as household members unless the husbands
actually live in the sampled household for more than six months. On the other hand, an additional
male member in the household increases the probability of children experiencing working-age
adult mortality by 1.4 percent. By contrast, the number of female members does not significantly
affect the probability. Lastly, a household’s landholding size (in acres) positively influences the
probability of experiencing working-age adult mortality. This suggests that children who
experienced working-age adult mortality in the first period tend to be from households with
greater assets and socioeconomic status.
probability of experiencing the adult mortality than the current HIV prevalence rate as the
long-asymptomatic period suggests.
21

Overall, these results suggest a grave situation for children in rural Kenya in the near
future because HIV-prevalence rates among pregnant women at the sentinel surveillance sites
have increased between 1990 and 2000 in nine of the eleven urban-sentinel-surveillance sites
nationwide (NASCOP, 2001). A simple simulation based on the results in Table 3 indicates that
an increase in the HIV-prevalence rate from 5.0 percent to 13.5 percent (from the nationwide level
in 1990 to that in 2000) would increase the probability that a child experiences the death of a
working-age adult over next five years from 2.39 percent to 6.07 percent.7 Thus, unless there is
significant progress in reducing HIV prevalence rates, there will be a significant increase in the
number of rural children in Kenya faced with the death of a working age adult in their households.
5.2. Impact of Working-age Adult Mortality
In Table 4 and 5, we present the Probit results based on Equation 3. First, we estimate the
model for all children. Second, we stratified the sample into two groups based on the initial wealth
in 1997. Finally, we stratified the sample by gender (Table 5).
The HIV prevalence rate
The results in Table 4 indicate that the HIV prevalence rate at the nearest sentinel site
negatively influences children’s schooling among the poor (children in households whose total
asset value was below the median in 1997). A simple simulation based on the results among the
7 These probabilities are calculated after changing the value of the HIV prevalence variable from
one value to another, using mean sample values of all other variables except the HIV prevalence.
22

poor in Table 4 (column B) indicates that the probability of attendance decreases by 2.5 percentage
points from 92.1 percent to 89.6 percent when the HIV prevalence rate increases from 5.0 percent
to 13.5 percent (from the 1990 level to the 2000 level). We find no significant impact of the HIV
prevalence rate on child schooling among the relatively less poor.
The HIV prevalence rate may be capturing the indirect effects of the HIV/AIDS epidemic,
other than the direct household-level effects of adult mortality on schooling, because we already
include information on working-age adult mortality in the model. However, it is also possible that
the HIV prevalence rate and child school attendance are correlated through other regional factors.
The working-age adult mortality
Working-age adult mortality does not significantly influence children’s schooling at the
time of death. But it negatively affects children’s schooling before and after they experience
working-age adult mortality among the poor (column B in Table 4). When we stratify the sample
by gender, we find a larger negative impact of the pre-mortality variable among girls than boys in
poor households (column C and D in Table 5). This indicates that girls are likely to be taking care
of the sick members in the households prior to their deaths. The result indicates that girls in the
poor households are 15.1 percent less likely to be in school in a period prior to the adult mortality,
while boys are 12.4 percent less likely to be in school during the same period. The both estimated
coefficients are significant at the 10 percent level.
Among the boys, we find a strong negative impact of the post-mortality variable on
schooling (-0.258, t-stat = -3.62), especially among the poor. The result indicates that boys in the
23
poor households are 25.8 percent less likely to be in school for some time after a death of a
working-age member. This could be because boys are replacing the loss of family labor in farm
production or other income generating activities, or that school fees can no longer be afforded.
Even among the less-poor households, we find a negative yet much smaller and weaker impact of
the post mortality variable on boys’ schooling (-0.062 with t-stat=-1.64).
Fixed effects models
Next, we estimate various fixed effects models based on Equation 3 to determine the
effects of adult death on child school attendance (Table 6). Again, we estimate the model
separately for the poor and non-poor (columns B and C). We present the results from conditional
logit models with household-fixed effects and with child-fixed effects. Note, however, that only
observations with variations in the dependent variable within a group can be included for
estimations in conditional logit models. This is why there are fewer observations in the
conditional logit models. Especially when we stratify the sample by initial wealth, the number of
observations declines significantly and many estimators are no longer precisely identified. Thus,
we face a trade-off between the consistency and efficiency. Because of this trade-off, we use the
results in Table 6 mainly as a check for robustness of the results in Table 4 and 5.
The results in Table 6 indicate that even after controlling for the child-fixed effects, the
lagged HIV prevalence rate retains its significantly negative influence on schooling among the
poor. Thus, the lagged HIV-prevalence rate is not only representing the fixed relationship
between the lagged HIV-prevalence rate and schooling but also a relationship between a change in
the lagged HIV-prevalence rate and a change in schooling. We do not find any significant
influence of the lagged HIV-prevalence rates on school attendance among the non-poor. 24

Turning to the effects of a working-age adult death in the household, we find that children
in the relatively poor households are less likely to be in school in the one to two year period before
their households experience a working-age death. The household fixed effects models also
indicate that within the household, there is no significant difference in schooling between
household heads’ own children and grandchildren, nephews, and nieces. The only group of
children who are less likely to be in school compared with the household heads’ own children in
the same household is “non-relative” children who have distant relationships or no relationship
with the household heads. These results are similar to those found by Case, Paxson, and
Aleidinger (2002) and suggest that children are treated equally as long as they are living with their
close relatives. Unfortunately, because we do not know the orphan-status of all sampled children,
we cannot determine whether orphans are treated differently than non-orphans in their relatives’
households. However, there is likely to be some overlap between the “non-relative” category and
those children in the sample who are orphans.
6. Conclusions
A rapidly increasing mortality rate among adults due to the AIDS epidemic in sub-Saharan
Africa has raised concerns about intergenerational effects, including child education. Using a
panel of 1,422 households in rural Kenya, we first estimated the determinants of primary school-
aged children experiencing working-age adult mortality. We find a high correlation between
lagged HIV-prevalence at nearby urban sentinel surveillance sites and the probability that a child
aged 7 to 14 years experiences the death of a working-age adult in his or her household. The
lagged HIV prevalence rate is negatively correlated with primary school attendance, especially
among girls, and in relatively poor households (those whose initial asset levels at the time of the 25

first survey in 1997 were below the median) even after controlling for working-age adult mortality.
These findings may indicate that there are important community impacts of the HIV/AIDS
epidemic on schooling among the poor, although it cannot be ruled out that this variable is picking
up unobserved and unrelated factors correlated with these changes in HIV prevalence over time.
We also find that children, especially girls, in relatively poor households are less likely to
be in school in the period prior to the adult death in their household compared with children in
unafflicted households. In the 1-2 year period directly after the death of an adult, there is a
significant decline in the probability that boys in relatively poor households attend school. The
fact that we find larger impacts among the poor could be because households closer to the edge of
economic survival are forced to take more extreme measures to adjust to major shocks to their
livelihoods, even at the expense of long-run human capital development, than their neighbors.
Because they have fewer options, poor households appear more likely to reallocate their children’s
time from schooling to care-giving for sick adults or to providing labor to compensate for the lost
labor of the sick adult. However, because of this study spans only a few years, it is unclear
whether the effects on schooling as measured in this study are long-term or only temporary.
Because of limited capacity of local hospitals compared with the overwhelming number of
AIDS patients, most AIDS patients are taken care of at their homes in rural areas. Although
home-based care should be promoted to ease the burden on the medical system in rural areas,
children appear to be bearing part of the burden of taking care of the sick. Policies to reduce the
burden of taking care of the sick at home, such as improved community health care systems, may
have an added advantage of helping afflicted households keep their children in school.
In Kenya, primary school enrollment rates are high compared with neighboring countries.
Thus, it is quite possible that we would find much larger impacts of the working-age adult 26

mortality on the primary school enrollment in other countries. There is a need to deepen our
understanding on the impacts of adult mortality on child schooling in countries that are suffering
from the AIDS epidemic so that governments and donor institutions can determine the best use of
limited financial and human resources to mitigate the impacts of HIV/AIDS. Otherwise, there is
the risk that the AIDS epidemic may produce as yet unanticipated intergenerational consequences
on human capital development that might have been mitigated if understood and addressed earlier.
27

References
Ainsworth, M. and J. Dayton. 2003. “The Impact of the AIDS Epidemic on the Health of Older Persons in Northwestern Tanzania.” World Development 31 (1): 131-148. Ainsworth, M., K. Beegle, and G. Koda. 2002. “The impact of adult mortality on primary school enrollment in northwestern Tanzania.” African Region Human Development Working Paper Series, no. 23961, The World Bank, Washington DC. Ainsworth, M., and D. Filmer. 2002. “Poverty, AIDS and children’s schooling: a targeting dilemma.” World Bank Policy Research Working Paper 2885, World Bank, Washington D.C. Ainsworth, M. and I. Semali. 1998. “Who is most likely dies of AIDS? Socioeconomic correlates of adult deaths in Kagera Region, Tanzania.” In Confronting AIDS: Evidence from the developing world, ed. M. Ainsworth, L. Fransen, and M. Over. Brussels: European Commission. Ainsworth, M., Ghosh, S., Semali, I. 1995. “The Impact of adult deaths on household composition in Kagera Region, Tanzania.” Unpublished manuscript, Policy Research Department, World Bank, Washington, D.C. Alderman, H., J. Behrman, H. Kohler, J. Maluccio, and S. Watkins. 2001. “Attrition in longitudinal household survey data: some tests for three developing country samples.” Demographic Research, vol. 5: 78-124. Barnett, T., and P. Blaikie. 1992. AIDS in Africa: its present and future impact, Belhaven Press. Barro, Robert. 1991. “Economic growth in a cross section of countries.” Quarterly Journal of Economics, vol.106: 107-158. Beegle, K. 2003. “Labor Effects of Adult Mortality in Tanzanian Households.” World Bank Policy Research Working Paper 3062, World Bank, Washington D.C. Bell, C., S. Devarajan, and H. Gersbach. 2003. “Long Run Economic Costs of AIDS: Theory and Application to South Africa.” Report posted on Development Gateway; url: http://www.developmentgateway.org/node/130640/dg-contribute/item-detail?item%5fid=341185&version%5fid=204458&from=alert Carswell, J.W. G. Lloyd, and J. Howells. 1989. “Prevalence of HIV-1 in East African lorry drivers.” AIDS, 3:759-761. Case, A., C. Paxson, and J. Aleidinger. 2002. “Orphans in Africa.” NBER Working Paper Series No 9213, National Bureau of Economic Research, Cambridge, MA. Fitzgerald, J., P. Gottschalk, and R. Moffitt. 1998. “An analysis of sample attrition in panel data.” The Journal of Human Resources, vol. 33: 251-299. 28

Fox, M., S. Rosen, W. MacLeod, M. Wasunna, M. Bii, G. Foglia, and J. Simon. 2003. “The Impact of HIV/AIDS on Labor Productivity in Kenya.” Draft discussion paper, Center for International Health and Development, Boston University, Boston. Gabre-Madhin, E., and B.F. Johnston. 2002. “Accelerating Africa’s Structural Transformation: Lessons from East Asia.” In Perspectives on Agricultural Transformation: A View from Africa, ed. T.S. Jayne, G. Argwings-Kodhek, and I. Minde, New York: Nova Science. Gachuhi, D. 1999. “The Impact of HIV/AIDS On Education Systems in The Eastern and Southern Africa Region and the Response of Education Systems to HIV/AIDS: Life Skills Programmes.” Report for UNICEF, Eastern and Southern Africa Regional Office, Nairobi. Glewwe, P. 2002. “Schools and skills in developing countries: education policies and socioeconomic outcomes.” Journal of Economic Literature, vol.40: 436-482. Gregson, S., H. Waddell, and S. Chandiwana. 2001. “School education and HIV control in Sub-Saharan Africa: from discord to harmony?” Journal of International Development, vol.13: 467-85. Guest, E. 2001. Children of AIDS: Africa’s Orphan Crisis. Pluto Press, London. Johnston, B.F. and P. Kilby.1975. Agriculture and Structural Transformation: Economic Strategies in Late-Developing Countries. New York: Oxford University Press. Lundberg, M., M. Over, and P. Mujinja. 2000. “Sources of financial assistance for households suffering an adult death in Kagera.” South African Journal of Economics, 68: 947-984. Mankiw, N., Romer, D. and Weil, D.N. 1992. “A contribution to the empirics of economic growth.” Quarterly Journal of Economics, vol.107: 407-437. Mbugua, G.G., L.N. Muthami, C.W. Mutura, et al. 1995. “Epidemiology of HIV infection among long distance truck drivers in Kenya.” East African Medical Journal, vol.72: 515-518. McPherson, M.F. (2001) “HIV/AIDS Impacts on Capacity Deepening and Economic Growth” Paper presented at The Brookings Institution, Washington D.C., 28th June NASCOP (National AIDS and STDs Control Programme). 2001. Estimating National HIV Prevalence in Kenya from Sentinel Surveillance Data, NASCOP, Nairobi, Kenya, June report. Nyambedha, E.O., S. Wandibba, and J. Aagaard-Hansen. 2001. “Policy implications of the inadequate support systems for orphans in Western Kenya.” Health Policy, vol.58: 83-96. Nzyuko, S., P. Lurie, W. McFarland, W. Leyden, D. Nyamwaya, and J.S. Mandel. 1997. “Adolescent sexual behavior along the Trans-Africa Highway in Kenya.” AIDS, vol.11: S21-S26. 29

Opiyo, P. 2001. HIV/AIDS, Gender and Livelihood in Siaya District, Kenya: An Analysis of AIDS Impact on Rural Households. MSc. Thesis, Wageningen University. Rugalema, G. 1999. HIV/AIDS and the Commercial Agricultural Sector of Kenya. Report. FAO/UNDP, Rome. Strauss, J., and D. Thomas. 1995. “Human resources: empirical modeling of household and family decisions.” In Handbook of Development Economics, vol.3A, ed. J. Behman and T.N. Srivasan North-Holland, Amsterdam. Todd, J. 2003. “Age Patterns and Trends in HIV-Positive and HIV-Negative Mortality Rate Ratios.” Paper presented at the Scientific Meeting on Empirical Evidence for the Demographic and Socio-Economic Impact of AIDS 26-28 March 2003, University of Natal, Durban, South Africa. UNICEF. 1999. Children Orphaned by AIDS, UNICEF, Geneva. United Nations. 2000. Millennium summit goals, New York: United Nations. USAID. 2002. Children on the Brink 2002. USAID, Washington D.C. Yamano, T., and T.S. Jayne. 2004. “Measuring the impacts of working-age mortality on rural households in Kenya.” forthcoming, World Development. Withworth, J., L. Shafer C. Mahe and L. Van der Paal. 2003. “Survival since infection and its relation to background mortality n Masaka general population.” Paper presented at the Scientific Meeting on Empirical Evidence for the Demographic and Socio-Economic Impact of AIDS, 26-28 March 2003, University of Natal, Durban, South Africa. World Bank. 1995. World Development Report 1994/1995, New York: Oxford University Press. World Bank. 1999. Confronting AIDS: Public priorities in a global epidemic. Revised edition. New York: Oxford University Press. World Bank. 2002. World Development Report 2001/2002. New York: Oxford University Press.
30

Prob(S=1): Probability of Being in School
Non-Poor
Time Death
1
0
ba
After death period Before death period
Illness
Poor possible
recovery
Figure 1. Impact of Working-age Adult Mortality: Hypotheses Notes: (a) hypothesized decline in probability of school attendance due to greater opportunity cost of children’s time and financial resources. (b) possible recovery period due to reduced demands on children’s time for care giving.
31

Table 1. Working-Age a Adult Mortality and School Enrollment in Rural Kenya
Sampled Households % of Children aged 7-14 in School
Province District
in 1997 & 2000b
in 1997, 2000, & 2002c
Households incurring
working-age mortality, 1997-2002
2000
2002
HIV prevalence at urban sentinel
sites in 1990-94d
(A) (B) (C) (D) (E) (F) - % - - % - - % - - % - Coastal 88 71 11.4 59.0 67.5 13.2 Eastern 233 215 6.4 87.1 94.0 6.3 Nyanza 262 245 17.6 89.0 88.2 12.6 Kisumu/Siaya 177 176 23.7 88.4 84.8 21.6 Kisii 85 69 4.7 90.2 95.4 3.6 Western 290 272 7.2 80.9 82.4 15.8 Central 174 164 5.2 92.3 88.5 9.6 Rift Valley 375 299 5.3 87.8 88.0 12.3 Total 1,422 1,266 8.5 89.7 88.3 Source: Tegemeo Institute/Egerton University Agricultural Monitoring and Policy Analysis Household Surveys in 1997 and 2000. National AIDS and STDs Control Programme (NASCOP, 2001) Note: (a) Working-age is defined as 15-49 for women and 15-54 form men. (b) Sample is restricted to households that were interviewed in the 1997 and 2000 surveys. (c) Sample is restricted to households that were interviewed in the 1997, 2000, and 2002 surveys. (d) The average percentage of pregnant women who visited the urban-sentinel-surveillance sites and tested HIV positive in 1990-1994. Data are taken from 11 urban sentinel surveillance sites (NASCOP, 2001).
32
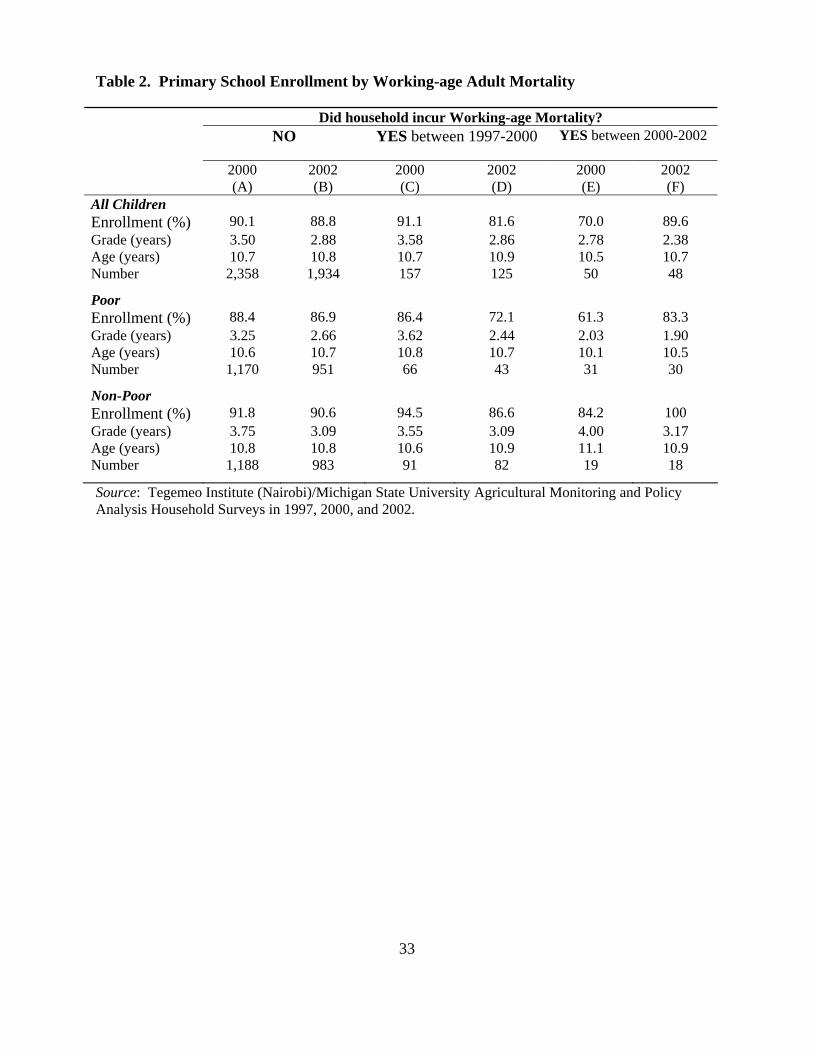
Table 2. Primary School Enrollment by Working-age Adult Mortality
Did household incur Working-age Mortality? NO YES between 1997-2000 YES between 2000-2002
2000 2002 2000 2002 2000 2002
(A) (B) (C) (D) (E) (F) All Children Enrollment (%) 90.1 88.8 91.1 81.6 70.0 89.6 Grade (years) 3.50 2.88 3.58 2.86 2.78 2.38 Age (years) 10.7 10.8 10.7 10.9 10.5 10.7 Number 2,358 1,934 157 125 50 48
Poor Enrollment (%) 88.4 86.9 86.4 72.1 61.3 83.3 Grade (years) 3.25 2.66 3.62 2.44 2.03 1.90 Age (years) 10.6 10.7 10.8 10.7 10.1 10.5 Number 1,170 951 66 43 31 30
Non-Poor Enrollment (%) 91.8 90.6 94.5 86.6 84.2 100 Grade (years) 3.75 3.09 3.55 3.09 4.00 3.17 Age (years) 10.8 10.8 10.6 10.9 11.1 10.9 Number 1,188 983 91 82 19 18
Source: Tegemeo Institute (Nairobi)/Michigan State University Agricultural Monitoring and Policy Analysis Household Surveys in 1997, 2000, and 2002.
33

Table 3. Determinants of Children Experiencing Working-age Adult Mortality in Their Household, 2000 Survey Sample (Probita)
Working-age adult mortality in 1997-2002: Prob (D1997-2000=1) (A) (B)
HIV Prevalence rate Ratio of HIV+ pregnant women 0.487 In 1990-94 (5.22)** Attrition in 2002 Attrition Dummy (=1) 0.027 0.021 (2.15)* (1.75) Province Dummies Nyanza province 0.085 0.050 (5.14)** (3.32)** Coastal province 0.020 0.026 (1.00) (1.29) Western province -0.013 -0.002 (0.94) (0.15) Central province -0.035 -0.007 (2.21)* (0.34) Rift Valley province -0.024 -0.017 (2.11)* (1.51) Household Characteristics Max. years of male schooling -0.001 0.000 (0.46) (0.02) Max. years of female schooling -0.001 -0.001 (0.98) (1.16) Female headed (=1) 0.001 -0.005 (0.05) (0.29) Polygamous household (=1) -0.023 -0.025 (2.09)* (2.48)* Number of male adults 0.014 0.012 (3.58)** (3.32)** Number of female adults -0.003 -0.002 (0.57) (0.44) Land tenure (=1) 0.012 0.013 (1.41) (1.48) ln (Landholding size in acres) 0.011 0.009 (2.01)* (1.83) ln (Asset value, Shillings) 0.001 0.001 (0.60) (0.77) Distance to Bus Stop (km) -0.004 -0.005 (1.87) (2.34)* Distance to Piped Water (km) -0.000 0.000 (0.02) (0.29) Child Characteristics Age in years 0.007 0.008 (0.34) (0.41) Age squared -0.000 -0.000 (0.45) (0.50) Girl (=1) -0.001 -0.001 (0.09) (0.13) Grand child, Nephew, Niece (=1) 0.019 0.009 (1.78) (0.95) Non Relative (=1) 0.018 0.012 (0.77) (0.54) Number of children 2,565
Note: Numbers in parentheses are absolute z-scores. ** indicates 1 percent significance level; * indicates 5 percent significance level. (a) Estimated coefficients are marginal changes in probability.
34

Table 4. The Impact of Prime-age Adult Mortality on School Attendance, Pooled 2000 and 2002 Data (Probita), Dependent Variable: Prob(Sit =1)
All Poor Non-Poor (A) (B) (C)
HIV Prevalence at surveillance sites Ratio of HIV+ pregnant women -0.215 -0.310 -0.141 of 1990-94 at 2000, 1992-96 at 2002 (2.94)** (3.19)** (1.23) Working-age Adult Mortality
Dt: Working-age Adult Death at t 0.018 0.015 0.024 (1.35) (0.82) (1.68)
Dt+1: Pre-death Period -0.099 -0.143 -0.006 (2.68)** (2.48)* (0.19)
Dt-1: Post-death Period -0.060 -0.106 -0.024 (2.70)** (2.50)* (1.16) Attrition in 2002 Attrition Dummy (=1) 0.011 -0.015 0.020 (0.95) (0.78) (1.47) Child Characteristics
Age in years 0.026 0.015 0.027 (1.85) (0.73) (1.70)
Age squared -0.002 -0.002 -0.002 (2.68)** (1.62) (2.16)*
Girl (=1) 0.001 -0.004 0.008 (0.19) (0.50) (1.07)
Grade completed, splined at 3rd grade 0.073 0.105 0.044 (21.27)** (16.76)** (12.47)**
Grade completed, 3rd and higher -0.012 -0.022 -0.005 (3.89)** (4.87)** (1.30)
Grand child, Nephew, Niece (=1) -0.002 0.012 -0.023 (0.21) (1.10) (2.22)*
Non Relative (=1) -0.341 -0.294 -0.340 (12.16)** (5.92)** (10.67)** Household Characteristics
Max. years of male schooling -0.001 0.000 -0.003 (1.48) (0.05) (2.43)*
Max. years of female schooling 0.004 0.005 0.002 (3.68)** (3.41)** (1.44)
Female headed (=1) 0.022 0.036 -0.022 (1.53) (2.23)* (0.73)
Polygamous household (=1) 0.011 0.013 0.009 (1.33) (1.13) (0.87)
Number of male adults -0.001 -0.001 0.000 (0.17) (0.20) (0.02)
Number of female adults -0.005 -0.010 -0.001 (1.71) (1.91) (0.44)
Land tenure (=1) 0.004 -0.005 0.002 (0.63) (0.46) (0.19)
ln (Landholding size in acres) -0.004 0.009 -0.007 (0.92) (1.26) (1.59)
ln (Asset value, Shillings) 0.003 0.004 0.003 (2.51)* (2.22)* (1.20)
Distance to Bus Stop (km) -0.001 -0.000 -0.001 (1.87) (0.22) (2.83)**
Distance to Piped Water (km) 0.002 0.003 0.002 (1.66) (1.45) (1.37)
Year 2002 0.018 0.026 0.017 (2.77)** (2.72)** (2.15)* Number of children 4,672 2,291 2,381
Note: Numbers in parentheses are absolute z-scores. ** indicates 1 percent significance level; * indicates 5 percent significance level. (a) Estimated coefficients are marginal changes in probability.
35

Table 5. The Impact of Prime-age Adult Mortality on Child School Attendance by Gender, Pooled 2000 and 2002 Data (Probita), Dependent Variable: Prob(Sit =1)
All Poor Non-Poor Boys Girls Boys Girls Boys Girls
(A) (B) (C) (D) (E) (F) HIV Prevalence at surveillance sites Ratio of HIV+ pregnant women -0.230 -0.131 -0.186 -0.369 -0.187 0.036 of 1990-94 at 2000, 1992-96 at 2002 (2.31)* (1.27) (1.65) (2.64)** (1.22) (0.23) Working-age Adult Mortality
Dt: Working-age Adult Death at t -0.003 0.032 -0.025 0.033 0.018 0.026 (0.15) (1.86) (0.95) (1.49) (0.97) (1.41)
Dt+1: Pre-death Period -0.082 -0.123 -0.124 -0.151 0.026 -0.105 (1.65) (2.22)* (1.80) (1.77) (0.80) (1.41)
Dt-1: Post-death Period -0.145 0.009 -0.258 0.015 -0.062 0.009 (3.72)** (0.39) (3.62)** (0.34) (1.64) (0.44) Attrition in 2002 Attrition Dummy (=1) 0.015 0.007 0.003 -0.027 0.016 0.014 (0.99) (0.43) (0.16) (0.93) (0.90) (0.79) Child Characteristics
Age in years 0.035 0.006 0.028 -0.009 0.034 0.020 (1.94) (0.31) (1.28) (0.30) (1.56) (0.94)
Age squared -0.002 -0.001 -0.002 -0.001 -0.002 -0.001 (2.40)* (0.94) (1.85) (0.39) (1.79) (1.23)
Grade completed, splined at 3rd grade 0.072 0.070 0.088 0.107 0.044 0.036 (15.93)** (13.85)** (11.99)** (11.27)** (9.41)** (7.67)**
Grade completed, 3rd and higher -0.017 -0.011 -0.023 -0.020 -0.009 -0.004 (4.17)** (2.38)* (4.52)** (3.04)** (1.93) (0.78)
Grand child, Nephew, Niece (=1) -0.011 0.005 -0.011 0.029 -0.020 -0.025 (1.11) (0.43) (0.88) (1.91) (1.45) (1.81)
Non Relative (=1) -0.549 -0.148 -0.617 -0.046 -0.504 -0.164 (11.84)** (4.46)** (6.66)** (0.94) (9.31)** (4.58)** Household Characteristics
Max. years of male schooling -0.002 0.000 0.001 0.000 -0.004 -0.001 (1.97)* (0.02) (0.47) (0.01) (2.77)** (0.49)
Max. years of female schooling 0.003 0.004 0.002 0.007 0.003 0.000 (2.41)* (2.68)** (1.41) (3.22)** (1.84) (0.13)
Female headed (=1) 0.008 0.034 0.020 0.049 -0.056 -0.004 (0.41) (1.68) (1.11) (2.11)* (1.15) (0.12)
Polygamous household (=1) 0.007 0.014 -0.012 0.033 0.023 -0.001 (0.60) (1.17) (0.78) (2.05)* (1.69) (0.09)
Number of male adults 0.004 -0.006 0.004 -0.005 0.004 -0.003 (0.93) (1.33) (0.75) (0.72) (0.86) (0.69)
Number of female adults -0.004 -0.007 -0.008 -0.012 -0.000 -0.004 (1.09) (1.55) (1.56) (1.45) (0.02) (0.85)
Land tenure (=1) 0.007 -0.001 -0.000 -0.011 0.002 -0.002 (0.75) (0.09) (0.01) (0.69) (0.15) (0.19)
ln (Landholding size, acres) -0.003 -0.001 0.003 0.011 -0.005 -0.006 (0.47) (0.18) (0.43) (1.18) (0.92) (1.04)
ln (Asset value, Shillings) 0.003 0.003 0.003 0.002 0.000 0.007 (1.73) (1.79) (1.89) (1.00) (0.09) (1.83)
Distance to Bus Stop (km) -0.000 -0.001 0.000 -0.000 -0.001 -0.001 (1.25) (1.56) (0.83) (0.63) (2.78)** (2.02)*
Distance to Piped Water (km) 0.004 0.000 0.002 0.004 0.006 -0.001 (2.43)* (0.03) (0.82) (1.47) (2.83)** (0.67)
Year 2002 0.022 0.011 0.026 0.023 0.021 0.004 (2.45)* (1.11) (2.35)* (1.63) (2.00)* (0.42) Number of children 2,421 2,251 1,197 1,094 1,224 1,157
Note: Numbers in parentheses are absolute z-scores. ** indicates 1 percent significance level; * indicates 5 percent significance level. (a) Estimated coefficients are marginal changes in probability.
36

Table 6. The Impact of Prime-age Adult Mortality on Child School Attendance, Controlling for Fixed Effects, Pooled 2000 and 2002 Data (Conditional Logit)
All Poor Non-Poor HH FE Child FE HH FE Child FE HH FE Child FE
(A) (B) (C) (D) (E) (F) HIV Prevalence rate Ratio of HIV+ pregnant women -12.82 -47.89 -28.63 -50.02 21.90 -31.65 of 1990-94 at 2000, 1992-96 at 2002 (1.02) (2.59)** (1.81) (2.16)* (1.02) (0.83) Working-age Adult Mortality
Dt+1: Pre-death Period -1.745 -1.770 -1.783 -1.252 -32.51 -38.88 (2.09)* (1.58) (1.94) (1.05) (0.00) (0.00)
Dt-1: Post-death Period -1.075 -0.958 -0.702 -0.061 -1.369 -38.84 (1.66) (1.22) (0.88) (0.06) (1.28) (0.00) Child Characteristics
Age in years 0.766 1.241 0.510 2.195 1.174 -0.196 (2.04)* (1.78) (1.00) (2.21)* (2.04)* (0.16)
Age squared -0.043 -0.058 -0.031 -0.108 -0.060 0.003 (2.38)* (1.80) (1.26) (2.36)* (2.20)* (0.05)
Girl (=1) -0.015 0.137 -0.199 (0.09) (0.59) (0.71)
Grade completed, splined at 3rd 1.342 0.599 1.523 0.887 1.136 0.664 (11.7)** (3.60)** (9.65)** (3.48)** (6.66)** (2.30)*
Grade completed, 3rd and higher -0.394 -0.796 -0.512 -0.607 -0.305 -1.543 (4.21)** (2.87)** (4.08)** (1.83) (2.05)* (2.17)*
Grand child, Nephew, Niece (=1) 0.028 0.369 -0.477 (0.07) (0.74) (0.77)
Non Relative (=1) -2.883 -2.088 -3.366 (6.71)** (3.21)** (5.75)**
Year 2002 (=1) 0.384 0.916 0.509 0.912 -0.034 1.108 (1.47) (1.74) (1.46) (1.35) (0.08) (1.10) Number of observations 1,396 270 792 178 604 92 Note: Numbers in parentheses are absolute z-scores. ** indicates 5 percent significance level; * indicates 10 percent significance level.
37

Appendix Table A1. Descriptive Statistics by Gender, Pooled 2000 and 2002 Survey Data Mean Std. Error Min Max Schooling School Attendance (=1) 0.891 0.311 0 1 HIV Prevalence rate Ratio of HIV+ pregnant women 0.129 0.053 0.036 0.250 Working-age Adult Mortality
Dt: Working-age Adult Death at t (=1) 0.043 0.202 0 1 Dt+1: Pre-death Period (=1) 0.009 0.097 0 1 Dt-1: Post-death Period (=1) 0.027 0.161 0 1
Attrition in 2002 Attrition Dummy (=1) 0.074 0.262 0 1 Child Characteristics
Age in years 10.71 2.247 7 14 Girl (=1) 0.482 0.500 0 1 Grade completed 3.209 2.168 0 7 Grand child, nephew, niece (=1) 0.226 0.418 0 1 No relative child (=1) 0.040 0.196 0 1
Household Characteristics Max. years of male schooling 8.040 4.473 0 18 Max. years of female schooling 7.355 3.992 0 17 Female headed (=1) 0.057 0.232 0 1 Polygamous household (=1) 0.136 0.342 0 1 Number of male adults 1.824 1.214 0 8 Number of female adults 1.850 1.171 0 8 Land tenure (=1) 0.383 0.486 0 1 ln (Landholding size in acres) 1.511 0.902 0 4.615 ln (Asset value, Shillings) 5.695 4.359 0 15.85 Distance to Bus Stop (km) 2.313 2.626 0 20 Distance to Piped Water (km) 9.054 11.94 0 70 Year 2002 (=1) 0.451 0.498 0 1 Number of observations 4,672 Source: Tegemeo Institute (Nairobi)/Michigan State University Agricultural Monitoring and Policy Analysis Household Surveys in 1997, 2000, and 2002.
38

39
Appendix Table A2. Three-Year Average HIV-Prevalence Rates Among Pregnant Women At Urban Sentinel Surveillance Sites City 1990-94 1992-96 1995-99 2000 only Busia 20.4 25.0 28.6 22.0 Kakamega 11.2 12.0 12.0 12.0 Kisii 3.6 6.4 12.6 16.0 Kisumu 21.6 24.4 28.2 35.0 Kitale 9.8 12.4 12.6 17.0 Kitui 7.2 7.6 6.6 14.0 Meru 5.3 9.5 18.4 35.0 Mombasa 13.2 13.4 15.3 12.0 Nairobi 14.3 17.6 20.0 n.a. Nakuru 14.8 15.7 22.0 11.0 Nyeri 5.0 6.8 11.0 14.0 Source: NASCOP (2001).