takasago thermal engineering co., ltd. - tte-net.com that combine many of these functions. ......
TRANSCRIPT

annual report 2000
Takasago ThermalEngineeringCo., Ltd.

profileFounded in 1923, Takasago Thermal Engineering Co.,
Ltd. is Japan’s largest company specializing in Heat-
ing, Ventilation and Air Conditioning (HVAC). The
company’s mission is to make people’s lives more
pleasant and contribute to society as a whole by cre-
ating comfortable environments. Building upon a
solid theoretical foundation in thermal dynamics,
fluid dynamics and electronics, Takasago uses its
own leading-edge technology to design and install
systems that meet the requirements of a diverse va-
riety of buildings.
During the past fiscal year, Takasago completed the
ISO 14001 environmental management system certifi-
cation of all its offices in Japan. This achievement will
be followed by continued implementation of environ-
mental preservation measures within Takasago’s busi-
ness activities, including the reduction of emissions of
carbon dioxide and CFCs.
CONTENTS
To the Reader ••• 1
Review of Operations ••• 2
Research and Development ••• 4
Financial Review ••• 6
Consolidated Statements of Income ••• 7
Consolidated Balance Sheets ••• 8
Consolidated Statements of Shareholders’ Equity ••• 10
Consolidated Statements of Cash Flows ••• 11
Notes to Consolidated Financial Statements ••• 13
Report of Independent Public Accountants ••• 19
Directory ••• 20
Board of Directors / Investor Information ••• 21
� HVAC for Comfortable Environment
Takasago provides optimum air environments in a huge array
of modern structures. These include office buildings, where
“intelligent” functions are becoming increasingly common,
crowded stations and airports, and hotels where the element
of comfort is paramount. In addition, the company provides
systems for key social facilities such as schools and hospitals,
art galleries and museums, as well as vast complexes and
skyscrapers that combine many of these functions. Takasago’s
technical skill extends also to the environmental control of
large indoor spaces such as domed stadiums, concert halls
and theaters.
� HVAC for Work SpacesTakasago is playing a major role in preserving healthy working
environments and raising efficiency at the factories of many of
Japan’s best known manufacturers in such industries as
automobiles and electrical appliances, in addition to precision
equipment such as watches and cameras.
� HVAC for Manufacturing ProcessesProcess-related HVAC systems such as clean rooms and
clean-dry rooms are essential to the precision processing
technology at the core of information and communications
equipment such as PCs, mobile phones and LCDs, as well as
the pharmaceuticals, biotechnology and food products essential
to healthy living. Over the years, Takasago has responded to
changing customer needs by developing ultra-precise constant-
temperature, constant-humidity technology; ultra-clean
technology for the removal of dust, chemical contaminants
and static electricity; and ultra-dry technology for preserving
an extremely low dew point. By combining these techniques
with its precision control expertise, Takasago contributes to
raising productivity in manufacturing processes.
� HVAC Renovations
When a building is renovated and its facilities updated, install-
ing HVAC equipment is inevitably one of the most important
tasks. Typically, these systems need to be replaced after 15 or
20 years, a much shorter period than the average building
lifetime of 30 to 50 years. To respond to changes in a
building’s use during its lifetime—and to continual demands
for higher-performance systems—Takasago draws upon its
vast experience in renovation and upgrading to propose HVAC
solutions that meet the requirements of the time and add
value to the building itself.
� DHC (District Heating-and-Cooling) SystemsDHC systems are an effective means of both saving energy
and purifying exhaust gas emissions. In addition, they help utilize limited energy resources and space
more efficiently and provide reliable service in the event of an emergency. Offering the optimum
combination of energy usage—electricity, gas and unused energy—the importance of DHC systems in
countering global warming is set to increase from hereon. DHC systems also showcase Takasago’s
expertise in heating technology expertise accumulated through years of experience.
� �
� �
�
1page
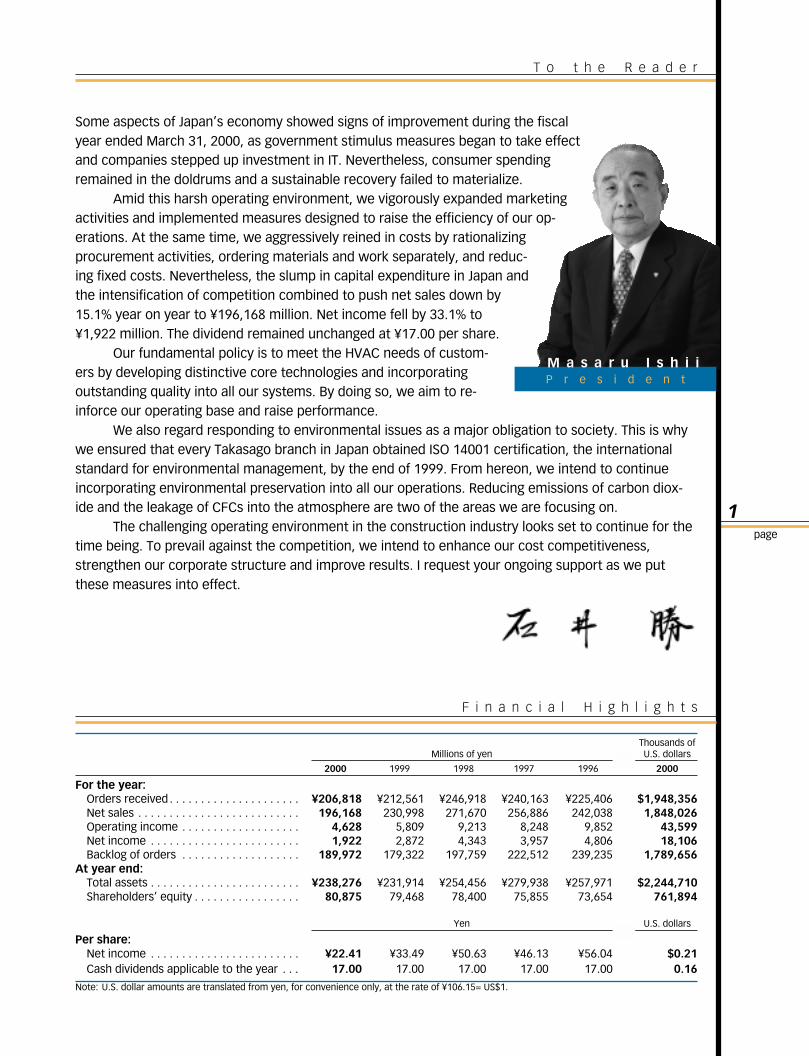
M a s a r u I s h i iP r e s i d e n t
Thousands ofMillions of yen U.S. dollars
2000 1999 1998 1997 1996 2000
For the year:Orders received . . . . . . . . . . . . . . . . . . . . . ¥206,818 ¥212,561 ¥246,918 ¥240,163 ¥225,406 $1,948,356Net sales . . . . . . . . . . . . . . . . . . . . . . . . . . 196,168 230,998 271,670 256,886 242,038 1,848,026Operating income . . . . . . . . . . . . . . . . . . . 4,628 5,809 9,213 8,248 9,852 43,599Net income . . . . . . . . . . . . . . . . . . . . . . . . 1,922 2,872 4,343 3,957 4,806 18,106Backlog of orders . . . . . . . . . . . . . . . . . . . 189,972 179,322 197,759 222,512 239,235 1,789,656
At year end:Total assets . . . . . . . . . . . . . . . . . . . . . . . . ¥238,276 ¥231,914 ¥254,456 ¥279,938 ¥257,971 $2,244,710Shareholders’ equity . . . . . . . . . . . . . . . . . 80,875 79,468 78,400 75,855 73,654 761,894
Yen U.S. dollars
Per share:Net income . . . . . . . . . . . . . . . . . . . . . . . . ¥22.41 ¥33.49 ¥50.63 ¥46.13 ¥56.04 $0.21Cash dividends applicable to the year . . . 17.00 17.00 17.00 17.00 17.00 0.16
Note: U.S. dollar amounts are translated from yen, for convenience only, at the rate of ¥106.15= US$1.
F i n a n c i a l H i g h l i g h t s
T o t h e R e a d e r
Some aspects of Japan’s economy showed signs of improvement during the fiscalyear ended March 31, 2000, as government stimulus measures began to take effectand companies stepped up investment in IT. Nevertheless, consumer spendingremained in the doldrums and a sustainable recovery failed to materialize.
Amid this harsh operating environment, we vigorously expanded marketingactivities and implemented measures designed to raise the efficiency of our op-erations. At the same time, we aggressively reined in costs by rationalizingprocurement activities, ordering materials and work separately, and reduc-ing fixed costs. Nevertheless, the slump in capital expenditure in Japan andthe intensification of competition combined to push net sales down by15.1% year on year to ¥196,168 million. Net income fell by 33.1% to¥1,922 million. The dividend remained unchanged at ¥17.00 per share.
Our fundamental policy is to meet the HVAC needs of custom-ers by developing distinctive core technologies and incorporatingoutstanding quality into all our systems. By doing so, we aim to re-inforce our operating base and raise performance.
We also regard responding to environmental issues as a major obligation to society. This is whywe ensured that every Takasago branch in Japan obtained ISO 14001 certification, the internationalstandard for environmental management, by the end of 1999. From hereon, we intend to continueincorporating environmental preservation into all our operations. Reducing emissions of carbon diox-ide and the leakage of CFCs into the atmosphere are two of the areas we are focusing on.
The challenging operating environment in the construction industry looks set to continue for thetime being. To prevail against the competition, we intend to enhance our cost competitiveness,strengthen our corporate structure and improve results. I request your ongoing support as we putthese measures into effect.

2
page
ORDERS RECEIVED BY PROJECT • Orders received in the fiscal year
ended March 31, 2000 decreased year on year by 2.7% to ¥206,818
million. The receipt of a series of orders for clean rooms and for
large-scale urban redevelopment projects during the second half of
the fiscal year was not enough to counter the ongoing slump in the
renovation market. As a result, orders for general-purpose HVAC sys-
tems fell by 1.2% to ¥156,640 million, and orders for factory HVAC
systems by 8.7% to ¥44,538 million. Orders for equipment rose year
on year by 9.3% to ¥5,640 million. Overall, general-purpose HVAC
equipment accounted for 75.8% of orders, factory HVAC systems for
21.5% and equipment for 2.7%.
NET SALES BY PROJECT • Net sales declined by 15.1% to ¥196,168
million. By sector, net sales of general-purpose HVAC systems de-
clined by 0.5% to ¥162,149 million, and factory HVAC systems by
54.8% to ¥28,421 million. Net sales of equipment increased by 8.4%
to ¥5,599 million. General-purpose HVAC systems accounted for
82.7% of net sales, factory HVAC systems for 14.4% and equipment
for 2.9%.
R e v i e w o f O p e r a t i o n s
Millions of yen2000 1999 1998
ConstructionOffice Projects . . . . . . . . . . . . . . ¥ 65,108 ¥ 68,145 ¥ 73,555Shopping Centers . . . . . . . . . . . 15,201 15,982 16,736Hotels . . . . . . . . . . . . . . . . . . . . 3,588 9,894 14,084Sports and Leisure Facilities . . . 8,672 12,538 9,787Residential Housing . . . . . . . . . . 2,779 2,220 3,573Educational Facilities . . . . . . . . 18,523 18,825 16,808Medical Facilities . . . . . . . . . . . 23,912 14,805 21,357Factory Projects . . . . . . . . . . . . 44,538 48,785 71,250Others . . . . . . . . . . . . . . . . . . . . 18,857 16,209 14,452
Equipment. . . . . . . . . . . . . . . . . . . 5,640 5,158 5,316Total . . . . . . . . . . . . . . . . . . . . . . . ¥206,818 ¥212,561 ¥246,918
Millions of yen2000 1999 1998
ConstructionOffice Projects . . . . . . . . . . . . . . ¥ 63,012 ¥ 68,701 ¥ 80,525Shopping Centers . . . . . . . . . . . 15,627 15,743 19,330Hotels . . . . . . . . . . . . . . . . . . . . 10,941 10,165 10,355Sports and Leisure Facilities . . . 15,015 9,679 10,119Residential Housing . . . . . . . . . . 1,269 1,420 1,760Educational Facilities . . . . . . . . 16,916 19,830 18,175Medical Facilities . . . . . . . . . . . 21,834 18,740 26,811Factory Projects . . . . . . . . . . . . 28,421 62,825 69,503Others . . . . . . . . . . . . . . . . . . . . 17,534 18,730 29,304
Equipment. . . . . . . . . . . . . . . . . . . 5,599 5,165 5,788
Total . . . . . . . . . . . . . . . . . . . . . . . ¥196,168 ¥230,998 ¥271,670
2000 Orders Received by Project (%)
Office Projects
Shopping Centers
Hotels
Sports and LeisureFacilitiesResidential Housing
Educational Facilities
Medical Facilities
Factory Projects
Others
Equipment
11.6 7.3
9.2
31.5
9.0
21.5
1.3
2000 Net Sales by Project (%)
Office Projects
Shopping Centers
Hotels
Sports and LeisureFacilitiesResidential Housing
Educational Facilities
Medical Facilities
Factory Projects
Others
Equipment
32.1
0.6
1.7
8.0
5.67.78.6
14.4
11.1
9.0
4.2
2.7
2.9
“General-purpose HVAC
systems” includes all
Construction items
except Factory Projects.
3page
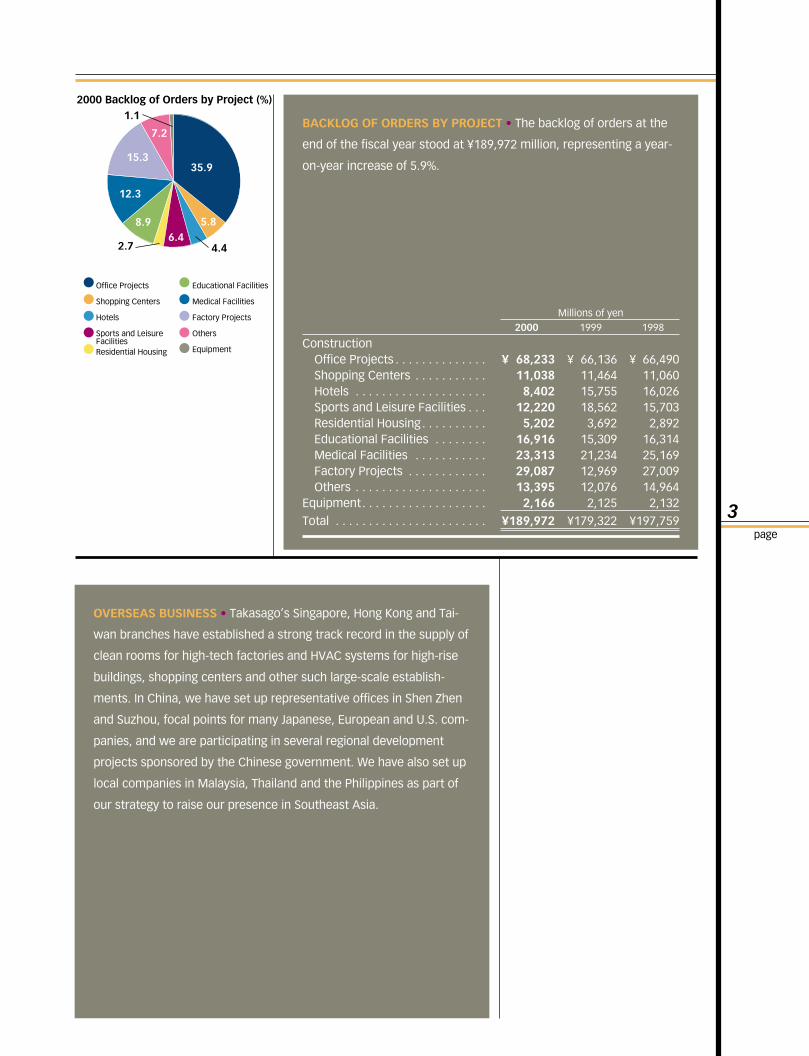
BACKLOG OF ORDERS BY PROJECT • The backlog of orders at the
end of the fiscal year stood at ¥189,972 million, representing a year-
on-year increase of 5.9%.
OVERSEAS BUSINESS • Takasago’s Singapore, Hong Kong and Tai-
wan branches have established a strong track record in the supply of
clean rooms for high-tech factories and HVAC systems for high-rise
buildings, shopping centers and other such large-scale establish-
ments. In China, we have set up representative offices in Shen Zhen
and Suzhou, focal points for many Japanese, European and U.S. com-
panies, and we are participating in several regional development
projects sponsored by the Chinese government. We have also set up
local companies in Malaysia, Thailand and the Philippines as part of
our strategy to raise our presence in Southeast Asia.
Millions of yen2000 1999 1998
ConstructionOffice Projects . . . . . . . . . . . . . . ¥ 68,233 ¥ 66,136 ¥ 66,490Shopping Centers . . . . . . . . . . . 11,038 11,464 11,060Hotels . . . . . . . . . . . . . . . . . . . . 8,402 15,755 16,026Sports and Leisure Facilities . . . 12,220 18,562 15,703Residential Housing . . . . . . . . . . 5,202 3,692 2,892Educational Facilities . . . . . . . . 16,916 15,309 16,314Medical Facilities . . . . . . . . . . . 23,313 21,234 25,169Factory Projects . . . . . . . . . . . . 29,087 12,969 27,009Others . . . . . . . . . . . . . . . . . . . . 13,395 12,076 14,964
Equipment. . . . . . . . . . . . . . . . . . . 2,166 2,125 2,132
Total . . . . . . . . . . . . . . . . . . . . . . . ¥189,972 ¥179,322 ¥197,759
2000 Backlog of Orders by Project (%)
Office Projects
Shopping Centers
Hotels
Sports and LeisureFacilitiesResidential Housing
Educational Facilities
Medical Facilities
Factory Projects
Others
Equipment
35.9
2.7
5.86.4
8.9
15.3
12.3
7.2
1.1
4.4
4
page
R e s e a r c h a n d D e v e l o p m e n t
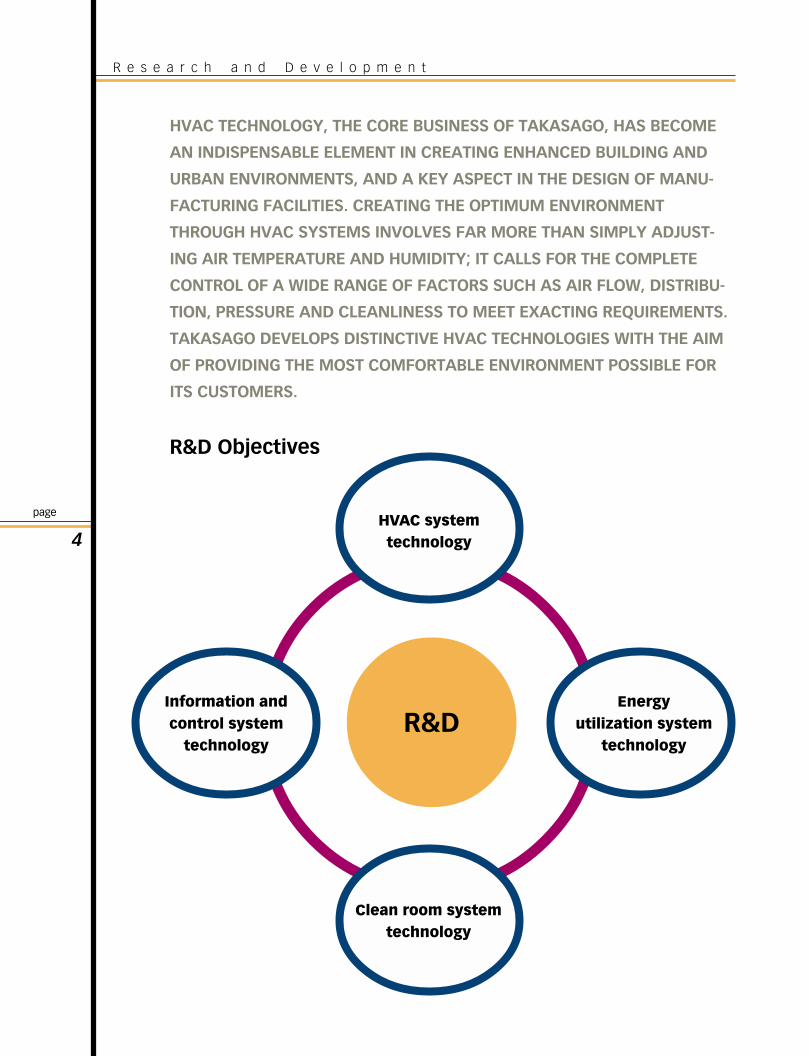
HVAC TECHNOLOGY, THE CORE BUSINESS OF TAKASAGO, HAS BECOME
AN INDISPENSABLE ELEMENT IN CREATING ENHANCED BUILDING AND
URBAN ENVIRONMENTS, AND A KEY ASPECT IN THE DESIGN OF MANU-
FACTURING FACILITIES. CREATING THE OPTIMUM ENVIRONMENT
THROUGH HVAC SYSTEMS INVOLVES FAR MORE THAN SIMPLY ADJUST-
ING AIR TEMPERATURE AND HUMIDITY; IT CALLS FOR THE COMPLETE
CONTROL OF A WIDE RANGE OF FACTORS SUCH AS AIR FLOW, DISTRIBU-
TION, PRESSURE AND CLEANLINESS TO MEET EXACTING REQUIREMENTS.
TAKASAGO DEVELOPS DISTINCTIVE HVAC TECHNOLOGIES WITH THE AIM
OF PROVIDING THE MOST COMFORTABLE ENVIRONMENT POSSIBLE FOR
ITS CUSTOMERS.
R&D
HVAC systemtechnology
Clean room systemtechnology
Information andcontrol system
technology
Energyutilization system
technology
R&D Objectives
5page
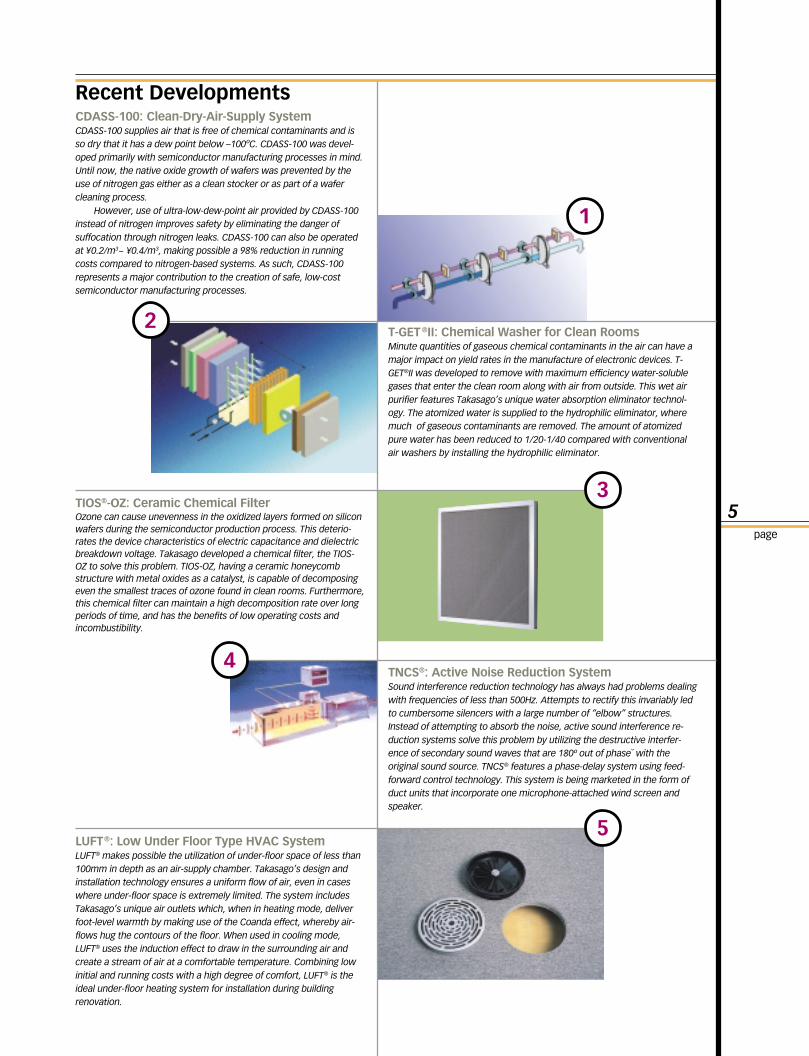
T-GET ®II: Chemical Washer for Clean RoomsMinute quantities of gaseous chemical contaminants in the air can have amajor impact on yield rates in the manufacture of electronic devices. T-GET®II was developed to remove with maximum efficiency water-solublegases that enter the clean room along with air from outside. This wet airpurifier features Takasago’s unique water absorption eliminator technol-ogy. The atomized water is supplied to the hydrophilic eliminator, wheremuch of gaseous contaminants are removed. The amount of atomizedpure water has been reduced to 1/20-1/40 compared with conventionalair washers by installing the hydrophilic eliminator.
CDASS-100: Clean-Dry-Air-Supply SystemCDASS-100 supplies air that is free of chemical contaminants and isso dry that it has a dew point below –100ºC. CDASS-100 was devel-oped primarily with semiconductor manufacturing processes in mind.Until now, the native oxide growth of wafers was prevented by theuse of nitrogen gas either as a clean stocker or as part of a wafercleaning process.
However, use of ultra-low-dew-point air provided by CDASS-100instead of nitrogen improves safety by eliminating the danger ofsuffocation through nitrogen leaks. CDASS-100 can also be operatedat ¥0.2/m3~ ¥0.4/m3, making possible a 98% reduction in runningcosts compared to nitrogen-based systems. As such, CDASS-100represents a major contribution to the creation of safe, low-costsemiconductor manufacturing processes.
1
3
4TNCS®: Active Noise Reduction SystemSound interference reduction technology has always had problems dealingwith frequencies of less than 500Hz. Attempts to rectify this invariably ledto cumbersome silencers with a large number of “elbow” structures.Instead of attempting to absorb the noise, active sound interference re-duction systems solve this problem by utilizing the destructive interfer-ence of secondary sound waves that are 180º out of phase˘ with theoriginal sound source. TNCS® features a phase-delay system using feed-forward control technology. This system is being marketed in the form ofduct units that incorporate one microphone-attached wind screen andspeaker.
TIOS®-OZ: Ceramic Chemical FilterOzone can cause unevenness in the oxidized layers formed on siliconwafers during the semiconductor production process. This deterio-rates the device characteristics of electric capacitance and dielectricbreakdown voltage. Takasago developed a chemical filter, the TIOS-OZ to solve this problem. TIOS-OZ, having a ceramic honeycombstructure with metal oxides as a catalyst, is capable of decomposingeven the smallest traces of ozone found in clean rooms. Furthermore,this chemical filter can maintain a high decomposition rate over longperiods of time, and has the benefits of low operating costs andincombustibility.
5LUFT®: Low Under Floor Type HVAC SystemLUFT® makes possible the utilization of under-floor space of less than100mm in depth as an air-supply chamber. Takasago’s design andinstallation technology ensures a uniform flow of air, even in caseswhere under-floor space is extremely limited. The system includesTakasago’s unique air outlets which, when in heating mode, deliverfoot-level warmth by making use of the Coanda effect, whereby air-flows hug the contours of the floor. When used in cooling mode,LUFT® uses the induction effect to draw in the surrounding air andcreate a stream of air at a comfortable temperature. Combining lowinitial and running costs with a high degree of comfort, LUFT® is theideal under-floor heating system for installation during buildingrenovation.
2
Recent Developments

6
page
F i n a n c i a l R e v i e w
CONSOLIDATED STATEMENTS
OF INCOME
In the fiscal year ended March 31,
2000, net sales fell year on year by
¥34,830 million, or 15.1%, to ¥196,168
million. Much of this decline is ac-
counted for by the slump in private-
sector capital expenditure that led to
a marked decrease in sales of factory
HVAC systems, including clean rooms.
Cost of sales decreased by
¥32,294 million, or 15.5%, to ¥176,593
million. This was mainly due to the ra-
tionalization of procurement and the
ordering of materials and work sepa-
rately. Selling, general and administra-
tive expenses decreased by ¥1,355
million, or 8.3%, to ¥14,947 million,
mainly due to cost-reduction mea-
sures in personnel and in office sup-
plies. As a result of the above,
operating income fell by ¥1,181 mil-
lion, or 20.3%, to ¥4,628 million.
Under other income (expenses),
expenses of ¥6,209 million were
recorded, primarily relating to a shortfall
in funding for retirement benefits, and
gains of ¥5,310 million, mainly from
the sale of marketable securities. Net
income decreased by ¥950 million, or
33.1%, to ¥1,922 million and ROE
dropped from 3.6% to 2.4%. Net in-
come per share fell from ¥33.49 to
¥22.41. The annual dividend remained
unchanged at ¥17.00 per share.
FINANCIAL POSITION
Total assets at the end of the year
were ¥238,276 million, an increase of
¥6,362 million, or 2.7%, compared
with a year ago. Although current
assets were largely unchanged, in-
vestments and other assets increased
due to the purchase of investment se-
curities and the inclusion of deferred
tax assets. On the other side of the
balance sheet, while current liabilities
were virtually the same as a year ear-
lier, fixed liabilities increased due to
the bringing forward of recognition of
increased liabilities for retirement
benefits. As a result, total liabilities
increased by 3.3% to ¥157,401 million.
Shareholders’ equity increased to
¥80,875 million and the equity ratio was
33.9%, against 34.3% a year earlier.
CASH FLOWS
Net cash provided by operating activi-
ties amounted to ¥8,333 million.
Although income before income taxes
decreased year on year by ¥2,523 mil-
lion to ¥3,729 million, the balance of
income and cost for construction
projects improved.
Net cash used in investing
activities amounted to ¥951 million,
primarily reflecting investment in time
deposits and the purchase of invest-
ment securities.
Financing activities used cash
of ¥1,838 million, as cash dividends
paid offset net proceeds from long-
term debt.
As a result of the foregoing,
cash and cash equivalents at the end
of the year stood at ¥45,271 million.
○
○
○
○
○
○
○
○
○
○
○
○
○
○
○
○
○
○
○
○
○
○
○
○
○
○
○
○
○
○
○
○
○
○
○
○
○
○
○
○
○
○
○
○
○
○
○
○
○
○
○
○
○
○
○
○
○
○
○
○
○
○
○
○
○
○
○
○
○
○
○
○
○
○
○
○
○
○
○
○
○
○
○
○
○
○
○
○
○
○
○
○
○
○
○
○
○
○
○
○
○
○
○
○
○
○
○
○
○
○
○
○
○
○
○
○
○
○
○
○
○
○
○
○
○
○
○
○
○
○
○
○
○
○
○
○
○
○
○
○
○
○
○
○
○
○
○
○
○
○
○
○
○
○
○
○
○
○
○
○
○
○
○
○
○
○
○
○
○
○
○
○
○
○
○
○
○
○
○
○
○
○
○
○
○
○
○
○
○
○
○
○
○
○
○
○
○
○
○
○
○
○
○
○
○
○
○
○
○
○
○
96 97 98 99 00 96 97 98 99 00 96 97 98 99 00
Net sales Net income Total assets & Equity ratio
242,038 256,886 271,670 230,998 196,168 4,806 3,957 4,343 2,872 1,922 257,971 279,938 254,456 231,914 238,276
28.6%27.1%
30.8% 34.3% 33.9%
¥ Million ¥ Million ¥ Million

7page
C o n s o l i d a t e d S t a t e m e n t s o f I n c o m e
Thousands ofMillions of yen U.S. dollars (Note 1)
2000 1999 2000 1999
Net sales (Note 12) . . . . . . . . . . . . . . . . . . . . . . . . . . . . ¥196,168 ¥230,998 $1,848,026 $2,176,147
Costs and expenses (Note 12):
Cost of sales . . . . . . . . . . . . . . . . . . . . . . . . . . . . . . . . 176,593 208,887 1,663,617 1,967,848
Selling, general and administrative expenses . . . . . . 14,947 16,302 140,810 153,575
191,540 225,189 1,804,427 2,121,423
Operating income . . . . . . . . . . . . . . . . . . . . . . . . . . . . . 4,628 5,809 43,599 54,724
Other income (expenses):
Interest and dividend income . . . . . . . . . . . . . . . . . . . 780 759 7,348 7,150
Life insurance received . . . . . . . . . . . . . . . . . . . . . . . . 227 280 2,138 2,638
Interest expense . . . . . . . . . . . . . . . . . . . . . . . . . . . . . (395) (450) (3,721) (4,239)
Gain on sale of securities, net . . . . . . . . . . . . . . . . . . 4,303 1,046 40,537 9,854
Prior-year retirement allowance . . . . . . . . . . . . . . . . . (5,251) — (49,468) —
Other – net . . . . . . . . . . . . . . . . . . . . . . . . . . . . . . . . . (563) (1,192) (5,304) (11,229)
(899) 443 (8,470) 4,174
Income before income taxes . . . . . . . . . . . . . . . . . . . 3,729 6,252 35,129 58,898
Income taxes (Note 7):
Current . . . . . . . . . . . . . . . . . . . . . . . . . . . . . . . . . . . . 4,429 3,380 41,724 31,842
Deferred . . . . . . . . . . . . . . . . . . . . . . . . . . . . . . . . . . . (2,622) — (24,701) —
Net income . . . . . . . . . . . . . . . . . . . . . . . . . . . . . . . . . . ¥ 1,922 ¥ 2,872 $ 18,106 $ 27,056
Yen U.S. dollars (Note 1)
2000 1999 2000 1999
Amounts per share of common stock:
Net income . . . . . . . . . . . . . . . . . . . . . . . . . . . . . . . . . ¥22.41 ¥33.49 $0.21 $0.32
Cash dividends applicable to the year . . . . . . . . . . . . 17.00 17.00 0.16 0.16
See accompanying notes.
Takasago Thermal Engineering Co., Ltd. and A Consolidated SubsidiaryYears ended March 31, 2000 and 1999

8
page
C o n s o l i d a t e d B a l a n c e S h e e t s
Takasago Thermal Engineering Co., Ltd. and A Consolidated SubsidiaryMarch 31, 2000 and 1999
Thousands ofMillions of yen U.S. dollars (Note 1)
ASSETS 2000 1999 2000 1999
Current assets:
Cash and time deposits . . . . . . . . . . . . . . . . . . . . . . . ¥ 60,723 ¥ 55,813 $ 572,049 $ 525,794
Marketable securities (Note 4) . . . . . . . . . . . . . . . . . . 11,119 12,001 104,748 113,057
Notes and accounts receivable – trade . . . . . . . . . . . 75,629 82,453 712,473 776,759
Less allowance for doubtful accounts . . . . . . . . . . . . (286) (386) (2,694) (3,636)
Cost of uncompleted contracts . . . . . . . . . . . . . . . . . 33,241 34,289 313,151 323,024
Other current assets . . . . . . . . . . . . . . . . . . . . . . . . . . 10,809 8,957 101,827 84,380
Total current assets . . . . . . . . . . . . . . . . . . . . . 191,235 193,127 1,801,554 1,819,378
Property, plant and equipment – at cost (Note 6):
Land . . . . . . . . . . . . . . . . . . . . . . . . . . . . . . . . . . . . . . . 2,215 2,215 20,867 20,867
Buildings and structures . . . . . . . . . . . . . . . . . . . . . . . 8,224 8,252 77,475 77,739
Machinery . . . . . . . . . . . . . . . . . . . . . . . . . . . . . . . . . . 536 538 5,049 5,068
Equipment . . . . . . . . . . . . . . . . . . . . . . . . . . . . . . . . . . 2,947 3,217 27,763 30,306
13,922 14,222 131,154 133,980
Less accumulated depreciation . . . . . . . . . . . . . . . . . (6,632) (6,417) (62,478) (60,452)
7,290 7,805 68,676 73,528
Investments and other assets:
Investment securities (Note 4) . . . . . . . . . . . . . . . . . . 19,517 13,522 183,862 127,386
Investments in unconsolidated subsidiaries
and affiliated companies . . . . . . . . . . . . . . . . . . . . . . 683 590 6,434 5,558
Guarantee deposits . . . . . . . . . . . . . . . . . . . . . . . . . . . 5,427 6,136 51,126 57,805
Long-term insurance contribution . . . . . . . . . . . . . . . 8,774 8,507 82,656 80,141
Other . . . . . . . . . . . . . . . . . . . . . . . . . . . . . . . . . . . . . . 5,454 2,392 51,380 22,534
Less allowance for doubtful accounts . . . . . . . . . . . . (104) (165) (978) (1,554)
39,751 30,982 374,480 291,870
¥238,276 ¥231,914 $2,244,710 $2,184,776
See accompanying notes.

9page
Thousands ofMillions of yen U.S. dollars (Note 1)
LIABILITIES AND SHAREHOLDERS’ EQUITY 2000 1999 2000 1999
Current liabilities:
Bank loans (Note 6) . . . . . . . . . . . . . . . . . . . . . . . . . . . ¥ 15,227 ¥ 15,974 $ 143,448 $ 150,485
Long-term debt due within one year (Note 6) . . . . . . 2,891 2,641 27,235 24,880
Notes and accounts payable – trade . . . . . . . . . . . . . 88,391 93,510 832,699 880,923
Advances received on uncompleted contracts . . . . . 20,525 21,811 193,358 205,473
Income taxes payable (Note 7) . . . . . . . . . . . . . . . . . . 2,957 984 27,857 9,270
Allowance for claim expenses . . . . . . . . . . . . . . . . . . 218 220 2,054 2,073
Other current liabilities . . . . . . . . . . . . . . . . . . . . . . . . 13,773 9,274 129,750 87,367
Total current liabilities . . . . . . . . . . . . . . . . . . . 143,982 144,414 1,356,401 1,360,471
Long-term debt due after one year (Note 6) . . . . . . . 3,135 3,019 29,533 28,441
Retirement benefits (Note 8) . . . . . . . . . . . . . . . . . . . . 9,645 4,306 90,862 40,565
Other non-current liabilities . . . . . . . . . . . . . . . . . . . . 639 707 6,020 6,660
Contingent liabilities (Note 11) . . . . . . . . . . . . . . . . . . 230 760 2,167 7,160
Shareholders’ equity (Note 9):
Common stock, par value ¥50 per share:
Authorized — 200,000,000 shares
Issued — 85,765,768 shares . . . . . . . . . . . . . 13,135 13,135 123,740 123,740
Additional paid-in capital . . . . . . . . . . . . . . . . . . . . . . 12,854 12,854 121,093 121,093
Retained earnings . . . . . . . . . . . . . . . . . . . . . . . . . . . . 54,887 53,481 517,070 503,825
80,876 79,470 761,903 748,658
Treasury stock, at cost . . . . . . . . . . . . . . . . . . . . . . . . . . (1) (2) (9) (19)
Total shareholders’ equity . . . . . . . . . . . . . . . . 80,875 79,468 761,894 748,639
¥238,276 ¥231,914 $2,244,710 $2,184,776

10
page
C o n s o l i d a t e d S t a t e m e n t s o f S h a r e h o l d e r s ’ E q u i t y
Takasago Thermal Engineering Co., Ltd. and A Consolidated SubsidiaryYears ended March 31, 2000 and 1999
Millions of yen
Number of Additionalshares of Common paid-in Retained
common stock stock capital earnings
Balance at March 31, 1998 . . . . . . . . . . . . . . . . . . . . . . . . 85,765,768 ¥ 13,135 ¥ 12,854 ¥ 52,412
Net income . . . . . . . . . . . . . . . . . . . . . . . . . . . . . . . . . . . . — — — 2,872
Cash dividends paid (¥17 per share) . . . . . . . . . . . . . . . . . — — — (1,458)
Bonuses to directors and corporate auditors . . . . . . . . . — — — (345)
Balance at March 31, 1999 . . . . . . . . . . . . . . . . . . . . . . . . 85,765,768 13,135 12,854 53,481
Cumulative effect of adopting deferred
income tax accounting . . . . . . . . . . . . . . . . . . . . . . . . . . — — — 1,206
Net income . . . . . . . . . . . . . . . . . . . . . . . . . . . . . . . . . . . . — — — 1,922
Cash dividends paid (¥17 per share) . . . . . . . . . . . . . . . . . — — — (1,458)
Bonuses to directors and corporate auditors . . . . . . . . . — — — (264)
Balance at March 31, 2000 . . . . . . . . . . . . . . . . . . . . . . . . 85,765,768 ¥13,135 ¥12,854 ¥54,887
Thousands of U.S. dollars (Note 1)
AdditionalCommon paid-in Retained
stock capital earnings
Balance at March 31, 1998 . . . . . . . . . . . . . . . . . . . . . . . . . . . . . . . . . . . . . $ 123,740 $ 121,093 $ 493,754
Net income . . . . . . . . . . . . . . . . . . . . . . . . . . . . . . . . . . . . . . . . . . . . . . . . . — — 27,056
Cash dividends paid ($0.16 per share) . . . . . . . . . . . . . . . . . . . . . . . . . . . . — — (13,735)
Bonuses to directors and corporate auditors . . . . . . . . . . . . . . . . . . . . . . — — (3,250)
Balance at March 31, 1999 . . . . . . . . . . . . . . . . . . . . . . . . . . . . . . . . . . . . . 123,740 121,093 503,825
Cumulative effect of adopting deferred income tax accounting . . . . . . . . — — 11,361
Net income . . . . . . . . . . . . . . . . . . . . . . . . . . . . . . . . . . . . . . . . . . . . . . . . . — — 18,106
Cash dividends paid ($0.16 per share) . . . . . . . . . . . . . . . . . . . . . . . . . . . . — — (13,735)
Bonuses to directors and corporate auditors . . . . . . . . . . . . . . . . . . . . . . — — (2,487)
Balance at March 31, 2000 . . . . . . . . . . . . . . . . . . . . . . . . . . . . . . . . . . . . . $123,740 $121,093 $517,070
See accompanying notes.

11page
C o n s o l i d a t e d S t a t e m e n t s o f C a s h F l o w s
Takasago Thermal Engineering Co., Ltd. and A Consolidated SubsidiaryYear ended March 31, 2000
Thousands ofMillions of U.S. dollars
yen (Note 1)
2000 2000
Cash flows from operating activities:
Income before income taxes . . . . . . . . . . . . . . . . . . . . . . . . . . . . . . . . . . . . . . . . . ¥ 3,729 $ 35,130
Adjustments to reconcile income before income taxes
to net cash provided by operating activities:
Depreciation and amortization . . . . . . . . . . . . . . . . . . . . . . . . . . . . . . . . . . . . . . 770 7,254
Gain on sale of marketable and investment securities . . . . . . . . . . . . . . . . . . . (4,883) (46,001)
Provision for retirement benefits . . . . . . . . . . . . . . . . . . . . . . . . . . . . . . . . . . . . 5,338 50,287
Decrease in trade receivables . . . . . . . . . . . . . . . . . . . . . . . . . . . . . . . . . . . . . . . 7,209 67,913
Decrease in cost of uncompleted contracts . . . . . . . . . . . . . . . . . . . . . . . . . . . . 1,047 9,863
Decrease in trade payables . . . . . . . . . . . . . . . . . . . . . . . . . . . . . . . . . . . . . . . . . (5,119) (48,224)
Decrease in advances received on uncompleted contracts . . . . . . . . . . . . . . . (1,286) (12,115)
Other— net . . . . . . . . . . . . . . . . . . . . . . . . . . . . . . . . . . . . . . . . . . . . . . . . . . . . . 3,594 33,858
10,399 97,965
Interest and dividends received . . . . . . . . . . . . . . . . . . . . . . . . . . . . . . . . . . . . . 780 7,348
Interest paid . . . . . . . . . . . . . . . . . . . . . . . . . . . . . . . . . . . . . . . . . . . . . . . . . . . . (389) (3,665)
Income taxes paid . . . . . . . . . . . . . . . . . . . . . . . . . . . . . . . . . . . . . . . . . . . . . . . . (2,457) (23,146)
Net cash provided by operating activities . . . . . . . . . . . . . . . . . . . . . . . . . . . . 8,333 78,502
Cash flows from investing activities:
Purchase of marketable and investment securities . . . . . . . . . . . . . . . . . . . . . . . . (13,422) (126,444)
Proceeds from sale of marketable and investment securities . . . . . . . . . . . . . . . 12,204 114,969
Purchase of property, plant and equipment . . . . . . . . . . . . . . . . . . . . . . . . . . . . . (258) (2,431)
Payments of long-term insurance contribution . . . . . . . . . . . . . . . . . . . . . . . . . . . (1,425) (13,424)
Proceeds from long-term insurance contribution . . . . . . . . . . . . . . . . . . . . . . . . . 1,158 10,909
Other— net . . . . . . . . . . . . . . . . . . . . . . . . . . . . . . . . . . . . . . . . . . . . . . . . . . . . . . . 792 7,462
Net cash used in investing activities . . . . . . . . . . . . . . . . . . . . . . . . . . . . . . . . (951) (8,959)
Cash flows from financing activities :
Net decrease in bank loans . . . . . . . . . . . . . . . . . . . . . . . . . . . . . . . . . . . . . . . . . . (732) (6,896)
Proceeds from long-term debt . . . . . . . . . . . . . . . . . . . . . . . . . . . . . . . . . . . . . . . . 3,249 30,608
Payments of long-term debt . . . . . . . . . . . . . . . . . . . . . . . . . . . . . . . . . . . . . . . . . . (2,898) (27,301)
Cash dividends paid . . . . . . . . . . . . . . . . . . . . . . . . . . . . . . . . . . . . . . . . . . . . . . . . (1,458) (13,735)
Other— net . . . . . . . . . . . . . . . . . . . . . . . . . . . . . . . . . . . . . . . . . . . . . . . . . . . . . . . 1 9
Net cash used in financing activities . . . . . . . . . . . . . . . . . . . . . . . . . . . . . . . . (1,838) (17,315)
Change in cash and cash equivalents . . . . . . . . . . . . . . . . . . . . . . . . . . . . . . . . . . (279) (2,628)
Net decrease in cash and cash equivalents . . . . . . . . . . . . . . . . . . . . . . . . . . . . . 5,265 49,600
Cash and cash equivalents at beginning of year . . . . . . . . . . . . . . . . . . . . . . . . . 40,006 376,881
Cash and cash equivalents at end of year . . . . . . . . . . . . . . . . . . . . . . . . . . . . . . ¥ 45,271 $ 426,481

12
page
C o n s o l i d a t e d S t a t e m e n t s o f C a s h F l o w s
Takasago Thermal Engineering Co., Ltd. and A Consolidated SubsidiaryYear ended March 31, 1999
Thousands ofMillions of U.S. dollars
yen (Note 1)
1999 1999
Cash flows from operating activities:
Net income . . . . . . . . . . . . . . . . . . . . . . . . . . . . . . . . . . . . . . . . . . . . . . . . . . . . . . . ¥ 2,872 $ 27,056
Adjustments to reconcile net income to net cash used in operating activities:
Depreciation and amortization . . . . . . . . . . . . . . . . . . . . . . . . . . . . . . . . . . . . . . 598 5,634
Loss on sale of marketable and investment securities . . . . . . . . . . . . . . . . . . . 221 2,082
Provision for retirement benefits . . . . . . . . . . . . . . . . . . . . . . . . . . . . . . . . . . . . (143) (1,347)
Other—net . . . . . . . . . . . . . . . . . . . . . . . . . . . . . . . . . . . . . . . . . . . . . . . . . . . . . . 135 1,272
Changes in assets and liabilities:
Decrease in trade receivables . . . . . . . . . . . . . . . . . . . . . . . . . . . . . . . . . . . . . . . . 4,912 46,274
Decrease in cost of uncompleted contracts . . . . . . . . . . . . . . . . . . . . . . . . . . . . . 5,552 52,303
Decrease in trade payables . . . . . . . . . . . . . . . . . . . . . . . . . . . . . . . . . . . . . . . . . . (11,153) (105,068)
Decrease in advances received on uncompleted contracts . . . . . . . . . . . . . . . . . (3,627) (34,169)
Decrease in income taxes payable . . . . . . . . . . . . . . . . . . . . . . . . . . . . . . . . . . . . . (1,829) (17,230)
Decrease in deposit received . . . . . . . . . . . . . . . . . . . . . . . . . . . . . . . . . . . . . . . . . (141) (1,329)
Other—net . . . . . . . . . . . . . . . . . . . . . . . . . . . . . . . . . . . . . . . . . . . . . . . . . . . . . . . (2,601) (24,503)
Net cash used in operating activities . . . . . . . . . . . . . . . . . . . . . . . . . . . . . . . (5,204) (49,025)
Cash flows from investing activities:
Purchase of property, plant and equipment . . . . . . . . . . . . . . . . . . . . . . . . . . . . . (763) (7,188)
Purchase of marketable and investment securities . . . . . . . . . . . . . . . . . . . . . . . . (10,492) (98,842)
Proceeds from sale of marketable and investment securities . . . . . . . . . . . . . . . 7,778 73,274
Other—net . . . . . . . . . . . . . . . . . . . . . . . . . . . . . . . . . . . . . . . . . . . . . . . . . . . . . . . (533) (5,021)
Net cash used in investing activities . . . . . . . . . . . . . . . . . . . . . . . . . . . . . . . . (4,010) (37,777)
Cash flows from financing activities:
Proceeds from long-term debt . . . . . . . . . . . . . . . . . . . . . . . . . . . . . . . . . . . . . . . . 5,688 53,585
Payments of long-term debt . . . . . . . . . . . . . . . . . . . . . . . . . . . . . . . . . . . . . . . . . . (5,455) (51,390)
Net decrease in bank loans . . . . . . . . . . . . . . . . . . . . . . . . . . . . . . . . . . . . . . . . . . (784) (7,386)
Cash dividends paid . . . . . . . . . . . . . . . . . . . . . . . . . . . . . . . . . . . . . . . . . . . . . . . . (1,458) (13,735)
Other—net . . . . . . . . . . . . . . . . . . . . . . . . . . . . . . . . . . . . . . . . . . . . . . . . . . . . . . . (347) (3,269)
Net cash used in financing activities . . . . . . . . . . . . . . . . . . . . . . . . . . . . . . . . (2,356) (22,195)
Net decrease in cash and time deposits . . . . . . . . . . . . . . . . . . . . . . . . . . . . . . (11,570) (108,997)
Cash and time deposits at beginning of year . . . . . . . . . . . . . . . . . . . . . . . . . . 67,383 634,791
Cash and time deposits at end of year . . . . . . . . . . . . . . . . . . . . . . . . . . . . . . . ¥ 55,813 $ 525,794

13page
N o t e s t o C o n s o l i d a t e d F i n a n c i a l S t a t e m e n t s
Takasago Thermal Engineering Co., Ltd. and A Consolidated SubsidiaryYears ended March 31, 2000 and 1999
1. Basis of presenting consolidated financial statementsTakasago Thermal Engineering Co., Ltd. (the “Company”) and its consolidated domestic subsidiary maintain their accounts andrecords in accordance with the provisions set forth in the Japanese Commercial Code and the Securities and Exchange Law andin conformity with accounting principles and practices generally accepted in Japan, which are different from the accounting anddisclosure requirements of International Accounting Standards.
The accompanying consolidated financial statements are a translation of the audited consolidated financial statements of theCompany which were prepared in accordance with accounting principles and practices generally accepted in Japan from theaccounts and records maintained by the Company and its consolidated subsidiaries and were filed with the Minister of Finance(“MOF”) as required by the Securities and Exchange Law.
In preparing the accompanying consolidated financial statements, certain reclassifications have been made in the consoli-dated financial statements issued domestically in order to present them in a form which is more familiar to readers outsideJapan. The consolidated statements of shareholders’ equity for 2000 and 1999 and cash flows for 1999 have been prepared forthe purpose of inclusion in the consolidated financial statements, although such statements were not customarily prepared inJapan and were not required to be filed with MOF.
The translation of the Japanese yen amounts into U.S. dollars are included solely for the convenience of the reader, using theprevailing exchange rate at March 31, 2000, which was ¥106.15 to U.S.$1.00. The convenience translations should not be con-strued as representations that the Japanese yen amounts have been, could have been, or could in the future be, converted intoU.S. dollars at this or any other rate of exchange.
2. Summary of significant accounting policiesConsolidation — The Company prepared the consolidated financial statements for the year ended March 31, 2000 in accordancewith the revised Accounting Principles for Consolidated Financial Statements (the “Revised Accounting Principles”) effective fromthe year ended March 31, 2000. The consolidated financial statements for 2000 includes the accounts of the Company and asignificant company which are controlled by the Company through substantial ownership of more than 50% of the voting rightsand existence of certain conditions evidencing control by the Company of the decision-making body of such companies. Underthe Revised According Principles, certain companies of which the Company has at least 15% and less than 20% of the votingrights in the cases where the Company has the ability to exercise significant influence over operating and financial policies of theinvestees are also accounted for using the equity method.
Previously, only majority-owned companies were consolidated and only investments in companies of which the Companyowns 20% to 50% of the voting rights and has the ability to significantly financial, operational or business policies were accountedfor using the equity method. There were no effect of applying the Revised Accounting Principles to the Company’s consolidatedfinancial statements. The prior years’ consolidated financial statements have not been restated. Material inter-company balances,transaction and profits have been eliminated in consolidation.
The consolidated financial statements include the accounts of the Company and a significant subsidiary “Nihon Pmac Co., Ltd.”.All significant inter-company transactions and accounts have been eliminated in consolidation.The investments in unconsolidated subsidiaries and affiliated companies are stated at cost as they are insignificant in the
aggregate.
Marketable securities and investment securities — Securities (both quoted and non-quoted) are stated at cost determined bythe moving-average method and written down to the market price or an estimated realizable value if the securities have beensignificantly impaired and the impairment is not considered to be recoverable.
Allowance for doubtful accounts — Allowance for doubtful accounts is provided in amounts sufficient to cover possible losseson collection. It consists of the estimated uncollectible amount with respect to identified doubtful accounts and an amountcalculated according to the formula provided by the Japanese tax regulations with respect to the remaining receivables.
Allowance for claim expenses — Allowance for claim expenses is provided in amounts sufficient to cover possible claim expenseson completed contracts. The Company adopts the method of providing the allowance based on the estimated amount of pay-ments for future claims which may be filed on contracts completed during the year.
Construction contracts — Construction contracts of the Company are accounted for by the completed contract method.Expenditures on uncompleted contracts to be charged to cost of contracts at the time of completion are included in current
assets. These expenditures are not offset against advances received on uncompleted contracts, which are instead included incurrent liabilities. No profits or losses, therefore, are recognized before the completion of the work.
Construction contracts which amount will be collected in long-term installment payments are accounted for on the install-ment basis in accordance with the Japanese tax regulations. For the years ended March 31, 2000 and 1999, no such contractswere outstanding.
Property, plant and equipment — Property, plant and equipment are stated at cost. For both financial reporting and incometax purposes, depreciation is computed using the declining-balance method over their useful lives as prescribed in theJapanese tax regulations.
Software costs — In accordance with the provisional rule of the JICPA’s Accounting Committee Report No.12 “Practical Guidancefor Accounting for Research and Development Costs, etc.”(the “Report”), the Company accounts for software which was included inlong-term prepaid expenses in investments and other in the same manner in 2000 as in 1999. Pursuant to the Report, however,the Company included software in intangible assets in 2000 and depreciated it using the straight-line method over the estimateduseful lives (five years). The amount for 1999 has been reclassified to conform to the 2000 presentation.
Certain lease transactions — Finance leases except these for which the ownership of the leased assets is considered to be trans-ferred to the lessee, are not capitalized and accounted for in the same manner as operating leases (non-capitalized finance leases).

14
page
Retirement benefits — Employees’ retirement benefits are provided through three arrangements, an unfunded lump-sum benefitplan and two funded pension plans. Under the terms of the Company’s retirement plan, substantially all employees are entitledto a lump-sum payment at the time of retirement. The amount of retirement benefits is, in general, based on the length of ser-vice, basic salary at the time of retirement and cause of retirement. The liability for lump-sum payments is stated at 100% of theamount which would be required if all eligible employees voluntarily terminated employment at the balance sheet date, less theportions expected to be covered by the pension plans.
Prior to April 1, 1999, allowance for retirement benefits for employees had been provided at 40% of the amount which wouldbe required if all eligible employees voluntarily terminated employment at the balance sheet date, less the portions expected tobe covered by the pension plans. Effective from the year ended March 31, 2000, Takasago Thermal Engineering Co., Ltd. and aconsolidated a subsidiary provided 100% instead of 40% of the amount which would be required if all eligible employees volun-tarily terminated employment at the balance sheet date, less the portions expected to be covered by the pension plans.
The change resulted in a decreases, in operating income by ¥23 million ($217 thousand) and in increases in income beforeincome taxes and other items by ¥5,275 million ($49,694 thousand).
The change was made in order to strengthen the financial position of the Company. The Company realized that the portion ofthe employees’ retirement benefits that was not covered by the liabilities was very large, since the amounts of retirement pay-ments were estimated to increase in the future due to such factors as the numbers of employees by age group, estimated rateof employees’ severance in the future, etc.
The Company and its consolidated subsidiary have contributory and non-contributory plan funded pension plans coveringsubstantially all employees. Eligibility for enrollment in the contributory plan is 5 or more years of service and 23 or more yearsof age. Eligibility for the non-contributory is 3 or more years of service . Annual contributions, which consist of current periodcosts and amortization of prior service costs over 8.5 years and 20 years, respectively, are charged to income when paid.
The liability for retirement benefits to directors and corporate auditors are fully accrued and included in “Retirement benefits”in the accompanying balance sheets.
Bonuses to directors and corporate auditors — Bonuses to directors and corporate auditors, which are subject to shareholders’approval at the annual shareholders’ meeting under the Commercial Code of Japan, are accounted for as appropriations ofretained earnings.
Income taxes — The Company provided income taxes at the amounts currently payable for the years through March 31, 1999.Effective April 1, 1999, the Company adopted the new accounting standard, which recognizes tax effects of temporary differ-ences between the financial statement carrying amounts and the tax basis of assets and liabilities. Under the new accountingstandard, the provision for income taxes is computed based on the pretax income included in the consolidated statement ofincome. The asset and liability approach is used to recognize deferred tax assets and liabilities for the expected future taxconsequences of temporary differences.
The amount of deferred income taxes attributable to the net tax effects of the temporary differences at April 1, 1999, isreflected as an adjustment of ¥1,206 million ($11,361 thousand) to the retained earnings brought forward from the previous year.Prior years’ financial statements have not been restated.
The effect for the year ended March 31, 2000 was to increase net income by ¥2,622 million ($24,701 thousand) and theretained earnings at that date by ¥3,828 million ($36,062 thousand).
Foreign currency translation — Current monetary assets and liabilities denominated in foreign currencies are translated intoJapanese yen at the rate of exchange in effect at the balance sheet date. Non-current monetary assets and liabilities are trans-lated at historical rate.
Revenues and expenses resulted from the Company’s overseas operations are translated at the rate of exchange prevailingwhen the relevant transaction was made. Exchange gains and losses are credited or charged to income.
Amounts per share of common stock — In computing net income per share of common stock, the average number of sharesoutstanding during each fiscal year has been used.
Diluted net income per share is not presented, since the Company has never issued any securities with dilute effect.Cash dividends per share represent actual amounts declared as applicable to the respective years.
Reclassifications — Certain prior year amounts have been reclassified to conform to 2000 presentation. These changes had noimpact on previously reported results of operations or shareholders’ equity.
Cash flow statement and cash and cash equivalents — In preparing the consolidated statements of cash flows, cash on hand,readily-available deposits and short-term highly liquid investments with maturities of not exceeding three months at the time ofpurchase are considered to be cash and cash equivalents.
The Company prepared the 2000 consolidated cash flow statement as required by and in accordance with the “Standards forPreparation of Consolidated Cash Flow Statements, etc.” effective from the year ended March 31, 2000. The 1999 consolidatedcash flow statement, which was voluntarily prepared for the purpose of inclusion in the consolidated financial statements in aform familiar to readers outside Japan, has not been restated. Significant differences in the consolidated cash flow statementsfor 2000 and 1999 include the use of pretax income in 2000 instead of net income in 1999, additional disclosure in cash flowsfrom operating activities in 2000 of interest expense, income tax expense, interest and dividend income and interest anddividend received.

15page
3. Cash and cash equivalentsCash and cash equivalents at March 31, 2000 consisted of the following:
Millions of Thousands of2000 yen U.S.dollars
Cash and time deposits . . . . . . . . . . . . . . . . . . . . . . . . . . . . . . . . . . . . . . . . . . . . . . . . . . . . . . . . . . ¥ 60,723 $ 572,049Time deposits over three months . . . . . . . . . . . . . . . . . . . . . . . . . . . . . . . . . . . . . . . . . . . . . . . . . . (14,051) (132,369)Special trust fund . . . . . . . . . . . . . . . . . . . . . . . . . . . . . . . . . . . . . . . . . . . . . . . . . . . . . . . . . . . . . . . (1,401) (13,199)
Cash and cash equivalents . . . . . . . . . . . . . . . . . . . . . . . . . . . . . . . . . . . . . . . . . . . . . . . . . . . . . . . . ¥ 45,271 $ 426,481
4. Market value information for securitiesAt March 31, 2000 and 1999, book value, market value and net unrealized gains of quoted securities were as follows:
Thousands ofMillions of yen U.S. dollars (Note 1)
2000 1999 2000 1999
Book value:Current . . . . . . . . . . . . . . . . . . . . . . . . . . . . . . . . . . . . . . . . . . . . . . . . . ¥ 7,818 ¥ 8,594 $ 73,650 $ 80,961Non-current . . . . . . . . . . . . . . . . . . . . . . . . . . . . . . . . . . . . . . . . . . . . . . 17,518 11,529 165,031 108,611
25,336 20,123 238,681 189,572Market value:
Current . . . . . . . . . . . . . . . . . . . . . . . . . . . . . . . . . . . . . . . . . . . . . . . . . 9,420 10,360 88,742 97,598Non-current . . . . . . . . . . . . . . . . . . . . . . . . . . . . . . . . . . . . . . . . . . . . . . 18,762 16,054 176,750 151,239
28,182 26,414 265,492 248,837
Net unrealized gains . . . . . . . . . . . . . . . . . . . . . . . . . . . . . . . . . . . . . . . . . ¥ 2,846 ¥ 6,291 $ 26,811 $ 59,265
5. Derivative transactions — the Company onlyStatus of derivative transactionThe Company utilizes, at present, only forward foreign exchange contracts as derivative transactions, in order to hedge foreigncurrency risks arising form time deposit.
At the end of the year, the Company had forward foreign exchange contracts to sell foreign currencies for hedging foreigncurrency denominated time deposit and its interest.
The derivative transactions are made solely with highly rated financial institutions, therefore, the Company expects creditrisk is low.
The contracts relating to foreign currency denominated time deposit were approved by the General Manager of Accountingand Finance and contracted by Accounting and Finance department, and then the results will be reported to the GeneralManager of operations.
Market value of derivative transactionsThe aggregate amounts contracted to be paid or received and the fair value of derivative transactions in Japanese yen only ofthe Company at March 31, 2000 and 1999 were as follows:
Currency related derivatives:Millions of yen
Contract amount
2000 Total Due after one year Market value Unrealized gain (loss)
Forward contracts:To sell:
U.S. dollars . . . . . . . . . . . . . . . . . . . . . . . . . . . . . . . . ¥99 — ¥99 —
Total . . . . . . . . . . . . . . . . . . . . . . . . . . . . . . . . . . . . . ¥99 — ¥99 —
Millions of yen
Contract amount
1999 Total Due after one year Market value Unrealized gain (loss)
Forward contracts:To sell:
U.K. pound . . . . . . . . . . . . . . . . . . . . . . . . . . . . . . . . ¥41 — ¥41 —
Total . . . . . . . . . . . . . . . . . . . . . . . . . . . . . . . . . . . . . ¥41 — ¥41 —
The above market value has been calculated based on the forward rates submitted by the city bank.

16
page
6. Bank loans and long-term debtBank loans at March 31, 2000 and 1999 were represented by short-term notes, bearing interest principally at 1.375% to 1.875%per annum and at 1.4% to 1.9% per annum, respectively. The Company has had no difficulty in renewing such notes when itconsidered such renewal advisable.
Long-term debt at March 31, 2000 and 1999 consisted of the following:Thousands of
Millions of yen U.S. dollars (Note 1)
2000 1999 2000 1999
Loans principally from banks and insurance companies:Secured, at interest rates of 1.95% to 3% maturingthrough 2004 with respect to 2000 and 2.2% to 2.6%maturing through 2003 with respect to 1999 . . . . . . . . . . . . . . . . . . ¥ 1,500 ¥ 1,536 $ 14,131 $ 14,470
Unsecured, at interest rates of 1.7% to 2.3% maturingthrough 2004 with respect to 2000 and 2.0 % to 3.2%maturing through 2003 with respect to 1999 . . . . . . . . . . . . . . . . . . 4,526 4,124 42,638 38,851
6,026 5,660 56,769 53,321Less amount due within one year . . . . . . . . . . . . . . . . . . . . . . . . . . . . . . (2,891) (2,641) (27,235) (24,880)
¥ 3,135 ¥ 3,019 $ 29,534 $ 28,441
As is customary in Japan, security must be given if requested by a lending bank and such bank has the right to offset cashdeposited with it against any debt or obligation that becomes due and, in the case of default or certain other specified events,against all debt payable to the bank. The Company has never received any such request.
The annual maturities of long-term debt at March 31, 2000 were as follows:Thousands of
Millions of U.S. dollarsYears ending March 31, yen (Note 1)
2001 . . . . . . . . . . . . . . . . . . . . . . . . . . . . . . . . . . . . . . . . . . . . . . . . . . . . . . . . . . . . . . . . . . . . . . . . . . . . ¥2,891 $27,2352002 . . . . . . . . . . . . . . . . . . . . . . . . . . . . . . . . . . . . . . . . . . . . . . . . . . . . . . . . . . . . . . . . . . . . . . . . . . . . 1,927 18,1542003 . . . . . . . . . . . . . . . . . . . . . . . . . . . . . . . . . . . . . . . . . . . . . . . . . . . . . . . . . . . . . . . . . . . . . . . . . . . . 976 9,1952004 . . . . . . . . . . . . . . . . . . . . . . . . . . . . . . . . . . . . . . . . . . . . . . . . . . . . . . . . . . . . . . . . . . . . . . . . . . . . 232 2,186
At March 31, 2000 assets pledged as collateral for long-term debt and guarantees were as follows:Thousands of
Millions of U.S. dollarsyen (Note 1)
Property, plant and equipment(Net of accumulated depreciation) . . . . . . . . . . . . . . . . . . . . . . . . . . . . . . . . . . . . . . . . . . . . . . . . . . . . ¥304 $2,864
¥304 $2,864
7. Income taxesTaxes on income consist of corporation, enterprise and inhabitants taxes. The aggregate normal effective tax rate on incomebefore income taxes was approximately 42.1 % for 2000 and 1999.
The actual effective tax rate in the accompanying statements of income differed from the normal effective tax rate primarilyas a result of expenses not deductible for tax purposes, and the effect of temporary differences in recognizing revenue andexpenses for financial statements and tax returns.
The following table summarizes the significant differences between the statutory tax rate and the Company’s effective taxrate for financial statement purposes for the year ended March 31, 2000:
Statutory tax rate . . . . . . . . . . . . . . . . . . . . . . . . . . . . . . . . . . . . . . . . . . . 42.1%Non-taxable dividend income . . . . . . . . . . . . . . . . . . . . . . . . . . . . . . . . (3.9)Non-deductible expenses . . . . . . . . . . . . . . . . . . . . . . . . . . . . . . . . . . . 8.9Per capital inhabitant tax . . . . . . . . . . . . . . . . . . . . . . . . . . . . . . . . . . . 2.5Other . . . . . . . . . . . . . . . . . . . . . . . . . . . . . . . . . . . . . . . . . . . . . . . . . . . (1.1)
Effective tax rate . . . . . . . . . . . . . . . . . . . . . . . . . . . . . . . . . . . . . . . . . . . 48.5%
Significant components of the Company’s deferred tax assets and liabilities as of March 31, 2000 were as follows:
Millions of yen
Deferred tax assets:Retirement benefits . . . . . . . . . . . . . . . . . . . . . . . . . . . . . . . . . . . . . . . ¥2,835Enterprise taxes . . . . . . . . . . . . . . . . . . . . . . . . . . . . . . . . . . . . . . . . . . 310Write down of investment securities . . . . . . . . . . . . . . . . . . . . . . . . . . 178Write down of golf membership . . . . . . . . . . . . . . . . . . . . . . . . . . . . . . 185Other . . . . . . . . . . . . . . . . . . . . . . . . . . . . . . . . . . . . . . . . . . . . . . . . . . . 320
Total deferred tax assets . . . . . . . . . . . . . . . . . . . . . . . . . . . . . . . . . . 3,828Valuation allowance . . . . . . . . . . . . . . . . . . . . . . . . . . . . . . . . . . . . . . . . . —
Net deferred tax assets . . . . . . . . . . . . . . . . . . . . . . . . . . . . . . . . . . . ¥3,828

17page
8. Retirement benefitsTotal assets held by a pension plan amounted to ¥6,513 million ($61,357 thousand) at August 31, 1999 and those held by theother plan amounted to ¥6,285 million ($59,209 thousand) at March 31, 1999, the latest dates when such information isavailable, respectively.
Charges with respect to the lump-sum benefit plan and the funded pension plans were ¥5,889 million ($55,478 thousand) and¥616 million ($5,803 thousand) for the years ended March 31, 2000 and 1999, respectively.
9. Shareholders’ equityThe Company is required to appropriate as legal reserve certain amount of retained earnings equal to at least 10% of cashdividends and bonuses to directors and corporate auditors in each period until the reserve equals 25% of common stock. Thisreserve is not available for dividends but may be used to reduce a deficit by resolution of the shareholders’ meeting or may becapitalized by resolution of the Board of Directors. Legal reserve is included in retained earnings.
The maximum amount that the Company can distribute as dividends is calculated based on the unconsolidated financialstatements of the Company and in accordance with the Commercial Code of Japan.
10. Certain lease transactionsInformation on finance leases except those for which ownership of the leased assets is considered to be transferred to lesseeare following:(1) The following is information regarding lease transactions as March 31, 2000 and 1999:
Millions of yen
2000 1999
Acquisition Accumulated Net book Acquisition Accumulated Net bookcost depreciation value cost depreciation value
Equipment . . . . . . . . . . . . . . . . . . . . . . ¥1,701 ¥975 ¥726 ¥1,836 ¥824 ¥1,012
Total . . . . . . . . . . . . . . . . . . . . . . ¥1,701 ¥975 ¥726 ¥1,836 ¥824 ¥1,012
Thousands of U.S. dollars (Note 1)
2000
Acquisition Accumulated Net bookcost depreciation value
Equipment . . . . . . . . . . . . . . . . . . . . . . $16,024 $9,185 $6,839
Total . . . . . . . . . . . . . . . . . . . . . . $16,024 $9,185 $6,839
Depreciation is calculated based on straight-line method over contracted lease period assuming no residual values.
(2) The amounts of outstanding future lease payments due at March 31, 2000 and 1999, and total lease expenses as lessee forthe year ended March 31, 2000 and 1999 were as follows:
Thousands ofMillions of yen U.S. dollars (Note 1)
Future lease payments 2000 1999 2000 1999
Within one year . . . . . . . . . . . . . . . . . . . . . . . . . . . . . . . . . . . . . . . . . . . . . . . ¥386 ¥ 406 $3,636 $3,825Over one year . . . . . . . . . . . . . . . . . . . . . . . . . . . . . . . . . . . . . . . . . . . . . . 352 620 3,316 5,841
Total . . . . . . . . . . . . . . . . . . . . . . . . . . . . . . . . . . . . . . . . . . . . . . . . . . . . 738 1,026 6,952 9,666
Total lease expenses . . . . . . . . . . . . . . . . . . . . . . . . . . . . . . . . . . . . . . . . . . ¥424 ¥ 424 $3,994 $3,994
(3) Other information regarding certain lease transaction for the year ended March 31, 2000 and 1999 were as follows:Thousands of
Millions of yen U.S. dollars (Note 1)
2000 1999 2000 1999
Depreciation equivalent . . . . . . . . . . . . . . . . . . . . . . . . . . . . . . . . . . . . . . . . ¥409 ¥409 $3,853 $3,853Interest equivalent . . . . . . . . . . . . . . . . . . . . . . . . . . . . . . . . . . . . . . . . . . . . 13 20 122 188
11. Contingent liabilitiesContingent liabilities at March 31, 2000 and 1999 were as follows:
Thousands ofMillions of yen U.S. dollars (Note 1)
2000 1999 2000 1999
For notes discounted with banks . . . . . . . . . . . . . . . . . . . . . . . . . . . . . . . . . ¥ 52 ¥356 $ 490 $3,354For notes endorsed . . . . . . . . . . . . . . . . . . . . . . . . . . . . . . . . . . . . . . . . . . . – 83 – 782For guarantees for loans of unconsolidated subsidiaries,employees and others from banks . . . . . . . . . . . . . . . . . . . . . . . . . . . . . . . 178 321 1,677 3,024
¥230 ¥760 $2,167 $7,160

18
page
12. Segment informationThe Company and its consolidated subsidiary are mainly engaged in the construction business and the sale and production of equipment.
Summaries of net assets, operating income and total assets by industry for the years ended March 31, 2000 and 1999 wereas follows:
Millions of yen
2000 Construction Equipment Total Elimination Consolidated
Net sales:Outside customers . . . . . . . . . . . . . . . . . . . . . . . ¥190,570 ¥5,598 ¥196,168 ¥ — ¥196,168Inside group . . . . . . . . . . . . . . . . . . . . . . . . . . . . — 764 764 (764) —
Total . . . . . . . . . . . . . . . . . . . . . . . . . . . . . . . 190,570 6,362 196,932 (764) 196,168Costs and expenses . . . . . . . . . . . . . . . . . . . . . . 186,672 5,774 192,446 (906) 191,540
Operating income . . . . . . . . . . . . . . . . . . . . . . . . ¥ 3,898 ¥ 588 ¥ 4,486 ¥ 142 ¥ 4,628
Assets and others:Assets . . . . . . . . . . . . . . . . . . . . . . . . . . . . . . . . . ¥232,616 ¥6,738 ¥239,354 ¥(1,078) ¥238,276Depreciation . . . . . . . . . . . . . . . . . . . . . . . . . . . . 687 84 771 (1) 770Capital Expenditures . . . . . . . . . . . . . . . . . . . . . . 207 51 258 — 258
Millions of yen
1999 Construction Equipment Total Elimination Consolidated
Net sales:Outside customers . . . . . . . . . . . . . . . . . . . . . . . ¥225,832 ¥5,166 ¥230,998 ¥ — ¥230,998Inside group . . . . . . . . . . . . . . . . . . . . . . . . . . . . — 957 957 (957) —
Total . . . . . . . . . . . . . . . . . . . . . . . . . . . . . . . 225,832 6,123 231,955 (957) 230,998Costs and expenses . . . . . . . . . . . . . . . . . . . . . . 220,724 5,512 226,236 (1,047) 225,189
Operating income . . . . . . . . . . . . . . . . . . . . . . . . ¥ 5,108 ¥ 611 ¥ 5,719 ¥ 90 ¥ 5,809
Assets and others:Assets . . . . . . . . . . . . . . . . . . . . . . . . . . . . . . . . . ¥226,455 ¥6,285 ¥232,740 ¥ (826) ¥231,914Depreciation . . . . . . . . . . . . . . . . . . . . . . . . . . . . 563 31 594 (1) 593Capital Expenditures . . . . . . . . . . . . . . . . . . . . . . 581 16 597 (6) 591
Thousands of U.S. dollars (Note 1)
2000 Construction Equipment Total Elimination Consolidated
Net sales:Outside customers . . . . . . . . . . . . . . . . . . . . . . . $1,795,290 $52,736 $1,848,026 $ — $1,848,026Inside group . . . . . . . . . . . . . . . . . . . . . . . . . . . . — 7,198 7,198 (7,198) —
Total . . . . . . . . . . . . . . . . . . . . . . . . . . . . . . . 1,795,290 59,934 1,855,224 (7,198) 1,848,026Costs and expenses . . . . . . . . . . . . . . . . . . . . . . 1,758,568 54,395 1,812,963 (8,536) 1,804,427
Operating income . . . . . . . . . . . . . . . . . . . . . . . . $ 36,722 $ 5,539 $ 42,261 $ 1,338 $ 43,599
Assets and others:Assets . . . . . . . . . . . . . . . . . . . . . . . . . . . . . . . . . $2,191,389 $63,476 $2,254,865 $(10,155) $2,244,710Depreciation . . . . . . . . . . . . . . . . . . . . . . . . . . . . 6,472 791 7,263 (9) 7,254Capital Expenditures . . . . . . . . . . . . . . . . . . . . . . 1,950 480 2,430 — 2,430
None of segment information by location nor overseas sales is shown from materiality view point.
13. Subsequent eventThe following appropriations of retained earnings at March 31, 2000, were approved at the annual meeting of shareholders heldon June 29, 2000:
Thousands ofMillions of U.S.dollars
yen (Note 1)
Year-end cash dividends ¥8.5 ($0.07) per share . . . . . . . . . . . . . . . . . . . . . . . . . . . . . . . . . . . . . . . . . . . ¥728 $6,858Bonuses to directors and corporate auditors . . . . . . . . . . . . . . . . . . . . . . . . . . . . . . . . . . . . . . . . . . . . . 264 2,487
19page
R e p o r t o f I n d e p e n d e n t P u b l i c A c c o u n t a n t s
To the Shareholders and the Board of Directors of
Takasago Thermal Engineering Co., Ltd.
We have audited the accompanying consolidated balance sheets of Takasago Thermal Engineering Co., Ltd. and a
subsidiary as of March 31, 2000 and 1999, and the related consolidated statements of income, shareholders’
equity and cash flows for the years then ended, expressed in Japanese yen. Our audits were made in accordance
with generally accepted auditing standards in Japan and, accordingly, included such tests of the accounting
records and such other auditing procedures as we considered necessary in the circumstances.
In our opinion, the consolidated financial statements referred to above present fairly the consolidated financial
position of Takasago Thermal Engineering Co., Ltd. and a subsidiary as of March 31, 2000 and 1999, and the con-
solidated results of their operations and their cash flows for the years then ended in conformity with accounting
principles generally accepted in Japan applied on a consistent basis during the periods, except as noted in the
following paragraph.
As explained in Note 2, in the year ended March 31, 2000, Takasago Thermal Engineering Co., Ltd. and a subsidiary
prospectively adopted new Japanese accounting standards for consolidation, income taxes and research and devel-
opment costs. Also, Takasago thermal Engineering Co., Ltd. and a subsidiary changed the method of accounting for
employees’ retirement benefits, effective April 1, 1999, as referred to in Note 2, with which we concur.
Also, in our opinion, the U.S. dollar amounts in the accompanying consolidated financial statements have been
translated from Japanese yen on the basis set forth in Note 1.
Tokyo, Japan
June 29, 2000
Statement on Accounting Principles and Auditing StandardsThis statement is to remind users that accounting principles and auditing standards and their application in practice may vary
among nations and therefore could affect, possibly materially, the reported financial position and results of operations. The
accompanying financial statements are prepared based on accounting principles generally accepted in Japan, and the auditing
standards and their application in practice are those generally accepted in Japan. Accordingly, the accompanying consolidated
financial statements and the auditors’ report presented above are for users familiar with Japanese accounting principles,
auditing standards and their application in practice.

20
page
D i r e c t o r y
(Domestic Offices)
Head Office4-2-8 Kanda Surugadai,Chiyoda-ku, Tokyo 101-8321, JapanTel: 81-3-3255-8212Fax: 81-3-3251-0914R&D Center: Atsugi, Sendai
Tokyo Main Office4-2-8 Kanda Surugadai,
Chiyoda-ku, Tokyo 101-8321, Japan
Tel: 81-3-3255-8221
Fax: 81-3-3251-6122
Sapporo Branch OfficeNippon Seimei Hokumonkan Bldg.,5-1-3, Kita-4-Nishi, Chuo-ku,Sapporo 060-0004, JapanTel: 81-11-261-2531Fax: 81-11-251-2608
Tohoku Branch OfficeKowa Bldg., 2-4-1 Ichiban-cho,Aoba-ku, Sendai 980-0811, JapanTel: 81-22-227-9552Fax: 81-22-266-0414
Kanto Branch OfficeSumitomo Fudosan Ryogoku Bldg.,2-10-8 Ryogoku,Sumida-ku, Tokyo 130-0026, JapanTel: 81-3-5600-2201Fax: 81-3-5600-2277
Yokohama Branch Office29th Fl., Land Mark Tower,2-2-1-1 Minatomirai, Nishi-ku,Yokohama 220-8129, JapanTel: 81-45-224-1570Fax: 81-45-224-1580
Nagoya Branch Office37th Fl., Central Towers,1-1-4 Meieki, Nakamura-ku,Nagoya 450-6037, JapanTel: 81-52-582-8400Fax: 81-52-582-8401
Osaka Branch Office20th Fl., Applause Tower19-19 Chayamachi, Kita-ku,Osaka 530-0013, JapanTel: 81-6-6377-2800Fax: 81-6-6372-5557
Hiroshima Branch OfficeAsahi Bldg., 13-7 Moto-machi,Naka-ku, Hiroshima 730-0011, JapanTel: 81-82-221-2871Fax: 81-82-223-6903
Kyushu Branch OfficeSan-Efu Bldg., 2-3-7 Hakata-Ekimae,Hakata-ku, Fukuoka 812-0011, JapanTel: 81-92-431-8050Fax: 81-92-441-1473
Overseas Business Division20th Fl., Shinjuku Park Tower,3-7-1 Nishi-Shinjuku, Shinjuku-ku,Tokyo 163-1020, JapanTel: 81-3-5323-3890Fax: 81-3-5323-3894
(Overseas Branch Offices)
Singapore Branch Office111 Somerset Rd., #09-01 SingaporePower Bldg., Singapore 238164Tel: 65-737-3312Fax: 65-733-7442
Hong Kong Branch Office37/Fl., Citicorp Centre, 18 Whitfield Rd.,Causeway Bay, Hong KongTel: 852-2520-2403Fax: 852-2861-0795
Taiwan Branch Office20F-6, Empire Commercial Bldg.,No. 295, Sec. 2, Kuang-Fu Rd.,Hsin-chu City, Taiwan R. of ChinaTel: 886-3-5714512Fax: 886-3-5714507
Batam Representative OfficeKompleks Salaiman Jl.,Sultan Abdulla Rahman Blk B No. 12Nagoya Batam 29482 IndonesiaTel: 62-778-424281Fax: 62-778-424325
Shen Zhen Representative Office5Lou, Heli Gufen Wenkang Lou, Di ErGong Ye Cun, Fu Yong Zhen, Bao An Qu,Shen Zhen 518103, P.R. of ChinaTel: 86-755-7381078Fax: 86-755-7381055
Suzhou Representative OfficeBlk 1A, Rm02-04A, Singa-Plaza, North JinjiHu Rd., Suzhou Industrial park, Suzhou215006 Jiangsu Province, P.R. of ChinaTel: 86-512-761-0086Fax: 86-512-761-9502
(Overseas Affiliates)
T.T.E. Engineering (Malaysia) Sdn. Bhd.Ground Fl., Wisma IJM Annexe, Jl.,Yong Shook Lin, 46760 Petaling Jaya,Selangor, MalaysiaTel: 60-3-755-5281Fax: 60-3-755-4370
Thai Takasago Co., Ltd.Bangna Towers C 16th Fl., 40/14 Moo12, Bangna-Trad Rd., K.M. 6.5,Bangkaew, Bangplee, Samutprkarn10541, ThailandTel: 66-2-751-9695Fax: 66-2-751-9694
Takasago Thermal Engineering(Hong Kong) Co., Ltd.37/Fl., Citicorp Centre, 18 Whitfield Rd.,Causeway Bay, Hong KongTel: 852-2520-2403Fax: 852-2861-0795
Takasago Philippines, Inc.4th floor, Raha Suleyman Building108 Benavidez St. Legaspi Village,Makati City, Manila, PhilippinesTel: 63-2-840-0014Fax: 63-2-817-7025
Takasago Thermal Engineering(Shen Zhen) Co., Ltd.5Lou, Heli Gufen Wenkang Lou,Di Er Gong Ye Cun, Fu Yong Zhen,Bao An Qu, Shen Zhen 518103,P.R. of ChinaTel: 86-755-7381078Fax: 86-755-7381055
P.T. Takasago Engineering IndonesiaMid Plaza 2 Bldg., 6th Fl., Jl., JenderalSudirman Kav. 10-11, Jakarta 10220,IndonesiaTel: 62-21-5720723Fax: 62-21-5720747
Tokyo
Hsin-chu City
Manila
SuzhouShen Zhen
Hong KongBangkok
Kuala LumpurSingapore
Batam
Jakarta
Takasago Overseas Network

PresidentMasaru Ishii
Executive Vice PresidentTaiji Fukuoka
Senior Managing DirectorsHanji TsutsuiTadahiro Toriyama
Managing DirectorsTsuyoshi FurunoKinji MurakiKeitaro KanedaTakashi KikuchiEiichi IshidaMakoto MatsushitaTomoo TsukagoshiKozo IwaiTadao HiguchiAkio TanakaSaburo Sato
B o a r d o f D i r e c t o r s
DirectorsKotaro KawasakiYoshiharu MakinoYasuhiko OkamotoTakayuki MatsushitaMasamichi KayaTasuku NakajimaTakefusa MiyamotoRyoji ShodaYukiji Kinoshita
Corporate AuditorsNoboru KitazawaOsamu OgawaKeishi UmekiTatsuro Saruyama
(As of June 29, 2000)
Date of EstablishmentNovember 16, 1923
Paid-in Capital¥13,134,919,960
Number of Shareholders6,224
Number of Employees1,780
Outstanding Shares85,765,768 shares
I n v e s t o r I n f o r m a t i o n
Stock Exchange ListingsTokyo and Osaka stock exchanges,First section
Transfer Agent and RegistrarThe Chuo, Mitsui Trust and Banking Co., Ltd.*1-7-1 Kyobashi, Chuo-ku,Tokyo 104-8345, Japan
Annual Meeting of ShareholdersThe Annual Meeting of Shareholders isnormally held in June in Tokyo, Japan
(As of March 31, 2000)
*(As of April 1, 2000)
Masaru Ishii Taiji Fukuoka Hanji Tsutsui Tadahiro Toriyama
21page

This annual report is printed on recycled paper.
Printed in Japan
4-2-8 Kanda Surugadai, Chiyoda-ku, Tokyo 101-8321, Japan