tailwinds to headwinds democratic business caucus april 9, 2013
DESCRIPTION
Tailwinds to Headwinds Democratic Business Caucus April 9, 2013. Board of Directors Sheila T. Francoeur, Chair David Alukonis William H. Dunlap Eric Herr Dianne Mercier Richard Ober James Putnam Stephen J. Reno Stuart V. Smith, Jr. Donna Sytek Brian F. Walsh Mike Whitney - PowerPoint PPT PresentationTRANSCRIPT

1
“…to raise new ideas and improve policy debates through quality information and analysis on issues shaping New Hampshire’s future.”
Tailwinds to Headwinds
Democratic Business Caucus
April 9, 2013
Board of DirectorsSheila T. Francoeur, Chair
David Alukonis
William H. Dunlap
Eric Herr
Dianne Mercier
Richard Ober
James Putnam
Stephen J. Reno
Stuart V. Smith, Jr.
Donna Sytek
Brian F. Walsh
Mike Whitney
Martin L. Gross, Chair Emeritus
Todd I. Selig
Kimon S. Zachos
Directors Emeritus

2
Summary
• NH is a low tax, high income state with about average levels of spending when you control for major drivers of state spending (e.g. poverty).
• NH has been the benefactor of significant demographic tailwinds.
• What’s next?

3
Levels of Spending
Total Fund Spending in New Hampshire 1982 and 2012
$5,244,850,965
$791,476,281
$0
$1,000,000,000
$2,000,000,000
$3,000,000,000
$4,000,000,000
$5,000,000,000
$6,000,000,000
1982 2012
6.5% Per year
Per Capita Inflation Adjusted Total Fund Spending
$2,049
$3,984
$0
$500
$1,000
$1,500
$2,000
$2,500
$3,000
$3,500
$4,000
$4,500
1982 2012
State Spending Drivers
1.2%
5.8%
6.3%
2.9%
6.5%
0%
1%
2%
3%
4%
5%
6%
7%
Population Title XIX MedicaidCaseloads
State PrisonInmates
Inflation Total Fund Spending
Annu
aliz
ed In
crea
se 1
982
to 2
012
4
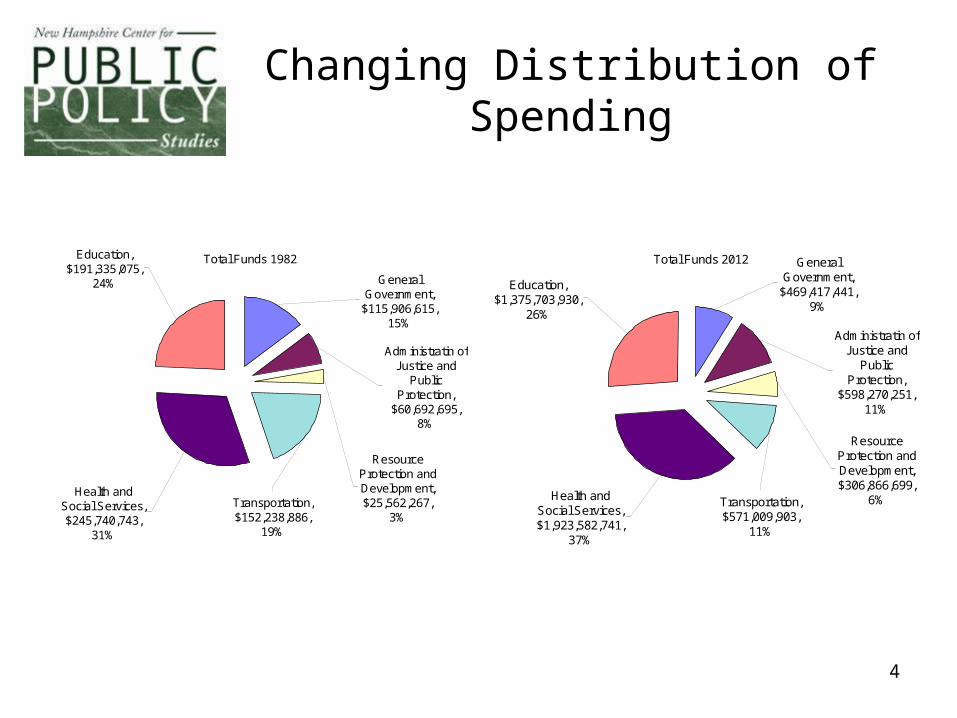
Changing Distribution of Spending
Total Funds 1982
General Government,
$115,906,615, 15%
Administratin of Justice and
Public Protection,
$60,692,695, 8%
Resource Protection and Development, $25,562,267,
3%Transportation, $152,238,886,
19%
Health and Social Services, $245,740,743,
31%
Education, $191,335,075,
24%
Total Funds 2012 General Government,
$469,417,441, 9%
Administratin of Justice and
Public Protection,
$598,270,251, 11%
Resource Protection and Development, $306,866,699,
6%Transportation, $571,009,903,
11%
Health and Social Services, $1,923,582,741,
37%
Education, $1,375,703,930,
26%

55
Low Spending? Size of State Government (Spending)
Total State Expenditures per Capita, SFY2007
New Hampshire, $3,459.69
United States, $4,773.04
$0.00
$2,000.00
$4,000.00
$6,000.00
$8,000.00
$10,000.00
$12,000.00
$14,000.00
$16,000.00
$18,000.00
Alaska
Wyo
ming
Hawaii
Alabam
a
Louis
iana
Mas
sach
uset
ts
Wisc
onsin
Arkan
sas
Orego
n
North
Dak
ota
New Je
rsey
Miss
issipp
iIo
wa
Mon
tana
Was
hingt
on
Nebra
ska
South
Car
olina
North
Car
olina
Kansa
s
Tenne
ssee
South
Dak
ota
Idah
o
Illino
is
Miss
ouri
Colora
do
Nevad
a
Source: www.statehealthfacts.org

66
Fewer Problems?
Percent of Population in Poverty (2007-2008)
0%
5%
10%
15%
20%
25%
30%
Miss
issipp
i
New M
exico
Arizon
a
Alabam
a
South
Car
olina
Arkan
sas
Florida
Mich
igan
Miss
ouri
Rhode
Islan
d
Nevad
a
Main
e
Nebra
ska
Was
hingt
on
Wisc
onsin
Verm
ont
Minn
esot
a
New H
amps
hire

77
Additional Spending Measures?
Spending Per Person in Poverty 2008
$0.00
$50,000.00
$100,000.00
$150,000.00
$200,000.00
$250,000.00
Alaska
Delawar
eUta
h
Mas
sach
uset
ts
New Je
rsey
Was
hingt
on
Minn
esot
a
North
Dak
ota
New H
amps
hire
Nebra
ska
Main
e
Orego
n
New Y
ork
Kansa
s
Penns
ylvan
ia
Wyo
ming
Oklaho
ma
Mon
tana
South
Dak
ota
North
Car
olina
Mich
igan
South
Car
olina
Tenne
ssee
Florida
Arizon
a
Texas
NH Spends slightly more than the national average, per person in poverty

88
Low Tax Burdens
State and Local Taxes as a Share of Personal Income 2009
New Hampshire, 8.0%
0.0%
2.0%
4.0%
6.0%
8.0%
10.0%
12.0%
14.0%
New Je
rsey
Conne
cticu
t
Rhode
Islan
d
Minn
esot
a
Main
e
Mas
sach
uset
ts
Illino
is
Nebra
ska
Orego
n
Kansa
s
Mich
igan
Delawar
e
India
na
Wes
t Virg
inia
Was
hingt
on
Florida
Virgini
a
Mon
tana
Oklaho
ma
Colora
do
New M
exico
South
Car
olina
Texas
Tenne
ssee
Nevad
a

99
Tax burdens flat when expressed as a function of our productivity
State and Local Tax Burden as a Share of Gross State Product
0.0%
2.0%
4.0%
6.0%
8.0%
10.0%
12.0%
NH RateUS Rate Since the late seventies,
state and local tax burdens have declined slightly (through 2009)

10
Balancing the NH General Fund & Education Trust Fund, 1979-2013
$0
$250
$500
$750
$1,000
$1,250
$1,500
$1,750
$2,000
$2,250
$2,500
$2,75019
79
1981
1983
1985
1987
1989
1991
1993
1995
1997
1999
2001
2003
2005
2007
2009
2011
2013
State Fiscal Year
Mil
lio
ns
of
Do
llar
s
Non-tax GF Revenue:Medicaid EnhancementTobacco SettlementFlexible Federal Grant (2003)
GF + ETF Expenditures
Merrill
GreggSununuGallen
Shaheen
Benson
Regular General Fund Taxes and Revenues
Statewide Property Tax
Other ETF Taxes
Lynch
Stimulus (ARRA of 2009)
Monetization
The Budget

11
Forecasting Revenue Growth Going Forwards
New Hampshire Unrestricted Revenue in Millions
$1,950.0
$2,000.0
$2,050.0
$2,100.0
$2,150.0
$2,200.0
$2,250.0
$2,300.0
$2,350.0
$2,400.0
2008 2009 2010 2011 2012 2013 2014 2015
Baseline (50% prob)
Stronger Near-TermRebound (10% prob)Mild Recession (25% prob)
Deep Recession (10%prob)
Actual Forecasts
The coming negotiations over the 2014-2015 state budget will be dictated, in large part, by forecasts for tax revenue growth in the next two years. These forecasts have proven tricky through the recession, with most years seeing zero or very modest increases in revenue. Predicting the state of the economy two years into the future is a tricky business. But budget writers will want to get the math right since those revenue forecasts will largely shape the spending options available in the next budget.

12
Growth in business tax receipts have fueled growth
General Fund Revenue from BPT & BET(In Millions)
$0
$50
$100
$150
$200
$250
$300
$350
$400
$450
1988
1990
1992
1994
1996
1998
2000
2002
2004
2006
2008
2010
2012
State Fiscal Year
Tax
Rev
en
ue
($ m
illio
n)
Business Profits Tax
Business Enterprise Tax
$91.6
$143.3
$395
$325

13
What has changed?

14
GDP Growth Stalls
Percent Change in Real GDP in BEA Regions
50.9%
36.2%30.1%
40.3% 41.9%48.0%
57.8%
70.9%
41.6% 42.4%
11.8% 10.4%17.0%
1.7%
16.5% 19.9%
31.2%26.5%
17.1% 16.6%
0.0%
10.0%
20.0%
30.0%
40.0%
50.0%
60.0%
70.0%
80.0%
New Ham
pshir
e
New Engla
nd
Mide
ast
Great
Lake
s
Plains
South
east
South
west
Rocky M
ount
ain
Far W
est
US Tot
al
1990 to 2000
2000 to 2010

15
New Hampshire Productivity Growth by Decade
3.4%
30.6%
18.5%
12.5%
0.0%
5.0%
10.0%
15.0%
20.0%
25.0%
30.0%
35.0%
1970 to 1980 1980 to 1990 1990 to 2000 2000 to 2010
Percent Change in Real GDP per Job in BEA Regions
12.5%14.5%
17.9%
12.6%
17.3%
20.9% 21.1% 20.1% 19.0% 18.2%
0.0%
5.0%
10.0%
15.0%
20.0%
25.0%
New Ham
pshir
e
New Engla
nd
Mide
ast
Great
Lake
s
Plains
South
east
South
west
Rocky M
ount
ain
Far W
est
US Tot
al
2000 to 2010
Tailwinds
To Headwinds

16
What’s Next?
16

17
What Should We Invest In?
• Human Capital
• Economic Creativity
• Business Base
• Costs of Business?
• Infrastructure?
• Quality of Life?

18
Innovation and Costs
• Human Capital– Adults with a BA or Better– Per Pupil Spending– 2011 8th grade NAEP Math
Score– 2011 8th grade NAEP Science
Score• Economic Creativity
– Patents Per Capita– Venture Capital Per Capita– R and D (% of GDP)– Doctorates per Capita
• Business Base– Per Capita Income– High Tech Jobs as % of Total– Business Birth and Death Rate– Internet Usage
• Costs– Health Care Cost Per Capita– Commercial Energy Costs
Per Kilowatt– Housing Affordability– Mature Firm Tax Burden
• Infrastructure– State Debt per Capita– Percent of bridges in trouble– Transportation spending per
capita– Road conditions
(roughness)

19
Translate into Public Policy
Policy Focus - Innovation and Costs
State RankingHuman Capital
Economic Creativity
Businesss Base Costs Infrastructure Total
New Hampshire 4 9 6 38 42 10
Connecticut 5 5 14 44 45 18Maine 14 47 28 39 41 39Massachusetts 1 1 3 49 49 1Rhode Island 20 8 22 47 50 44Vermont 2 10 17 42 44 13
Policy Focus - Innovation and Costs
State RankingHuman Capital
Economic Creativity
Businesss Base Costs Infrastructure Total
Relative to New England 48% 63% 36% 86% 92% 43%Relative to US 16% 36% 24% 152% 168% 40%
With Whom Are We Competing?
20
Data on Composite Scores

21
Human CapitalHuman Capital
2009 Adults
with a BA or Better
Per Pupil Spending
2009-2010
2011 8th grade NAEP Math
Score
2011 8th grade NAEP
Science Score
New Hampshire 32.0 $12,383 292.1 162.3
Connecticut 35.6 $14,906 287.0 154.7Maine 26.9 $12,259 288.7 160.0Massachusetts 38.2 $14,350 298.5 161.2Rhode Island 30.5 $13,699 282.9 149.0Vermont 33.1 $15,274 293.9 162.9
United States 27.9 $10,615 282.7 150.7
State RankingNew Hampshire 9 11 6 4
Connecticut 4 6 19 25Maine 23 13 13 11Massachusetts 1 7 1 7Rhode Island 13 9 29 35Vermont 7 4 4 3

22
Economic CreativityCreativity
Patents Per 100k
Residents 2010
VC Investment Dollars Per
Capita 2011
R&D performed/GDP (%)
Doctorates Received
Per 100,000 Residents
New Hampshire 60.9 71.5 4.25 11.7
Connecticut 59.1 37.8 5.01 18.5Maine 16.6 29.1 1.03 4.0Massachusetts 80.3 452.7 5.49 38.1Rhode Island 33.6 38.4 2.60 28.0Vermont 106.8 39.7 2.22 9.9
United States 39.0 91.2 2.61 15.6
State RankingNew Hampshire 8 8 7 35
Connecticut 9 19 4 10Maine 34 24 39 50Massachusetts 4 1 3 1Rhode Island 19 17 15 2Vermont 1 16 22 42

23
Business BaseBusiness Base
2008 High-technology to
Total employment
(%)
2010 Internet Usage
Anywhere (%)
2009 Business Birth and
Death Rate
2011 Per Capita
Personal Income
New Hampshire 13.28 86.35 42.50 $45,787
Connecticut 12.90 81.95 23.73 $56,889Maine 7.87 81.72 47.38 $37,973Massachusetts 15.11 83.82 36.03 $53,621Rhode Island 9.70 79.84 45.11 $43,992Vermont 10.77 83.52 43.29 $41,832
United States 11.47 80.23 39.71 $41,663
State RankingNew Hampshire 8 4 18 8
Connecticut 11 20 50 1Maine 44 21 10 31Massachusetts 4 11 38 2Rhode Island 33 29 11 16Vermont 25 12 15 19

24
CostsCosts
Health Care Expenditures per Capita by
State of Residence,
2009
June 2012 Commercial
Cents per KWH
2010 Ratio
Housing Price to Income
Business Tax Cost Index for
Mature Firm
New Hampshire $7,839 $13.45 2.94 99.7
Connecticut $8,654 $14.55 3.12 93.9Maine $8,521 $10.76 2.86 100.4Massachusetts $9,278 $14.35 3.57 123.6Rhode Island $8,309 $12.29 3.23 129.1Vermont $7,635 $14.35 3.24 103.7
United States $6,815 $10.44 2.73 100.0
State RankingNew Hampshire 43 42 34 26
Connecticut 48 46 38 21Maine 47 38 33 27Massachusetts 50 44 46 44Rhode Island 44 41 42 46Vermont 39 44 43 31
25
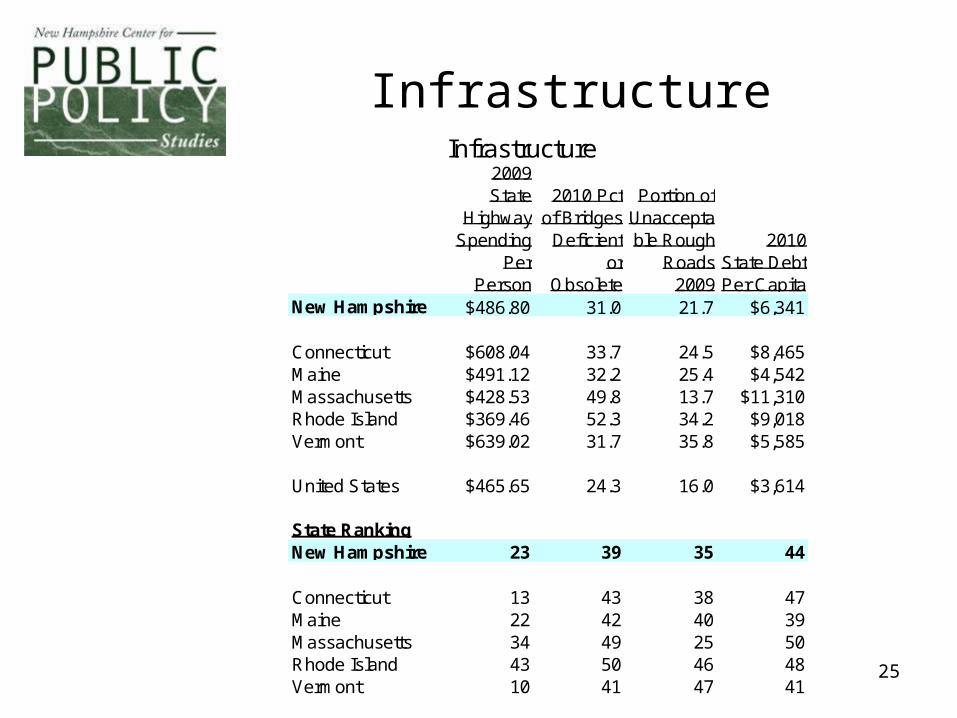
InfrastructureInfrastructure
2009 State
Highway Spending
Per Person
2010 Pct of Bridges
Deficient or
Obsolete
Portion of Unacceptable Rough
Roads 2009
2010 State Debt Per Capita
New Hampshire $486.80 31.0 21.7 $6,341
Connecticut $608.04 33.7 24.5 $8,465Maine $491.12 32.2 25.4 $4,542Massachusetts $428.53 49.8 13.7 $11,310Rhode Island $369.46 52.3 34.2 $9,018Vermont $639.02 31.7 35.8 $5,585
United States $465.65 24.3 16.0 $3,614
State RankingNew Hampshire 23 39 35 44
Connecticut 13 43 38 47Maine 22 42 40 39Massachusetts 34 49 25 50Rhode Island 43 50 46 48Vermont 10 41 47 41

26
New Hampshire’s“Creative Class”
Creative Class Occupational Categories
New Hampshire and the United States
Source: Occupational Employment Statistics, BLS, for May 2009 NHNH US Loc Quot
Super Creative Core 86,500 17,259,210 1.06 Computer and mathematical occupations 19,220 3,303,690 1.23 Architecture and engineering occupations 12,190 2,412,730 1.07 Life, physical, and social science occupations 4,570 1,308,380 0.74 Education, training, and library occupations 44,990 8,488,740 1.12 Arts, design, entertainment, sports, and media occupations 5,530 1,745,670 0.67Creative Professionals 125,000 23,891,850 1.10Management Occupations 35,370 6,116,380 1.22Business and Financial Operations Occupations 28,110 6,063,670 0.98 Legal occupations 3,230 999,020 0.68 Healthcare practitioners and technical occupations 35,740 7,200,950 1.05 High end sales and sales management 22,550 3,511,830 1.35 (41-1011, 41-1012, 41-3031, 41-4011, 40-4012)
Total "Creative Class" 211,500 41,151,060 1.08Total All Occupations 619,390 130,647,610 1.00

27
Housing Relative to Income
StateRank (House Price to Median Income)
New Hampshire 7Massachusetts 44Maine 11Vermont 14Texas 15North Carolina 48Colorado 16Virginia 6
Less Affordable

28
Affordable Housing: NH Compared to Benchmarks
Percent of Owners With Incomes between 80.1 and 120% of Area Median Income with Severe or Moderate Housing Cost Burden (30% or more of Income)
0%
5%
10%
15%
20%
25%
30%
35%
40%
45%
New Hampshire Northern New England Competitor States Massachusetts
Worse

29
The Costs of Doing Business: Energy
StateResidential
Electricity Price Commercial Rank Industrial Rank Expenditures
Per Capita New Hampshire 9 8 6 18Massachusetts 11 12 11 7Maine 10 5 3 34Vermont 29 42 26 36Texas 22 30 31 5North Carolina 44 41 28 13Colorado 23 25 19 45Virginia 2 7 9 15
Prices and Expenditures (Higher Price/Expend higher Rank)

30
Arts and Dining GDP by State
2011 2011 2011
State GDPArts and
Accomodation PercentNew Hampshire $63,556 $2,573 4.0%
Maine $51,585 $2,363 4.6%Massachusetts $391,771 $15,018 3.8%Vermont $25,905 $1,455 5.6%
Colorado $264,308 $11,921 4.5%North Carolina $439,862 $13,897 3.2%Texas $1,308,132 $43,504 3.3%Virginia $428,909 $13,022 3.0%
United States $14,981,020 $585,705 3.9%

31
Survey data needs to be carefully assessed
• Surveys tell a very different story on regulatory status depending on what is measured and what is weighted more heavily– Forbes survey ranks NH 48th lowest in terms of
regulatory structure. – Kaufmann survey ranks NH high across a series of
regulatory structures small businesses.
• Given the importance, we are looking to collect primary data on this topic.

32
Small Business Friendliness Survey
2013 Thumbtack.com Small Business Survey, in partnership with the Kauffman Foundation
StateOverall
Business Friendliness
Ease of Starting
Business
Regulatory friendliness
Employment, Labor, and
Hiring
Licensing Regulations
New Hampshire 3 2 4 6 2
Maine 40 33 11 8 15Massachusetts 30 32 32 33 31Vermont No Data No Data No Data No Data No Data
North Carolina 13 14 17 17 20Colorado 8 16 20 20 16Texas 5 8 6 3 7Virginia 6 7 7 5 5

33
Best States for Business
Forbes 2012 Best States for Business
State Overall Rank
Business Costs Rank
Labor Supply Rank
Regulatory Environment
RankEconomic
Climate Rank
Growth Prospects
RankQuality of Life Rank Population
New Hampshire 32 44 20 41 22 29 6 1,323,200
Maine 50 40 34 46 44 49 17 1,329,300Massachusetts 17 49 9 42 8 16 1 6,606,300Vermont 44 45 19 49 31 46 14 627,200
North Carolina 4 2 3 3 21 12 34 9,730,300Colorado 5 32 1 15 10 8 10 5,092,100Texas 7 23 12 15 1 3 33 25,899,600Virginia 2 22 2 1 10 18 4 8,128,900

34
State Bond Ratings
Standard & Poor State Credit Rating May
2012New Hampshire AA
Maine AAMassachusetts AA+Vermont AA+
North Carolina AAAColorado AATexas AA+Virginia AAA

35
Tax Foundation Business Tax Climate
StateIndex Score Rank
Index Score Rank
New Hampshire 99.7 26 91 22
Maine 100.4 27 87.3 20Massachusetts 123.6 44 128.2 43Vermont 103.7 31 79.2 12
North Carolina 80.8 7 79.9 13Colorado 105.4 33 135.1 47Texas 85.9 12 127.7 42Virginia 84.4 11 125.9 39
Mature Firms New Firms

36
State Business Tax Climate

37
Tax Foundation Overall Tax Climate
State
Overall
Rank
Corporate
Tax Rank
Individual
Income Tax
Rank
Sales Tax
Rank
Unemployment
Insurance Tax
Rank
Property
Tax Rank
New Hampshire 7 48 9 1 42 43
Maine 30 41 27 10 32 39
Massachusetts 22 33 15 17 49 47
Vermont 47 43 47 14 22 48
Colorado 18 20 16 44 39 9
South Carolina 36 10 39 21 33 21
Texas 9 38 7 36 14 32
Virginia 27 6 38 6 38 27
2013 State Business Tax Climate Index Ranks and Component Tax Ranks

3838
“…to raise new ideas and improve policy debates through quality information and analysis on issues shaping New Hampshire’s future.”
New Hampshire Center New Hampshire Center for Public Policy Studiesfor Public Policy Studies
Want to learn more?
• Online: nhpolicy.org
• Facebook: facebook.com/nhpolicy
• Twitter: @nhpublicpolicy
• Our blog: policyblognh.org
• (603) 226-2500
Board of DirectorsSheila T. Francoeur, Chair
David Alukonis
Michael Buckley
William H. Dunlap
Eric Herr
Richard Ober
James Putnam
Stephen J. Reno
Stuart V. Smith, Jr.
Donna Sytek
Brian F. Walsh
Martin L. Gross, Chair Emeritus
John D. Crosier, Sr.,
Todd I. Selig
Kimon S. Zachos
Directors Emeritus