headwinds, undercurrents, and tailwinds - … leasing & finance foundation • 3 headwinds,...
TRANSCRIPT

Headwinds, Undercurrents, and Tailwinds: How Equipment Finance Companies Can Learn and Benefit from the Fintech Phenomenon

2 • EQUIPMENT LEASING & FINANCE FOUNDATION
HEADWINDS, UNDERCURRENTS, and TAILWINDS
2 • EQUIPMENT LEASING & FINANCE FOUNDATION
The Foundation is the only research organization dedicated solely to the equipment finance industry.
The Foundation accomplishes its mission through development of future-focused studies and reports identifying critical issues that could impact the industry.
The Foundation research is independent, predictive, and peer-reviewed by industry experts. The Foundation is funded solely through contributions.
Contributions to the Foundation are tax deductible.
Equipment Leasing & Finance Foundation
1625 Eye Street, NW • Suite 850
Washington, DC 20006
www.leasefoundation.org
202-238-3429
Kelli Jones Nienaber, Executive Director

EQUIPMENT LEASING & FINANCE FOUNDATION • 3
HEADWINDS, UNDERCURRENTS, and TAILWINDS
ContentsEXECUTIVE SUMMARY . . . . . . . . . . . . . . . . . . . . . . . . . . . . . . . . . . . . . . . . . . . . . . . . . . . . . . . . . . . . . . . . . . . . . . . . . . . . . . . . . 5
INTRODUCTION . . . . . . . . . . . . . . . . . . . . . . . . . . . . . . . . . . . . . . . . . . . . . . . . . . . . . . . . . . . . . . . . . . . . . . . . . . . . . . . . . . . . . . . 7
FACTORS BEHIND THE FINTECH EVOLUTION. . . . . . . . . . . . . . . . . . . . . . . . . . . . . . . . . . . . . . . . . . . . . . . . . . . . . . . . . . . . . . . . 8
THE FINTECH ECOSYSTEM . . . . . . . . . . . . . . . . . . . . . . . . . . . . . . . . . . . . . . . . . . . . . . . . . . . . . . . . . . . . . . . . . . . . . . . . . . . . . . . 9
FINTECH FUNDING SOURCES . . . . . . . . . . . . . . . . . . . . . . . . . . . . . . . . . . . . . . . . . . . . . . . . . . . . . . . . . . . . . . . . . . . . . . . . . . . 12
FINTECH METHODOLOGIES . . . . . . . . . . . . . . . . . . . . . . . . . . . . . . . . . . . . . . . . . . . . . . . . . . . . . . . . . . . . . . . . . . . . . . . . . . . . 13
FINTECH ORIGINATION TRENDS . . . . . . . . . . . . . . . . . . . . . . . . . . . . . . . . . . . . . . . . . . . . . . . . . . . . . . . . . . . . . . . . . . . . . . . . . 14
HEADWINDS . . . . . . . . . . . . . . . . . . . . . . . . . . . . . . . . . . . . . . . . . . . . . . . . . . . . . . . . . . . . . . . . . . . . . . . . . . . . . . . . . . . . . . . . . 15 Compliance Issues . . . . . . . . . . . . . . . . . . . . . . . . . . . . . . . . . . . . . . . . . . . . . . . . . . . . . . . . . . . . . . . . . . . . . . . . . . . . . . . . . . 15 Default Rates . . . . . . . . . . . . . . . . . . . . . . . . . . . . . . . . . . . . . . . . . . . . . . . . . . . . . . . . . . . . . . . . . . . . . . . . . . . . . . . . . . . . . . 16 High Interest Rates and Fees . . . . . . . . . . . . . . . . . . . . . . . . . . . . . . . . . . . . . . . . . . . . . . . . . . . . . . . . . . . . . . . . . . . . . . . . . 16 Investment Instability . . . . . . . . . . . . . . . . . . . . . . . . . . . . . . . . . . . . . . . . . . . . . . . . . . . . . . . . . . . . . . . . . . . . . . . . . . . . . . . 16
UNDERCURRENTS . . . . . . . . . . . . . . . . . . . . . . . . . . . . . . . . . . . . . . . . . . . . . . . . . . . . . . . . . . . . . . . . . . . . . . . . . . . . . . . . . . . . 17 Lack of Full Performance History . . . . . . . . . . . . . . . . . . . . . . . . . . . . . . . . . . . . . . . . . . . . . . . . . . . . . . . . . . . . . . . . . . . . . . 18 Loan Credit Performance in Downturns . . . . . . . . . . . . . . . . . . . . . . . . . . . . . . . . . . . . . . . . . . . . . . . . . . . . . . . . . . . . . . . . 18 Tightening Monetary Policy . . . . . . . . . . . . . . . . . . . . . . . . . . . . . . . . . . . . . . . . . . . . . . . . . . . . . . . . . . . . . . . . . . . . . . . . . . 19 Competition from Incumbents . . . . . . . . . . . . . . . . . . . . . . . . . . . . . . . . . . . . . . . . . . . . . . . . . . . . . . . . . . . . . . . . . . . . . . . . 20 Cybersecurity Risks . . . . . . . . . . . . . . . . . . . . . . . . . . . . . . . . . . . . . . . . . . . . . . . . . . . . . . . . . . . . . . . . . . . . . . . . . . . . . . . . . 20 Impact of a Credit/Liquidity Crisis on Fintechs . . . . . . . . . . . . . . . . . . . . . . . . . . . . . . . . . . . . . . . . . . . . . . . . . . . . . . . . . . . 20 Treatment of Risk . . . . . . . . . . . . . . . . . . . . . . . . . . . . . . . . . . . . . . . . . . . . . . . . . . . . . . . . . . . . . . . . . . . . . . . . . . . . . . . . . . . 21 The Use of Alternative Data . . . . . . . . . . . . . . . . . . . . . . . . . . . . . . . . . . . . . . . . . . . . . . . . . . . . . . . . . . . . . . . . . . . . . . . . . . 23 Demographic Changes and Impact on Fintech Use . . . . . . . . . . . . . . . . . . . . . . . . . . . . . . . . . . . . . . . . . . . . . . . . . . . . . . . . 24 Potential Regulation . . . . . . . . . . . . . . . . . . . . . . . . . . . . . . . . . . . . . . . . . . . . . . . . . . . . . . . . . . . . . . . . . . . . . . . . . . . . . . . . 24 Fintech Cost Structure . . . . . . . . . . . . . . . . . . . . . . . . . . . . . . . . . . . . . . . . . . . . . . . . . . . . . . . . . . . . . . . . . . . . . . . . . . . . . . . 26 Stability of the Fintech Business Model . . . . . . . . . . . . . . . . . . . . . . . . . . . . . . . . . . . . . . . . . . . . . . . . . . . . . . . . . . . . . . . . . 27
TAILWINDS . . . . . . . . . . . . . . . . . . . . . . . . . . . . . . . . . . . . . . . . . . . . . . . . . . . . . . . . . . . . . . . . . . . . . . . . . . . . . . . . . . . . . . . . . . 27 Fintechs Solve Problems . . . . . . . . . . . . . . . . . . . . . . . . . . . . . . . . . . . . . . . . . . . . . . . . . . . . . . . . . . . . . . . . . . . . . . . . . . . . . 27 Learning from Fintech Innovation in Small-Business Loans . . . . . . . . . . . . . . . . . . . . . . . . . . . . . . . . . . . . . . . . . . . . . . . . . 28 Corporate Strategies . . . . . . . . . . . . . . . . . . . . . . . . . . . . . . . . . . . . . . . . . . . . . . . . . . . . . . . . . . . . . . . . . . . . . . . . . . . . . . . . 33
EQUIPMENT LEASING & FINANCE FOUNDATION • 3
4 • EQUIPMENT LEASING & FINANCE FOUNDATION
HEADWINDS, UNDERCURRENTS, and TAILWINDS
NOTABLE EXAMPLES . . . . . . . . . . . . . . . . . . . . . . . . . . . . . . . . . . . . . . . . . . . . . . . . . . . . . . . . . . . . . . . . . . . . . . . . . . . . . . . . . 33 Amazon . . . . . . . . . . . . . . . . . . . . . . . . . . . . . . . . . . . . . . . . . . . . . . . . . . . . . . . . . . . . . . . . . . . . . . . . . . . . . . . . . . . . . . . . . . . 33 Square . . . . . . . . . . . . . . . . . . . . . . . . . . . . . . . . . . . . . . . . . . . . . . . . . . . . . . . . . . . . . . . . . . . . . . . . . . . . . . . . . . . . . . . . . . . . 34 Experian and Orchard Platform . . . . . . . . . . . . . . . . . . . . . . . . . . . . . . . . . . . . . . . . . . . . . . . . . . . . . . . . . . . . . . . . . . . . . . . 34
OTHER CORPORATE INVESTMENTS IN FINTECH . . . . . . . . . . . . . . . . . . . . . . . . . . . . . . . . . . . . . . . . . . . . . . . . . . . . . . . . . . . . 35
SUGGESTED STRATEGIES FOR EQUIPMENT FINANCE INCUMBENTS . . . . . . . . . . . . . . . . . . . . . . . . . . . . . . . . . . . . . . . . . . . . 37
CONCLUSION . . . . . . . . . . . . . . . . . . . . . . . . . . . . . . . . . . . . . . . . . . . . . . . . . . . . . . . . . . . . . . . . . . . . . . . . . . . . . . . . . . . . . . . . 40
APPENDICES . . . . . . . . . . . . . . . . . . . . . . . . . . . . . . . . . . . . . . . . . . . . . . . . . . . . . . . . . . . . . . . . . . . . . . . . . . . . . . . . . . . . . . . . . 41 Appendix 1. Supplemental Fintech Investment Information . . . . . . . . . . . . . . . . . . . . . . . . . . . . . . . . . . . . . . . . . . . . . . . . 41 Appendix 2. Supplemental Information on Fintech Disruption of the Equipment Leasing and Finance Industry . . . . . . 42 How Big is the Total Addressable Market (TAM) in Equipment Loans? . . . . . . . . . . . . . . . . . . . . . . . . . . . . . . . . . . . . . 42
REFERENCES . . . . . . . . . . . . . . . . . . . . . . . . . . . . . . . . . . . . . . . . . . . . . . . . . . . . . . . . . . . . . . . . . . . . . . . . . . . . . . . . . . . . . . . . 49
ACKNOWLEDGEMENTS . . . . . . . . . . . . . . . . . . . . . . . . . . . . . . . . . . . . . . . . . . . . . . . . . . . . . . . . . . . . . . . . . . . . . . . . . . . . . . . . 53
4 • EQUIPMENT LEASING & FINANCE FOUNDATION

EQUIPMENT LEASING & FINANCE FOUNDATION • 5
HEADWINDS, UNDERCURRENTS, and TAILWINDSExecutive SummaryAdvances in innovative technologies, an exponential increase in data and its availability, and cutting-edge analytical methods and computing resources are changing the way businesses secure financing for their purchases. Companies that offer or enable financing using streamlined technology, or “Fintechs” as they have been dubbed, emerged roughly a decade ago to provide online marketplaces and innovative technology solutions for financial transactions. Since then, Fintechs have also introduced alternative data collection and analysis methods, created their own credit-underwriting standards, and broadened their reach into wealth management and even robo-advising as the sector has grown and matured.
Fintechs lenders have made inroads to the Consumer Finance market and to a lesser degree to the Commercial Finance market by attracting some small-business customers who could also do business with traditional equipment finance companies. In this way, these lenders create limited disruption to the equipment finance industry. However, non-lending Fintechs, in contrast, provide solutions to many types of financial service providers, including equipment finance incumbents, changing the competitive landscape for those market participants that have become accustomed to these Fintech-enabled operating platforms. In light of these developments, we endeavor to examine and understand the potential opportunities for, as well as the risks posed by, Fintech companies and the trends they represent. We also propose several approaches by which equipment finance companies can learn and benefit from Fintechs and become more like them in certain aspects; e.g., by adopting innovative efficiencies and using technology to enter or more deeply penetrate markets that until now have posed significant challenges.
To do these things, we first identify important factors and events that contributed to the evolution of Fintech companies and their penetration of certain segments of the financial-services industry. These include:
• A dramatically changed financial environment in the wake of the 2008-2009 Recession
• The rise of exponential technologies, such as Big Data, Cloud-Computing, and mobile-enabled computing
• Changing customer expectations and demands
• A shift in equipment purchases from offline to online
• Regulatory shifts that changed the way lenders do business.
We then examine the Fintech ecosystem and identify its components: Balance-Sheet Lenders, Peer-to-Peer Marketplaces, Multi-Lender Marketplaces, Payments/E-commerce Platforms, and others. We also discuss the development of the industry, including its funding sources, commercial audiences, applicable regulation or lack thereof, and social trends that set the stage for future growth.
With time and growth come challenges, however, so we next explore headwinds now roiling the industry and undercurrents that could become problematic. Missteps by several of the largest Fintechs in 2016, for example, put off institutional, as well as individual investors who until then had supplied start-up capital and later, operating capital, by purchasing Fintechs’ originations. Improprieties also launched a federal investigation into Fintech activities and put a damper on expansion plans for some while inciting others to go out of business.
We identify headwinds for Fintech firms as:
• Unproven capacity to comply with regulatory requirements
• Loan credit performance in a downturn
• Sensitivity to interest-rate changes, and
• Financial instability and operational risks.
EQUIPMENT LEASING & FINANCE FOUNDATION • 5

6 • EQUIPMENT LEASING & FINANCE FOUNDATION
HEADWINDS, UNDERCURRENTS, and TAILWINDSWe then identify undercurrents that exist in the sector and which could impact Fintech companies, their investors, and their customers, given changes in circumstances. These undercurrents include, but are not limited to:
• A lack of performance history through a full economic cycle
• Untested performance during tightening monetary cycles
• Unknown performance during a credit or liquidity crisis, and
• Fintech risk-assessment models.
We also discuss developing regulatory issues for Fintechs and study the extent of Fintech penetration into and disruption of the equipment finance industry. We look particularly at Fintechs’ involvement in the small-business market to identify Fintech business models, practices, and processes that may be feasible for equipment finance companies themselves to adopt and apply.
Next, we list corporate strategies for incumbents to consider for harnessing the client-experience benefits and process efficiencies developed by Fintech companies. These strategies are as follows:
• Investment in Fintech companies
• Partnering with Fintech companies
• In-house development and deployment of technologies used by Fintechs
• Merger with or acquisition of a Fintech company
• Creation of joint Fintech programs with other incumbents.
We conclude that although Fintechs may present a threat to capturing a small percentage of market share from the small-ticket segment of incumbents, we do not believe they will become a major source of equipment funding. Rather, we further conclude that rapidly emerging Fintech technology operating platforms constitute the more disruptive force, changing how the financing process is enabled. The question is not how many businesses with existing financing will re-finance with another source, Fintech or otherwise. The question is with whom these customers will choose to finance their next equipment purchase, based on asset life, business growth, and other factors.
Equally important is that of the $1 trillion financed by the equipment finance industry today, as equipment leases compose only $390 million.
Thus, an industry challenge—and opportunity—will be to shift the percentage of equipment acquisitions that are completed via working capital or credit cards to equipment leases or loans—whichever best suits the life of the asset and, likely, the cash flow of the borrower. It stands to reason that as the Fintech sector continues to mature, Fintech companies will also strive for a share of this opportunity.
Another reason Fintech companies focus on smaller transactions: Loss-Given Default is much higher for small equipment finance transactions than for large transactions. Thus, the lower loss because of collateral advantage of lessors is less of an advantage for leasing companies with smaller transactions than it is for lessors with larger transactions.
By closely following developments in new technologies and adapting those that can make the financing process easier, faster, and more convenient for customers and equipment finance companies themselves, however, we believe that incumbents not only can hedge the risk of losing business but position themselves to gain market share in both existing and emerging markets.
6 • EQUIPMENT LEASING & FINANCE FOUNDATION

EQUIPMENT LEASING & FINANCE FOUNDATION • 7
HEADWINDS, UNDERCURRENTS, and TAILWINDSIntroductionTechnology is shaking the foundations of business, and nowhere is this more apparent than in the financial services industry. New competition has emerged from companies that offer or enable financing using streamlined technology. The term “Fintech” has been coined to describe these companies. The term is also used to describe the technological interventions and innovative approaches these entities use to attract customers and conduct business.
As a trend, the Fintech phenomenon creates an intersection of technology and financial services that disrupt traditional financial models and companies, mainly by providing services and products via the Internet with little or no human interaction. Originally developed for B2C application, the technologies used by Fintech companies can be applied universally, including for B2B uses.
Online marketing, processing, and delivery of products and services significantly lower Fintechs’ operating costs. Not only do these companies represent a growing presence in online lending; they are also revolutionizing other aspects of financial services, including data collection and analysis, credit underwriting, deposits and payments, and wealth management. Peer-to-peer, or Marketplace, lending platforms intermediate loans; robo-advisers provide automated investment advice; and social trading platforms offer brokerage and investing services. But the list of products and services doesn’t end here. Exponential technologies such as Artificial Intelligence (AI) and Distributed Ledger, or Blockchain, have the potential to further digitize the financial services industry and are already being used by certain traditional equipment finance companies, as well as by Fintechs.
Specifically, the Fintech phenomenon is affecting the financial-services industry in these ways:
Fintech companies slash operating costs and quicken customer service by conducting all business online. Decisioning also occurs quickly, making the process that much more convenient and efficient for customers. For example, Lending Club’s ongoing expenses as a share of its outstanding loan balance are about 2%; the equivalent for traditional lenders is 5-7%. The implication is that Lending Club has the potential to offer better deals to the borrowers and lenders on its platform.
Fintechs, unlike incumbents, are not burdened by legacy technology systems, brick-and-mortar branch networks, or the need to protect existing business lines. They focus on using technology to reach prospects and automate processes. For example, half of the loan applications received by Funding Circle, a peer-to-peer lending marketplace that allows investors to lend money directly to small and mid-size businesses, arrive and are processed outside normal business hours.
Many Fintechs use alternative data to help assess risk. Kabbage and OnDeck Capital, for example, use social-media reviews to help assess the performance of small-business applicants. Avant uses machine-learning and alternative methods to assess the creditworthiness of applicants whose credits were negatively impacted during the last recession. Amazon and Square base their underwriting largely on perfect information received from applicant sales and cash flows, based on their position in the sale cycle. These types of data-driven credit-decisioning demonstrate new approaches to credit underwriting, but may or may not have advantages over traditional decisioning that is based on credit scores or other information, with demonstrated empirical results. Evidence proving the superiority of one method over the other has not yet been brought to light. However, bringing non-financial factors into an algorithmic lending decision may be an early attempt to replace a human lender’s ability to see a bigger picture encompassing both financial and non-financial factors.
EQUIPMENT LEASING & FINANCE FOUNDATION • 7

8 • EQUIPMENT LEASING & FINANCE FOUNDATION
HEADWINDS, UNDERCURRENTS, and TAILWINDSFactors behind the Fintech Evolution Lending to small businesses by the four largest U.S. banks decreased markedly during the Recession of 2008-2009 and remained depressed through 2014, creating a funding void that Fintechs worked to fill. Fintechs’ willingness to lend to small businesses and consumers was bolstered in no small part by advances in online encryption technologies, electronic funding, and electronic payments, all of which combined to slash the cost of doing business and empower Fintechs to underwrite and manage financing risk on a highly automated basis.
Also currently contributing to Fintechs’ evolution is their ability to collect and process data from internet-based sources, including social-networking sites, and third-party credit-scoring agencies. Fintechs use sophisticated algorithms to automate credit-decisioning and respond to applicants in hours or minutes, instead of the days or weeks required by companies that use manual underwriting. At the same time, however, many Fintechs limit their lending to amounts below $250,000, often because of portfolio risk requirements dictated by funding vehicles. Below are additional factors and trends that have contributed to the evolution of the Fintech phenomenon and penetration of certain segments of the financial services industry:
Favorable economic environment. The post-crisis economic environment of low interest rates, economic recovery, low borrowing costs and near-zero delinquencies combined to encouraged investors to consider alternative investments with potentially high yields. At the same time, the tightened credit environment made it difficult for small and credit-damaged businesses to obtain financing from banks. Many Fintechs entered the marketplace to provide financing to underserved individuals and businesses that could not obtain funding from traditional lenders.
Newer technology and automation driving cost advantage and ease of use. The explosion of social media and the rise of Big Data, along with advances in data analytics, produced massive amounts of information and new ways to extract and use it. Cloud technologies created inexpensive new data-storage facilities, while mobile technologies made it simpler to shop for and purchase many products online. Marketplace funding models have capitalized on these developments, offering electronic applications, documents, and signature capabilities, to reach and attract prospects. Fintechs also use proprietary credit-scoring algorithms to speed funding decisions.
Changing demographics and consumer behavior. Millennials, in particular, have strong preferences for online or mobile platforms, automated processes, and transparency of data and information. Many of these digital natives perceive Peer-to-Peer or Marketplace lending as having greater social value than conventional financing.
A shift to online equipment purchases. A preference for mobile-enabled buying options, integrated with options for financing, has powered the success of such Fintechs as Currency Capital, Kwipped and LeaseQ. Currency notes on its website that the company’s business model is to remove friction to enable leasing at the point of sale, and that “While banks are reviewing your customers, we’re funding them.” Currency is not only a lender; it is a lending platform that offers API-based capabilities that other companies can plug into their online portals to expand their ability to provide customer experience at the point of sale. Currency says on its website that it can approve customers in three minutes and fund them immediately. Kwipped works differently, connecting lessees with a network of pre-approved equipment suppliers, thus placing supplier selection earlier in the process than it occurs in traditional channels.
Regulatory advantage. Congress’s passage of The Dodd-Frank Wall Street Reform and Consumer Protection Act of 2010 dramatically changed the way banks can do business. The law limits risk-taking and prevents abusive lending practices, implementing new reporting requirements designed to help regulatory agencies monitor banks’ activities. Fintech companies are not banks and thus are not subject to Dodd-Frank or to other bank regulations put into place since the Recession of 2008-2009 to prevent another financial crisis. Fintechs can immediately enter financial markets and compete with traditional equipment finance companies, free of capital requirements, state licensure laws, and many other forms of regulatory compliance. As will be discussed in detail later in this report, however, Fintechs may soon be subject to new regulations currently being considered by the federal and certain state governments.
8 • EQUIPMENT LEASING & FINANCE FOUNDATION

EQUIPMENT LEASING & FINANCE FOUNDATION • 9
HEADWINDS, UNDERCURRENTS, and TAILWINDSThe Fintech EcosystemFintechs can be divided into two basic camps: those that lend and those that do not lend but provide technology platforms for use by lenders. Within these camps, Fintechs specialize and constitute components of the Fintech ecosystem. The following diagrams illustrate the breadth of Fintech offerings and the areas of Fintech involvement in the U.S. financial-services industry.
Figure 1. Members of the Fintech Ecosystem
EQUIPMENT LEASING & FINANCE FOUNDATION • 9
Source: Orchard Platform
Although not all Fintechs are shown, these diagrams demonstrate the rich variety of the system. Figure 2 reveals a significant presence in the processing-and-payments business, in capital markets and trading, and in merchant services and wealth management. Fintech presence in these segments does not necessarily portend significant market share, however.
Source: Orchard Platform

10 • EQUIPMENT LEASING & FINANCE FOUNDATION
HEADWINDS, UNDERCURRENTS, and TAILWINDS
10 • EQUIPMENT LEASING & FINANCE FOUNDATION
Although not all Fintechs are shown, these diagrams demonstrate the rich variety of the system. Figure 2 reveals a significant presence in the processing-and-payments business, in capital markets and trading, and in merchant services and wealth management. Fintech presence in these segments does not necessarily portend significant market share, however. Figure 2. 250 Fintech Companies Categorized by Specialty
Source: CB Insights
Major components of the Fintech ecosystem are:
Balance-Sheet Lenders/Composite Lenders. Balance-sheet Fintechs lend directly from their own balance sheet and retain the loans and accompanying risk. This business model has recently yielded to Composite Lending, a hybrid model in which Fintechs retain the portion of portfolio funded by their balance sheet, and use investors obtained through Marketplace Lending to finance additional loans.
Figure 2. 250 Fintech Companies Categorized by Specialty
Source: CB Insights
Major components of the Fintech ecosystem are: Balance-Sheet Lenders/Composite Lenders. Balance-sheet Fintechs lend directly from their own balance sheet and retain the loans and accompanying risk. This business model has recently yielded to Composite Lending, a hybrid model in which Fintechs retain the portion of portfolio funded by their balance sheet, and use investors obtained through Marketplace Lending to finance additional loans. Peer-to-Peer/Marketplace Lenders. The Peer-to-Peer, or P2P, model was established in the consumer lending market to match investors with borrowers. As P2P small-business lending evolved over time, the market became dominated by institutional investors, and B2B

EQUIPMENT LEASING & FINANCE FOUNDATION • 11
HEADWINDS, UNDERCURRENTS, and TAILWINDSPeer-to-Peer/Marketplace Lenders. The Peer-to-Peer, or P2P, model was established in the consumer lending market to match investors with borrowers. As P2P small-business lending evolved over time, the market became dominated by institutional investors, and B2B marketplaces were born. Peer-to-Peer Lenders are also known as Marketplace Lenders, or MPLs.
Multi-Lender Marketplaces. These Fintechs allow borrowers to comparison-shop among loan products offered by alternative lenders and traditional lenders. The convenience of viewing several products in one place allows borrowers to more easily compare, select, and apply for funding.
Invoice Financers. Invoice financing, or factoring, allows businesses to receive payment up front for outstanding invoices. Online invoice financer BlueVine claims on its website that invoices are approved in as little as 24 hours and that credit lines of up to $2.5 million are available.
Payments Platforms and E-Commerce Platforms. Payments companies use their platforms to accept and deliver payments for a fee. E-commerce platform companies sell software that allows businesses to build and manage digital storefronts that accept payments online.
Data Providers. Data providers collect, compile, and standardize data and provide it to other companies for decision-making and financing.
Figure 3. Companies by Ecosystem Component
Source: Milken Institute, Center for Financial Markets, 2016
EQUIPMENT LEASING & FINANCE FOUNDATION • 11
marketplaces were born. Peer-to-Peer Lenders are also known as Marketplace Lenders, or MPLs.
Multi-Lender Marketplaces. These Fintechs allow borrowers to comparison-shop among loan products offered by alternative lenders and traditional lenders. The convenience of viewing several products in one place allows borrowers to more easily compare, select, and apply for funding.
Invoice Financers. Invoice financing, or factoring, allows businesses to receive payment up front for outstanding invoices. Online invoice financer BlueVine claims on its website that invoices are approved in as little as 24 hours and that credit lines of up to $2.5 million are available.
Payments Platforms and E-Commerce Platforms. Payments companies use their platforms to accept and deliver payments for a fee. E-commerce platform companies sell software that allows businesses to build and manage digital storefronts that accept payments online.
Data Providers. Data providers collect, compile, and standardize data and provide it to other companies for decision-making and financing.
Figure 3. Companies by Ecosystem Component
Ecosystem Component Sample Companies
Data Providers Barchart OnDemand, FactSet, TransUnion/FactorTrust, PayNet, Intuit
FintechFundingSourcesAn initial source of capital for any Fintech is the founder’s own balance sheet. Most Fintechs rely on multiple capital sources, however, especially after the initial phase of funding passes. These sources may include:
Ø Venture Capital: VC rounds for online lending startups are some of the largest in all ofventure capitalism.
Balance Sheet Lenders CAN Capital, Ondeck Capital, Smartbiz, Kabbage
Peer-to-Peer/Marketplace Lenders Lending Club, Funding Circle, Credibility Capital
Multi-Lender Marketplaces Bizfi, Lendio, Quickbooks, Fundera
Payments/E-commerce Platforms Amazon Lending, Paypal, Square
Invoice Financers FundBox, American Express, BlueVine

12 • EQUIPMENT LEASING & FINANCE FOUNDATION
HEADWINDS, UNDERCURRENTS, and TAILWINDSFintech Funding SourcesAn initial source of capital for any Fintech is the founder’s own balance sheet. Most Fintechs rely on multiple capital sources, however, especially after the initial phase of funding passes. These sources may include:
Venture Capital: VC rounds for online lending startups are some of the largest in all of venture capitalism.
Transitional Capital: This money is provided at an early stage in a Fintech’s development. Those who provide this funding are called “transitional capital providers” because, given the high returns they receive, they transition out to lower-cost capital providers once a Fintech establishes a track record and can qualify for lower-cost funding.
Warehouse Credit Lines: Warehouse lines can be sizable and are typically provided by banks. These funds are available only after platforms have generated a successful track record.
Investor Lending: In this model, peers or institutional investors provide the funding to a Fintech’s borrowers. The Fintech’s revenues stem from origination fees paid by borrowers and loan-servicing fees paid by investors. The Investor Lending model takes direction from The Jumpstart Our Business Startups (JOBS) Act, which was signed into law by President Obama in April 2012. The Act introduced accredited investors as retail investors.
Whole or Fractional Loans: Whole loans generated on a platform are sold to institutional investors or accredited individual investors. The fractional loan market is designed for smaller investors.
Sponsors: Some funds act as securitization sponsors. The fund secures a warehouse line and applies it to a credit facility. Once the facility is filled with loans, the sponsor securitizes the facility and sells it to institutional investors.
Securitization: The first asset-backed securitization populated with peer-to-peer loans was an unrated $53 million deal created by a hedge fund in late 2013. Since then, the securitization market for these loans has grown and is becoming more important as a Fintech funding source, since the structure allows smaller finance companies that have been held back due to the small size and lack of liquidity in the asset class to increase their investments. While most securitizations have been related to consumer assets (autos, student loans, and esoterica), the securitization of Fintech-originated paper is now proven to the extent that multiple-originator paper is sometimes placed in a single offering. Given that equipment-leasing paper performs better than that of other asset classes, access to the securitization market—and potentially automation of the process—for funding could give Fintechs both the capacity and the ability to weather financial cycles.
PeerIQ recently released its “Marketplace Lending Securitization Tracker,” according to which the total issuance of marketplace loan-based securities was $28.2 billion across 106 deals issued as of Q4 of 2017. Only nine of the deals were small-business-loan securitizations, however. Nevertheless, the securitization market offers a low cost of capital for insurance companies, pension funds, and other larger allocators, and securitizations of loans originated by Fintechs are seeing growing investor demand.
Recently, Lending Club, Upstart, OnDeck, and Avant decided to take a more active role in the securitization process by self-sponsoring the securitizations of loans originated on their platforms. PeerIQ noted in its Q4 2017 report that rating-agency participation in the Multi-Lender ABS Market continues to intensify and that the spreads of Multi-Lender Marketplace ABS papers continue to tighten and flatten, a possible indicator of strong investor appetite.
12 • EQUIPMENT LEASING & FINANCE FOUNDATION

EQUIPMENT LEASING & FINANCE FOUNDATION • 13
HEADWINDS, UNDERCURRENTS, and TAILWINDSFintech MethodologiesMost Fintech companies that lend operate similarly on the front end: a prospective borrower submits a loan application online. The company’s platform then obtains the applicant’s credit report and other data the Fintech uses to help make a funding decision and activates the company’s proprietary credit-analysis model to assign the applicant a risk-level, which results in a decision to fund or not. Interest rate and loan terms are also determined at this point. Fintech commercial loan products include unsecured loans, debt-consolidation loans, purchase financing, merchant cash advances, and small-business loans.
One primary difference among Fintechs is the manner in which loans are funded via their platforms. The P2P model enables investors to provide financing to borrowers by purchasing fractional shares of individual loans through a Fintech’s platform. Loans are funded by multiple investors who typically spread their risk across several loans.
After receiving an application, a P2P lender posts loan details on its platform, where investors can view them and pledge to invest a certain amount to fund the loan (usually a fraction of the loan’s full value). Investors review and pledge funds based on their own decision-making criteria. If sufficient funding pledges result, the loan is funded.
As more institutional investors entered the space prior to mid-2016, Fintech lending platforms sought ways to help these investors put more capital to work by giving them the ability to purchase whole loans. At this point, some platforms shifted away from the P2P model and began using more traditional specialty-finance business models to fund lending.
In addition to P2P funding, other frequently used funding sources include credit facilities, forward-purchase agreements, and securitizations. After receiving an application, lenders using these funding sources first determine whether a loan would be suitable for funding with any of their available funding sources. Example: A lender may have entered into a forward-purchase agreement (forward flow) with an institutional investor. A forward flow is an agreement between a Fintech and an investor in which the investor agrees to make regular purchases (typically monthly) of a certain quality of loan from the Fintech at specific volume for a specific period of time. For instance, a Fintech might agree to sell $15 million of B-grade loans per month at 10% below par for a 12-month period. If the loan being applied for meets the criteria for the forward-flow agreement, the Fintech will make the loan.
Fintech lenders profit primarily from origination (an upfront fee of 3-14% of the loan amount) and servicing fees. Their funding models allow them to continue increasing origination volume while working to reduce their overall cost of capital. As a result, most Fintech lenders continually work to secure a diversified range of funding sources.
B2B (Business-to-Business) lending platforms provide services to businesses or match businesses to other businesses. Examples of recent trends in B2B lending are online platforms that allow small businesses to access receivables financing, or matchmakers (B2B platforms that match companies with R&D service providers). Also emerging are B2B platforms that use the idea of a “sharing economy” and allow businesses to meet on their platforms and rent equipment. EquipmentShare is a construction technology platform that allows construction companies to rent heavy construction equipment from other businesses that own the equipment.
EQUIPMENT LEASING & FINANCE FOUNDATION • 13

14 • EQUIPMENT LEASING & FINANCE FOUNDATION
HEADWINDS, UNDERCURRENTS, and TAILWINDSFintech Origination Trends The scope of products and services offered by Fintechs expanded rapidly until 2016 as companies that first focused on payments and money transfers expanded into or sprang up to focus on wealth management, insurance, regulatory compliance, and small-business lending. Figure 4 shows Marketplace Lender origination activity for both small businesses and consumers from 2010 through 3Q 2016.
Figure 4: Fintech Originations Volume 2010-2016
Source: Orchard Platform
As Figure 4 reveals, small-business loan originations through Fintechs reached a peak in Q4 of 2015 then began to decline. Even so, originations still reached more than $2 billion per quarter as of Q3 of 2016. The decline can be largely attributed to adverse events occurring in 2016 at several big-name Fintechs, which are discussed in detail in the following section. Total investments in Fintech platforms also declined in 2016. Figure 5 provides information only on small-business originations executed by Fintech Lenders.
Figure 5: Fintech Small-Business Originations by Quarter, 2005-2017
Source: Orchard Platform
14 • EQUIPMENT LEASING & FINANCE FOUNDATION
Source: Orchard Platform
As Figure 4 reveals, small-business loan originations through Fintechs reached a peak in Q4 of 2015 and then began to decline. Even so, originations still reached more than $2 billion per quarter as of Q3 of 2016viii. The decline can be largely attributed to adverse events occurring in 2016 at several big-name Fintechs, which are discussed in detail in the following section. Total investments in Fintech platforms also declined in 2016. Figure 5 provides information only on small-business originations executed by Marketplace Lenders.
Figure 5: Fintech Small-Business Originations by Quarter, 2005-2017
Source: Orchard Platform
Figure 6 reveals that the largest average transaction sizes stem from Agriculture/Forestry, Mining and Oil/Gas Extraction, and Utilities. Interestingly, research conducted by Morgan Stanley in 2015 projected that P2P lending would capture 10% of all U.S. lending by 2020 and reach $150-$490 billion globallyix. Assuming that Fintechs do capture 10% of both small-
Figure 6 reveals that the largest average transaction sizes stem from Agriculture/Forestry, Mining and Oil/Gas Extraction, and Utilities. Interestingly, research conducted by Morgan Stanley in 2015 projected that P2P lending would capture 10% of all U.S. lending by 2020 and reach $150-$490 billion globallyix. Assuming that Fintechs do capture 10% of both small-business and consumer lending markets, Foundation Capital Partner Charles Moldow projected in 2015 that global marketplace lending would grow to $1 trillion by 2025x.

EQUIPMENT LEASING & FINANCE FOUNDATION • 15
HEADWINDS, UNDERCURRENTS, and TAILWINDSFigure 6 reveals that the largest average transaction sizes stem from Agriculture/Forestry, Mining and Oil/Gas Extraction, and Utilities. Interestingly, research conducted by Morgan Stanley in 2015 projected that P2P lending would capture 10% of all U.S. lending by 2020 and reach $150-$490 billion globally. Assuming that Fintechs do capture 10% of both small-business and consumer lending markets, Foundation Capital Partner Charles Moldow projected in 2015 that global marketplace lending would grow to $1 trillion by 2025.
Figure 6: Fintech Small-Business Originations by Industry Sector, 2005-2017
Source: Orchard Platform
HeadwindsOf course, projections are simply that. Time and growth bring challenges to every industry, and the Fintech sector is no exception. We see the following situations as posing current or future obstacles to Fintech companies.
Compliance Issues
The Fintech sector faces obstacles of its own creation regarding compliance with federal regulations. Fraud, cybersecurity, or money-laundering operations are potential issues, among other situations, that require Fintechs’ readiness to prevent from such actions and comply with regulations. Lending Club CEO Renaud Laplanche resigned in 2016 following the company’s admission that it sold more than $20 million in loans to investors, even though the loans did not meet investor requirements. Prosper Marketplace lost its bond partnership with Citigroup just nine months after the partnership began
EQUIPMENT LEASING & FINANCE FOUNDATION • 15
Figure 6: Fintech Small-Business Originations by Industry Sector, 2005-2017
HeadwindsOf course, projections are simply that. Time and growth bring challenges to every industry, and the Fintech sector is no exception. We see the following situations as posing current or future obstacles to Fintech companies.
ComplianceIssuesThe Fintech sector faces obstacles of its own creation regarding compliance with federal regulations. Fraud, cybersecurity, or money-laundering operations are potential issues, among other situations, that require Fintechs’ readiness to prevent from such actions and comply with regulations. Lending Club CEO Renaud Laplanche resigned in 2016 following the company’s admission that it sold more than $20 million in loans to investors, even though the loans did not meet investor requirementsxi. Prosper Marketplace lost its bond partnership with Citigroup just nine months after the partnership began and Citigroup, which had already repackaged $1.5 billion of Prosper’s loans into securities, had no comment about the termination. The developments occurred amid additional revelations of loan-stacking—the practice of applying for several loans at once—by borrowers who had slipped through the automated underwriting systems of several Fintechs, including OnDeck Capital, Kabbage, Lending Club, and Prosper,
16 • EQUIPMENT LEASING & FINANCE FOUNDATION
HEADWINDS, UNDERCURRENTS, and TAILWINDSand Citigroup, which had already repackaged $1.5 billion of Prosper’s loans into securities, had no comment about the termination. The developments occurred amid additional revelations of loan-stacking—the practice of applying for several loans at once—by borrowers who had slipped through the automated underwriting systems of several Fintechs, including OnDeck Capital, Kabbage, Lending Club, and Prosper, suggesting a need for improved fraud controls Loan stacking more than doubled from 2013 to 2015, and Lending Club, OnDeck Capital, and Prosper have since joined a group created by ID Analytics, LLC, to detect multiple loan applications by a single borrower. Nonetheless, a recent report identified loan-stacking as one of the largest drivers of increased losses for Fintechs in early 2017. An examination of regulations currently under consideration for Fintechs appears in the section entitled, “Undercurrents.”
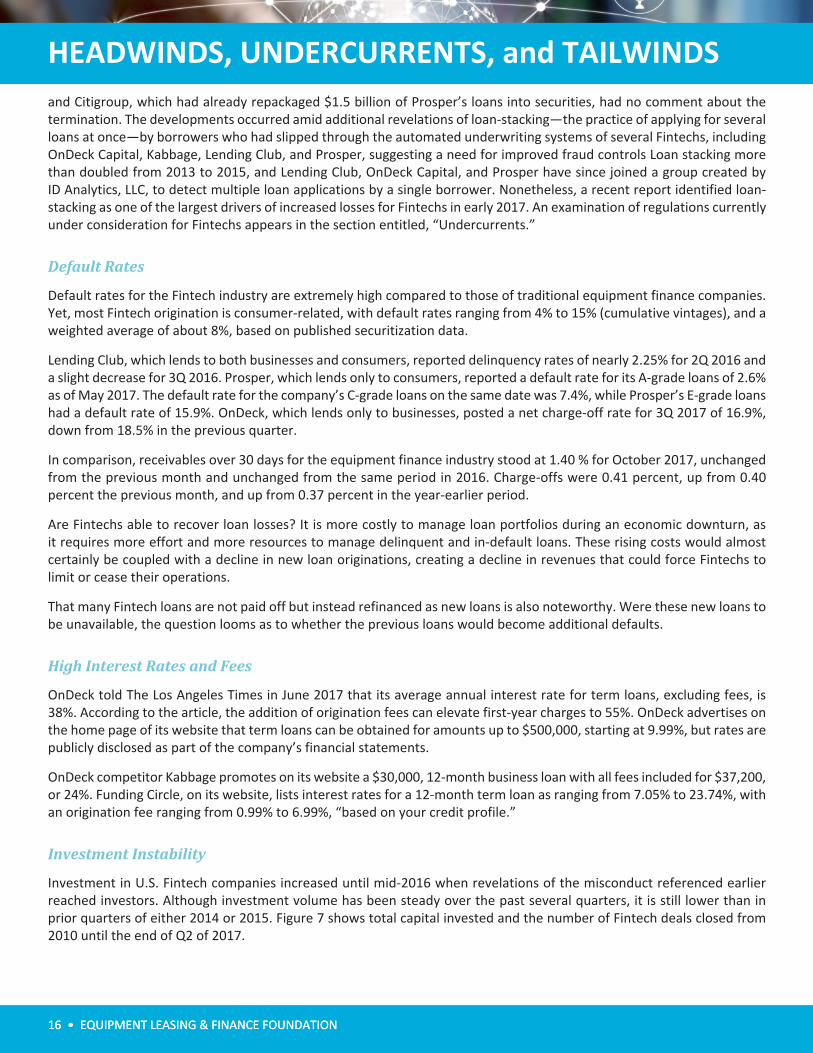
Default Rates
Default rates for the Fintech industry are extremely high compared to those of traditional equipment finance companies. Yet, most Fintech origination is consumer-related, with default rates ranging from 4% to 15% (cumulative vintages), and a weighted average of about 8%, based on published securitization data.
Lending Club, which lends to both businesses and consumers, reported delinquency rates of nearly 2.25% for 2Q 2016 and a slight decrease for 3Q 2016. Prosper, which lends only to consumers, reported a default rate for its A-grade loans of 2.6% as of May 2017. The default rate for the company’s C-grade loans on the same date was 7.4%, while Prosper’s E-grade loans had a default rate of 15.9%. OnDeck, which lends only to businesses, posted a net charge-off rate for 3Q 2017 of 16.9%, down from 18.5% in the previous quarter.
In comparison, receivables over 30 days for the equipment finance industry stood at 1.40 % for October 2017, unchanged from the previous month and unchanged from the same period in 2016. Charge-offs were 0.41 percent, up from 0.40 percent the previous month, and up from 0.37 percent in the year-earlier period.
Are Fintechs able to recover loan losses? It is more costly to manage loan portfolios during an economic downturn, as it requires more effort and more resources to manage delinquent and in-default loans. These rising costs would almost certainly be coupled with a decline in new loan originations, creating a decline in revenues that could force Fintechs to limit or cease their operations.
That many Fintech loans are not paid off but instead refinanced as new loans is also noteworthy. Were these new loans to be unavailable, the question looms as to whether the previous loans would become additional defaults.
High Interest Rates and Fees
OnDeck told The Los Angeles Times in June 2017 that its average annual interest rate for term loans, excluding fees, is 38%. According to the article, the addition of origination fees can elevate first-year charges to 55%. OnDeck advertises on the home page of its website that term loans can be obtained for amounts up to $500,000, starting at 9.99%, but rates are publicly disclosed as part of the company’s financial statements.
OnDeck competitor Kabbage promotes on its website a $30,000, 12-month business loan with all fees included for $37,200, or 24%. Funding Circle, on its website, lists interest rates for a 12-month term loan as ranging from 7.05% to 23.74%, with an origination fee ranging from 0.99% to 6.99%, “based on your credit profile.”
Investment Instability
Investment in U.S. Fintech companies increased until mid-2016 when revelations of the misconduct referenced earlier reached investors. Although investment volume has been steady over the past several quarters, it is still lower than in prior quarters of either 2014 or 2015. Figure 7 shows total capital invested and the number of Fintech deals closed from 2010 until the end of Q2 of 2017.
16 • EQUIPMENT LEASING & FINANCE FOUNDATION

EQUIPMENT LEASING & FINANCE FOUNDATION • 17
HEADWINDS, UNDERCURRENTS, and TAILWINDSFigure 7. Total U.S. Investment in Fintech Companies, 2010-2017
Source: KPMG International
Figure 8 focuses on Venture Capital investment in Fintechs and shows that although activity dropped noticeably in 4Q in 2015 and fell further in 2Q in 2016, the trend began to reverse itself in 3Q of 2016. VC investment continued to rebound through 2Q of 2017, the latest period for which information is available.
Figure 8. Venture Investment in Fintech Companies, 2010-2017
Source: KPMG International
UndercurrentsUnderlying circumstances don’t necessarily become major influences affecting an industry or sector, but they can, warranting an examination of these situations. What follows is a discussion of 12 factors that could alter the course of the Fintech sector, given changes in the economy or in the financial-services environment.
EQUIPMENT LEASING & FINANCE FOUNDATION • 17
InvestmentInstabilityInvestment in U.S. Fintech companies increased until mid-2016 when revelations of the misconduct referenced earlier reached investors. Although investment volume has been steady over the past several quarters, it is still lower than in prior quarters of either 2014 or 2015. Figure 7 shows total capital invested and the number of Fintech deals closed from 2010 until the end of Q2 of 2017.
Figure 7. Total U.S. Investment in Fintech Companies, 2010-2017
Source: KPMG International
Figure 8 focuses on Venture Capital investment in Fintechs and shows that although activity dropped noticeably in 4Q in 2015 and fell further in 2Q in 2016, the trend began to reverse itself in 3Q of 2016. VC investment continued to rebound through 2Q of 2017, the latest period for which information is available.
Figure 8. Venture Investment in Fintech Companies, 2010-2017
Source: KPMG International
UndercurrentsUnderlying circumstances don’t necessarily become major influences affecting an industry or sector, but they can, warranting an examination of these situations. What follows is a discussion of 12 factors that could alter the course of the Fintech sector, given changes in the economy or in the financial-services environment.
LackofFullPerformanceHistoryDue to lack of performance histories during economic cycles, it is difficult to assess how Fintech companies will perform if interest rates continue to rise, if the economy slows down, or if liquidity evaporates. The development and use of risk measures and risk-management tools, especially under the scenario of major increases in default rates during a business downturn, are critical for the long-term survival and growth of the Fintech sector. We mentioned earlier that Fintech default rates are already quite high. Yet, the Fintech lending business model heavily relies on loan originations and the subsequent sale of those loans. In a major economic downturn, loan defaults could result in large losses for Fintechs that would likely exhaust any default reserves these companies might have. Not only would servicing revenue be lost due to rising defaults loan origination would be adversely impacted, as well. Originations could decline or be interrupted for other reasons too, including regulatory restrictions, declining investor interest, increased competition, or the loss of relationship with originating partner-institutions. The decline of loan origination would slash revenue and, in turn, lead to operational difficulties for Fintech lenders and platform providers. In the equipment finance industry, historical data from various economic and business cycles are used to anticipate collateral performance and to compare individual pool performance with that of the whole sector or a typical benchmark pool. For Fintech companies, quantifying the risks of losses in case of a downturn, and educating investors about these risks, would increase transparency and bring Fintech disclosure practices more in line with those of traditional equipment finance companies.

18 • EQUIPMENT LEASING & FINANCE FOUNDATION
HEADWINDS, UNDERCURRENTS, and TAILWINDSLack of Full Performance History
Due to lack of performance histories during economic cycles, it is difficult to assess how Fintech companies will perform if interest rates continue to rise, if the economy slows down, or if liquidity evaporates. The development and use of risk measures and risk-management tools, especially under the scenario of major increases in default rates during a business downturn, are critical for the long-term survival and growth of the Fintech sector. We mentioned earlier that Fintech default rates are already quite high. Yet, the Fintech lending business model heavily relies on loan originations and the subsequent sale of those loans.
In a major economic downturn, loan defaults could result in large losses for Fintechs that would likely exhaust any default reserves these companies might have. Not only would servicing revenue be lost due to rising defaults, loan origination would be adversely impacted, as well. Originations could decline or be interrupted for other reasons, too, including regulatory restrictions, declining investor interest, increased competition, or the loss of relationship with originating partner-institutions. The decline of loan origination would slash revenue and, in turn, lead to operational difficulties for Fintech lenders and platform providers.
In the equipment finance industry, historical data from various economic and business cycles are used to anticipate collateral performance and to compare individual pool performance with that of the whole sector or a typical benchmark pool. For Fintech companies, quantifying the risks of losses in case of a downturn, and educating investors about these risks, would increase transparency and bring Fintech disclosure practices more in line with those of traditional equipment finance companies.
Potential credit-risk concepts should also be considered: risks of platform failure; bankruptcy following large financial losses; or the possibility of operational failure. Maintaining robust cybersecurity, including guards against money-laundering, is another necessity requiring the readiness of Fintech platforms to prevent large-scale fraud and comply with regulations.
Loan Credit Performance in Downturns
An economic downturn can result in a credit crisis or a liquidity crisis, either of which could adversely impact Fintechs. Potential liquidity shocks could also negatively impact institutional investors who fund certain Fintech loans.
Fintech companies earn much of their revenue upfront, at the time of loan origination. They have no direct exposure to the credit risk of loans originated through their platforms, except for the potential loss of the servicing revenue from the default of those loans. Thus, negative economic impact on a Fintech platform provider is limited to the loss of ongoing servicing fees for defaulted loans. Consequently, the risk of less prudent underwriting and collections practices is assumed to be lower for Fintechs than for lenders that hold or retain an interest in the loans that they originate and service. Recently, however, investors, banks, and funds have pushed for more of a hybrid funding model to align not only interests but capital. Furthermore, Lending Club and OnDeck have worked hard to diversify their funding sources to protect them from funding risk. Ondeck has also significantly reduced the amount of its revenue from gain on sale and is migrating to more of an on-book Financing Company model.
The use of upfront incentives creates both short- and long-term consequences. Originators are motivated to originate as many loans as possible by widening the borrower base and sometimes by loosening the underwriting standards. We witnessed the impact of such incentives in the consumer mortgage market in the early 2000s, and the 2008-2009 credit crisis resulted.
Considerable literature exists on equities asset-pricing, showing that value and small-cap stocks yield higher returns, on average, due to their higher risk, which is attributable to the smaller chances of their survival during economic downturns. Value and Size Premium in equities were revealed only in 1980, after many decades of data availability, and are now considered to be risk factors in equities markets. That is, investors get compensated for buying small-cap stocks due to their riskiness, as compared with other size stocks.
18 • EQUIPMENT LEASING & FINANCE FOUNDATION

EQUIPMENT LEASING & FINANCE FOUNDATION • 19
HEADWINDS, UNDERCURRENTS, and TAILWINDSIn 2015, Gandhi and Lustig found that large commercial bank stocks have significantly lower risk-adjusted returns than small- and medium-size bank stocks. This was the case, even though large banks are significantly more leveraged than smaller ones. Gandhi and Lustig show that in the banking sector, size is a proxy of exposure to bank-specific tail risk (extreme events that impact banking stocks), which explains the high risk-adjusted returns to small-size stocks.
These findings, which could reasonably be linked with Fintech survival in a downturn, should be taken into account when considering the future prospects and growth potential of these companies.
Tightening Monetary Policy
Should the Federal Reserve tighten monetary policy, credit qualifications would tighten and bank reserve requirements would increase. The Fed Funds Futures (See 30-Day Fed Funds Futures at the CME) price-in a few interest-rate increases for the near future and such changes would impact the cost of and access to capital for Fintechs. Although Fintech lenders and non-lenders have low operating costs, this advantage could diminish as interest rates climb.
The key to assessing the impact of rising interest rates on Fintechs is to estimate what part of the cost of funds for these companies is interest-rate sensitive. That is, what part of Fintechs’ overall cost will be affected due to rising rates? In its recent report, “Marketplace Lending, A Temporary Phenomenon?”, Deloitte compared the costs incurred in originating and servicing a loan through the traditional bank model with an equivalent loan originated and serviced through a Fintech model. The analysis does not compare the total costs of operating a bank to the total costs of operating a Fintech lending company. It simply analyzes the cost of funding an unsecured personal loan at banks and at Fintech lenders in the current environment and in a hypothetical, higher interest-rate environment.
Although equipment finance companies do not provide unsecured personal loans, the analysis is helpful for understanding hypothetical cost scenarios for both banks and Fintech lenders after a 1% interest increase. Figures 9 and 10 show the breakdown of costs between interest-rate-sensitive and not-interest-rate-sensitive portions of costs for banks and Fintechs.
Figure 9. Cost of Funding an Unsecured Personal Loan at Banks and at Fintechs
Source: Deloitte
EQUIPMENT LEASING & FINANCE FOUNDATION • 19
impact the cost of and access to capital for Fintechs. Although Fintech lenders and non-lenders have low operating costs, this advantage could diminish as interest rates climb.
The key to assessing the impact of rising interest rates on Fintechs is to estimate what part of the cost of funds for these companies is interest-rate sensitive. That is, what part of Fintechs’ overall cost will be affected due to rising rates? In its recent report, “Marketplace Lending, A Temporary Phenomenon?”, Deloitte compared the costs incurred in originating and servicing a loan through the traditional bank model with an equivalent loan originated and serviced through a Fintech model. The analysis does not compare the total costs of operating a bank to the total costs of operating a Fintech lending company. It simply analyzes the cost of funding an unsecured personal loan at banks and at Fintech lenders in the current environment and in a hypothetical, higher interest-rate environment. Although equipment finance companies do not provide unsecured personal loans, the analysis is helpful for understanding hypothetical cost scenarios for both banks and Fintech lenders after a 1% interest increase. Figures 9xxii, 9A and 10 show the breakdown of costs between interest-rate-sensitive and not-interest-rate-sensitive portions of costs for banks and Fintechs. Figure 9. Cost of Funding an Unsecured Personal Loan at Banks and at Fintechs
Source: Deloitte
Figure 10. Comparative Operating Expenses for an Unsecured Personal Loan
Operating Expense Bank Fintech
Loan acquisition cost 50 bps 95 bps

20 • EQUIPMENT LEASING & FINANCE FOUNDATION
HEADWINDS, UNDERCURRENTS, and TAILWINDSFigure 10. Comparative Operating Expenses for an Unsecured Personal Loan
Source: Deloitte, 2016
Total funding costs for banks are lower than those for Fintech lenders. Yet, the non-interest-rate-sensitive component of a Fintech lender’s funding profile is proportionately lower than that of a bank. Therefore, Fintech lenders’ costs will rise significantly more than banks’ costs—25% vs. 13%—as interest rates increase.
Several states already enforce usury laws that could render loans with high interest rates unenforceable in those states. To that end, Lending Club recently excluded borrowers in Colorado from its recent pool and pledged to buy back any loans that are vulnerable to state usury laws.
Banks have also started to push back against certain court rulings regarding local usury laws. Two state-chartered banks, WebBank and Cross River Bank, with support from seven other trading groups, recently filed complaints about declaratory judgment and injunctive relief against the Administrator of the Uniform Consumer Credit Code for the state of Colorado.
Competition from Incumbents
Most financial institutions investing in Fintech companies have done so since 2009. Borrowers still value the benefits of speed and convenience offered by Fintech lenders, but competition will likely encourage traditional equipment finance companies to replicate successful innovations in this area and offer the same convenience, speed, and efficiency. As this occurs, it remains to be seen whether Fintechs will continue to stay ahead of incumbents by innovating further, or whether their distinction and competitive advantage will fade.
Cybersecurity Risks
Cybercrime is at an all-time high in financial services, and cyber-attacks are more sophisticated than ever. Fintechs, by virtue of their business model, create new security vulnerabilities and risks for their clientele. In its most recent Semiannual Risk Perspective Report, the Office of the Comptroller of the Currency (OCC) notes that “Strategic risk remains elevated as banks make decisions to expand into new products or services or consider new delivery channels and continue merger and acquisition activity. Banks face competition from nonfinancial firms, including financial technology companies entering the traditional banking industry. This competition is causing changes in the way customers and financial institutions approach banking.”
The OCC report further notes that operational risk continues to challenge banks “because of increasing cyber threats, reliance on concentrations in significant third-party service providers, and the need for sound governance over product service and delivery.”
Impact of a Credit/Liquidity Crisis on Fintechs
During the 2008-2009 Recession, crises occurred in both credit and liquidity. Liquidity all but evaporated even for such major institutions as Goldman Sachs, General Electric and Bank of America, among others. Having little or no access to credit, these entities turned to Warren Buffett for cash infusions. But terms were less than attractive: Buffett got 10% preferred shares, plus at-the-money warrants (as of the contract date in 2008) to buy common shares worth $5 billion in the case of Goldman Sachs, and $3 billion in the case of GE.
20 • EQUIPMENT LEASING & FINANCE FOUNDATION
Figure 10. Comparative Operating Expenses for an Unsecured Personal Loan
Operating Expense Bank Fintech
Loan acquisition cost 50 bps 95 bps Loan processing and servicing cost 115 bps 15 bps Loan collections and recovery cost 50 bps 40 bps TOTAL 215 bps 180 bps
Source: Deloitte, 2016 Total funding costs for banks are lower than those for Fintech lenders. Yet, the non-interest-rate-sensitive component of a Fintech lender’s funding profile is proportionately lower than that of a bank. Therefore, Fintech lenders’ costs will rise significantly more than banks’ costs—25% vs. 13%—as interest rates increase. Several states already enforce usury laws that could render loans with high interest rates unenforceable in those states. To that end, Lending Club recently excluded borrowers in Colorado from its recent pool and pledged to buy back any loans that are vulnerable to state usury laws. Banks have also started to push back against certain court rulings regarding local usury laws. Two state-chartered banks, WebBank and Cross River Bank, with support from seven other trading groups, recently filed complaints about declaratory judgment and injunctive relief against the Administrator of the Uniform Consumer Credit Code for the state of Colorado.
CompetitionfromIncumbentsMost financial institutions investing in Fintech companies have done so since 2009xxiii. Borrowers still value the benefits of speed and convenience offered by Fintech lenders, but competition will likely encourage traditional equipment finance companies to replicate successful innovations in this area and offer the same convenience, speed, and efficiency. As this occurs, it remains to be seen whether Fintechs will continue to stay ahead of incumbents by innovating further, or whether their distinction and competitive advantage will fade.
CybersecurityRisksCybercrime is at an all-time high in financial services, and cyber-attacks are more sophisticated than ever. Fintechs, by virtue of their business model, create new security vulnerabilities and risks for their clientele. In its most recent Semiannual Risk Perspective Reportxxiv, the Office of the Comptroller of the Currency notes that “Strategic risk remains elevated as banks make decisions to expand into new products or services or consider new delivery channels and continue merger and acquisition activity. Banks face competition from nonfinancial firms, including financial technology companies entering the traditional banking industry. This competition is causing changes in the way customers and financial institutions approach banking.”
The OCC report further notes that operational risk continues to challenge banks “because of increasing cyber threats, reliance on concentrations in significant third-party service providers, and the need for sound governance over product service and delivery.”

EQUIPMENT LEASING & FINANCE FOUNDATION • 21
HEADWINDS, UNDERCURRENTS, and TAILWINDSIf there could be a severe liquidity crisis for such well-capitalized companies as Goldman Sachs, Bank of America, or GE, then, the potential impact of similar events could be devastating on smaller firms, especially new market entrants, such as Fintechs.
Treatment of Risk
Fintech companies and incumbents approach risk differently. Both bank and non-bank incumbents have much to lose if risk is poorly managed: established business; expected cash- flow stream; legacy systems; and the possibility of defaults and losses. Seasoned incumbents have also witnessed multiple business cycles and use the experience to price-in the possibility of such macroeconomic shocks as slowdowns, recessions, and changes in the monetary policy when making origination and underwriting decisions.
Fintechs, however, may not build the possibility of adverse events into their prices or do it with the same knowledge and expertise. Nor may all Fintechs try to preserve margins, believing they have little to lose from failure and much to gain if investors and customers become more interested in their companies and products. Yet, it would be a mistake to paint all Fintech lenders with the same brush, since several are making large investments in risk management. OnDeck, for example, recently hired a risk management executive who formerly held a lead position at GE Capital.
It is also true that many start-up Fintechs view a high risk/reward ratio as more attractive than do established Fintechs. In the current healthy economy, this preference has often resulted in fast growth for these start-ups. Yet, much of the risk is born by others who purchase the loans that these Fintechs originate, begging the question of what happens in a downturn.
Another question that arises: Will the size of the overall lending pie increase due to the market entry of additional Fintechs? What will determine distribution or redistribution, and who will be winners and losers?
In Price Waterhouse Cooper’s 2017 Global Fintech Survey of 1,308 CEOs and other executives involved in strategy and innovation across six regions, participants shared their perceptions of Fintechs’ advantages and disadvantages, compared to those of incumbents. Participants also listed what they viewed as Fintechs’ perceptions of their own competitive strengths. Results are summarized in Figure 11.
Figure 11. Advantages and Disadvantages, Fintechs vs. Incumbents
EQUIPMENT LEASING & FINANCE FOUNDATION • 21
ADVANTAGES
BANKS FINTECHS
Existing Customer Base No Legacy Systems
Reputation for trust and Stability Capacity to Innovate
Experience with Regulators Less regulatory Pressure
Provider of Liquidity Agility and Speed to Market
Deep Access to Credit Tech Expertise
Rigorous Risk Mgmt. Programs Able to Improve current products
DISADVANTAGES
BANKS FINTECHS
Slow to innovate Time to build/earn trust
Slow to roll out new products Small or insufficient capitalizations
Slow to enter new markets Small customer bases at start-up
Highly regulated Perceived vulnerability to fraud/hacking
Bloated cost structures Perceived misuse of private data
Lost trust in global financial crisis Inexperienced management teams
High account fees and penalties Limited products at early stage
Same expensive process for large loans as for small
Unproven uses for alternative data
FINTECHS’ Perception of their Own Competitive Strengths
• Focus on Limited Product Set
• Absence of Legacy Systems
• Agility and Speed to Market
• Capacity to Innovate
• Tech knowledge
• Less Regulatory Pressure
• Ability to Improve current products
• Superior Customer Experience

22 • EQUIPMENT LEASING & FINANCE FOUNDATION
HEADWINDS, UNDERCURRENTS, and TAILWINDS
Source: PWC Global Fintech Report, 2017
22 • EQUIPMENT LEASING & FINANCE FOUNDATION
ADVANTAGES
BANKS FINTECHS
Existing Customer Base No Legacy Systems
Reputation for trust and Stability Capacity to Innovate
Experience with Regulators Less regulatory Pressure
Provider of Liquidity Agility and Speed to Market
Deep Access to Credit Tech Expertise
Rigorous Risk Mgmt. Programs Able to Improve current products
DISADVANTAGES
BANKS FINTECHS
Slow to innovate Time to build/earn trust
Slow to roll out new products Small or insufficient capitalizations
Slow to enter new markets Small customer bases at start-up
Highly regulated Perceived vulnerability to fraud/hacking
Bloated cost structures Perceived misuse of private data
Lost trust in global financial crisis Inexperienced management teams
High account fees and penalties Limited products at early stage
Same expensive process for large loans as for small
Unproven uses for alternative data
FINTECHS’ Perception of their Own Competitive Strengths
• Focus on Limited Product Set
• Absence of Legacy Systems
• Agility and Speed to Market
• Capacity to Innovate
• Tech knowledge
• Less Regulatory Pressure
• Ability to Improve current products
• Superior Customer Experience
Figure 11. Advantages and Disadvantages, Fintechs vs. Incumbents (Continued)

EQUIPMENT LEASING & FINANCE FOUNDATION • 23
HEADWINDS, UNDERCURRENTS, and TAILWINDSThe Use of Alternative Data
As part of their risk-management strategies, Fintech lenders rely on proprietary algorithms for credit underwriting. Information used in these algorithms often includes data from non-traditional sources. Upstart, for example, uses borrowers’ educational background, alma-mater ranking and field of study to help determine creditworthiness and assign risk ratings. In comparison, Prosper’s API “offers [users] more than 475 credit bureau variables and more than 550 data points in total,” according to the company’s website.
Some incumbents also use non-traditional data points to assess borrower reputation and other characteristics not typically considered in credit-decisioning. This may be done through Google searches, various industry-specific commercial-reputation ranking services, and other information that is generally available online. Incumbents have much less comfort adopting data-service APIs such as Plaid or YODLEE, however, citing the comfort level of lessees/borrowers. Regulations are also a consideration when some incumbents consider the use of non-traditional data in credit-decisioning.
No evidence exists to date that the use of alternative data provides superior underwriting. What it may do, however, is provide justification for approving more loans. Deloitte’s 2016 Survey of Small Businesses and Retail Consumers was conducted to better assess the drivers of Fintech lending success. It provides strong evidence that Fintechs differentiate themselves with an attractive customer experience at acceptable lending rates. Note: The information in Figure 12 pertains to retail consumers. We are using this data to extrapolate to businesses, however, as many of the drivers would be the same. Data from the Deloitte Survey also confirms that borrowers have similar preferences for Fintech lenders due to the speed, convenience, and efficiency of their processes. Survey results follow.
Figure 12. Reasons for Borrowing from Fintechs, Retail Consumers
Source: Deloitte, YouGov plc, 2016
Deloitte also surveyed retail consumers’ preferences for lending money through Fintechs. Again, we use this data to extrapolate to businesses, as many of the drivers would be the same.
EQUIPMENT LEASING & FINANCE FOUNDATION • 23
Figure 12. Reasons for Borrowing from Fintechs, Retail Consumers
Driver Percentage
Easy/quick application process 81 Fast decision-making 72 Convenience of online platform 72 Competitive rates 69 Repayment flexibility 55 Little documentation required 53 Trying out a new way of borrowing 39 Less personal data required 35 Couldn't get a loan/credit elsewhere 32 Recommendation from friend/colleague 22 Distrust of banks 18 Recommendation from financial advisor 12
Source: Deloitte, YouGov plc, 2016
Deloitte also surveyed retail consumers’ preferences for lending money through Fintechs. Again, we use this data to extrapolate to businesses, as many of the drivers would be the same.
Figure 13. Reasons for Using Fintechs to Lend Money, Retail Consumers
Driver Percentage
Better return on investment 77 Trying out a new way of lending/investing 71 Easy/simple to use 68 Convenient 62 Ability to specify risk aversion/return 56 Ability to choose who to lend to 36 More secure 35 Provision fund 35 Quick return on investment 30 Recommendation from friend/colleague 24 Tax benefits 12 Recommendation from banker/financial advisor 11
Source: Deloitte, YouGov plc, 2016
DemographicChangesandImpactonFintechUseMillennials, those born between the early 1980s and the early 1990s, compose the largest generation in American history. These men and women number 83.1 million people and

24 • EQUIPMENT LEASING & FINANCE FOUNDATION
HEADWINDS, UNDERCURRENTS, and TAILWINDS Figure 13. Reasons for Using Fintechs to Lend Money, Retail Consumers
Source: Deloitte, YouGov plc, 2016
Demographic Changes and Impact on Fintech Use
Millennials, those born between the early 1980s and the early 1990s, compose the largest generation in American history. These men and women number 83.1 million people and represent more than 25% of the U.S. population. Estimates show they will compose reach 50% of the global workforce by 2020. Most Millennials now support themselves and are increasingly in need of financial services. These young adults have a strong preference for resources available online or on mobile devices, automated processes, convenience of use of products, and transparency of information. They prefer digital platforms and often avoid traditional banking processes. Millennials’ demands for transparency, convenience, and lower costs are creating new services, products, and apps placing increased pressure on traditional financial-services companies to adapt.
To attract Millennials, incumbents must provide the tools and platforms that this demographic group prefers. The Millennial Disruption Index identifies industries likely to be transformed by Millennials. Of all industries considered, the banking industry is identified as the most likely to be disrupted. According to the Index, 53% of Millennials do not believe their bank has differentiated offerings; 71% would rather go to the dentist than listen to a banker, and one in three is open to changing banks in the next 90 days. Traditional banks, in short, are viewed as nearly irrelevant.
Yet, research suggests that those aged 50 and higher compose the fastest growing group of online users. Thus, traditional lenders are competing not only to attract and retain younger customers but to retain certain older customers, as well.
Potential Regulation
Note: Before discussing potential regulation as an undercurrent for Fintech companies, we observe that Fintech regulation might also serve as a tailwind for incumbents—particularly banks—since they already have regulatory structure in place.
Growth, changes, and missteps in the Fintech sector have motivated regulators and lawmakers to work to control certain aspects of the industry. Federal regulators have subjected Fintech lenders to cautionary guidance and pointed to the risks involved, particularly as they relate to fair lending and compliance with the Equal Credit Opportunity Act (ECOA). Example: Many Fintech platforms collect data from borrowers’ social networking activities and apply that data to their proprietary
Figure 12. Reasons for Borrowing from Fintechs, Retail Consumers
Driver Percentage
Easy/quick application process 81 Fast decision-making 72 Convenience of online platform 72 Competitive rates 69 Repayment flexibility 55 Little documentation required 53 Trying out a new way of borrowing 39 Less personal data required 35 Couldn't get a loan/credit elsewhere 32 Recommendation from friend/colleague 22 Distrust of banks 18 Recommendation from financial advisor 12
Source: Deloitte, YouGov plc, 2016
Deloitte also surveyed retail consumers’ preferences for lending money through Fintechs. Again, we use this data to extrapolate to businesses, as many of the drivers would be the same.
Figure 13. Reasons for Using Fintechs to Lend Money, Retail Consumers
Driver Percentage
Better return on investment 77 Trying out a new way of lending/investing 71 Easy/simple to use 68 Convenient 62 Ability to specify risk aversion/return 56 Ability to choose who to lend to 36 More secure 35 Provision fund 35 Quick return on investment 30 Recommendation from friend/colleague 24 Tax benefits 12 Recommendation from banker/financial advisor 11
Source: Deloitte, YouGov plc, 2016
DemographicChangesandImpactonFintechUseMillennials, those born between the early 1980s and the early 1990s, compose the largest generation in American history. These men and women number 83.1 million people and

EQUIPMENT LEASING & FINANCE FOUNDATION • 25
HEADWINDS, UNDERCURRENTS, and TAILWINDSalgorithms to determine borrowers’ creditworthiness. This practice may not be compliant with the ECOA. By comparison, traditional lenders comply with the ECOA by using credit scores from established credit agencies and other information unrelated to borrower character.
Gordon Mills and Braden McCarthy (2017) note seven regulatory bodies currently engaged in examining some aspect of the Fintech lending market for small business loans. These bodies are:
• The Federal Reserve
• The Office of the Comptroller of the Currency (OCC)
• The Consumer Financial Protection Bureau (CFPB)
• The Securities and Exchange Commission (SEC)
• The Federal Deposit Insurance Corporation (FDIC)
• The Federal Trade Commission (FTC) and
• The National Credit Union Administration (NCUA).
However, no single federal regulatory body has explicit authority for the activities of Fintech small-business lenders. Thus, the “spaghetti soup” of regulations and proposed described by Gordon-Mills and McCarthy, which includes the following events and actions:
Congressman Patrick McHenry, Vice Chair of the House Financial Services Committee, introduced on September 22, 2016, the “Financial Services Innovation Act of 2016,” which is intended to provide a streamlined regulatory process for traditional and Fintech companies to test innovative financial products amid greater certainty about compliance requirements. Federal agencies to be covered by bill requirements include the Consumer Financial Protection Board (CFPB), the Federal Reserve, the FDIC, the National Credit Union Administration (NCUA), the OCC, the Federal Trade Commission (FTC) and Housing and Urban Development (HUD).
The Office of the Comptroller of the Currency issued a white paper, Supporting Responsible Innovation in the Federal Banking System, in March 2016, in which the OCC solicited feedback on its Innovation Initiative to develop a comprehensive framework to identify and understand trends and innovations in the financial services industry.
On December 2, 2016, the OCC announced plans to move forward with a proposal to consider applications from Fintechs to receive charters as special-purpose national banks. The OCC’s white paper expresses three reasons why the agency believes it is in the public interest to provide the special-interest charter. These are to ensure that Fintech companies operate “in a safe and sound manner;” to promote “consistency” in governing law and regulation, and to “make the federal banking system stronger.”
The Consumer Financial Protection Bureau (2017) released a request for information to explore the impact of alternative data sources, including data from mobile phones, rent payment histories, electronic transactions such as deposits, withdrawals, and transfers, building credit histories and increasing credit access. There have been concerns about the potential risks posed by these data sources because they may be biased and could potentially have an adverse impact on credit access to low-income and underserved communities.
On June 27, 2016, the U.S. Supreme Court declined to hear the case of Madden v. Midland Funding LLC, letting stand the decision of the U.S. Court of Appeals for the Second Circuit that the National Bank Act does not protect against state usury law claims if the bank’s assignee is not located in the state in which the loan was originated. The Second Circuit Court of Appeals reversed a century of “valid when made” precedent by letting a state apply its interest rate cap to a loan made in another state that was bought by a third party. Congress may clarify the regulatory uncertainty introduced via Madden v. Midland ruling by the end of 2017, as the uncertainty stemming from this ruling has reduced the credit availability to an underserved market of high-risk borrowers, as recent research has shown.

26 • EQUIPMENT LEASING & FINANCE FOUNDATION
HEADWINDS, UNDERCURRENTS, and TAILWINDSThe special-purpose banks proposal is particularly significant because it could relieve Fintech companies of the need to register or obtain licenses in various states and face differing sets of laws and restrictions. There are also questions, however, about how a Fintech banking charter would change the market, especially considering capital-adequacy and compliance requirements. There is an additional question whether a bank charter would constrain the innovation that has thus far differentiated the Fintech industry from traditional banks. A national bank charter would not necessarily help Fintech companies obtain more stable funding unless they are permitted to take deposits, which would require regulatory oversight by the FDIC.
Some larger banks have praised the idea, seeing it as a leveling of the playing field by regulating Fintech companies. However, community and independent banks argue that if Fintech lenders receive bank charters, they should be held to the same regulations and standards that apply to banks. In April 2017, the Conference of State Bank Supervisors filed suit against the OCC, calling its action “an unprecedented, unlawful expansion of the chartering authority given to it by Congress for national banks.” The OCC’s proposal has also faced criticism from such organizations as the Center for Responsible Lending and New York’s Department of Financial Services. Additionally, some members of Congress have expressed outrage at the OCC’s announcement.
Yet, following the 2016 U.S. presidential election, belief was widespread that the incoming administration would reduce regulation of the financial-services industry. Deregulation was thought to be positive for bank incumbents if various provisions of the Dodd-Frank Act were repealed. Bank deregulation could also diminish legal advantages that Fintech companies have enjoyed since their creation. Bank deregulation may still occur, however, even as new regulation of Fintech companies is set into place. It should be noted, however, that some Fintech lenders outsource any regulatory compliance to the banks with which they collaborate.
Fintech Cost Structure
Fintech lenders typically spend more to market their products or services than incumbents. This is to be expected, given that the Fintech sector is still relatively new and customer acquisition costs are higher than those for more established incumbents, such as banks.
Even the largest Marketplace Lenders struggle to be profitable. In 2016, industry profit (EBIT) was expected to represent 8.6% of total Fintech industry revenue. Despite online interfaces and algorithms that determine a potential borrower’s credit worthiness, industry operators still spend a significant portion of revenue on labor. In 2016, IBISWorld anticipated that wages would represent 16% of total industry revenue. Marketplace Lenders’ interest expenses, according to IBISWorld, represent 25.9% of industry revenue.
Figure 14. Cost Structure, Fintech Lenders vs. the Financial-Services Industry
Source: IBISWorld Report, December 2016
Figure 14. Cost Structure, Fintech Lenders vs. the Financial-Services Industry
Source: IBISWorld Report, December 2016
Fintech lenders market their services through search engines, online and offline campaigns, public relations events, and tradeshows. Marketing expenses represented 27.9% of revenue in 2016xxxii. Rental and utility expenses represented 10.1% of total industry revenue for the year, and other expenses included general administrative costs, data processing, and telecommunications fees. Information on the cost structure of Fintech non-lenders is not readily available.
StabilityoftheFintechBusinessModelDuring normal and expanding economic periods, the Fintech business model works effectively. To analyze the stability of the model during a full economic cycle, however, we must rely on certain assumptions, such as these:
Ø Fintech lenders face the same funding constraints as traditional lenders during times of uncertainty Ø Funding disruptions can occur because of actual or perceived threats to Fintech lenders’
performance, declines in the performance of platform-originated loans, weak macro environments, regulatory uncertainty, or competition from incumbents
Ø Given that the Federal Reserve is eventually expected to increase interest rates further, it is likely that we have moved away from the peak of the credit cycle toward an environment of tighter monetary policy and therefore, tighter margins. This scenario will negatively affect Fintechs.
TailwindsThat Fintechs have introduced innovative new approaches and tools for the financial-services industry is the prime reason incumbents seek to understand and emulate Fintechs in certain respects. What follows is an examination of the accomplishments of Fintech and a discussion concerning how traditional equipment finance companies can learn and benefit from them.
Category
Average of all Industries in Sector As a percentage of
2016 Revenue
Fintech Industry As a percentage of
2016 Revenue
Difference
Profit 12.6 8.6 -4 Wages 22.4 16 -6.4 Purchases 21.1 4.5 -16.6 Depreciation 1.7 5.5 3.8 Marketing 1.9 27.9 26 Rent and Utilities 3.5 10.1 6.6 Other 36.8 27.4 -9.4

EQUIPMENT LEASING & FINANCE FOUNDATION • 27
HEADWINDS, UNDERCURRENTS, and TAILWINDSFintech lenders market their services through search engines, online and offline campaigns, public relations events, and tradeshows. Marketing expenses represented 27.9% of revenue in 2016. Rental and utility expenses represented 10.1% of total industry revenue for the year, and other expenses included general administrative costs, data processing, and telecommunications fees. Information on the cost structure of Fintech non-lenders is not readily available.
Stability of the Fintech Business Model
During normal and expanding economic periods, the Fintech business model works effectively. To analyze the stability of the model during a full economic cycle, however, we must rely on certain assumptions, such as these:
Fintech lenders face the same funding constraints as traditional lenders during times of uncertainty
Funding disruptions can occur because of actual or perceived threats to Fintech lenders’ performance, declines in the performance of platform-originated loans, weak macro environments, regulatory uncertainty, or competition from incumbents
Given that the Federal Reserve is eventually expected to increase interest rates further, it is likely that we have moved away from the peak of the credit cycle toward an environment of tighter monetary policy and therefore, tighter margins. This scenario will negatively affect Fintechs.
TailwindsThat Fintechs have introduced innovative new approaches and tools for the financial-services industry is the prime reason incumbents seek to understand and emulate Fintechs in certain respects. What follows is an examination of the accomplishments of Fintech and a discussion concerning how traditional equipment finance companies can learn and benefit from them.
Fintechs Solve Problems
The 2008-2009 financial crisis deepened the funding gap for small businesses and resulted in a liquidity crisis. Since then, banks have been reluctant or unable to lend to small businesses due to regulatory requirements and restrictions, and prohibitive costs. Traditional non-bank lenders have closed a portion of this gap, but not before Fintech lenders entered the market to fill other portions, such as the unbankable. But while Fintechs have developed their own processes and assess risks very quickly, there is little if any evidence that they have the tools and positioning to penetrate equipment finance markets serving middle-ticket and large-ticket customers.
That said, certain types of Fintechs, such as MPLs, are willing to provide many products and services that traditional banking institutions avoid. MPLs have the opportunity to directly benefit small businesses by offering them credit and improving the origination process. MPL strengths also include ease of use by small businesses and quick decisioning. Innovative Fintech applications collect data and employ proprietary algorithms to assess applicants’ credit-worthiness much faster than applicants typically experience at banks.
Jagtiani and Lemieux (2017) recently assessed the performance of loans originated at Lending Club. Among other findings, they reported that:
• Fintech lenders give loans to those left behind by traditional lenders
• Fintech lenders fill credit gaps in areas where banks may be less available and provide credit to certain borrowers that banks may not be serving
• Fintechs offer overall better customer experience to borrowers.
As we know, however, the business models of bank and non-bank equipment finance companies do not pursue every business owner who wants a lease or a loan. Nor is “better customer experience” always a replacement for financial factors, such as lower interest rates, variable terms, and contracts customized to the borrower/lessee.

28 • EQUIPMENT LEASING & FINANCE FOUNDATION
HEADWINDS, UNDERCURRENTS, and TAILWINDSLearning from Fintech Innovation in Small-Business Loans
Analyzing the Small-Business-Loan market provides insight into the ways Fintech companies attract and serve commercial customers. It also reveals methods that might be adopted by and used in the traditional equipment finance market. First, we provide information about the size and scope of this market.
The U.S. Small Business Administration (SBA) estimates that 29.6 million small businesses operated in the U.S. in 2014, the most recent year for which such information is available. For the fourth quarter of 2014, the FDIC reported $180 billion in business-loan originations under $250,000, made across 22.1 million loans. Yet, the global management consulting firm Oliver Wyman estimates the potential for another $80 billion to $120 billion in unmet demand for small-business lines of credit. Information from PayNet, Inc. suggests additional unmet small-business demand for other credit-related products, including term loans. PayNet analysis of credit facilities up to $250,000 shows an estimated $481 billion in outstanding loans and leases as of mid-2017, which equates to more than 33 million financial contracts across commercial banks, commercial finance companies, and alternative lenders.
Given that the SBA estimates other sources of capital such as mezzanine and buyout, angel capital and venture capital as composing approximately 13% of total small-business financing in recent years, PayNet estimates the current total small-business financing market at was approximately $1.1 trillion as of mid-2017.
But lending to small businesses is expensive. Traditional corporate credit-underwriting requires 28 separate tasks to arrive at a decision, the tasks ranging from collecting and reviewing financial information to data entry to evaluation of borrower capability, capacity and collateral. A time series analysis of these steps reveals a 2-3-week process, typically, and in some cases, up to 8 weeks elapse before arriving at a single credit decision. Costing out the process reveals a $4,000-$6,000 investment for underwriting each credit application. Thus, large banks are unable to turn a profit on business loans below $500,000.
Community banks, known for their high-touch business model that operates in local markets, might have done more to fill the credit gap in the wake of the 2008-2009 Recession, had they not themselves experienced so much change. The number of community banks has shrunk by more than a third since 2007, and anecdotal information suggests that community banks are also now focusing on loans with a minimum value of $500,000 or more because smaller-balance loans are not profitable for these institutions, neither.
Fintech companies use software, data, and analytics to deliver credit faster and with far less paperwork than do traditional equipment finance companies. Fintech lenders are also free from the federal reporting requirements of banks, which makes it difficult to accurately assess the volume of their lending activities or the quality of their originations. Nonetheless, PayNet estimates the size of the current Fintech small-business-lending market at $5 billion to $7 billion of small-business loans. Although one projection of Fintechs’ share growth in small-business originations is that this will reach $50 billion by 2020, Morgan Stanley estimates that the size of global marketplace lending can reach $290 billion by 2020, with most of this growth occurring in the U.S. and China.
Fintech lenders claim that their business models can more effectively meet the loan needs of small businesses generally than the business models of traditional lenders. But evidence shows that thus far, Fintechs are still largely serving the financial needs of unbankable small businesses. PayNet analyzed the portfolios of MPLs to determine the absolute level of credit risk and to determine differentiation by lender type. They found the following:
In 2016, 84% of Fintech lenders’ portfolio quality stood at a score of 640 or higher. In comparison, 96% of banks’ portfolio is at the same credit quality
Overall credit quality has improved slightly for Fintech lenders, from 663 in 2009 to 669 in 2016
Credit migration shows that in 2009, 25% of Fintech lenders’ portfolios stood at 680 or higher. By 2016, the portion of higher-quality borrowers had increased to 38%.

EQUIPMENT LEASING & FINANCE FOUNDATION • 29
HEADWINDS, UNDERCURRENTS, and TAILWINDSAverage facility size for Fintech lenders totals approximately $65,000
Average transaction term of a Fintech loan is approximately 15 months in length
Fintech loans with terms in excess of 18 months or longer totaled 34% of originations in 2016, a marked increase from 0% in 2009
Fintech loans are used by small businesses in retail, healthcare, accommodation, food, construction, professional services, wholesale, transportation, administration, manufacturing, and other industries.
PayNet also studied the credit quality of Fintech borrowers from January 1, 2015 to July 1, 2017 and found that of 100% of borrowers in 2015,
69% migrated to a higher credit quality
24% migrated to a lower credit quality
7% were unchanged.
Many small businesses apply for loans of less than $250,000. Although small banks report a higher approval rate for small-business loans than do large banks, at 76% approval versus 58% approval, small businesses are still underserved by banks.
The FDIC’s Small Business Credit Survey shows that among companies applying for credit from Fintech lenders, micro-businesses were more likely to be approved than small or mid-size firms. Credit applications for loans in the amount of $25,000 or less were also more likely to be approved by regional or community banks.
The Survey also found that:
• Relationships with lenders are important to small-business borrowers
• Interest rates and the ease of the application process are also important
• Only 40% of all Survey participants received the full amount they applied for
• 24% did not receive any funding
• Auto and equipment loans had the highest approval rates at 79%. However, while 92 % of the loans in excess of $1million were approved, only 71% of those under $1 million were approved
• Lack of transparency was cited as the main reason for client dissatisfaction, followed by long wait-times for decision-making and difficulty of the application process
• Applicants were dissatisfied with Fintech lenders’ high interest rates and lack of transparency
• Applicants were less dissatisfied with Fintech lenders due to long wait times or difficult application processes than they were with banks.

30 • EQUIPMENT LEASING & FINANCE FOUNDATION
HEADWINDS, UNDERCURRENTS, and TAILWINDSOne of the most important criteria that small businesses participating in the FDIC survey considered when choosing a lender was an existing relationship. Here, incumbents have a clear advantage over Fintechs. Figure 15 shows that in the Survey, large banks received the lion’s share of small-business loan applications. But Fintech lenders also received a significant share, at 21%.
Figure 15. Sources of Small-Business Loans/Lines of Credit
Source: FDIC Small Business Credit Survey, 2016
Figure 16 reveals the extent to which the small-business owner’s relationship with the lender was considered the most important criteria when choosing a source of funding.
Figure 16. Factors Influencing Lender Choice
Source: FDIC Small Business Credit Survey, 2016
Figure 15. Sources of Small-Business Loans/Lines of Credit
Source Application rate
Large bank 50% Small bank 46% Credit union 11% Fintech 21% CDFI (Community Development Financial Institution) 6%
Other source 20% Source: FDIC Small Business Credit Survey, 2016
Figure 16 reveals the extent to which the small-business owner’s relationship with the lender was considered the most important criteria when choosing a source of funding.
Figure 16. Factors Influencing Lender Choice
Factor All Firms By Annual Revenues
Weighted Percent $1M or less More than $1M Existing relationship with lender
69% 66% 75%
Referral 3% 3% 3% Cost (interest rate) 39% 40% 38% Flexibility of product(s) 23% 22% 24% Speed of decision 30% 32% 24% Ease of application 33% 34% 31% Chance of being funded 29% 33% 20% Other 3% 3% 3%
Source: FDIC Small Business Credit Survey, 2016
Figure 17 shows the breakdown of approval rates. Even for loans of more than $1 million, just over half of small-business applicants received full funding.

EQUIPMENT LEASING & FINANCE FOUNDATION • 31
HEADWINDS, UNDERCURRENTS, and TAILWINDS Figure 17 shows the breakdown of approval rates. Even for loans of more than $1 million, just over half of small-business applicants received full funding.
Figure 17. Loan Application Approval Rates
Source: FDIC Small Business Credit Survey, 2016
Figure 18 reveals that loans for automobiles and equipment composed the largest type of financing for small businesses.
Figure 18. Loan Approval Rates by Loan Type
Source: FDIC Small Business Credit Survey, 2016
Figure 17. Loan Application Approval Rates
Financing success All Firms By Annual Revenues
Weighted Percent
$1M or less More than $1M
Overall approval rate (% receiving at least some financing)
76% 71% 86%
Share receiving the full amount requested
40% 33% 55%
Source: FDIC Small Business Credit Survey, 2016
Figure 18 reveals that loans for automobiles and equipment composed the largest type of financing for small businesses.
Figure 18. Loan Approval Rates by Loan Type
Type of loan/line credit All Firms By Annual Revenues
Weighted Percent
$1M or less More than $1M
SBA loan/line of credit 55% 50% 64% Business loan 58% 51% 74% Line of credit 68% 58% 82% Auto or equipment loan 79% 71% 92% Cash advance 72% 74% 81% Other type of loan or line of credit 68% 63% 80%
Source of loan/line credit
Large bank 54% 45% 72% Small bank 67% 60% 78% Credit union 46% 43% 63% Online lender 62% 59% 84% CDFI 77% 77% Other source 75% 71% 86%

32 • EQUIPMENT LEASING & FINANCE FOUNDATION
HEADWINDS, UNDERCURRENTS, and TAILWINDSFigure 19. Satisfaction Rates by Lender Type
Source: FDIC Small Business Survey, 2016
Lender Satisfaction: Net percent satisfied, approved
applicants
All Firms By Annual Revenues
Weighted Percent $1M or less More than $1M
Large bank 47% 37% 56% Small bank 75% 69% 82% Online lender 26% 21% 40% CDFI 77% 77% Credit union 75% 72% Other lender 58% 53% 66%
Reasons for Dissatisfaction with Lender
High interest rate 11% 12% 10% Unfavorable repayment terms 9% 8% 11% Difficult application process 41% 41% 43% Long wait for credit decision 42% 39% 48% Lack of transparency 48% 49% 46% Other 37% 37% 37% Financing shortfalls
Share receiving less than the amount requested
60% 67% 45%
Reasons for receiving less than the amount requested Low credit score 29% 34% 15% Insufficient credit history 28% 32% 12% Insufficient collateral 31% 30% 31% Too much debt already 28% 29% 28% Weak business performance 31% 31% 32% Unfair lending practices 6% 6% 5% Other 13% 11% 19% Unsure 13% 12% 17%

EQUIPMENT LEASING & FINANCE FOUNDATION • 33
HEADWINDS, UNDERCURRENTS, and TAILWINDSMorgan Stanley forecasts that Fintech lenders will own 16 % of the total U.S. small-business loan market by 2020. Of this, Morgan Stanley estimates that 13.7 % of the market share is likely to be a result of credit expansion, while the remaining portion is likely to be share redistribution from incumbents.
It is clear that Fintechs have not fully realized the potential they held several years ago when equity analysts predicted that Fintech would replace banks as a primary source of credit to consumers and small businesses. Yet, Fintech companies have provided three critical benefits to the supply of credit available to small businesses. First, they have devised technology platforms to lower the cost of a credit application. Second, they have changed expectations among small businesses for access to working capital credit, which traditional sources cannot afford to offer at a reasonable cost. Third, they are filling the credit gap faced by small businesses across the credit spectrum and industry sectors.
Corporate Strategies
In a 2015 report published by The Economist’s Intelligence Unit, more than 100 senior bankers and 100 Fintech executives were interviewed to predict the future of the banking industry over the next five years. When bankers were asked how Fintech might disrupt the banking industry, more than 90% said they believed that Fintechs will have a significant impact on the future of banking, with more than a third believing that Fintechs will gain a share equal to that of incumbents or even larger.
When asked about banking industry’s response to the Fintech challenge, most bankers (54%) said they believed that banks are either ignoring the challenge or that they “talk about disruption, but are not making changes.”
Clearly, the situation is changing. But how should equipment finance incumbents that have not yet responded to the Fintech phenomenon do so? If incumbents wish to adopt certain Fintech approaches and processes, what are the best strategies for achieving this goal? We believe incumbents that take advantage of technological advances and invest in them as a part of their corporate strategies for growth will be best positioned to face ongoing marketplace change. These incumbents will gain market share through more efficient and more customer-oriented approaches, equipped with new business models that serve a changing customer base and changing customer demands.
Before discussing suggested strategies for incumbents in detail, however, we believe it would be instructive to provide a few notable examples of existing investments in, acquisitions of, or partnerships with Fintech companies.
Notable Examples
Amazon
Jeff Bezos, the Founder and CEO of Amazon.com, expressed his long-term and forward-looking strategy in a letter sent to shareholders before Amazon’s IPO in 1997. An excerpt from the letter follows:
“We will continue to make investment decisions in light of long-term market leadership considerations rather than short-term profitability considerations or short-term Wall Street reactions… We will make bold rather than timid investment decisions where we see a sufficient probability of gaining mar-ket leadership advantages. Some of these investments will pay off, others will not, and we will have learned another valuable lesson in either case.”
Amazon’s long-term views and strategies have made the company one of the most successful in the world. Following those strategies, Amazon now uses Machine-Learning for small-business lending. Since the launch of its small-business lending program in 2012, the company has issued more than $3 billion in loans to more than 20,000 businesses. Through Amazon Lending, businesses can apply for loans of from $1,000 to $750,000.

34 • EQUIPMENT LEASING & FINANCE FOUNDATION
HEADWINDS, UNDERCURRENTS, and TAILWINDS“Invited sellers receive a pre-populated invite through their Amazon Seller Account,” an Amazon spokesman told Bank Innovation newsletter in June 2017. “Sellers give us a few pieces of information and the loan is extended same-day or next day in most cases,” the spokesman added. Amazon Lending was created to help small businesses expand inventory and operations and is currently available in the U.S., U.K., and Japan. While the obvious benefit of the business is that it generates interest income for Amazon, the effects of the lending operation go deeper—they could help Amazon to be even more competitive in the highly-competitive e-commerce arena. Google parent company Alphabet has had a banking license in Europe since 2007. Could it be viewed as a threat to incumbent lenders or even to new Fintech lenders?
Amazon launched its business-to-business marketplace by providing businesses with the same shopping service the company offers consumers, connecting them with sellers of specialized office supplies, healthcare products, industrial equipment, and IT equipment. Amazon says membership in the marketplace will come with several benefits including exclusive pricing and large discounts.
Another example of Amazon market disruption is the company’s partnership with several large auto parts suppliers in the U.S., which enables these suppliers to sell their products on Amazon’s platform. The move may result in more push from Amazon towards the automobile business since in 2016, the company started Amazon Vehicles, an online platform for researching cars, auto parts, and accessories. Amazon’s expansion into auto parts and auto research establishes it as a go-to place for automobile-related shopping. To us, it would not be surprising to see Amazon become directly involved in auto sales or auto loans in the future. Walmart recently launched its own online auto-sales platform, called CarSaver).
Square
Square is a payment-services provider enabling credit-card payments that can be integrated with existing websites or popular e-commerce platforms. Like Amazon, Square serves a large market of small businesses and sits on a mountain of information that includes real-time data about sales and cash flow—data that traditional lenders would not have unless they were plugged into those small businesses as enablers of point-of-sale transactions, both in person and online. With access to this treasure trove of data, it makes sense for Square to provide lending.
The company announced in February 2017 that Square Capital had facilitated 40,000 business loans for a total of $248 million in the fourth quarter of 2016. This was done while holding the company’s default rate at 4%. “Square Capital’s biggest competitive advantage is that they have practically no acquisition cost for their borrowers,” said deBanked magazine in a February 22, 2017 post on its website. The company’s payments customers, who could conceivably be converted to borrowers, processed around $50 billion in transactions in 2016.
Square did report a net loss of $171.6 million across 2016, however, most of which originated in the first quarter. The net loss for the fourth quarter of 2016 was just $15 million. Thus, Amazon and Square seem uniquely positioned to pose much more of a threat to incumbents than start-up Fintechs.
Experian and Orchard Platform
These two companies recently announced a strategic collaboration designed to give institutional investors access to Experian’s consumer credit data. The collaboration enables Orchard’s clients to use credit data for the ongoing monitoring of borrower credit-worthiness for loans in existing portfolios. Additionally, Experian will provide access to historical data for credit modeling, analytics, and reporting.

EQUIPMENT LEASING & FINANCE FOUNDATION • 35
HEADWINDS, UNDERCURRENTS, and TAILWINDS
Other Corporate Investments in FintechCorporate-affiliated investors have been actively participating in venture financings worldwide, and Fintech is no exception. Corporate VC arms of many financial institutions or even non-financial companies are investing in fast-growing Fintech companies with innovative and disruptive technologies.
Figure 20 shows the last seven years of investments in Fintech by corporate-affiliated investors. As can be seen from the results, more and more deals in Fintech financing are done by corporates—an indication that many incumbents are already adopting strategies to invest in Fintechs, thereby reducing the risk of losing market share to them.
Figure 20. Global Venture Activity in Fintech with Corporate Venture Participation
Source: KPMG International
2017 post on its website. The company’s payments customers, who could conceivably be converted to borrowers, processed around $50 billion in transactions in 2016.
Square did report a net loss of $171.6 million across 2016, however, most of which originated in the first quarter. The net loss for the fourth quarter of 2016 was just $15 million. Thus, Amazon and Square seem uniquely positioned to pose much more of a threat to incumbents than start-up Fintechs.
ExperianandOrchardPlatformThese two companies recently announced a strategic collaboration designed to give institutional investors access to Experian’s consumer credit data. The collaboration enables Orchard’s clients to use credit data for the ongoing monitoring of borrower credit-worthiness for loans in existing portfolios. Additionally, Experian will provide access to historical data for credit modeling, analytics, and reporting.
OtherCorporateInvestmentsinFintechCorporate-affiliated investors have been actively participating in venture financings worldwide, and Fintech is no exception. Corporate VC arms of many financial institutions or even non-financial companies are investing in fast-growing Fintech companies with innovative and disruptive technologies.
Figure 20 shows the last seven years of investments in Fintech by corporate-affiliated investors. As can be seen from the results, more and more deals in Fintech financing are done by corporates—an indication that many incumbents are already adopting strategies to invest in Fintechs, thereby reducing the risk of losing market share to them.
As the venture-capital segments of financial and non-financial companies invest in Fintech, more and more deals in the sector are being done by corporates, an indication that incumbents are already adopting strategies to invest in Fintech and thereby reduce or eliminate the risk of losing market share to them. Figure 21 shows Fintech investments by the top 10 U.S. banks.
Figure 20. Global Venture Activity in Fintech with Corporate Venture Participation
Year 2010 2011 2012 2013 2014 2015 2016 2017 (Q2)
Amount Invested (in USD Billions)
$0.1 $0.3 $0.6 $0.7 $2.1 $7.2 $9.0 $2.6
Percentage of total deal count
9% 9% 9% 11% 12% 15% 17% 21%

36 • EQUIPMENT LEASING & FINANCE FOUNDATION
HEADWINDS, UNDERCURRENTS, and TAILWINDSAs the venture-capital segments of financial and non-financial companies invest in Fintech, more and more deals in the sector are being done by corporates, an indication that incumbents are already adopting strategies to invest in Fintech and thereby reduce or eliminate the risk of losing market share to them. Figure 21 shows Fintech investments by the top 10 U.S. banks.
Figure 21. Unique Fintech Investments by Large U.S. Banks
Source: CB Insights
Figure 21. Unique Fintech Investments by Large U.S. Banks
Source: CB Insights
SuggestedStrategiesforEquipmentFinanceIncumbentsFintechs may take a small portion of business from traditional equipment finance companies, but more importantly, they create new opportunities for incumbents to differentiate themselves, become more competitive, and develop new markets of their own. Incumbents can learn much from Fintech business models and Fintech companies’ use of technology. The key is deciding how best to proceed to choose and adopt Fintech strategies and technology that will enhance

EQUIPMENT LEASING & FINANCE FOUNDATION • 37
HEADWINDS, UNDERCURRENTS, and TAILWINDSSuggested Strategies for Equipment Finance IncumbentsFintechs may take a small portion of business from traditional equipment finance companies, but more importantly, they create new opportunities for incumbents to differentiate themselves, become more competitive, and develop new markets of their own. Incumbents can learn much from Fintech business models and Fintech companies’ use of technology. The key is deciding how best to proceed to choose and adopt Fintech strategies and technology that will enhance incumbents’ efficiencies, improve their customer experiences, and bolster their competitiveness in the changing market.
Following is a list of suggested strategies, along with pros and cons of each. Examples of incumbents already implementing these strategies are included when applicable.
Strategy 1: Invest in One or More Fintech Companies. Certain banks and non-banks already invest in Fintechs in a variety of ways, from contributing venture capital to participating in partnerships that function as strategic investment arms. Investment in Fintech companies has its pros and cons:
PROS:
• Fast acquisition and indirect adoption of new marketing and loan-processing technologies
• Access to innovative talent
• Access to new or under-served markets.
CONS:
• Finding a Fintech that can fill an incumbent’s particular need(s) for the right price may be difficult
• Issues surrounding data use and protection, privacy, and cybersecurity must be articulated and dealt with. Banks must deal with these issues in ways that comply with regulations
• By virtue of partial bank ownership, the activities of a Fintech company could become subject to the acquiring bank’s regulatory requirements, thus altering the Fintech’s historical activities.
Strategy 2: Partner with a Fintech. Strategic partnerships are among the most promising methods for incumbents to work with Fintechs to strengthen and improve incumbent business models and keep or increase market share. Likely goals for incumbents would be to share in the use of selected Fintech technologies for speedier online application, credit-decisioning, underwriting, and servicing of loans and leases.
Partnerships between Fintechs and incumbents are already becoming more important for both types of companies as collaborative synergies are identified. Fintechs, for example, need to scale their operations but do not have the customer-acquisition mechanisms of banks or some non-banks. Incumbents have customer-acquisition mechanisms but do not have the technological knowledge and prowess of Fintechs. As the Fintech sector continues to mature, Fintech companies will likely enter a period of consolidation, presenting acquisition opportunities for incumbents, as well as for rival Fintechs and other companies aspiring to enter or grow their business in the financial-services industry.
Banks already in various types of partnerships with Fintechs include JP Morgan Chase, which uses OnDeck’s marketplace platforms, and Fidelity, which partners with emerging Fintech companies through incubators and accelerators. Santander uses venture funds to take minority interests in emerging tech companies, and Citibank invited Fintech companies into its business circle by setting up an API development hub for its mobile banking app, attracting more than 1,400 developers to sign up within weeks. Another example is Fundation, which originates solely through partnerships with regional and super-regional banks, such as Citizens Bank.
A 2017 report by PricewaterhouseCoopers says that eight of 10 financial companies see themselves making partnerships with Fintech companies in the next few years. These partnerships probably vary widely, depending on the needs and goals of each company.

38 • EQUIPMENT LEASING & FINANCE FOUNDATION
HEADWINDS, UNDERCURRENTS, and TAILWINDSPROS:
• Customer acquisition or retention via reasonable amount of investment
• Savings on technology development costs
• Access to innovative talent
• Involvement in or having a say in some innovations
• Ability to freshen product offerings periodically.
CONS:
• Difficulty finding competent and compatible partners
• Trust issues with data, security, and privacy
• Potential culture clashes
• Limited control of partner and technology.
Strategy 3: Develop Fintech Technologies. While most incumbents have plans for dealing with Fintech competition, some also have strategies for internal innovation and are accelerating their development of Fintech technologies. Three examples follow.
Live Oak Bank, headquartered in Wilmington, North Carolina, already operates much like a Fintech. This national financial institution brings Silicon-Valley thinking into the bank environment by strategizing as a technology company that engages in financing. In fact, the popular Salesforce.com-based nCino origination platform now gaining market share in the commercial-lending space originated at Live Oak bank and was spun off into a technology company. Live Oak applies newer technology to small-business lending and in 2017 ranked as the number-two SBA lender behind Wells Fargo. The bank has also recently begun financing equipment and continues to innovate, using its own talented technology-development team.
Quick Bridge Funding, an independent, privately held finance company in Irvine, California is another example of an incumbent employing state-of-the-art technology in its operations. Machine-learning, unique APIs and alternative data sources are employed in the company’s origination process.
CIT Group, Inc., a New York City-based bank holding company, employs data science in its credit-scoring. The company is looking at its small-business user experience to serve its vendor partners and deliver a frictionless POS (point-of-sale) experience online. CIT expects to use APIs to deliver a POS leasing experience in less than 30 minutes.
PROS
• Full ownership of products
• Add-on integration with existing systems
• Better control of technology and resources.
CONS
• Potential challenges solving compatibility and integration issues with internal structures and legacy systems
• Difficulties finding and attracting talent
• Lack of experience developing new technologies.

EQUIPMENT LEASING & FINANCE FOUNDATION • 39
HEADWINDS, UNDERCURRENTS, and TAILWINDSStrategy 4: Merge with or Acquire a Fintech Company. Acquiring or merging with a Fintech company can greatly increase an incumbent’s digital presence. Such acquisitions are becoming common for large financial companies. In 2016, 51 Fintech startups were acquired or had IPOs valued at $1.1 billion within the financial-services sector. PricewaterhouseCoopers reported in 2015 that 50% of financial-services firms around the globe expressed interest in acquiring one or more Fintechs within three to five years. But this isn’t news to Fintechs, because, according to PricewaterhouseCoopers, 95% of Fintech companies believe that they will be acquired or will receive an investment from a larger financial company in the next one to two years.
PROS
• Customer acquisition or retention via reasonable amount of investment
• Full ownership of products
• Enhanced market/product differentiation
• Access to innovative talent that extends beyond traditional equipment finance technology capability
• Access to innovative technologies that increase efficiency, improve customer service, and potentially create new products and services.
CONS
• Finding compatible companies at affordable prices may be difficult and competitive
• Compatibility and integration with incumbent’s internal structures and legacy systems could be elusive
• Potential for culture clash.
Strategy 5: Create Joint Fintech Programs with Other Incumbents. Some of the largest banks in the U.S. joined efforts to create the ClearXchange network a few years ago to receive payments by phone or email. The network, which is now known as “Zelle,” has grown to include smaller banks or credit unions, and allows businesses and individuals to transfer funds from their bank accounts to the bank account of another, using a mobile device. Zelle is just one example of incumbents combining forces to join the Fintech movement.
PROS
• Relatively low-cost investment
• Opportunity to share data, talent and other resources.
CONS
• Limited branding opportunities (as these are shared with other incumbents)
• Potential culture clashes
• Partial rather than full ownership of the technology company under consideration.

40 • EQUIPMENT LEASING & FINANCE FOUNDATION
HEADWINDS, UNDERCURRENTS, and TAILWINDSConclusionFintech companies leverage technology to offer financial products and services to businesses and consumers in ways that most traditional equipment finance companies do not. The online nature of these businesses also lowers costs for Fintechs, although customer-acquisition costs are still higher for Fintechs than for industry incumbents. As of early 2018, Fintech lenders had gained a small portion of the small-business-loan market, but Fintech-driven disruption of the overall equipment finance industry is not likely. More likely is the possibility that Fintech technology platforms will continue to disrupt traditional financing processes and change the competitive landscape to one in which hybrid companies that combine select Fintech tools and technologies with select personal services compete against companies using other methods to remain viable.
Should Fintech lenders continue to siphon market share in equipment finance, incumbents could respond by cutting costs, improving service quality, revamping processes, and adopting some Fintech technologies on their own. We believe, however, that incumbents have much to gain from carefully considering all the strategies listed in this report and opening themselves to the possibilities that could result from one or more investments or partnerships. There is a real opportunity for both Fintechs and traditional equipment finance companies to increase the penetration of lease financing of equipment purchases away from cash, working capital, and credit cards, using Fintech tools and access provided by Fintech companies.
We also believe that the demographic user shift to online/mobile purchasing, integrated with offerings for financing, can facilitate such increased penetration. The shift speaks to the need for traditional players to employ these technologies to retain and grow their customer finance base.
Equipment finance companies that act in a timely manner and take appropriate steps to disrupt themselves by putting into place strategies to explore and adopt new technologies and processes will be well-positioned, not only to retain their current business share but to gain market share and new markets in the future.

EQUIPMENT LEASING & FINANCE FOUNDATION • 41
HEADWINDS, UNDERCURRENTS, and TAILWINDSAppendices
Appendix 1. Supplemental Fintech Investment Information
Figure 8A. Fintech P/E activity in the U.S.
Source: KPMG International
Figure 8A shows that private equity investment in Fintech has steadily increased in the last four quarters to go above $3 billion as of Q2 of 2017. Figure 8B shows that venture capital activity has increased since it took a dive in 3Q of 2016.
Figure 8B. Fintech venture capital activity in the US with corporate venture participation
Source: KPMG International
Appendices
Appendix1.SupplementalFintechInvestmentInformation
Figure 8A. Fintech P/E activity in the U.S.
Source: KPMG International
Corporations have been showing interest in Fintech firms, by investing in them. As Figure 7 shows, corporate-affiliated investors have been increasing their participation in venture financings of Fintech in the US. Corporate Venture Capital groups are joining in the Fintech revolution to strategically gain exposure to the fast-growing Fintechs.
We will discuss corporate investment in Fintech in more detail in the section on Corporate Strategies.
Figure 8B. Fintech venture capital activity in the US with corporate venture participation
Source: KPMG International

42 • EQUIPMENT LEASING & FINANCE FOUNDATION
HEADWINDS, UNDERCURRENTS, and TAILWINDSAppendix 2. Supplemental Information on Fintech Disruption of the Equipment Leasing and Finance Industry
In 2015, total public and private investment in equipment and software totaled $1.5 trillion, of which 68% or $1.02 trillion was financed, according to an estimate based on data from IHS and the U.S. Department of Commerce Bureau of Economic Analysis. Of the 68% of equipment that was financed in 2015, 39% was leased, 16% used a secured loan and 13% used a line of credit. Banks, Captives, and Independent lessors financed only about $270 billion of all equipment purchases. By the estimates of U.S. Equipment Finance Market Study: 2016-2017, the total investment in equipment and software is expected to grow to $1.8 trillion by 2020, of which about $1.2 trillion is expected to be financed. Given the (relatively low) rate of financing by Banks, Captives, and Independents, this provides opportunities to new (Fintech) entrants to penetrate this market and capture market share by providing financing to the underserved market.
In this section, we will study the potential of Fintechs to enter the equipment loan market by either serving the underserved market or by gaining market share by refinancing existing equipment loans.
How Big is the Total Addressable Market (TAM) in Equipment Loans?
In this subsection, we address the question if and to what extent is the equipment-finance market is susceptible to Fintech disruption. Our criteria for existing or future equipment loans, to be susceptible to refinancing (by Fintechs or other incumbents), is as follows.
To estimate the size of the TAM for equipment loans and leases, we apply the following screen:
a. We take all data by lender type and deduct the delinquent balances, to arrive at balances of loans per type that are current
b. We deduct the balances of all super prime (SP) and deep subprime (DS) loans, by using PayNet Credit Quality to identify the SP and DS loans
c. We deduct the balances of all loans that have 24 months or less remaining terms or less than 6 months of seasoning
d. We consider only those loans that carry 4% or higher pre-tax yield spread
e. We apply another 10% reduction to account for borrower inactivity-to-act even if their interest rates or payments can be reduced (Burnout-type factor).
Which equipment types are susceptible to tech-disruption? Using PayNet data (as of August 2017), we estimate the average remaining terms and average seasoning per equipment type and proportion of loans per equipment type that are possibly susceptible to disruption (refinancing, in this case). Figure 22 summarizes the findings.

EQUIPMENT LEASING & FINANCE FOUNDATION • 43
HEADWINDS, UNDERCURRENTS, and TAILWINDSFigure 22. PayNet Data as of August 2017
Data on Credit Quality (PayNet proprietary scoring) was used to divide the loans, for every equipment type, into quantiles. The highest and lowest credit quality quantiles were eliminated to arrive at the variable called “Percent Susceptible to Refinancing.”
Source: PayNet, Inc.
Using the PayNet data and applying the screens below, we see that, on average, 65.4% of the loans at PayNet satisfy the screen.
• Average seasoning of 6+ months
• Average remaining terms of 24+ months
• Average credit score that is “not extremely low” (deep subprime) or “not extremely high” (super prime).
We would like to have more detailed data on the pre-tax yield spreads and delinquency information per equipment type to screen further for loans that are susceptible to refinancing, based on our criteria (pre-tax yield spread of 4% or more, and not-delinquent, in addition to the seasoning, remaining term, and credit quality criteria above), to better estimate the susceptibility to disruption. However, due to lack of data on pre-tax yields or yield spreads per equipment type, we base our estimates on the information provided by the SEFA by Market Segment or Type of Financing Organization.
In order to better understand the data in terms of pre-tax yield spreads, we utilize data from the 2017 SEFA provided by the ELFA. Figure 23 provides information on the pre-tax yield spreads for equipment loans by Market Segment and by type of financing organization.
To have a clear picture of performance, we also include the Net Losses and 30+ days delinquencies for all three market segments and type of financing organizations.
Data on Credit Quality (PayNet proprietary scoring) was used to divide the loans, for every equipment type, into quantiles. The highest and lowest credit quality quantiles were eliminated to arrive at the variable called “Percent Susceptible to Refinancing.”
EQUIPMENT INDUSTRY Average Seasoning
(in months)
Average Remaining
Term (in months)
Industry Weights
Percent Susceptible to
Refinancing
Agriculture Industry 12.6 33.7 6.5% 43.4% Aircraft Industry 23.4 50.4 4.0% 78.5% Construction Industry 13.3 40.5 14.7% 64.2% IT / Computer Sector 11.3 39.3 5.2% 79.5% Energy ( Oil and Gas) 19.2 97.8 2.4% 82.6% Medical Equipment 15.4 42.6 4.7% 65.7% Industrial and Manufacturing Tech.
16.0 42.2 5.2% 60.3%
Office Equipment Industry 15.3 40.4 1.1% 64.2% Railroad Industry 24.6 61.4 1.1% 75.7% Trucking Industry 16.4 44.0 25.9% 65.2% Overall 14.4 40.9 100.0% 65.4%
Source: PayNet, Inc.
Using the PayNet data and applying the screens below, we see that, on average, 65.4% of the loans at PayNet satisfy the screen.
• Average seasoning of 6+ months• Average remaining terms of 24+ months• Average credit score that is “not extremely low” (deep subprime) or “not extremely high”
(super prime)
We would like to have more detailed data on the pre-tax yield spreads and delinquency information per equipment type to screen further for loans that are susceptible to refinancing, based on our criteria (pre-tax yield spread of 4% or more, and not-delinquent, in addition to the seasoning, remaining term, and credit quality criteria above), to better estimate the susceptibility to disruption. However, due to lack of data on pre-tax yields or yield spreads per equipment type, we base our estimates on the information provided by the SEFA by Market Segment or Type of Financing Organization.
In order to better understand the data in terms of pre-tax yield spreads, we utilize data from the 2017 SEFA provided by the ELFA. Figure 19 provides information on the pre-tax yield spreads for equipment loans by Market Segment and by type of financing organization.
To have a clear picture of performance, we also include the Net Losses and 30+ days delinquencies for all three market segments and type of financing organizations.
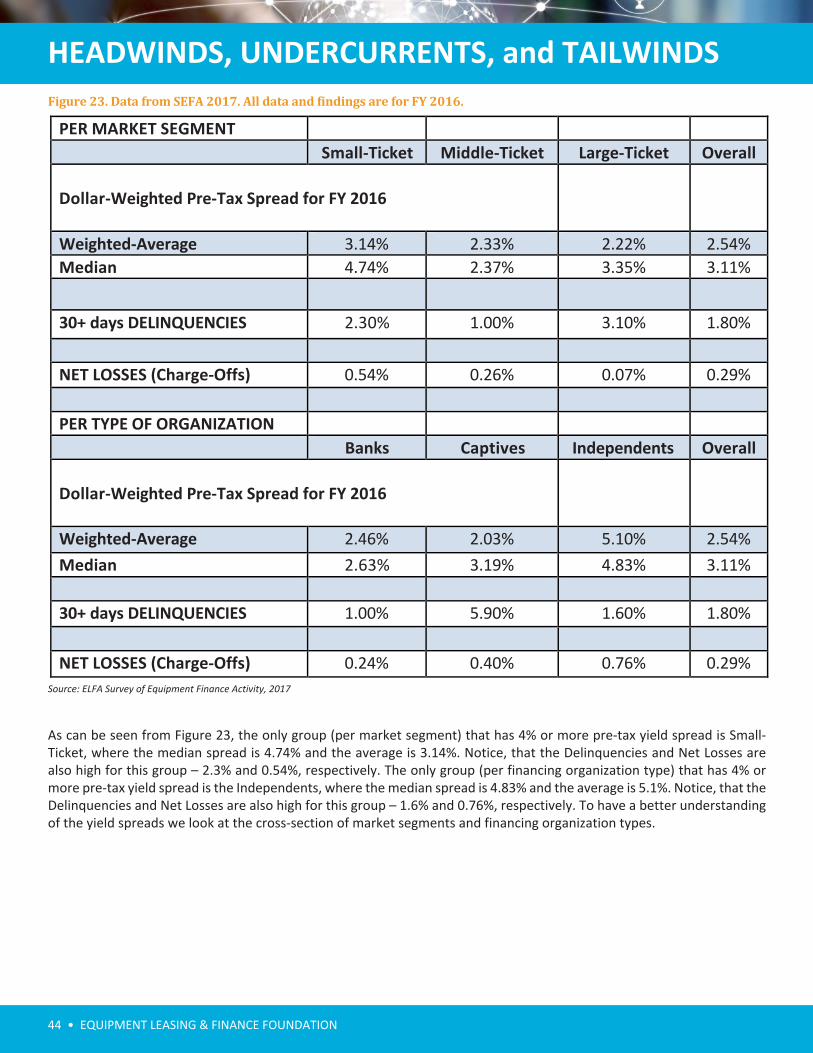
44 • EQUIPMENT LEASING & FINANCE FOUNDATION
HEADWINDS, UNDERCURRENTS, and TAILWINDSFigure 23. Data from SEFA 2017. All data and findings are for FY 2016.
Source: ELFA Survey of Equipment Finance Activity, 2017
As can be seen from Figure 23, the only group (per market segment) that has 4% or more pre-tax yield spread is Small-Ticket, where the median spread is 4.74% and the average is 3.14%. Notice, that the Delinquencies and Net Losses are also high for this group – 2.3% and 0.54%, respectively. The only group (per financing organization type) that has 4% or more pre-tax yield spread is the Independents, where the median spread is 4.83% and the average is 5.1%. Notice, that the Delinquencies and Net Losses are also high for this group – 1.6% and 0.76%, respectively. To have a better understanding of the yield spreads we look at the cross-section of market segments and financing organization types.
Figure 23. Data from SEFA 2017. All data and findings are for FY 2016.
PER MARKET SEGMENT Small-Ticket Middle-Ticket Large-Ticket Overall
Dollar-Weighted Pre-Tax Spread for FY 2016
Weighted-Average 3.14% 2.33% 2.22% 2.54% Median 4.74% 2.37% 3.35% 3.11%
30+ days DELINQUENCIES 2.30% 1.00% 3.10% 1.80%
NET LOSSES (Charge-Offs) 0.54% 0.26% 0.07% 0.29%
PER TYPE OF ORGANIZATION Banks Captives Independents Overall
Dollar-Weighted Pre-Tax Spread for FY 2016
Weighted-Average 2.46% 2.03% 5.10% 2.54% Median 2.63% 3.19% 4.83% 3.11%
30+ days DELINQUENCIES 1.00% 5.90% 1.60% 1.80%
NET LOSSES (Charge-Offs) 0.24% 0.40% 0.76% 0.29% Source: ELFA Survey of Equipment Finance Activity, 2017
As can be seen from Figure 23, the only group (per market segment) that has 4% or more pre-tax yield spread is Small-Ticket, where the median spread is 4.74% and the average is 3.14%. Notice, that the Delinquencies and Net Losses are also high for this group – 2.3% and 0.54%, respectively. The only group (per financing organization type) that has 4% or more pre-tax yield spread is the Independents, where the median spread is 4.83% and the average is 5.1%. Notice, that the Delinquencies and Net Losses are also high for this group – 1.6% and 0.76%, respectively. To have a better understanding of the yield spreads we look at the cross-section of market segments and financing organization types.

EQUIPMENT LEASING & FINANCE FOUNDATION • 45
HEADWINDS, UNDERCURRENTS, and TAILWINDSFigure 24. Data from SEFA 2017. All data and findings are for FY 2016.
Source: ELFA Survey of Equipment Finance Activity, 2017
As can be seen from Figure 24, the pre-tax yield spreads are highest for the Small-Ticket financed by Independents, at 5.72% on average. It can be seen from the Table that the Cost of Funds are highest for Small-Ticket and for Independents. The breakdown of the yield spreads, loan maturity, and loan volume by the size and organization type is in the table below.
Figure 24. Data from SEFA 2017. All data and findings are for FY 2016.
Small-Ticket Middle-Ticket Large-Ticket Overall
Dollar-Weighted-Average Pre-Tax Spread for FY 2016
Banks 3.66% 2.30% 1.90% 2.46%
Captives 1.51% 2.73% 2.73% 2.03% Independents 5.72% 2.22% 5.10% Overall 3.14% 2.33% 2.22% 2.56%
COST OF FUNDS Small-Ticket Middle-Ticket Large-Ticket Overall
Weighted-Average 1.87% 1.53% 1.48% 1.62% Median 2.37% 1.75% 1.70% 1.83%
Banks Captives Independents Overall Weighted-Average 1.46% 1.80% 2.86% 1.62% Median 1.54% 2.29% 3.65% 1.83%
Source: ELFA Survey of Equipment Finance Activity, 2017
As can be seen from Figure 24, the pre-tax yield spreads are highest for the Small-Ticket financed by Independents, at 5.72% on average. It can be seen from the Table that the Cost of Funds are highest for Small-Ticket and for Independents. The breakdown of the yield spreads, loan maturity, and loan volume by the size and organization type is in the table below.

46 • EQUIPMENT LEASING & FINANCE FOUNDATION
HEADWINDS, UNDERCURRENTS, and TAILWINDSFigure 25. Data from SEFA 2017. All data and findings are for FY 2016.
Source: ELFA Survey of Equipment Finance Activity, 2017
Figure 25 reveals that the only loans with an average 4% or more pre-tax yield spread are the ones under $25K and financed by Independents ($843 million); the ones that are under $250K and financed by Independents ($3,112 million), and the loans that are under $25K and financed by Banks ($3.315 million). Of these, the ones under $25K and financed by Independents have a weighted-average maturity of only 13.6 months; therefore we will not qualify them as susceptible to refinancing. Thus, the total susceptible to refinancing, based on the criteria on pre-tax yield spread and maturity, is $6.427 billion.
Applying the Credit Quality screen from PayNet (65.4%), we arrive at the amount of all new business that is susceptible to disruption through refinancing, $4.203 billion. This is only 3.8% of the total amount of new business origination in FY 2016.
Thus, using our estimates (based on subjective metrics that would determine the susceptibility of loans to refinancing by third parties, including Fintechs), we find that the existing equipment loan market is not very susceptible to disruption.
Now, we will discuss the possibility of the future Fintech-disruption of the equipment financing market by considering the Fintech penetration in the portion of the equipment sales that is not being financed, and by considering the possibility of Fintech penetration in the equipment financing market through the increasing of the overall size of the financing market by serving underserved markets.
It is estimated that about 43% of the $1.6 trillion equipment purchases, which is about a $688 billion, is financed by cash, credit cards, or lines of credit. While it seems to be a sizable market for penetration by Fintechs, and probably a part of it could potentially be tapped by Fintech lenders, it is difficult to apply our criteria or otherwise estimate the size of this market (cash, line of credit, etc.) that is susceptible to financing by Fintechs. There are many unknowns here, such as the
Figure 25. Data from SEFA 2017. All data and findings are for FY 2016.
Under $25,000
$25,000 to $250,000
$250,000 to $5,000,000
Over $5,000,000
Overall
Weighted-Average Maturity Banks 39.1 48.8 59 65.9 Captives 49.1 49.4 43.3 NA Independents 13.6 50.6 50.3 29.9 Dollar-Weighted-Average Pre-Tax Spread Banks 4.02% 3.20% 2.53% 1.90% 2.46% Captives 1.51% 1.51% 2.73% 2.73% 2.03% Independents 5.72% 5.14% 3.84% 2% 2% New Business Volume (in $millions)
Banks $3,315 $16,101 $30,936 $28,662 $79,015 Captives $3,055 $9,067 $8,384 $3,579 $24,085 Independents $843 $3,112 $2,012 $1,444 $7,411 Overall $7,213 $28,280 $41,332 $33,685 $110,511
Source: ELFA Survey of Equipment Finance Activity, 2017
Figure 25 reveals that the only loans with an average 4% or more pre-tax yield spread are the ones under $25K and financed by Independents ($843 million); the ones that are under $250K and financed by Independents ($3,112 million), and the loans that are under $25K and financed by Banks ($3.315 million). Of these, the ones under $25K and financed by Independents have a weighted-average maturity of only 13.6 months; therefore we will not qualify them as susceptible to refinancing. Thus, the total susceptible to refinancing, based on the criteria on pre-tax yield spread and maturity, is $6.427 billion.
Applying the Credit Quality screen from PayNet (65.4%), we arrive at the amount of all new business that is susceptible to disruption through refinancing, $4.203 billion. This is only 3.8% of the total amount of new business origination in FY 2016.
Thus, using our estimates (based on subjective metrics that would determine the susceptibility of loans to refinancing by third parties, including Fintechs), we find that the existing equipment loan market is not very susceptible to disruption.
Now, we will discuss the possibility of the future Fintech-disruption of the equipment financing market by considering the Fintech penetration in the portion of the equipment sales that is not being financed, and by considering the possibility of Fintech penetration in the equipment financing market through the increasing of the overall size of the financing market by serving underserved markets.

EQUIPMENT LEASING & FINANCE FOUNDATION • 47
HEADWINDS, UNDERCURRENTS, and TAILWINDScharacteristics of cash buyers, which would not allow us to estimate the possibility of Fintech penetration. One important characteristic could be their risk aversion which may make their opportunity cost lower than the potential financing costs (even for prime borrowers). For such risk-averse borrowers, it may be challenging for Fintechs to offer services or even attractive rates to change their purchase-financing decisions.
LOC-funded equipment acquisitions, however, could potentially be disrupted by Fintechs as these are frequently refinanced with a permanent equipment loan. Bank leasing companies accommodate equipment purchase transactions first through the bank LOC, then shift it to a permanent lease/loan upon project completion.
What about the future business of the incumbent Banks, Captives, and Independents?
Since banks finance most of the equipment loans, we will consider the banks as incumbents and compare them with Fintech-disruptors. When considering the next 5-years, we will use more “normalized” credit environment, which means higher interest rates. Thus, assuming the rates increase, we would compare how Fintechs will fare against the Banks in gaining market share in the equipment financing area.
The above calculations, which use the current credit environment, indicate that Fintechs do not have much room to disrupt equipment finance companies. In the event of higher interest rates, we think banks particularly will have more cost advantages, and therefore be better positioned to keep market share (if there was no Fintech-disruption threat).
As Figure 26 shows, banks get more than 70% while independents get about 7% of new business. The Middle-Ticket not only gets the most business but also the approval rate is the highest. Large-Ticket gets the least new business applications and the approval rate is the lowest.
Figure 26. SEFA 2017 Survey Data All data and findings are for FY 2016.
Source: ELFA Survey of Equipment Finance Activity, 2017
As the data from SEFA shows, the overall approval rate of applications was about 70%, which implied about 30% or about $54 billion in unmet demand. The lowest approvals came from Independents, who incurred a 59% approval rate. See Figure 27 for more details.
It is estimated that about 43% of the $1.6 trillion equipment purchases, which is about a $688 billion, is financed by cash, credit cards, or lines of credit. While it seems to be a sizable market for penetration by Fintechs, and probably a part of it could potentially be tapped by Fintech lenders, it is difficult to apply our criteria or otherwise estimate the size of this market (cash, line of credit, etc.) that is susceptible to financing by Fintechs. There are many unknowns here, such as the characteristics of cash buyers, which would not allow us to estimate the possibility of Fintech penetration. One important characteristic could be their risk aversion which may make their opportunity cost lower than the potential financing costs (even for prime borrowers). For such risk-averse borrowers, it may be challenging for Fintechs to offer services or even attractive rates to change their purchase-financing decisions.
LOC-funded equipment acquisitions, however, could potentially be disrupted by Fintechs as these are frequently refinanced with a permanent equipment loan. Bank leasing companies accommodate equipment purchase transactions first through the bank LOC, then shift it to a permanent lease/loan upon project completion.xliv
What about the future business of the incumbent Banks, Captives, and Independents?
Since banks finance most of the equipment loans, we will consider the banks as incumbents and compare them with Fintech-disruptors. When considering the next 5-years, we will use more “normalized” credit environment, which means higher interest rates. Thus, assuming the rates increase, we would compare how Fintechs will fare against the Banks in gaining market share in the equipment financing area.
The above calculations, which use the current credit environment, indicate that Fintechs do not have much room to disrupt equipment finance companies. In the event of higher interest rates, we think banks particularly will have more cost advantages, and therefore be better positioned to keep market share (if there was no Fintech-disruption threat).
As Figure 26 shows, the median Cost of Funds for Banks (in Equipment Financing) is 1.54% (and the 75%ile is only 1.77%). As it was discussed in an earlier section, the Fintechs are more sensitive to interest rate shocks then the banks. The interest-rate sensitive portion of the Fintechs total costs is much higher (more than twice as much) than the one for the banks.
Figure 26. SEFA 2017 Survey Data All data and findings are for FY 2016.
NEW BUSINESS VOLUME Banks Captives Independents Overall Amount $79,015 $24,085 $7,411 $110,511
% of Total 71% 22% 7% 100% Small-Ticket Middle-Ticket Large-Ticket Overall Amount $34,380 $54,083 $22,051 $110,514 % of Total 31% 49% 20% 100%
Source: ELFA Survey of Equipment Finance Activity, 2017

48 • EQUIPMENT LEASING & FINANCE FOUNDATION
HEADWINDS, UNDERCURRENTS, and TAILWINDSFigure 27. SEFA 2017 Survey. All data and findings are for FY 2016. ($-amounts in millions).
Source: ELFA Survey of Equipment Finance Activity, 2017
Methodology used in estimation of the turnaround time was as follows:
a. Start measuring turnaround time when the Customer Credit Application is Complete.
b. Stop measuring turnaround time when the Initial Credit Decision is made including conditional decisions and awaiting customer’s response.
This implies an addressable market of about $54 billion. Another area of improvement that Fintechs may offer is the speed of processing of applications. It is here that Fintechs have advantages: speed of applications processing and decision-making.
As the data from SEFA shows, the overall approval rate of applications was about 70%, which implied about 30% or about $54 billion in unmet demand. The lowest approvals came from Independents, who incurred a 59% approval rate. See Figure 27 for more details.
Figure 27. SEFA 2017 Survey. All data and findings are for FY 2016. ($-amounts in millions).
Banks Captives Independents Overall Percentage Approved 70.9% 73.2% 59.4% 70.3% $-Amount Submitted $124,119 $41,264 $16,867 $182,251 $-Amount Rejected $36,118 $11,058 $6,848 $54,128
Small-Ticket Middle-Ticket Large-Ticket Overall Percentage Approved 70.3% 73.6% 57.2% 70.3% $-Amount Submitted $63,171 $95,590 $23,489 $182,251 $-Amount Rejected $18,762 $25,236 $10,053 $54,128
Credit Decision Turnaround Time
$250,000 $5 million $5 million Weighted-Average 3.6 hours 2.7 days 4.2 days Median 4 hours 2.5 days 5.0 days
Methodology used in estimation of the turnaround time was as follows:
a. Start measuring turnaround time when the Customer Credit Application is Complete.b. Stop measuring turnaround time when the Initial Credit Decision is made including
conditional decisions and awaiting customer's response.
This implies an addressable market of about $54 billion. Another area of improvement that Fintechs may offer is the speed of processing of applications. It is here that Fintechs have advantages: speed of applications processing and decision-making.
Less than Turnaround Time $250,000 - Over

EQUIPMENT LEASING & FINANCE FOUNDATION • 49
HEADWINDS, UNDERCURRENTS, and TAILWINDSReferences
Bassett, William, Seung Jung Lee and Thomas Spiller (2012). Estimating Change in Supervisory Standards and Their Economic Effects, Federal Reserve Board. August 24, 2012.
Berger, T. and Frey, C.B. (2014a). Technology Shocks and Urban Evolutions: Did the Computer Revolution Shift the Fortunes of US Cities?, Oxford Martin School, Working Paper.
Berger, T. and Frey, C.B. (2014b). Industrial Renewal in the 21st Century: Evidence from US Cities?, Oxford Martin School Working Paper.
Borak, Donna (2014). Yellen Stresses Importance of Tailored Rules for Small Banks. American Banker. May 2, 2014. http://www.americanbanker.com/issues/179_84/yellen-stresses-importance-of-tailored-rules-for-small-banks-1067240-1.html
Chen, Brian S., Hanson, Samuel G. and Stein, Jeremy C (2017). The Decline of Big-Bank Lending to Small Business: Dynamic Impacts on Local Credit and Labor Markets. Harvard Business School.
Clozel, Lalita (April 26, 2017). State Regulators Sue OCC Over Fintech Charter. American Banker.
EY (2017). Unleashing the potential of Fintech in banking, EY Report.
Feldman, Ron, Ken Heinecke and Jason Schmidt (2013).Quantifying the Costs of Additional Regulation on Community Banks. Federal Reserve Bank of Minneapolis. May 30, 2013.
Frey, C.B. (2014a). Creative Destruction at Work, Project Syndicate, July 15, 2014.
Frey, C.B. (2014b). How 21st-Century Cities Can Avoid the Fate of 20th-Century Detroit, Scientific American, August 22, 2014.
Frey, C.B. (2014c). Doing Capitalism in the Digital Age, Financial Times, October 1, 2014.
Frey, C.B. (2015). The End of Economic Growth?, Scientific American, 32(1).
Frey, C.B., and Osborne (2014). UK Jobs at Risk. In: Agiletown: the relentless march of technology and London’s response. Deloitte.
Gandhi, P. and Lustig, H. (2015). Size Anomalies in U.S. Bank Stock Returns. The Journal of Finance, 70: 733–768. doi:10.1111/jofi.12235.
Gordon Mills, Karen and Brayden McCarthy (2015). The State of Small Business Lending: Innovation and Technology and the Implications for Regulation, HBR. Working Paper 17-042.
Government Printing Office. https://www.gpo.gov/fdsys/pkg/CHRG-114hhrg94651/pdf/CHRG-114hhrg94651.pdf.
Jagtiani, Julapa and Catharine Lemieux (2017). Fintech Lending: Financial Inclusion, Risk Pricing, and Alternative Information. FRB of Philadelphia Working Paper No. 17-17
Jagtiani, Julapa, and Catharine Lemieux (2016). Small Business Lending After the Financial Crisis: A New Competitive Landscape for Community Banks. Federal Reserve Bank of Chicago Economic Perspectives, 40:3, Fall, 2016, https://www.chicagofed.org/publications/economic-perspectives/2016/3-jagtianilemieux.
KPMG (2017). The Pulse of Fintech. https://assets.kpmg.com/content/dam/kpmg/xx/pdf/2017/07/pulse-of-Fintech-q2-2017.pdf
Lemieux, Cathy and Julapa Jagtiani (2017). Promise and Peril: Managing the Uncertainty of Rapid Innovation and a Changing Economy, Federal Reserve Bank of Chicago, Chicago, March 29–30, 2017.
50 • EQUIPMENT LEASING & FINANCE FOUNDATION
HEADWINDS, UNDERCURRENTS, and TAILWINDSMach, T. L., C. M. Carter, and C. R. Slattery (2014). Peer-to-peer lending to small businesses. Federal Reserve Board, FEDS Working Paper 2014-10.
McKinsey & Company (2016). Cutting Through the Fintech Noise: Markers of Success, Imperatives For Banks. http://www.mckinsey.com/industries/financial-services/our-insights/cutting-through-the-noise-around-financial-technology.
Milken Institute Center for Financial Markets (2016). U.S. Online, Non-Bank Finance Landscape. Milken Institute Center for Financial Markets.
Moldow, C. (2015). A Trillion Dollar Market, by the People for the People: How Marketplace Lending Will Remake Banking as We Know It. https://foundationcapital.com/assets/whitepapers/TDMFintech_whitepaper.pdf
Morgan Stanley Research (2015). Global Marketplace Lending: Disruptive Innovation in Financials. Retrieved from http://www.morganstanley.com/ideas/p2p-marketplace-lending
PwC. (2015). Peer Pressure: How Peer to Peer Lending Platforms are Transforming Consumer Finance. http://www.pwc.com/us/en/consumerfinance/publications/peer-to-peer-lending.html
PwC Global Fintech Report (2017). Available at https://www.pwc.com/jg/en/publications/pwc-global-Fintech-report-17.3.17- final.pdf. Reflection on 1H (2017): Key Trends in the World of Modern Finance, 2017. Deloitte.
SMB. http://smallbusiness.house.gov/calendar/eventsingle.aspx?EventID=398060
The Economist (Winter 2015). The Fintech Revolution.
The Economist (2015). Intelligence Unit Limited. The Disruption of Banking.
Stein, Peter and Reena Aggarwal (2016). The Complex Regulatory Landscape for Fintech. An Uncertain Future for Small and Medium-Sized Enterprise Lending. White Paper, Georgetown University.
U.S. Department of Treasury (2016). White Paper Opportunities and Challenges in Online Marketplace Lending, May 10, 2016. https://www.treasury.gov/connect/blog/Documents/Opportunities_and_Challenges_in_Online_Marketplace_Lending_white_paper.pdf
Viacom Scratch (2017). The Millennial Disruption Index 2017.
Wilmarth, Arthur (2015). Use Tiered Regulation to Preserve Small Banks, Keep Big Ones in Line.” American Banker. April 6, 2015. http://www.americanbanker.com/bankthink/use-tiered-regulation-to-protect-small-banks-keep-big-ones-in-line-1073578-1.html

EQUIPMENT LEASING & FINANCE FOUNDATION • 51
HEADWINDS, UNDERCURRENTS, and TAILWINDS______________________________________________________
iU.S. Equipment Finance Market Study, 2016-2017, Equipment Leasing & Finance Foundation
iiSee the description of DLT and Blockchain in the section on Fintech Ecosystem.
iii“The Fintech Revolution,” The Economist, May, 2015.
ivSee the description of DLT and Blockchain in the section on Fintech Ecosystem.
v“The Fintech Revolution,” The Economist, May, 2015.
1viChen, Brian, Hanson, Samuel, and Stein, Jeremy: “The Decline of Big-Bank Lending to Small Business: Dynamic Impacts on Local Credit and Labor Markets,” Harvard Business School, March 2017.
viiJagtiani, Julapa and Catharine Lemieux, (2017). Fintech Lending: Financial Inclusion, Risk Pricing, and Alternative Information
viiiOrchard’s data set only includes independent marketplace lenders integrated data, and it does not include data from those tradi-tional players that have online lending operations.
ix“Global Marketplace Lending: Disruptive Innovation in Financials,” Morgan Stanley Research, 2015
x“A Trillion Dollar Market By the People, For the People,” Charles Moldow, Foundation Capital, 2015
xiLos Angeles Times, May 2016
xiiTelos Demos, The Wall Street Journal, October 27, 2016
xiii“Marketing Lending Securitization Tracker Q1 2017,” PeerIQ
xivThe default rates of traditional equipment-finance companies are drawn from ELFA’s Monthly Leasing and Finance Index (MLFI), an index of just 25 companies, most of which are large, well-established lenders.
xv“Marketing Lending Securitization Tracker Q1 2017,” PeerIQ
xvi“Recap of Recent Performance Trends with Lending Club and Prosper, Part 2,” Lend Academy, January 18, 2017
xviiInvestment Zen Finance Collective, Austin, TX, May 17, 2017
xviii“OnDeck Reports Third Quarter Financial Results,” OnDeck, November 6, 2017
xixMonthly Leasing & Finance Index, October 2017, Equipment Leasing and Finance Association
xx“Pricey Fintech Lenders Put the Squeeze on Cash-Strapped Small Businesses,” The Los Angeles Times, June 16, 2017
xxi“Size Anomalies in U.S. Bank Stock Returns,” Priyank Gandhi and Hanno Lustig, The Journal of Finance, March 12, 2015
xxiiDeloitte estimates the non-interest costs of about 310 bps of the total deposits held. Approximately 60% of this is attributable to the costs of the branch network, with the remainder relating to acquisition, processing and servicing expenses. The estimate of the non-interest costs incurred in attracting and retaining deposits is about 270 bps of the total loans funded by the deposits (about 87% of the 310 bps).
xviiiSee Figure 8, Investment in Fintech by the Ten Largest U.S. Banks
xxivOffice of the Comptroller of the Currency, “Semi-Annual Risk Perspective from the National Risk Committee,” Spring 2017
xxvhttp://money.cnn.com/2008/09/23/news/companies/goldman_berkshire/
xxvi“G.E. Will Pay Back $3 Billion to Buffett,” The New York Times, Sept. 13, 2011
xxviiThe Millennial Disruption Index 2017, Viacom Scratch
xxviiihttps://www.accenture.com/_acnmedia/PDF-29/Accenture-Silver-Surfers-Continue-to-Make-Waves.pdf
xxix“The State of Small Business Lending: Innovations and Technology and the Implications for Regulation,” Karen Gordon Mills and Braden McCarthy, Working Paper 17-042, Harvard Business School, 2016

52 • EQUIPMENT LEASING & FINANCE FOUNDATION
HEADWINDS, UNDERCURRENTS, and TAILWINDSxxx“State Regulators Sue OCC Over Fintech Charter,” American Banker, April 26, 2017
xxxiAs collaboration among Fintechs and traditional banks grows, a challenge could result to both, due to regulatory differences.
xxxiiKPMG, “The Pulse of Fintech, Q3 2017”
xxxiii“Fintech Lending: Financial Inclusion, Risk Pricing, and Alternative Information,” Julapa Jagtiani and Catharine Lemieux, Federal Reserve Bank of Philadelphia, 2017
xxxivPayNet, Inc., Testimony of William Phelan before the U.S. House of Representatives House Committee on Small Business, October 26, 2017
xxxvibid
xxxviibid
xxxviiibid
xxxviiiibid
xxxixBusiness Insider, February 2017
xlPayNet, Inc., Testimony of William Phelan, October 26, 2017
xliibid
xlii“The Disruption of Banking,” The Economist Intelligence Unit Limited, 2015
xliiihttps://bankinnovation.net/2017/06/amazon-uses-its-machine-learning-gadgets-for-lending/
xlivWe thank an anonymous reviewer from the steering committee for suggesting this.
EQUIPMENT LEASING & FINANCE FOUNDATION • 53
HEADWINDS, UNDERCURRENTS, and TAILWINDSAcknowledgementsWe would like to acknowledge the support of the Equipment Leasing & Finance Foundation, particularly for their help in obtaining data, reports, and survey results. The authors also thank the following individuals for their constructive comments and suggestions, which substantially improved this paper: Ben Postlethwaite, Pepperdine University; David Beaver, Orchard Platform; Kelli Nienaber, Equipment Leasing & Finance Foundation; Susan Hodges; Tom Ware and Amanda Hull, PayNet; Rich Gumbrecht, Commercial Finance Association; Jeff Elliott, Huntington Equipment Finance; Patricia Voorhees, The Alta Group; Deborah Reuben, Reuben Creative, LLC; Ric Andersen and Kelly Reale, Key Equipment Finance; and Scott Thacker, Ivory Consulting Corporation.
About the ResearchersLevon Goukasian, PhD [email protected]
Levon Goukasian, PhD, is a Professor of Finance and the Will Singleton Chair in Finance at Pepperdine University. He conducts active research in asset pricing, quantitative portfolio management, corporate social responsibility, monetary policy impact on asset prices, and risk management. His consulting interests include risk measurement and management for corporations, asset management firms, and hedge funds. Dr. Goukasian’s research papers have been published in such journals as Journal of Behavioral Finance, Management Science, Real Estate Economics, Journal of Fixed Income, Journal of Economic Dynamics and Control, Journal of Equipment Lease and Financing, and others. He received his PhD from the University of Southern California, Los Angeles, in 2001.
Bill Ullman [email protected]
Bill Ullman’s career in finance spans 25 years. Currently, Ullman serves as CEO of Orchard Platform Markets, LLC, the broker-dealer subsidiary of Orchard Platform, a financial technology company focused on providing data, analytics, software, and a transactional platform for online loans. In addition to his role at Orchard, Ullman serves on the Board of Directors of Van Eck Associates Corp., a New York-based investment manager with approximately $45 billion under management. Ullman has been an angel investor in and advisor to several financial technology companies, including Mirador Financial, DriveSally, StockTwits, GetBread.com, and Orchard. Ullman began his career at Merrill Lynch as an investment banker focused on financial institutions, spending 3 years in London working with European and African financials. In 1997, Ullman was recruited to Bear Stearns’ investment bank, and later helped manage the firm’s prime brokerage and global clearing services business. In the last several years, Ullman has contributed frequently to the Fintech dialogue by publishing articles and speaking at conferences, most recently at the American Banker “Digital Lending” conference in November 2017 in New York City. Ullman has an MBA from UCLA’s Anderson School of Management and an AB cum laude from Princeton University.


BENEFITS OF VALUED DONORS
YOUR SUPPORT IS VITAL TO THE INDUSTRY
www.leasefoundation.org
Learn more at www.leasefoundation.org/giving.

1625 Eye Street • Suite 850 Washington, DC 20006 www.leasefoundation.org 202-238-3429 Kelli Jones Nienaber, Executive Director