tahatai school waste audit 2 -...
TRANSCRIPT

Waste Audit
Tahatai Coast School December 2007
A Tauranga City Zero Waste Programme
Assessment prepared by: Marty Hoffart Cleaner Production Advisor Waste Watchers Ltd 07 577 1898 [email protected]
Edited by: Heidi Pettersen Zero Waste Programme Leader Tauranga City Council
Contents 1.0 Tauranga City Zero Waste Projects .................................................... 1 2.0 Tahatai Coast School .......................................................................... 2 3.0 Project Background............................................................................. 2 3.1 Summary of Work to Date ........................................................ 3 4.0 Existing Reuse, Recycling and Residual Waste.................................. 4 4.1 Weight Calculations for recycling ............................................. 5 4.2 Annual Waste Figures .............................................................. 5 4.3 Solid Waste Expenditure .......................................................... 6 5.0 The Waste Audit.................................................................................. 8 5.1 What we measured................................................................... 9 5.1.1 By Weight....................................................................... 9 5.1.2 By Volume...................................................................... 9 6.0 Summary and Recommendations ..................................................... 12
1
1.0 Tauranga City Zero Waste Projects In 2001, the Tauranga City Council adopted a policy of zero waste to landfill by 2015. This goal requires that we strive to reduce waste going to landfill by reducing, reusing and recycling. The goal, ‘Zero Waste’ is now referred to in national policy relating to waste minimisation. While it is an ambitious target, it aims to focus creativity and resources towards getting closer and closer to zero waste in a journey of continuous improvement. Such a goal is often likened to similar manufacturing goals such as Zero Emissions and Zero Accidents. Waste minimisation is about preventing waste at the source, not just trying to manage and dispose of it. Improving waste minimisation programmes in Oceanside Cafe may allow the organisation to:
• Use materials and resources more efficiently • Comply with environmental legislation • Achieve efficiency in a competitive market • Improve environmental performance • Operate a more sustainable business • Save money and reduce waste to landfill
Most business and industry recycling systems can be put into place easily and with limited disruption to the overall work and activities of the employees. A simple, efficient and cost effective programme can enhance the work place morale and be integrated almost overnight with some careful planning and communication between management and employees. There are some key phases in achieving a waste minimisation programme, which include the following important steps:
• Site visit and discussion with employees • Initial audit of waste and data collection • Implement the recommendations • Monitor the changes and get feedback • Make needed adjustments to programme • Follow up with another audit
Tauranga City Council has engaged Waste Watchers Ltd to introduce waste minimisation programmes into selected businesses. The aim of this programme is to demonstrate to business and industry that minimising waste brings not only environmental benefits but financial savings as well. The objective of this waste audit is to benchmark Tahatai Coast Schools existing waste minimisation programme and to audit residual waste in order to investigate options for its diversion from landfill.
2
2.0 Tahatai Coast School Tahatai Coast School is located at 45 Evans Rd in the suburb of Papamoa in Tauranga City. The school caters for students living in the Bayfair and Papamoa area. The school zone runs between Papamoa Beach Rd and Maunganui Rd and from Palm Beach Boulevard to Tuihana Drive
Tahatai Coast School is classified as a decile 5 co-educational, state school and was established in 1996. It caters for new entrants to year eight students and in 2006 had a roll of approximately 750 and during the time of the 2007 audit the roll was 736. The school has seen substantial growth to the student roll and grew from 430 students in 2003 to 630 in 2005. The school also runs a bilingual class, which includes students from new entrant to year seven. The school day at the school begins at 8:30am and finishes at 2:30pm.
Tahatai Coast School is widely recognised for its innovative use of information and communication technology (ICT). It has a fully integrated Apple Mac-based network providing computer access in all classes and workspaces. The school also has two digital classrooms. (Tahatai.school.nz)
The principal Ian Leckie manages the school’s 55 staff members and in 2006, the school joined Environment Bay of Plenty’s Enviroschools programme. This is the second year of the three-year programme. The school places great emphasis on their 6Cs living and learning behaviours: contemplation, creativity, citizenship, compassion, conscience and communication underpin everything they do at Tahatai Coast School. 3.0 Project Background This is the second Tauranga City Council solid waste audit to take place at the school. The first waste audit was conducted 12 months ago and a follow-up audit was requested by the school to check on progress made on zero waste initiatives made throughout the past year. On November 9th, Debbie Milbanke from Tahatai Coast School contacted Waste Watchers Ltd to request assistance with a school solid waste audit. Prior to conducting a waste audit, Debbie had planning sessions with members of the Enviroschools team. The 2007 Environment Bay of Plenty Enviroschools facilitator is Andrea Mills. The staff and students were interested in exploring better environmental outcomes for the school and aimed to assess existing environmental initiatives. Tahatai Coast School has participated in the Tauranga City zero waste education programmes for several years and has put systems in place to reduce waste. School waste removal methods and resource recovery initiatives were noted as were any additional information relating to changes to school waste management practices, collection days, and associated disposal costs. Tahatai Coast School is forming an environmental policy as part of the Enviroschools process.
3
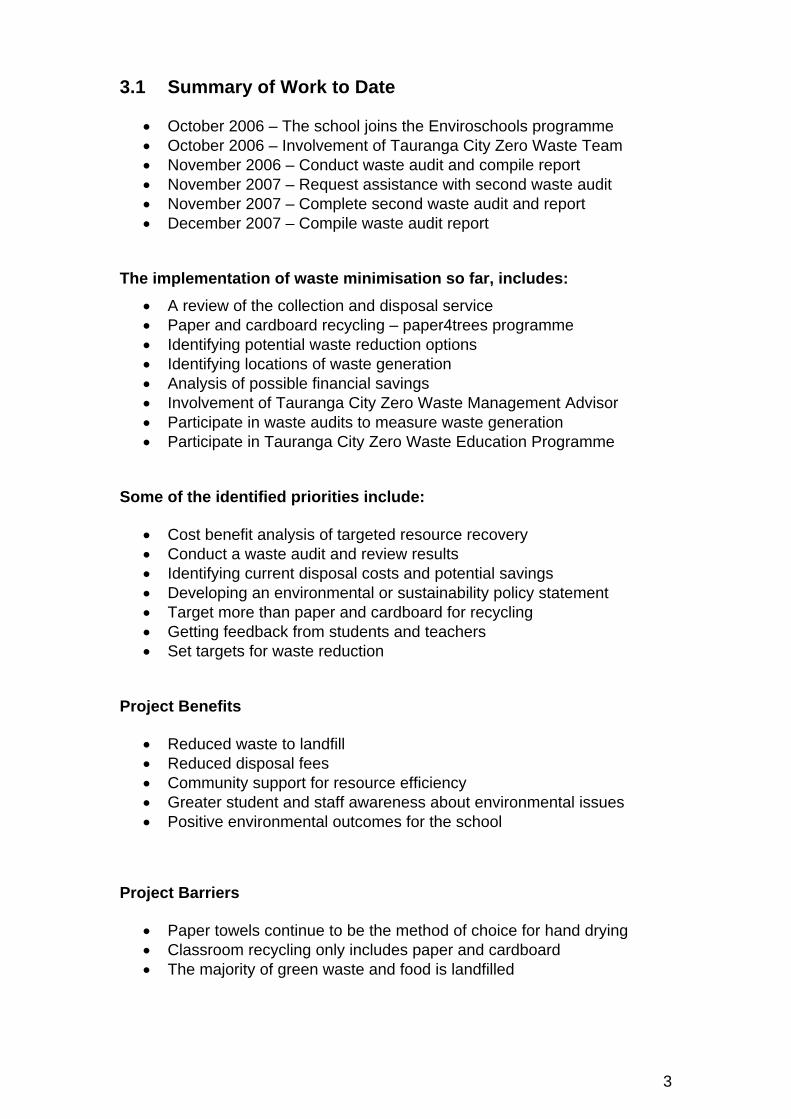
3.1 Summary of Work to Date
• October 2006 – The school joins the Enviroschools programme • October 2006 – Involvement of Tauranga City Zero Waste Team • November 2006 – Conduct waste audit and compile report • November 2007 – Request assistance with second waste audit • November 2007 – Complete second waste audit and report • December 2007 – Compile waste audit report
The implementation of waste minimisation so far, includes:
• A review of the collection and disposal service • Paper and cardboard recycling – paper4trees programme • Identifying potential waste reduction options • Identifying locations of waste generation • Analysis of possible financial savings • Involvement of Tauranga City Zero Waste Management Advisor • Participate in waste audits to measure waste generation • Participate in Tauranga City Zero Waste Education Programme
Some of the identified priorities include:
• Cost benefit analysis of targeted resource recovery • Conduct a waste audit and review results • Identifying current disposal costs and potential savings • Developing an environmental or sustainability policy statement • Target more than paper and cardboard for recycling • Getting feedback from students and teachers • Set targets for waste reduction
Project Benefits
• Reduced waste to landfill • Reduced disposal fees • Community support for resource efficiency • Greater student and staff awareness about environmental issues • Positive environmental outcomes for the school
Project Barriers
• Paper towels continue to be the method of choice for hand drying • Classroom recycling only includes paper and cardboard • The majority of green waste and food is landfilled
4
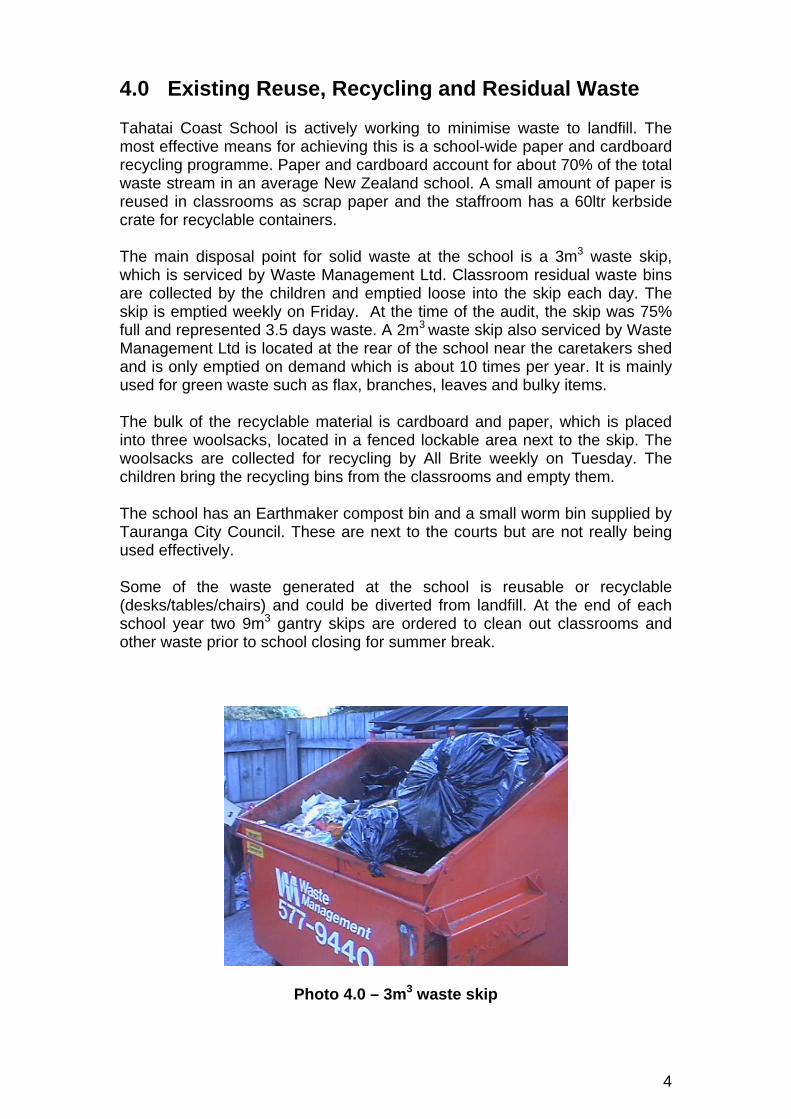
4.0 Existing Reuse, Recycling and Residual Waste Tahatai Coast School is actively working to minimise waste to landfill. The most effective means for achieving this is a school-wide paper and cardboard recycling programme. Paper and cardboard account for about 70% of the total waste stream in an average New Zealand school. A small amount of paper is reused in classrooms as scrap paper and the staffroom has a 60ltr kerbside crate for recyclable containers. The main disposal point for solid waste at the school is a 3m3 waste skip, which is serviced by Waste Management Ltd. Classroom residual waste bins are collected by the children and emptied loose into the skip each day. The skip is emptied weekly on Friday. At the time of the audit, the skip was 75% full and represented 3.5 days waste. A 2m3 waste skip also serviced by Waste Management Ltd is located at the rear of the school near the caretakers shed and is only emptied on demand which is about 10 times per year. It is mainly used for green waste such as flax, branches, leaves and bulky items. The bulk of the recyclable material is cardboard and paper, which is placed into three woolsacks, located in a fenced lockable area next to the skip. The woolsacks are collected for recycling by All Brite weekly on Tuesday. The children bring the recycling bins from the classrooms and empty them. The school has an Earthmaker compost bin and a small worm bin supplied by Tauranga City Council. These are next to the courts but are not really being used effectively. Some of the waste generated at the school is reusable or recyclable (desks/tables/chairs) and could be diverted from landfill. At the end of each school year two 9m3 gantry skips are ordered to clean out classrooms and other waste prior to school closing for summer break.
Photo 4.0 – 3m3 waste skip

5
4.1 Weight calculations for recycling To determine the total annual paper and cardboard recycling figures we calculated the weight of the three woolsacks at the time of the audit and with this figure, obtained an a weekly total. The total weight each week was then multiplied by the total number of estimated empties per year. To determine the total annual plastic, glass, steel and aluminium recycling figures (recycling bin in staff room) we calculated the weight of one bin of glass and plastic at the time of the audit and determined a weekly amount this was then multiplied by the number of empties per year.
Photo 3.0- Emptying the skip
Table 4.1– Estimated annual recycling weight
Classification kg
Paper and Cardboard 4800.0 Recyclable containers 200.0 Printer cartridges 30.0 Total
5030.0
4.2 Annual Waste Figures Annual waste figures have been calculated based on information obtained during the waste audit and by meeting with and interviewing teachers and the school caretaker. The audit sampled waste from 3.5 days. The total weight of the waste found in the skip was 117kg, which suggests an average of 33.4 kg of waste, are produced each day. A typical week consisting of five school days could see 152kg dumped into the 3m3 waste skip. The waste contractor empties the 3m3 waste skip weekly for 48 weeks each year. Even though the school year is only 40 weeks, caretakers and other staff members continue to work during the term breaks and the skip is emptied on a regular basis except
6
for four weeks over the Christmas holidays. With a waste audit figure of 152kg of per week, it can be estimated that 9.5 tonnes of waste are sent to landfill annually. The 2m3 waste skip located behind the school is emptied on demand (when full) and was only about 20% full at the time of the audit. It is picked up approximately 10 times per year. The contents of the skip are included as part of the total waste stream for the school and are included with the annual waste figures. For the purposes of this audit, as we did in 2006, we have attributed 120 kg to the skip weight since it is mainly used for lighter material such as green waste and non-food waste such as polystyrene or broken desks and chairs. We acknowledge that the actual weight of the skip will vary depending on the contents at the time but estimate that the 2m3 waste skip would account for 1.2 tonnes annually. Lastly it was reported by the caretaker that two gantry skips are normally ordered at the end of each school year to dispose of unwanted materials prior the closure for the summer break and a figure of 500kg has been used as an estimated weight for each skip or about 1.0 tonnes to landfill. Table 4.2a shows the tonnage for total waste stream for 2006 and 2007. The figures show a large variation in the total annual tonnage of waste collected for recycling and going to landfill. Daily and weekly volumes of waste generation are variable and a waste audit is a ‘snap shot’ on the day. The audit last year was conducted the day after a school disco, which likely skewed the results to show greater weights for all categories evident on table 5.1.1. The 2007 audit is likely a more accurate reflection of the weekly waste volumes for a school of this size.
Table 4.2a – Total Waste Stream
Annual tonnage for 2007
2006
Recycled Materials
5.0
8.8
Residual Waste
9.5
25.3 Total
14.5
34.1
4.3 Solid Waste Expenditure Records from 2007 indicate in the past 12 months the school had spent $4751.78 for waste removal fees and $585.00 on recycling charges. The total expenditure for solid waste removal at the school over the past year is $5336.78. School records indicate the total cost of solid waste removal to be increasing on a yearly basis. Part of this is due to an increasing student roll and part is an increasing cost charged by Waste Management Ltd.
7
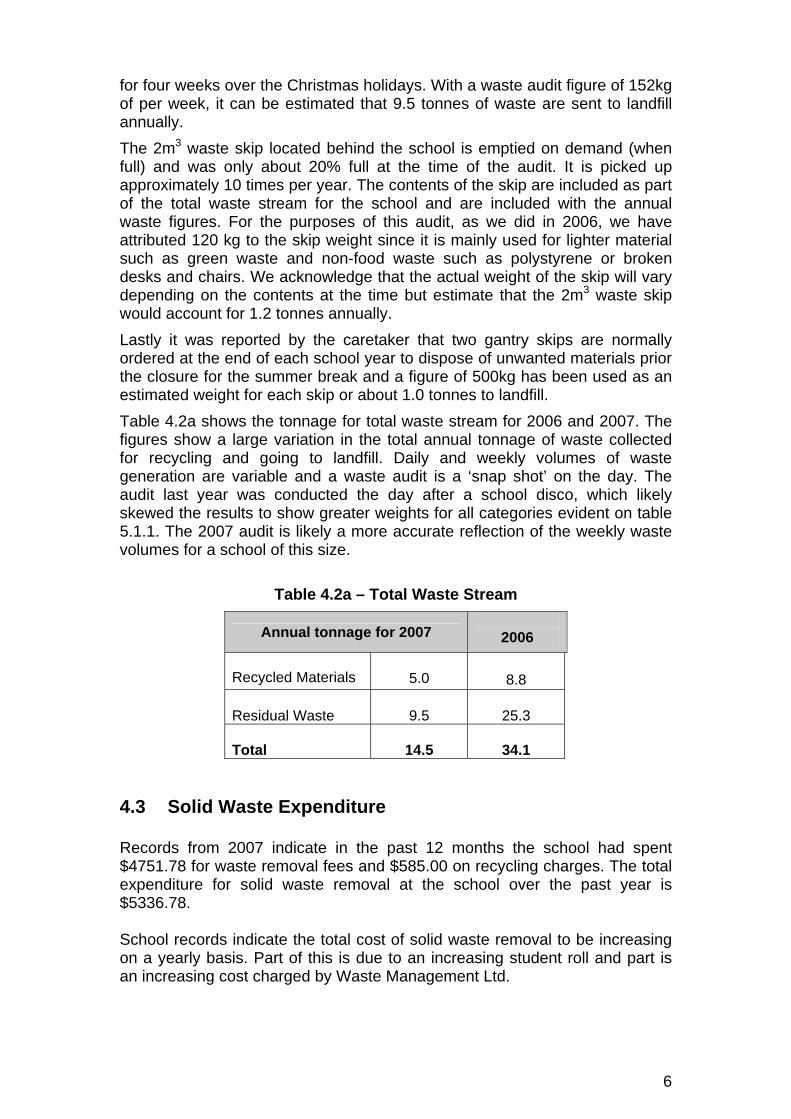
All Brite has also increased their fees over the past few years. In 2003, they collected the paper and cardboard from the schools free of charge. In 2004 they started charging the schools $30 per term and the following year it was raised to $60 per term. For the past 12 months Tahatai Coast have paid the company $585.00 or $146.25 for each of the four terms.
Table 4.3a – Annual Solid Waste Expenditure
Year Student Roll
Annual Cost
Average Monthly
2003 430 $2168.00 $180.00
2004 530 $2340.00 $195.00
2005 630 $3934.00 $327.83
2006 750 Unavailable
2007 736 $5336.78 $444.73
Photo 4.1- Sorting the material

8
5.0 The Waste Audit The purpose of conducting a solid waste audit at Tahatai Coast School was to gather accurate information about current waste management practices and measure the effectiveness of recycling and resource efficiency initiatives. The audit, along with an analysis of data collected, will assist the school in making further improvements to waste reduction initiatives. The solid waste audit involved collecting, sorting, identifying, measuring and weighing residual waste and recyclable materials collected from the disposal point (main skip) and the wool sacks used for paper and cardboard recycling. The recycling bin in the staff room was also included. The waste audit was conducted on November 27th, 2007 and involved five adults and 21 children. It took approximately 2.5 hours to empty the skip and weigh the materials. Since an audit was conducted 12 months ago at the same site, there was no need for a project briefing and site tour with the council contractor - Waste Watchers Ltd. Normally this would include an initial meeting with the client inspection disposal areas, locating and identifying all wastes and confirming logistics for the audit. The main residual waste bin audited is a 3m3 front load refuse bin and is located outside next to the teacher’s parking lot in a lockable area. During the day the bin is unlocked and accessible to all staff and students. It is the duty of students to take waste from classrooms to the residual waste bin. The cleaners also empty rubbish bags from the staffroom and toilet areas. On the day of the audit, the residual waste skip contained some bagged waste, however the majority of it was dumped loose and uncompacted, which included waste collected from the previous 3.5 days. The bin was due to be collected the morning of the next day and is normally emptied once a week on Friday.
9
5.1 What we measured The following three categories made up the largest proportions of sorted material by weight and by volume during the waste audit. Although waste and recyclable material were sorted into several different categories as shown on table 5.1.1, a resource recovery programme would initially target those materials consisting of the greatest amount of weight and volume.
5.1.1 By weight • Non - Recyclable paper which comprised 42% • Organic (food) which comprised 23%
• Non – Recyclable Plastic packaging which comprised 21% 5.1.2 By volume
• Non – Recyclable plastic packaging made up 32.0%
• Non – Recyclable paper made up 29.0%
• Recyclable paper and organic food waste were both 15.0%
It is standard cleaner production practice to measure by weight as it provides more accurate data, as volume can vary significantly with compaction. Moreover, there is no easy way to measure volume other than a visual estimate, which is subjective. Estimates of volume are included in this report however, as the s used in collection are emptied when full so effectively, Tahatai Coast School pays for its waste and recycling services by volume.
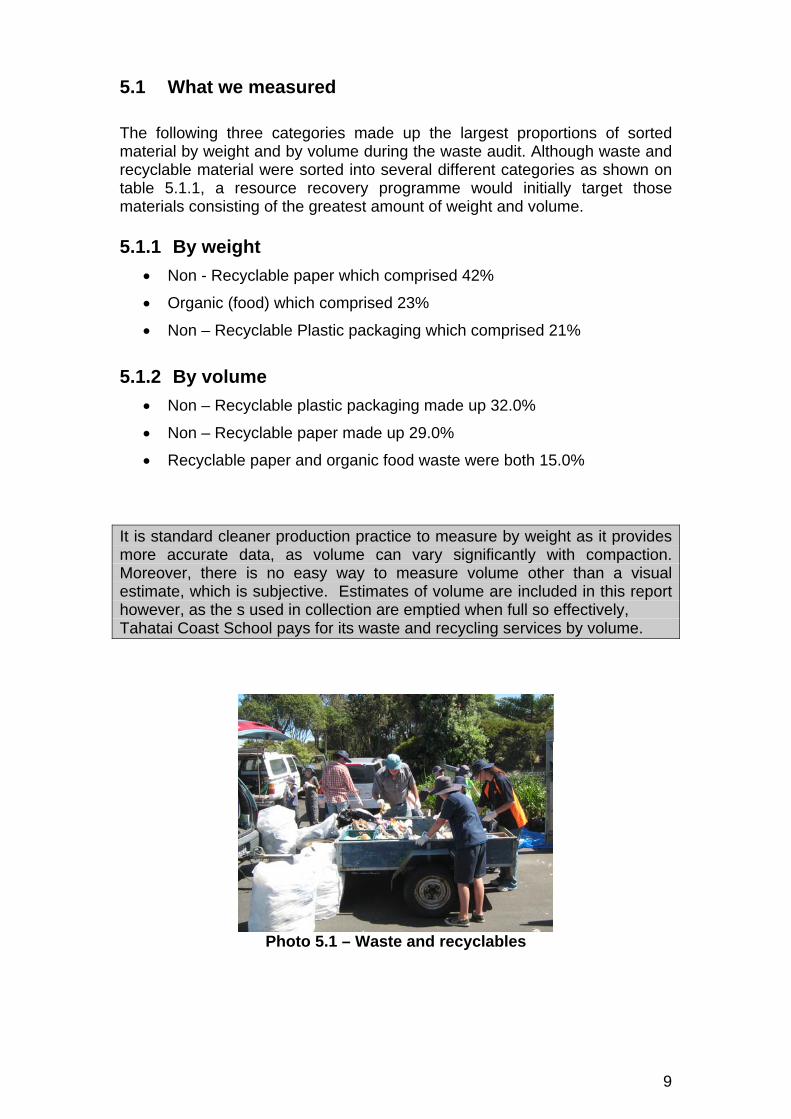
Photo 5.1 – Waste and recyclables
10
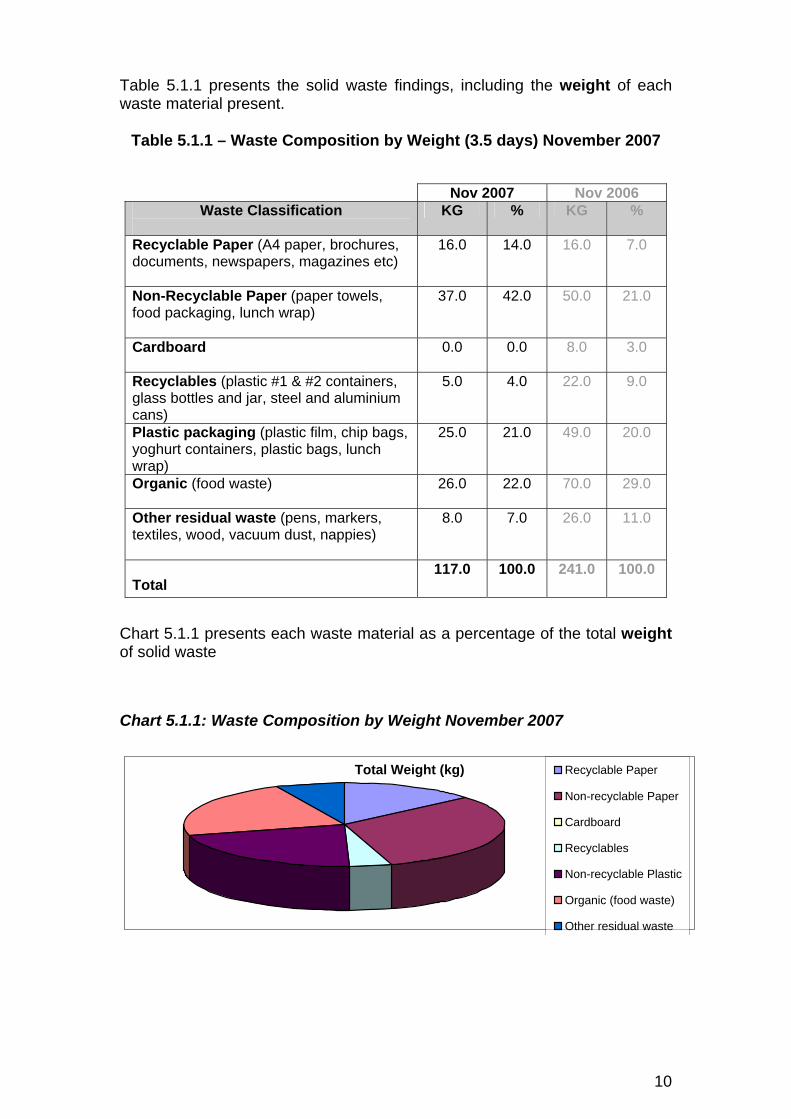
Table 5.1.1 presents the solid waste findings, including the weight of each waste material present.
Table 5.1.1 – Waste Composition by Weight (3.5 days) November 2007
Nov 2007 Nov 2006 Waste Classification
KG % KG %
Recyclable Paper (A4 paper, brochures, documents, newspapers, magazines etc)
16.0 14.0 16.0 7.0
Non-Recyclable Paper (paper towels, food packaging, lunch wrap)
37.0 42.0 50.0 21.0
Cardboard
0.0 0.0 8.0 3.0
Recyclables (plastic #1 & #2 containers, glass bottles and jar, steel and aluminium cans)
5.0 4.0 22.0
9.0
Plastic packaging (plastic film, chip bags, yoghurt containers, plastic bags, lunch wrap)
25.0 21.0 49.0 20.0
Organic (food waste)
26.0 22.0 70.0 29.0
Other residual waste (pens, markers, textiles, wood, vacuum dust, nappies)
8.0 7.0 26.0 11.0
Total 117.0 100.0 241.0 100.0
Chart 5.1.1 presents each waste material as a percentage of the total weight of solid waste
Chart 5.1.1: Waste Composition by Weight November 2007
Total Weight (kg) Recyclable Paper
Non-recyclable Paper
Cardboard
Recyclables
Non-recyclable Plastic
Organic (food waste)
Other residual waste
11
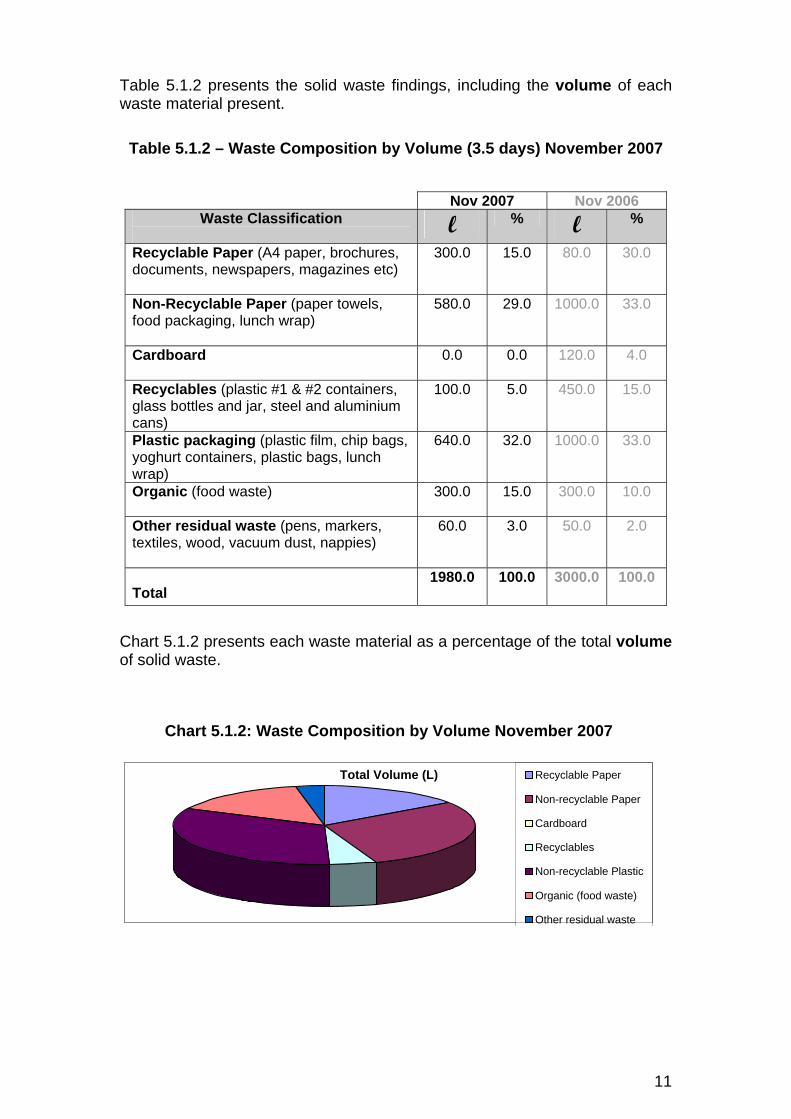
Table 5.1.2 presents the solid waste findings, including the volume of each waste material present.
Table 5.1.2 – Waste Composition by Volume (3.5 days) November 2007
Nov 2007 Nov 2006 Waste Classification
l % l %
Recyclable Paper (A4 paper, brochures, documents, newspapers, magazines etc)
300.0 15.0 80.0 30.0
Non-Recyclable Paper (paper towels, food packaging, lunch wrap)
580.0 29.0 1000.0 33.0
Cardboard
0.0 0.0 120.0 4.0
Recyclables (plastic #1 & #2 containers, glass bottles and jar, steel and aluminium cans)
100.0 5.0 450.0
15.0
Plastic packaging (plastic film, chip bags, yoghurt containers, plastic bags, lunch wrap)
640.0 32.0 1000.0 33.0
Organic (food waste)
300.0 15.0 300.0 10.0
Other residual waste (pens, markers, textiles, wood, vacuum dust, nappies)
60.0 3.0 50.0 2.0
Total 1980.0 100.0 3000.0 100.0
Chart 5.1.2 presents each waste material as a percentage of the total volume of solid waste.
Chart 5.1.2: Waste Composition by Volume November 2007
Total Volume (L) Recyclable Paper
Non-recyclable Paper
Cardboard
Recyclables
Non-recyclable Plastic
Organic (food waste)
Other residual waste
12
6.0 Summary and Recommendations The second solid waste audit conducted for Tahatai Coast School was completed on November 29th, 2007. The audit sampled and classified waste and recyclable material generated over 3.5 days. The methodology and sampling criteria were typical of most Tauranga City Council solid waste audits. The results clearly indicate less waste going to landfill when compared to audit results obtained in 2006. Each waste audit followed exactly the same methodology, and included many of the same staff members and students. The variation in data obtained is likely to the school disco, which took place the day prior to the 2006 audit. Although the event was reported in the 2006 report, it was unknown how much waste was attributed to the disco as it was the first waste audit conducted at the school. Paper towels continue to make up a significant proportion of waste to landfill and accounted for almost all of the non-recyclable paper waste found during the audit. They make up about a third of all waste generated at the school by volume and 42% of the total weight. They cost the school about $10000 annually to purchase and likely make up about $1500 of the total disposal fees. Recommendation: Discuss the proposal to discontinue the present use of paper towels. Paper towels can continue to be used where required, but their use should be restricted. Last year it was noted in the waste audit report that every classroom has a paper towel dispenser, as do all the toilet areas. School management and the Enviroschools group may want to address this part of the waste stream and explore more cost effective and environmentally friendly alternatives. The students are responsible for the emptying of all classroom paper and cardboard bins and rubbish bins on a daily basis. Educating them to sort waste from recyclable materials is an important component to the success of sustainable waste management practices. Recommendation: Ensure every classroom and office has a paper and cardboard recycling bin, and remind students to check the bin before they leave the classroom to make sure rubbish bins are not full of paper. Also, check to make sure teachers are not filling rubbish bins next to their desk with paper. Perhaps shift the recycling bin closer to them if they are. The Enviroschools group could do ‘spot checks’ to monitor recycling. Approximately 14% of the volume and 15% of to total annual waste is still made up of paper. No provision has yet been made for providing students with a bin for mixed recyclable containers such as plastic grade 1 and 2, glass bottles and jars and steel and aluminium cans.
13
Recommendation: Get two more kerbside recycling bins for recyclable containers and put them in the recycling area next to the skip. Students could then sort plastic beverage containers for recycling. With the school producing a volume of approximately 120l per week of recyclable containers, two 60l-recycling crates should be adequate. To date the school has not developed an official environmental policy around waste. Recommendation: Develop an environmental policy with specific references to existing waste minimisation initiatives. This may improve recycling participation rates. Education would play a key role in changing staff behaviour to place all recyclable material in the appropriate bins. Any changes to the current system should be discussed with staff members to get their input. Staff meetings can be used as part of an effective communication and consultation strategy. With the current efforts showing significant reductions in the amount of waste going to landfill, any improvements will add to the programme and have a positive impact on the bottom-line. Organic waste (food) featured in the top three of the weight and volume categories. This comprised 23% of the total weight, and 15% of the total volume, of the residual waste bin. It is important to keep food waste out of landfills as the lack of oxygen during decomposition results in the production of methane gas (a greenhouse gas) and acid leachate, both of which have negative environmental impacts. Recommendation: Separate organic waste and investigate the possibility of composting the material at the school. There would be no disposal cost associated with this activity. Alternatively, Waste Management Ltd currently provides an organic waste collection service to some businesses and may be able to offer the service to schools. The organic waste is taken to local pig farmers sourced by Waste Management. Contact Phil Gower (07 577-9440) from Waste Management for more details. There would be the need have an extra receptacle to store the food waste until a pig farmer or Waste Management Ltd can collect it. The findings of this report are based on the information available at the time of the audit and have been subject to time and resource constraints. It is not intended as an exhaustive analysis of waste management practices at Tahatai Coast School, but does serve as a resource for reporting on baseline data. Neither does it certify or in any way provide a guarantee as to the environmental performance of the school.