tactual perception · 2004-01-07 · as elements in the formulation of a comprehensive theory of...
TRANSCRIPT

CHAPTER 31
TACTUAL PERCEPTION
JACK M. LOOMIS
University of California, Santa Barbara, California
SUSAN J. LEDERMAN
I Queen's University, Kingston, Ontario, Canada
CONTENTS 3.1.8.3. Metacontrast, 31-16 3.1.9. Perception of Patterns Composed of
1. Organization 31 -2 Widely Spaced Elements, 31-17 1.1. Tactile Perception, 31-2 3.1.10. Tactile Speech, 31-18 1.2. Kinesthetic Perception, 31-2 3.2. Judgments Mediated by Temporal and Intensive 1.3. Haptic Perception, 31-3 Cues, 31-20
2. Preliminary Considerations 31 -3 3.2.1. Judging Material Composition and .
2.1. Active and Passive Touch, 31-3 Surface Texture Through Vibration, 31-20 2.2. Phenomenology of Touch, 31-3 3.2.2. Spatial Localization Using Temporal and
Intensive Cues, 31-20 3. Tactile Perception 31-4 3.3. Tactile Tracking, 31-22
3.1. Tactile Pattern Perception, 31-4 3.1.1. Spatial and Temporal Filtering of 4. Kinesthetic Perception 31 -24
Cutaneous Processing, 31-4 4.1. Tactual Egocenter, 31-24 3.1.1.1. Linear Systems Analysis, 31-4 4.2. Judgment of Parallelism in Kinesthetic Space, 3.1.1.2. Determinations of Spatial and 31-24
Temporal Sensitivity, 31-5 4.3. Apparent Curvature of Straight Lines, 31-24 3.1.2. Tactile Displays, 31-8 4.4. Anisotropy of Distance in Kinesthetic Space, 31-25 3.1.3. Legibility of Tactile Characters, 31-8 4.5. Anisotropy of Orientation in Kinesthetic Space, 3.1.4. Effect of Stimulus Size, 31-10 31-25 3.1.5. Effect of Body Locus, 31-10 4.6. Influence of Hand Movement on Judgments of 3.1.6. Temporal Resolution of Spatial Patterns, Kinesthetic Distance, 31-26
31-11 5. Haptic Perception 31 -26 3.1.7. Tactile Display Modes, 31-12 5.1. Texture Perception, 31-26 3.1.8. Spatiotemporal Pattern Masking, 31-15 5.1.1. Roughness Perception, 31-27
3.1.8.1. Lateral Masking, 31-16 5.1.1.1. Principles of'Neural Coding, 31-27 3.1.8.2. Temporal Masking of Spatially 5.1.1.2. Mechanoreceptor Responses to
Overlapping Stimuli, 31-16 Textured Surfaces, 31-28
31 -1

PERCEPTUAL ORGANIZATION AND COGNITION
5.1.2. Perception of Other Textural Dimensions, 31-31
5.2. Haptic Perception of Two- and Three- Dimensional Form, 31-31 5.2.1 Visual Substitution Devices as "Haptic
Systems," 31-31 5.2.2. Comparison of Tactual Modes, 31-32
5.2.2.1. Tactual Modes and Perception of Two-Dimensional Patterns, 31-32
5.2.2.2. Tactual Modes and Perception of Three-Dimensional Objects, 31-33
5.2.3. Percussion, 31-33 5.2.4. Tactual Stereognosis, 31-33
5.2.4.1. Oral Stereognosis, 31-33 5.2.4.2. Manual Stereognosis, 31-33
5.2.5. Imagined Rotation of Tactually Perceived Objects, 31-34
5.2.6. Virtual Vantage Point of Tactual Perception, 34-35
6. Concluding Remarks 31 -36
Acknowledgment 31-36
Reference Notes 31-36
References 31-36
In everyday life we attach great value to vision and hearing for the roles they play in making us aware of our surroundings, roles impressed upon us by acquaintance with their temporary occlusion (e.g., blindfolding) and by the knowledge that either can be lost permanently. With the sense of touch it is a different matter, for without the examples of temporary occlusion and permanent loss we tend to underestimate the role of touch in our perception of the world. A little reflection, however, does bring to mind some of what touch affords. Touch facilitates or makes possible virtually all motor activity, permits the per- ception of nearby objects and spatial layout when viewing is not feasible, and informs us of object properties (e.g., temper- ature) and events (e.g., those signaled by vibrations) inaccessible to the other senses. The potential role. of touch is still greater as exemplified by the ordinary achievments of those who have lost one or both of the major senses. The blind rely heavily on the sense of touch in their normal activities (Revesz, 1950), and even deaf-blind individuals come to know much about the world around them and to function well within it (e.g., Keller, 1908).
This chapter deals with the sense of touch primarily as a channel of information about objects and events outside the body. This coverage includes both the normal function of the sense of touch as it is used in the perception of qpace, texture, and form and its use as a sensory channel by prosthestic devices developed for the blind and deaf. In contrast to the more de- veloped areas of perception research, the field of touch is still very much in its formative stage. Thus, in addition to presenting established knowledge, we devote a portion of the chapter to concepts and findings that, in our opinion, will someday serve as elements in the formulation of a comprehensive theory of touch. In our selection of topics, we have given preference to research that is fundamental and systematic or that reveals some interesting capability of the sense of touch.
1. ORGANIZATION
Although tactual examination of an object results in a phenom- enologically unitary perceived object (Gibson, 1962; Katz, cited in Kmeger, 1970, 1982; RBvBsz, 19501, the research literature acknowledges that what to the layperson is the "sense of touch" in fact comprises two distinct senses-the cutaneous sense and kinesthesis (e.g., see Boring, 1942; Blumenfeld, 1936; Brown & Deffenbacher, 1979; Gibson, 1962, 1966; G. Gordon, 1978; Weber, 183411978, 184611978). Viewed functionally, the cuta- neous sense provides awareness of stimulation of the outer sur- face of the body by means of receptors within the skin and the associated nervous system, whereas the kinesthetic sense pro- vides the observer with an awareness of static and dynamic body posture (relative positioning of the head, torso, limbs, and end effectors) on the basis of (1) afferent information originating within the muscles, joints, and skin and (2) efference copy, which is the correlate of muscle efference available to the higher brain centers (von Holst, 1954). (The fact that the cutaneous sense contributes to kinesthesis prohibits a sharp division between the two in terms of mechanism but not in terms of function.) This recognition of two functionally distinct components of the "sense of touch" is implicit in allied areas of research. Inves- tigators concerned both with robotics (Arbib, Overton, & Lawton, 1984; Harmon, 1980, 1985; Hillis, 1982; Ivancevic, 1974; Ki- noshita, Aida, & Mori, 1975; Okada & Tsuchiya, 1977) and with teleoperation of remote manipulators (Bejay, 1977; Corker, Mishkin, & Lyman, 1980; Hill &Sword, 1973; Mishkin, Corker, & Lyman, 1981) have recognized the need to incorporate the functional counterparts of our cutaneous and kinesthetic senses into their systems. Accordingly, this review is organized in terms of the contributions of these two senses to the ‘‘sense of touch"; what follows is a delineation of the three resulting cat- egories of tactual perception. The term tactual perception is employed in the chapter to refer inclusively to all perception mediated by cutaneous sensibility andfor kinesthesis.
1 .l. Tactile Perception
Tactile perception refers to perception mediated solely by vari- ations in cutaneous stimulation. Two examples are the perception of patterns drawn onto the back and speech perception by a "listener" who senses speech information by placing one hand on the speaker's jaw and lips (the Tadoma method of speech reception). It is recognized that tactile perception always occurs within the context of a particular static posture, and that tac- tile perception sometimes depends upon what that posture is. However, provided that the posture remains constant, the vari- ations in stimulation that control tactile perception are solely cutaneous.
1.2. Kinesthetic Perception
The focus here is on perception mediated exclusively or nearly so by variations in kinesthetic stimulation. Instances of tactual perception for which there is no cutaneous contribution what- soever are usually contrived, such as in experiments where cutaneous sensibility has been completely eliminated by anes- thesia or circulatory occlusion (see Chapter 13 of this Handbook, by Clark & Horch; McCloskey, 1978). Under some circum- stances like these, one would expect observers, on the basis of resistance to limb movement alone, to be able to perform above chance in a variety of perceptual tasks, such as judging the

TACTUAL PERCEPTION
hardness of materials or the viscosity of liquids and perceiving the shape of large three-dimensional objects.
Included in the category of kinesthetic perception are those cases of tactual perception where variations in cutaneous stim- ulation, though signifying contact or lack thereof between the skin surface and the external stimuli, do not inform the observer of their spatial or textural properties. One example would be the identification of a raised pattern traced by a finger that is covered by a thimble. Another would be discriminating between lengths of rods, the ends of which are held between the finger and thumb. In both examples, the cutaneous stimulation serves only to indicate contact with the stimulus, while variations in kinesthetic stimulation convey all of the spatial information essential to performance of the task.
1.3. Haptic Perception
The term haptic perception refers to tactual perception in which both the cutaneous sense and kinesthesis convey significant information about distal objects and events. Most of our everyday tactual perception and tactually controlled performance falls into this category.
2. PRELIMINARY CONSIDERATIONS
2.1. Active and Passive Touch
The organization in terms of tactile, kinesthetic, and haptic perception adopted here recalls the distinction between active and passive touch emphasized by Gibson (1962,1966). Because this dichotomy has been highly influential in the study of touch, it is of value to examine the relation between Gibson's distinction and the present organizational scheme.
Part of Gibson's motivation for advocating the study of active touch as opposed to passive touch was his disdain for atomism and introspectionism, a disdain expressed earlier by Katz (cited in Krueger, 1970, 1982). Gibson especially took issue with the view that touch "sensations" can be construed as the building blocks of tactual perception. He believed that limiting the study of touch to probing the skin of a passive observer perpetuated the fallacious idea of sensation-based perception. Gibson, like Katz, felt the important phenomena of touch came into being when an observer was permitted to ac- tively explore a n object by touch. He drew some support for his opinion from the fact (noted earlier by Weber, 184611978; Katz, cited in Krueger, 1970,1982) that when observers underwent passive tactile stimulation they tended to describe their expe- rience in terms of tactile sensations, whereas when they engaged in active tactual exploration they tended to describe their ex- perience in terms of objects in space. Not only did Gibson question the focus of empirical research but he believed that the process of touch undergoes a fundamental change when the observer is given control over the "pickup" of information. When permitted to examine an object actively, the observer does not attend to the particular momentary sensations but rather seeks over time and space the invariances in the stimulation that characterize the object being explored.
Unquestionably, there is merit in Gibson's position, par- ticularly with regard to the tactual perception of three-dimen- sional objects. I t is unfortunate, however, that Gibson did not distinguish between active and passive touch in a consistent fashion, for some confusion in the subsequent literature has
been the result. In much of his writing, Gibson equated passive touch with what we have termed tactile perception. As one ex- ample, he wrote that "passive touch involves only the excitation of receptors in the skin and its underlying tissue. . . ." (Gibson, 1962, p. 479). If passive touch is defined in this way, categories 2 and 3 of Table 31.1 would be classified, along with categories 4 and 5, as active touch since both involve more than cutaneous information.
On other occasions Gibson hinged the distinction between active touch and passive touch on whether the subject controlled the pickup of information by way of efferent commands issued to the muscles used in touching. On this basis, both categories 2 and 3 of Table 31.1 would be classified as passive touch since neither involves active control of the touching process. This second way of distinguishing between active and passive touch accords with current usage in the motor control and perceptual adaptation literatures. Adopting i t in conjunction with our own organizational scheme, we obtain the following classification of modes of touch, as seen in Table 31.1: passive kinesthetic perception, active kinesthetic perception, passive haptic per- ception, active haptic perception, and lastly, tactile perception, which can only be passive.
2.2. Phenomenology of Touch
The observations of David Katz have contributed much to our appreciation of the capabilites and richness of the sense of touch. His major work on the subject (Katz, 1925) is not available in English, but several synopses (Katz, 1930; Krueger, 1970,1982; Zigler, 1926) convey a sense of his ideas, observations, and experiments. Some of these will be presented within the ap- propriate sections of the chapter. What follows is a brief con- sideration of several phenomenological observations that oc- cupied his interest. Although not central to an understanding of the whole of tactual perception and performance, they do constitute an interesting set of facts that require explanation.
Katz (1936; cited in Krueger, 1970,1982) and, before him, Weber (184611978) emphasized that most of our perceptual ex- perience is of objects and events external to US rather than of
Table 31 .l. Classification of Tactual Modes
Type of Information Label of Available to Observer Tactual Mode
1. Cutaneous information Tactile perception No 2. Afferent kinesthesis Passive kinesthetic
control perception 3. Cutaneous information Passive haptic
plus perception afferent kinesthesis
4. Afferent kinesthesis Active kinesthetic plus perception
efference copy Control 5. Cutaneous information Active haptic
plus perception afferent kinesthesis
plus efference copy
Tactual modes vary depending upon the degree of observer control over the pickup of information and upon the type of information available (cutaneous, kinesthetic, or both). The left column indicates the different tactual modes that result from the various combinations of the two factors. The right column gives the label used to refer to these different modes.

the more proximal stages and processes that intervene between the distal stimuli and our higher brain centers. This is not surprising when there is and can be no perceptual representation of an intervening stage, like the retina. However, there are numerous examples where "externalization of experience" occurs in spite of "subsidiary awareness" (Polanyi, 1962) of one or more intervening stages. With'touch, for example, the receptive surface of the skin, unlike that of the eye, is represented within perceptual space, yet frequently when the skin is touched the perceptual experience is of an object external to the perceptual boundary of the body. For example, when one probes a surface using a stylus held in the hand, one's awareness is not of the vibrations felt in the hand, but of the surface being explored. Similarly, when one stirs a viscous fluid, one has the experience of fluid a t the end of the s t imng rod rather than of sensations per se in the fingers, joints, and muscles.
Katz (cited in Krueger, 1982) observed that the senses vary in the degree to which the resulting percepts are experienced as part of the self (are "phenomenally subjective") or external to the self (are "phenomenally objective"). Vision is the most object-sided sense, for most visual experience is referred to per- ceptual space beyond the bodily self. At the opposite extreme are the interoceptive senses (hunger, thirst, etc.) and pain (Krueger, 19821, for the perceptual experience is of "sensations" within the phenomenal body. This distinction between the phe- nomenally subjective and phenomenally objective is purely a descriptive one, there being little theoretical import in it. I t is most useful in the description of touch experience, for the sense of touch is intermediate between vision and the interoceptive senses in terms of how often perceptual experience is referred to either the subjective or objective poles. The objective pole is favored when the subject is allowed to explore an object actively and when the skin surface making contact with the object is that normally used for tactual exploration (Gibson, 1966; Krueger, 1970, 1982; Weber, 184611978). Conversely, the sub- jective pole is favored when body loci such as the inside of the nose or ear are passively touched (Gibson, 1966; Krueger, 1970, 1982; Weber, 184611978). Especially interesting are the situa- tions where one part of the body touches another. If one part, like the fingertip, favors the objective pole while the second favors the subjective pole, the resultant touch impressions are referred primarily to the latter (Krueger, 1982). If one part is moved across the surface of another, the objective pole dominates for the moving part and the subjective pole for the stationary part.
When vision and touch are used together, the "externali- zation" of tactual experience becomes especially compelling (Krueger, 1970), presumably because vision, which is the more object-sided of the two senses, dominates over touch. (See Chapter 25 by Welch & Warren for a discussion ofintersensory integration and conflict.) When one touches an object with a probe while viewing the tip of the probe, one "feels" the probe making contact almost as if i t were one's fingertip. Similarly, when one is ma- nipulating an object with pliers or tongs, one has an impression of "touching" the object that is not unlike grasping i t with the bare hand. Yet another example is the experience that skilled technicians have in working under a dissecting microscope: The dissecting tools come to be felt a s extensions of one's hands and fingers. I t is this sense of transparent operation ("operator presence" or "telepresence") that Corker, Mishkin, and Lyman (1980) and Minsky (1980) believe is essential for or results from the skilled operation of remote manipulators, such as those used in space exploration, in medical applications, and in the
PERCEPTUAL ORGANIZATION AND COGNITION
handling of hazardous materials (for an insightful discussion of externalization and telepresence see Dennett, 1978).
3. TACTILE PERCEPTION
3.1. Tactile Pattern Perception
3.1 . I . Spatial and Temporal Filtering of Cutaneous Process- ing. Like human vision, computer image display systems, television, and other image processing systems, the cutaneous sense is limited in its pattern sensing capability by both its spatial sensitivity and its temporal sensitivity. Surely other factors, such as attentional and cognitive resources, do a t times limit tactile perception (see Loomis, 1981b; Millar, 19811, but spatial sensitivity and temporal sensitivity are of special im- portance, for they place quantifiable limits on perceptual capacity and dictate how best to transmit information through the cu- taneous sense; when these other limiting factors are minimized, the way to achieve optimal information transfer is to match the spatial and temporal display parameters to the spatial and temporal sensitivities of the cutaneous sense.
3.1.1.1. Linear Systems Analysis. The concepts of linear systems analysis and, in particular, of Fourier analysis are valuable for understanding how cutaneous spatial sensitivity and temporal sensitivity exert their effects on tactile pattern perception, just as these concepts have contributed greatly to an understanding of vision (Campbell & Green, 1965; Cornsweet, 1970; de Lange, 1958; Ginsburg, 1978; Graham, 1980; Kelly, 1979; Schade, 1956; Sekuler, 1974; Watson, 1983; Watson & Ahumada, 1983; Wilson & Bergen, 1979). In the context of touch, the essential idea is that the earlier stages of cutaneous processing can be conceived as constituting a spatiotemporal filter acting upon the stimulus that is applied to the skin. Some of the spatial and temporal information within the stimulus is attenuated partially or totally as a consequence of the filtering action of cutaneous processing; accordingly, the "stimulus" for the higher stages of perceptual processing is some degraded form of the stimulus a t the skin. Linear systems analysis makes it possible to predict the response to an arbitrary stimulus pro- vided that the filter can be assumed linear and that the filter function is known. Even though the assumption of linearity is unlikely to hold strictly for cutaneous sensing, linear systems analysis affords an approximate description of system behavior as well a s providing elements of a theory of tactile perception (see Bliss & Macurdy, 1961; von Bekbsy, 1955,1959,1967).
There are two alternative ways of representing (1) the stimulus, (2) the spatiotemporal filter of cutaneous processing, and (3) the output of the filter that comprises the "stimulus" for the higher brain centers involved in perception. The first way is simply to represent each as a function of three orthogonal dimensions (time and the two spatial dimensions of width and length measured on some extended surface of the skin). The stimulus pattern would then be represented as a function, s(x,y, t), where for touch the function value a t each spatial location (x,y) might correspond to the height of a raised stimulus (like a braille character), to the deformation of the skin, or to the in- stantaneous amplitude of a stimulator in an array ofvibrotactors. The filter function f(x,y,t)is referred to in the spatiotemporal domain as the impulse response function; it is the spatiotemporal response of the cutaneous sense (expressed in the same coor- dinates as the input) corresponding to a single point stimulus located a t the origin of space-time. Following Watson and Ahu-

TACTUAL PERCEPTION 31 -5
mada (1983), the response dx,y, t) to an arbitrary stimuluss(x,y, t) is given by the convolution of the stimulus function and the impulse response function, expressed as
The second way of representing the stimulus, filter function, and response is in terms of the Fourier transforms of the spa- tiotemporal functions given above. The Fourier transform of any three-dimensional spatiotemporal fimction g(x,y, t ) is given by
where w is temporal frequency, and u and v are dimensions of spatial frequency. The response transform R(u, u, w) is simply the product of the stimulus transform S(u, u, w) and the filter transform F(u, u, w) (referred to as the transfer function), as given below:
In the case of touch, the transfer function specifies how the filtering of cutaneous processing attenuates the constituent spatial and temporal frequencies of the stimulus pattern. If known, the transfer function for a given body locus would exhibit a falloff in both the higher spatial and temporal frequencies. A filter with only a high frequency falloff is termed a low-pass filter. The upper spatial (or temporal) frequency (f,) a t which the transfer function amplitude corresponds to some criterion value (e.g., 0.5) specifies the spatial (temporal) resolution or bandwidth of the low-pass filter. If, in addition, there is a falloff in the transfer function amplitude for lower spatial and/or tem- poral frequencies, with a corresponding lower limiting frequency (fi), then the bandwidth of this "bandpass" filter would be f, - f i or, expressed in octaves, would be logn( f,lfi).
For more detailed expositions of two- and three-dimensional Fourier analysis and its application to the study of vision, the reader should consult Ginsburg (1978), Graham (1980), Rzesz- otarski, Royer, and Gilmore (1983), Royer, Rzeszotarski, and Gilmore (19831, Watson (1983), Watson and Ahumada (19831, and Chapters 4,6,7, and 34 of this Handbook. Thorough treat- ments of Fourier analysis can be found in Bracewell (1978) and Goodman (1968).
3.1.1.2. Determinations of Spatial and Temporal Sensitiv- ity. As a first step toward a comprehensive understanding of tactile pattern perception, knowledge is needed of the stimulus information lost as the result of the spatiotemporal filtering of cutaneous processing; hence, specification of spatiotemporal sensitivity a t each region of the skin surface is required. Un- fortunately, our present knowledge consists only of fragmentary results from isolated psychophysical and physiological studies. These results are briefly considered in what follows. A fuller discussion of some of these findings can be found in Chapter 12 of this Handbook, by Sherrick and Cholewiak.
Our discussion of spatiotemporal sensitivity treats the spa- tial and temporal components separately because the psycho-
physical literature has so treated them. However, by analogy with what is known about spatiotemporal vision (Kelly, 1979; Koenderink & van Doorn, 1979; Wilson & Bergen, 1979), the spatiotemporal filter of cutaneous processing may not be sep- arable into independent spatial and temporal filters. Rather temporal frequency sensitivity may depend somewhat on spatial frequency and vice versa, a likely possibility since physiological research on mechanoreceptive afferents hints a t the existence of functionally distinct spatiotemporal channels, analogous to the sustained and transient channels of vision. Thus. caution is required in interpreting the generality of a given experimental finding dealing with either spatial or t.empora1 sensitivity. 3.1 .I .2 (a). SPATIAL SENSITIVITY. TO date, no psychophysical studies permit a complete characterization of cutaneous spatial filtering for even a single body locus. The seemingly obvious way would be to measure the spatial transfer function by pre- senting spatial sine-wave gratings varying in depth to the skin. ow ever, the fabrication of such stimuli has presented a major obstacle. Thus, a t this point the only direct measurements of cutaneous spatial sensitivity available are those from experi- ments using conventional two-point targets and square-wave spatial gratings of constant amplitude. The drawback to using such stimuli is that they consist of more than one spatial fre- quency component (see Kelly, 1965; Loomis, 1979); as such they do not permit independent variation of li-equency and amplitude and thus preclude an analytical assessment of the spatial filter function. Despite their shortcomings, each type of stimulus has contributed something to our knowledge of cutaneous spatial sensitivity.
The two-point threshold is probably a good indicator of relative spatial resolution as a function of body locus. The ex- tensive investigation by Weinstein (1968) constitutes the de- finitive work on this subject; the results are given in Figure 12.16 in Chapter 12, by Sherrick and Cholewiak.
Square-wave gratings with periods close to the cutaneous resolution limit are functionally equivalent to sine-wave gratings because their higher spatial frequency components are filtered out in the cutaneous processing. Consequently, they permit a good characterization of spatial sensitivity in the vicinity of the resolution limit (the limiting spatial period or its inverse, the limiting spatial frequency). Johnson and Phillips (1981) measured the sensitivity of the index distal pad to square-wave gratings (gratings with parallel grooves equal in width to the ridges) that varied in spatial period. The observer's task was to respond whether two gratings presented in succession were of the same or different orientation. An. additional variable was the degree of skin indentation. The results of the experiment are given in Figure 31.1. Discrimination performance, averaged over the three observers, is expressed in terms of the bias-free measure, d' (D. M. Green & Swets, 1966; Johnson, 1980a, 1980b). It is evident that discrimination performance increases ap- proximately linearly with grating period for periods greater than 1.0 mm and that the 500-pm indentation condition gave the poorest performance. The grating periods corresponding to 75% correct performance were 2.25, 1.84, and 1.68 mm for the 500-, 900-, and 1200-km indentation conditions, respectively.
An indirect determination of cutaneous spatial sensitivity derives from a comparison of tactile and visual spatial resolution where the used in the vision task were optically low- pass filtered prior to viewing (Loomis, 1981a; Loomis, Note 1). The resolution targets were two-bar Konig patterns (Westheimer, 1977) that varied in size but had the constant proportions shown in the inset of Figure 31.2. The tactile stimuli were sensed by

PERCEPTUAL ORGANIZATION AND COGNITION
0 1 2
GRATING PERIOD (millimeters)
Figure 31.1. Tactile discrimination performance in a grating resolution task as a function of spatial period and skin indentation. The stimuli were square-wave gratings (gratings with parallel grooves equal in width to the ridges). They were presented to the distal pads of the right index fingers of three observers for 2.5 sec. Spatial period of the gratings is indicated along the abscissa, and skin indentation i s given as the parameter. A trial consisted of the presentation of two gratings in sequence. The two gratings were presented in either the same or orthogonal orientations (with the grooves lying parallel or perpendicular to the axis of the finger), and the task of the subject was to discriminate same from different trials. Discrimination performance, averaged over the three observers, is expressed in terms of the bias-free measure, d'. Discrimination performance increases approximately linearly with grating period for periods greater than 1.0 mm Uohnson & Phillips, 1981).
the distal pad of the right index finger. Prior to filtering, the optical stimuli were of the same spatial dimensions (height and width) as the tactile stimuli (except for elevation of the latter in the third dimension). The task of the subject was to discrim- inate between two orthogonal orientations of the bar target. The average results for 11 subjects (Loomis, 1981a; Loomis, Note 1) are given in Figure 31.2; they were obtained when the optical filter was adjusted so that its two-dimensional Gaussian impulse response function, given by exp(-n(x2 + y2)~2) , had a scaling factor c equal to 0.163mm-I or a full width a t half- amplitude of 5.8 mm. The results of a control experiment (Loomis, Note 1) showing that varying viewing distance had minimal effect on performance in the visual task indicated that the optical filter alone was controlling visual performance with negligible contribution from the spatial filtering of visual processing. The implication is that the optical filter used to blur the visual patterns matched the intrinsic filter of cutaneous processing. Thus the spatial impulse response of the cutaneous filter cor- responding to the center of the distal pad is well approximated by a Gaussian of 5.8 mm full width a t half-amplitude. Alter- natively, the intrinsic spatial filter can be specified by its mod- ulation transfer function, which is the normalized Fourier transform of its impulse response; the modulation transfer function in this case is given by exp( - n(u2 + v2)/c2), where u and v are orthogonal dimensions of spatial frequency. Again with c equal to 0.163 mm-l, the modulation transfer function is of that of a low-pass spatial filter that falls to half its peak value at a spatial frequency of 0.77 cycle cm-'.
A third source of information on spatial sensitivity comes from physiological investigations of mechanoreceptive afferents
in humans and monkeys. Because the work has been concerned with characterizing the spatial and temporal properties of single peripheral nerve fibers, i t does not permit extrapolation to the spatial sensitivity of the cutaneous sense as a whole. However, the work is of fundamental importance because of its elucidation of the mechanisms underlying sensibility to mechanical stim- ulation in the glabrous skin of the hand.
In work with both humans and monkeys, single mechan- oreceptive afferent fibers were recorded by inserting electrodes into the median or ulnar nerve. The research has established the existence of four distinct classes of mechanoreceptive af- ferent~ in humans (Johansson, 1976; Johansson & Vallbo, 1979; Vallbo & Johansson, 1976,1978) and three in macaque monkeys (Darian-Smith & Kenins, 1980; Johnson, 1983; Johnson & Lamb, 1981; Phillips & Johnson, 1981a, 1981b).
,The first class of afferent fibers is referred to as slowly adapting type I (SA I) in humans and slowly adapting (SA) in monkeys. These fibers respond vigorously to changing stimu- lation of the skin but also exhibit sustained spike activity to steady indentations and are thus said to be slowly adapting. They have the smallest receptive fields of all the classes of afferents. The second class, found only in humans, is the slowly adapting type I1 (SA II). These units have much larger receptive fields than do the SA I fibers; they respond optimally to skin
1.0 1.5 2.0
SEPARATION, S (millimeters)
Figure 31.2. Tactile and visual performance on a spatial resolution task. The resolution targets were Ki5nig two-bar stimuli varying in overall size (and hence, separation S). The shape of one such stimulus is represented in the inset. On each trial, the observer had to discriminate between two or- thogonal orientations of the stimulus. The tactile stimuli were raised patterns with the separations given on the abscissa. The stimuli were sensed by the distal pad of the right index finger. Theoptical patterns used were photographic transparencies of these same stimuli and had the same physical separations between bars as shown on the abscissa. The visual stimuli were produced by back-illuminating the transparencies with collimated light and then low- pass filtering the collimated outputs by means of two diffusers in series; they were viewed foveally against a dark background. The point-spread function of the optical low-pass filter was well approxirnated by a two-dimensional Gaussian with full width at half amplitude equal to 5.8 mm. The two psy- chometric functions are the averages of 1 1 observers. The error bars represent plus and minus one standard error of the mean. The congruence of the two psychometric functions indicates that the intrinsic spatial filter of cutaneous processing for the distal finger pad can be approximated by a two-dimensional Gaussian with full width at half amplitudeequal to 5.8 mm (Loomis, 1981a,- Note 1).

- TACTUAL PERCEPTION
stretch. The third class is referred to as rapidly adapting (RA) or, in the monkey, sometimes as quickly adapting (QA), for these units do not give a sustained response to steady inden- tations. In monkeys and probably in humans the RA fibers have somewhat larger receptive fields than do the SA fibers. The remaining class of fibers, both in humans and in monkeys, is the Pacinian type (PC). The PC afferents are associated with the Pacinian corpuscles that lie in the deeper subcutaneous layer of the skin. These units have very large receptive fields and respond differentially to a higher range of temporal fre- quencies than any of the other classes.
A study by Johnson and Lamb (1981) nicely illustrates the functional significance of the different receptive field sizes of the SA, RA, and PC afferents in the monkey. They moved braille- like raised patterns across the surface ofthe skin while recording from each of the different types of units. By associating the response of the unit with each position of the pattern relative to the center of the unit's receptive field, they were able to portray what a dense spatial array of independent fibers would be signaling to a more proximal stage of processing. A sample of their results is given in Figure 31.3. It can be clearly seen that an array of SA fibers has the potential for transmitting the most detailed spatial information about the patterns, while the PC units would convey the least information. Expressed differently, a bundle of independent SA fibers would have the highest spatial bandwidth, whereas a bundle of PC fibers would have the lowest. One would expect that the spatial information transmitted by these fibers is preserved up to the somatosensory cortex, although this has yet to be shown.
Since our interest here is to arrive a t a specification of the spatial sensitivity of the cutaneous sense as a functional whole, we note only in passing some of the factors that underlie cu- taneous spatial sensitivity and its variation with body locus. These are: (1) the static mechanical properties of the skin (Phil- lips & Johnson, 1981a, 1981b); (2) traveling waves of vibration resulting from dynamic stimulation (Moore, 1970; von BBkBsy, 1955); (3) the innervation density and spatial sensitivity of the different classes of mechanoreceptors (Darian-Smith & Kenins, 1980; Johansson & Vallbo, 1979; Johnson & Lamb, 1981; Phillips & Johnson, 1981a, 1981b; Vallbo & Johansson, 1976, 1978); and (4) cortical magnification, defined as the representational area in the somatosensory cortex divided by the area of skin surface being represented (Penfield & Rasmussen, 1950; Sur, Merzenich, & Kaas, 1980). 3.1.1.2 (b). TEMPORAL SENSITIVITY. Knowledge of cutaneous temporal sensitivity, like that of spatial sensitivity, derives from a variety of approaches. The most direct is the psycho- physical investigation of vibration sensitivity by Verrillo and his colleagues (Capraro, Vemllo, & Zwislocki, 1979; Gescheider & Verrillo, 1979; Verrillo, 1968; Verrillo & Gescheider, 1979). They have measured absolute sensitivity to vibration as a func- tion of temporal frequency, with most of the work concentrating on two body loci: the thenar eminence (the fleshy mound at the base of the thumb) and the distal pad of the finger. The results of one experiment with the thenar eminence are given in Figure 12.7 in Chapter 12, by Shemck and Cholewiak. These sensitivity functions constitute estimates of the transfer function of the overall cutaneous temporal filter for the experimental conditions under which the data were obtained. However, this work has established very clearly that in fact there is no single overall temporal filter for a given body locus, since the shape of the function depends greatly on the experimental conditions, such as contactor size, observer's state of adaptation, and temperature
Figure 31.3. Reconstructed responses of slowly adapting (SA), rapidly adapting (RA), and Pacinian (PC) mechanoreceptive afferents in the monkey finger pad. The stimuli were the braille-like patterns in the left column, the dots of which were 1.2 mm in diameter. Thedata wereobtained by recording the action potentials of each unit as a function of all possible positions of a stimulus pattern relative to the unit's receptive field. The response patterns shown were reconstructed by plotting a dot for each action potential at a spatial position corresponding to that of the stimulus pattern. These recon- structed responses are representative of the simultaneous response profiles of a dense mosaic of like units under the assumption that the units respond independently. The results indicate that a mosaic of independent SA units would have the highest spatial bandwidth and that a mosaic of independent PC units would have the lowest (Johnson & Lamb, 1981 ).
of the skin. More important, the work has demonstrated that these variations in shape can be explained by assuming that the overall filter function is the envelope of the transfer functions of a number of component mechanisms, one of which corresponds closely with the known vibratory sensitivity of the Pacinian corpuscle. One hopes that the psychophysical methods have sufficient analytical power to specify the temporal transfer function of that mechanism or mechanisms involved in the coding of finer spatial patterns, such as braille characters.
A second source of knowledge about temporal sensitivity comes from physiological investigations of the different classes of mechanoreceptive units in humans and monkeys. As was true in connection with spatial sensitivity, the knowledge gained from research on first-order afferents can tell us about the tem- poral sensitivity of the cutaneous system as a whole only under the assumption that the temporal sensitivities of these units characterize the sensitivities of the entire channels of which they are a part.

PERCEPTUAL ORGANIZATION AND COGNITION
The most definitive research on the temporal response of mechanoreceptive units is work reported by Freeman and Johnson (1982a, 198213). They studied the response activity of SA, RA, and PC fibers in monkeys as a function of vibration frequency and amplitude. They also developed equivalent circuit models that predicted the response behavior of each class of units over a wide range of the two stimulus variables. Their work indicates that, when conceived as temporal bandpass filters, the SA fibers have a center frequency of approximately 20 Hz and the RA fibers a center frequency of approximately 40 Hz. In conjunction with other results (Menenich & Harrington, 1969; Talbot, Darian-Smith, Kornhuber, & Mountcastle, 19681, their findings indicate that the PC units are also bandpass filters with a center frequency of about 250 Hz.
3.1.2. Tactile Displays. Much of the research on tactile perception has employed electronic tactile displays. The most widely used is the Optacon (optical-to-tactile converter) (Bliss, 1969; Bliss, Katcher, Rogers, & Shepard, 1970; Linvill & Bliss, 1966). I t was originally designed as a reading aid for the blind; when operated as such, the optical system of the hand-held camera images print or other optical patterns onto the array of photosensors that make up the electronic retina. The output signal from the camera then drives a spatially corresponding arrav of vibrotactors that stimulate the ventral surface of the index finger. In its research applications, the Optacon display more commonly has been driven by computer. The display con- sists of 144 piezoelectric bimorph reed stimulators arranged in 24 rows (on 1.17-mm centers) and six columns (on 2.4-mm ten-
ters) giving total array dimensions of 2.7 cm long by 1.2 cm wide. During activation, the tips of the stimulators protrude from small holes in the concave surface on which the ventral surface of the index finger rests. Vibration frequency of an activated stimulator is 230 Hz. Besides the ~roduction model Optacon, Bliss and his associates have experimented with arrays of airjets (Bliss, Crane, Link, & Townsend, 1966) and various other vibrotactile arrays including the 8-by-12 prototype of the Optacon (Linvill & Bliss, 19661, a two-finger double Optacon display (Hill, 1974), and an Optacon display with double the normal column density (Hill, 1974).
Another display system that has seen considerable use in research is the Tactile Vision Substitution System (TVSS). The version that has been used in most of the work (Bach-y-Rita, 1972; Beauchamp, Matheson, & Scadden, 1971; Collins, 1970; Daley & Singer, 1975; Jansson, 1983; Loomis, 1974; Scadden, 1971; White, 1970; White, Saunders, Scadden, Bach-y-Rita, & Collins, 1970) has a display consisting of 400 solenoid-driven stimulators arranged in a square 20-by-20 matrix with vertical and horizontal spacing of 12 mm; vibration frequency is 40 Hz ( 6 0 . H ~ in the case of Daley & Singer, 1975). Other versions have included a 10-by-10 vibrotactile display for the abdomen (Scadden, 1973) and a 32-by-32 electrocutaneous display (Collins & Madey, 1974; Jansson, 1983) also for the abdomen.
Most of the other tactile displays that have been developed are similar to the vibrotactile versions of the TVSS in that they use piezoceramic or solenoid stimulators that are much larger than the stimulators of the Optacon and thus capable of im- parting much more energy to the skin; however, because of the large stimulator size, tactor arrays such as these are suitable only for use with skin surfaces larger than that of the finger. Most of these other displays have been computer controlled. They include the 8-by-8 display of Cholewiak and Shenick (1981) capable of conforming to steeply contoured skin, the 15-by-15 display of Kirman (197413) used in stimulating the ventral sur-
faces of the fingers of one hand, the 12-by-18 matrix of the Electrophthalm used in stimulating the forehead (Jansson, 19831, and displays of varying array size used against the palm, abdomen, and back in work by Shimizu, Wake, and their col- leagues (Kikuchi, Yamashita, Sagawa, & Wake, 1979; Saida, Shimizu, & Wake, 1982; Shimizu, 1982; Shimizu, Saida, Wake, Nakamura, & Ohm, 1982).
Finally, there is the tactile display distinguished by its use of a steerable water jet (Collins & Madey, 1974). The jet is scanned over a watertight membrane in contact with the skin surface by motors controlling its vertical and horizontal position. This display has been used in experiments on tactile spatial sensitivity (Shimizu & Wake, 1982) and recognition of Japanese characters (Shimizu & Wake, 1983).
3.1.3. Legibility of Tactile Characters. Since the turn of the century much empirical research has been devoted to studying the legibility of tactile characters. Much of this research has dealt with braille characters, with the result of several extensive investigations (Uniform Type Committee, 1913,1915) contributing to the adoption of a braille standard for the United States (Bledsoe, 1972). A standard for the entire English- speaking world was established a t the London Type Conference in 1932 (Zickel & Hooper, 1957). The result, Standard English Braille, has 63 characters based on a cell three dots high and two dots wide; Figure 31.4 gives the 26 alphabetic characters, among others. The production standard specifies vertical and horizontal separations between dot centers of 2.3 mm, dot base diameter of 1.5 mm, and dot height (in the third dimension) of 0.43 mm (Nolan & Kederis, 1969; Zickel & Hooper, 1957). In terms of readability, these values have proven to be well chosen (Meyers, Ethington, & Ashcroft, 1958; Zickel & Hooper, 1957).
Other investigations of braille legibility include Biirklen (1932), Foulke (1982), Loomis (1982), and Nolan and Kederis (1969). Given the upper limit of 63 characters imposed by the present 2-by-3 braille cell, there has also been some research on the feasibility of expanding the braille code using either a 2-by-4 or 3-by-3 braille cell (Foulke, 1973).
The remainder of the work on legibility has dealt with symbols for tangible graphics (Gill & James, 1973; Nolan & Morris, 19711, with Roman letters (Craig, 1974, 1976, 1977, l978,1979,1980,1981,1982a, 198213; Johnson & Phillips, 1981; Kikuchi et al., 1979; Loomis, 1974,1981a, 1982; Phillips, John- son, & Browne, 1983; Rogers, reported in Bliss, 1974; Weisen- berger & Craig, 1982), and with several different types of J a p anese letters (Sagawa, Yamashita, Kikuchi, Yamashita, &Wake, 1977; Saida et al., 1982; Shimizu, 1982; Shimizu e t al., 1982; Shimizu & Wake, 1983). In general, the concern of research on letter recognition has been less with the legibility of letters per se and more with understanding tactile character recognition and with ways of improving the effectiveness of electronic tactile displays.
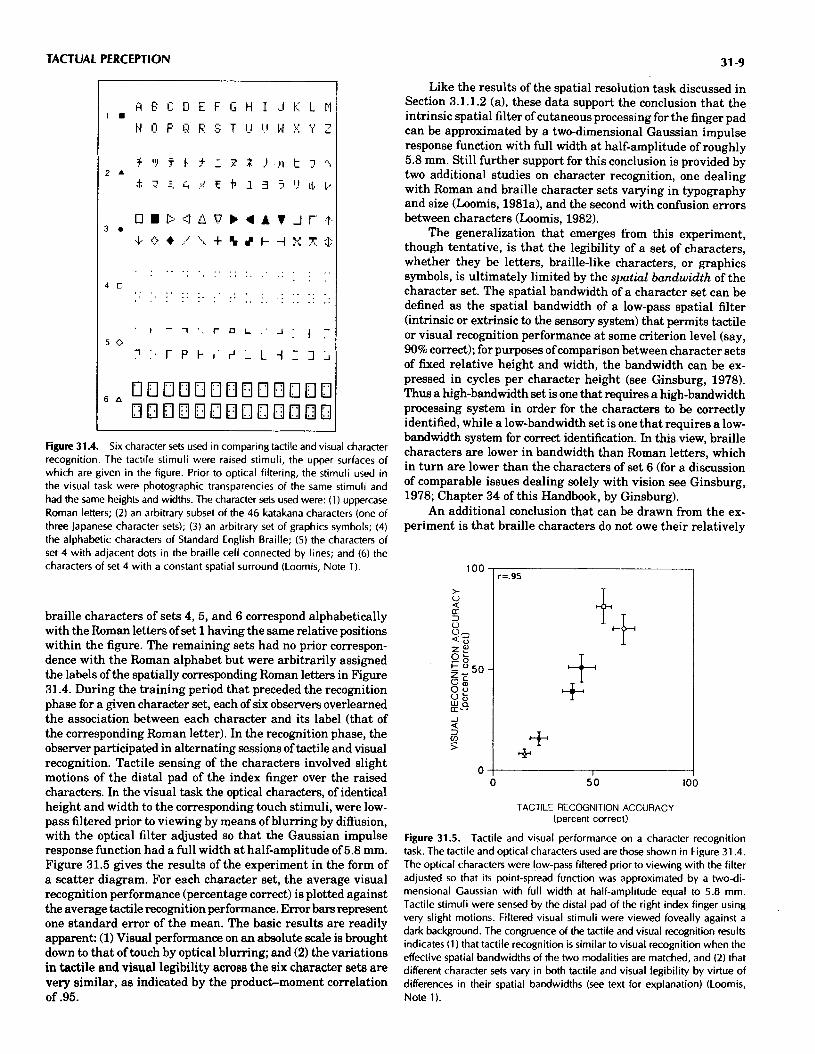
Because research on each of the three types of characters (letters, braille, graphics symbols) has proceeded virtually in- dependently, the general principles underlying legibility have been slow to emerge. One recent experiment pointing to such a principle compared the legibility of seven different character sets presented to observers in each of two ways: as raised tactile stimuli and as visual stimuli that were optically filtered of their higher spatial frequencies (Loomis, Note 1). Six of the character sets used are shown in Figure 31.4. (The seventh was similar to set 6 and is excluded from the present discussion.) The height of the character space within which all of the char- acters of sets 1 through 4 could be inscribed was 5.8 mm. The
TACTUAL PERCEPTION
Figure 31.4. Six character sets used in comparing tactile and visual character recognition. The tactile stimuli were raised stimuli, the upper surfaces of which are given in the figure. Prior to optical filtering, the stimuli used in the visual task were photographic transparencies of the same stimuli and had the same heights and widths. The character sets used were: (1) uppercase Roman letters; (2) an arbitrary subset of the 46 katakana characters (one of three Japanese character sets); (3) an arbitrary set of graphics symbols; (4) the alphabetic characters of Standard English Braille; (5) the characters of set 4 with adjacent dots in the braille cell connected by lines; and (6) the characters of set 4 with a constant spatial surround (Loomis, Note 1).
braille characters of sets 4 ,5 , and 6 correspond alphabetically with the Roman letters of set 1 having the same relative positions within the figure. The remaining sets had no prior correspon- dence with the Roman alphabet but were arbitrarily assigned the labels of the spatially corresponding Roman letters in Figure 31.4. During the training period that preceded the recognition phase for a given character set, each of six observers overlearned the association between each character and its label (that of the corresponding Roman letter). In the recognition phase, the observer participated in alternating sessions of tactile and visual recognition. Tactile sensing of the characters involved slight motions of the distal pad of the index finger over the raised characters. In the visual task the optical charaders, of identical height and width to the corresponding touch stimuli, were low- pass filtered prior to viewing by means of blurring by diffusion, with the optical filter adjusted so that the Gaussian impulse response function had a full width a t half-amplitude of 5.8 mm. Figure 31.5 gives the results of the experiment in the form of a scatter diagram. For each character set, the average visual recognition performance (percentage correct) is plotted against the average tactile recognition performance. Error bars represent one standard error of the mean. The basic results are readily apparent: (1) Visual performance on an absolute scale is brought down to that of touch by optical blurring; and (2) the variations in tactile and visual legibility across the six character sets are very similar, as indicated by the product-moment correlation of .95.
Like the results of the spatial resolution task discussed in Section 3.1.1.2 (a), these data support the conclusion that the intrinsic spatial filter of cutaneous processing for the finger pad can be approximated by a two-dimensional Gaussian impulse response function with full width a t half-amplitude of roughly 5.8 mm. Still further support for this conclusion is provided by two additional studies on character recognition, one dealing with Roman and braille character sets varying in typography and size (Loomis, 1981a), and the second with confusion errors between characters (Loomis, 1982).
The generalization that emerges from this experiment, though tentative, is that the legibility of a set of characters, whether they be letters, braille-like characters, or graphics symbols, is ultimately limited by the sj>atial bandwidth of the character set. The spatial bandwidth of a character set can be defined as the spatial bandwidth of a low-pass spatial filter (intrinsic or extrinsic to the sensory system) that permits tactile or visual recognition performance a t some criterion level (say, 90% correct); for purposes of comparison between character sets of fixed relative height and width, the bandwidth can be ex- pressed in cycles per character height (see Ginsburg, 1978). Thus a high-bandwidth set is one that requires a high-bandwidth processing system in order for the characters be correctly identified, while a low-bandwidth set is one that requires a low- bandwidth system for correct identification. In this view, braille characters are lower in bandwidth than Roman letters, which in turn are lower than the characters of set 6 (for a discussion of comparable issues dealing solely with vision see Ginsburg, 1978; Chapter 34 of this Handbook, by Ginsburg).
An additional conclusion that can be drawn from the ex- periment is that braille characters do not owe their relatively
TACTILE RECOGNITION ACCURACY (percent correct)
Figure 31.5. Tactile and visual performance on a character recognition task. The tactile and optical characters used are those shown in Figure 31.4. The optical characters were low-pass filtered prior to viewing with the filter adjusted so that its point-spread function was approximated by a twodi- mensional Gaussian with full width at half-amplitude equal to 5.8 mm. Tactile stimuli were sensed by the distal pad of the right index finger using very slight motions. Filtered visual stimuli were viewed foveally against a dark background. The congruence of the tactile and visual recognition results indicates (1) that tactile recognition is similar to visual recognition when the effective spatial bandwidths of the two modalities are matched, and (2) that different character sets vary in both tactile and visual legibility by virtue of differences in their spatial bandwidths (see text for explanation) (Loomis, Note 1).

PERCEPTUAL ORGANIZATION AND COGNITION
high legibility to their punctographic nature, as once was sug- gested (Merry, 1937). The comparison of sets 4 and 5 suggests that creating tactile characters out of line segments rather than points does not reduce their legibility, even though the normal braille characters have a perceptibly different texture than the line braille characters. A similar result for uppercase letters was found by Austin and Sleight (1952) and Loomis (1981a).
In summary, the results suggest that, a t least under the conditions of this experiment, tactile recognition of simple two- dimensional patterns is limited by cutaneous spatial resolution, a conclusion supported by other studies (Johnson & Phillips, 1981; Loomis, 1974, 1981a, 1982; Phillips et al., 1983). On the other hand, there must be some additional factors that limit tactile pattern perception under other conditions (Loomis, 1981b; Millar, 1981). For example, perceptual learning is evident in virtually every recognition task, sometimes resulting in con- siderable improvements in performance (e.g., Loomis, 1980). In addition, there are large individual differences in recognition performance (Bliss, 1978; Craig, 1977; Loomis, 1974) that cannot be accounted for in terms of basic sensitivity measures. Finally, there are small but consistent differences between tactile rec- ognition and band-limited visual recognition that have no ap- parent explanation in terms of spatial sensitivity (Loomis, 1981a, 1982). A full elucidation of these facts awaits further investi- gation.
3.1.4. Effect of Stimulus Size. In situations where cuta- neous spatial resolution is suspected of limiting tactile recog- nition performance, the variable of greatest heuristic value is stimulus size, for increasing the size of the patterns ought to improve performance. This is so because increasing the size of a pattern corresponds, in the Fourier domain, to an isotropic rescaling of the two orthogonal dimensions of spatial frequency along which the pattern spectrum is represented (Bracewell, 1978, pp. 101,244). If the higher spatial frequencies of a pattern that are critical for its recognition are being lost as the result of low-pass spatial filtering, increasing the size of the pattern causes the pattern spectrum to be shifted to lower frequencies; if the pattern is made sufficiently large, the information nec- essary for recognition gets through the filter. If some factor other than spatial resolution (e.g., attentional resources) should be thought to limit performance, variation in pattern size would not be expected to affect performance, a t least not without a theory linking size and that factor.
The results of several character recognition experiments in which stimulus size was varied are given in Figure 31.6. In all cases, the characters were sensed by the index finger. At the left of the figure are the data for raised uppercase Roman letters. In the scan condition of Phillips et al. (1983), four ob- servers examined the letters with their fingers for up to 4 sec without constraint on the manner of examination (e.g., moving the finger and using the fingertip). The remaining data were obtained under more controlled conditions of stimulus Dresen- tation. Either the letters were presented statically to the center of the finger pad (Johnson & Phillips, 1981; Phillips et al., 1983), or observers were permitted to move the finger-pad very slightly over the letters, keeping them approximately centered on the finger pad (Loomis, 1981a; Loomis, Note 2). The data of Johnson and Phillips (19811, Loomis (1981a; Loomis, Note 2), and Phillips et al. (1983) are mean performance values obtained for five, nine, and four observers, respectively.
On the right of the figure (larger characters) are shown the results of two experiments concerned with the recognition of uppercase Roman letters using the Optacon. Bliss (1969)
~~ -- p - ~ ~ -
RAISED LETTERS
+ = Johson 6 PhiHbs (1981) w = Loomis (198la, Nole 2) x = Phillips. Jolmson 6 Browne (1983) static o = Phillips. JohnSon 6 Browne (1983) scan
= Bliss (1969)
-L 2 3 5 10 20 30
CHARACTER HEIGHT (millimeters)
Figure 31.6. Tactile character recognition performance as a function of character size. On the left of the figure are the psychometric functions for raised uppercase Roman characters sensed by the distal pad of the finger. On the right are the psychometric functions for uppercase Roman characters presented to the finger by the vibrotactile display of the Optacon. The psy- chometric functions increase with character size and appear parallel with the abscissa scaled logarithmically. The results also indicate that small letters displayed on the Optacon are less easily recognized than raised letters of the same size.
used an Optacon display differing slightly in physical dimensions from those of the production models. Two subjects attempted to recognize letters by scanning them with the camera; they were under no time constraint. Stimulus presentation in the experiment by Loomis (1980) was more controlled; letters were presented statically for 1.5 sec to the index finger.
Based on the limited evidence available, the psychometric functions for raised letters appear to be situated well to the left of those of letters displayed on the Optacon. A possible expla- nation for the difference in recognition accuracy might be that the Optacon stimulation excites a different class of mechano- receptive units, of lower spatial bandwidth, than do raised letters. Alternatively, the Optacon display could excite the same class of units but do so less effectively than raised letters.
The results for characters considerably more complex than Roman letters or braille are shown in Figure 31.7. In this ex- periment (Sagawa e t al., 1977) the 146 raised stimuli were a subset of kanji (Chinese) characters, one of several character sets used in written Japanese. The results are for one subject, who was given up to 90 sec on each trial to identify the character using the finger. The abscissa gives the character height (equal to the width). In addition to recognition accuracy, the figure gives the mean recognition time for each size of character. These results show that touch is not suited for the reading of kanji characters, presumably because of its limited spatial bandwidth.
3.1.5. Effect of Body Locus. Common experience tells us that certain body loci, such as the fingertip and tongue, give us much more information about finely detailed patterns than

TACTUAL PERCEPTION
other areas such as the forearm, thigh, and back. Weinstein (1968) and before him Weber (183411978,184611978) measured the two-point threshold across the surface of the body and found that it varied greatly, as exemplified by the approximate values of 3 mm and 40 mm for the finger pad and forearm, respectively (Weinstein, 1968). If one assumes the two-point threshold to be a measure of spatial resolution, then the clear suggestion is that tactile pattern perception varies with body locus by virtue of the variation in spatial sensitivity. Going further, if one makes the plausible assumption that the cutaneous spatial impulse response functions of different body loci have approximately the same shape, differing only by a scaling factor equal to the two-point threshold, then one predicts that the psychometric functions relating tactile recognition accuracy to pattern size will be identical for different body loci except for the same scaling factor. Stated differently, the prediction is that the psychometric functions for different body loci, when plotted against an abscissa of character height (or width) with logarithmic spacing, will be parallel. Thus, if 3 and 40 mm are taken as the respective two-point thresholds for the finger pad and forearm, then letters 6 mm high on the finger pad and 80 mm high on the forearm should be recognized with approximately equal accuracy as also should letters 4.5 mm and 60 mm high a t the two loci (assuming excitation of the mechanoreceptors a t the two loci to be properly matched). This predicted invariance parallels the work in vision relating spatial contrast, spatial sensitivity, and pattern perception to the cortical magnification factor as- sociated with different retinal eccentricities (Anstis, 1974; Ro- vamo & Virsu, 1979; Virsu & Rovamo, 1979).
No experiments have been reported that explicitly tested whether the psychometric functions relating tactile recognition accuracy to pattern size do indeed shift along the log size axis in accord with the two-point thresholds for different body loci.
h - - * - -
0 = Recogn~tion accuracy
S A = Reading fume
0 0 dZ0 CHARACTER HEIGHT (millimeters)
Figure 31.7. Tactile recognition performance as a function of the height of kanji characters. Kanji characters are the Chinese symbols used as one of the three Japanese character sets. The 146 raised stimuli in this experiment were a subset of kanji. The independent variable was the height (and width) of the characters. The subject in this experiment was given up to 90 sec on each trial to identify the character. Plotted are two functions, one giving the mean recognition accuracy and the other giving the mean response latency as a function of character size. In comparison with the results for raised Roman characters given in Figure 31.6, these results indicate that touch is not well suited for the reading of complex characters, like those of kanji (Sagawa, Yamashita, Kikuchi, Yamashita, & Wake, 1977).
Figure 31.8. Tactile stimuli used in an experiment on temporal resolution of patterns. The four matrices depict the four different patterns of activation of the Optacon display used in the experiment. In this work, only the upper 18 rows of the display were used. The matrices on the left represent the letters X and 0 and those on the right represent their spatial complements. The complement of a pattern is that stimulus that if activated at the same time as the pattern would result in activation of all the pins in the upper 18 rows of the display (Craig, 1982a).
The only studies that are even pertinent to this question are three that compared tactile perception of patterns of a single size a t several different body loci (Heller, 1977; Scadden, 1973; Zigler & Barrett, 1927). The three experiments found that the variations in recognition accuracy observed as a function of body locus agreed only roughly with the reported measures of spatial sensitivity. More systematic and controlled studies are needed to determine how tightly the variation in spatial sen- sitivity with body locus controls pattern recognition performance.
3.1.6. Temporal Resolution of Spatial Patterns. Just as the spatial filtering of cutaneous processing limits pattern percep- tion, so there is evidence that temporal filtering imposes limits. The best evidence is given by experiments on pattern perception using the Optacon display (Craig, 1982a); in this work, just the 18 rows of stimulators nearest the fingertip (out of 24 rows) were used for displaying patterns. (See Figure 31.8.) In the first experiment (Craig, 1982a, Exp. 3), one of the letters 0 and X was randomly selected for presentation on a given trial; a t some time before or aRer the onset of the letter, given by stimulus onset asynchrony (SOA), the letter's complement (activation of all 108 stimulators except those of the letter) was presented. (See Figure 31.8.) Both the letter and its complement were presented for 26 msec. (For SOAs of absolute value less than 26 msec, there was thus a period in which all 108 stimulators were activated.) The results are given in Figure 31.9. Positive values of onset asynchrony represent the letter preceding its complement, and negative values represent the complement preceding the letter. The data indicate that for onset asyn- chronies of absolute value less than 10 msec (or 16 msec of temporal overlap of the two patterns) there is some degree of resolution between the letter and its complement. However,

PERCEPTUAL ORGANIZATION AND COGNITION
STIMULUS ONSET ASYNCHRONY (milliseconds)
Figure 31.9. Tactile pattern discrimination performance as a function of the time between onset of a letter and its complement. The stimuli used in the experiment are represented in Figure 31 .8. On a given trial one of the target letters (Xor 0 ) and its complement were presented in rapid succession, each for 26 msec. Negative values of onset asynchrony along the abscissa indicate that the complement came first. Plotted are the mean discrimination values for four observers as a function of onset asynchrony. The drop in performance found when the letter and its complement are close together in time indicates considerable sluggishness in the cutaneous processing of spatial patterns (Craig, 1982a).
complete resolution (the absence of temporal integration) does not obtain until the complement precedes the letter by 30 msec and until the letter precedes the complement by some value exceeding 104 msec. The results indicate considerable slug- gishness in the cutaneous processing of spatial patterns. The asymmetry of the function in time might result from the shape of the temporal impulse response of cutaneous processing, or it might reflect two or more functionally distinct processes op- erating to determine recognition performance.
A second experiment also made use of spatially comple- mentary patterns, this time in a masking situation (Craig, 1982a; Exp. 2). Target letters were presented for 26 msec; 4 msec after their termination, a "masking" stimulus came on. This masker consisted of two complementary patterns that could be presented independently. The independent variable in the experiment was the onset asynchrony between the two complementary halves of the masker. With no asynchrony, the two constituted a uniform field of stimulation, which in the context of masking Craig has termed an energy mask, whereas, when separated in time, the two halves each constituted what Craig has termed apattern mask. The distinction is important, for Craig (1982b) has found that pattern masks interfere more with the recognition of target patterns than do energy masks. The purpose of this experiment was to determine the temporal course of recognition accuracy as the two halves were increasingly separated in time. Craig defined the difference in recognition accuracy with and without a mask as the amount of masking. The results of the experiment are given in Figure 31.10. As expected, when the two complementary halves were simultaneous, constituting an energy mask, the amount of masking was minimal. As the two halves were gradually separated in time, the amount of masking increased to a maximum when presumably both masker halves
were exerting influence (Craig, 1982b); for further temporal separations, masking decreased to the level obtained with just a single pattern mask. The time course of the increase in masking as the two patterns were increasingly separated is informative about the extent to which the two halves were effectively resolved at some stage in cutaneous processing. This experiment, using a completely different method,. corroborates the previous one in revealing some sluggishness in tactile pattern perception.
3.1.7. Tactile Display Modes. Much research has been devoted to studying the effectiveness of different modes of dis- playing two-dimensional patterns onto the skin. The motivation behind this work has been in part to optimize tactile commu- nication for the purpose of sensory substitution; the greater value of the work, however, lies in what it reveals about the functioning of the cutaneous sense.
Representations of some of the display modes that have been investigated are given in Figure 31.11, using a 5-by-5 array for illustration. Time is shown advancing from left to right with the different frames portraying some of the instan- taneous patterns of display activation for the letter X. The figure is highly schematic; it should not be assumed (1) that the frames within each sequence are evenly separated in time, (2) that the time scale across different sequences is uniform, nor (3) that the patterns used in this work always have horizontal and vertical dimensions equal to the display.
The two most natural display modes are shown at the top of the figure; they are the static mode, in which the entire pattern
MASKER-26 msec
Single ' pattern ' mask ---'
STIMULUS ONSET ASY NCHRONY (milliseconds)
Figure 31.10. Amount of pattern masking as a function of the onset asyn- chrony of the two complementary halves making up the masker. The target patterns were the 26 uppercase letters presented for 26 msec on the upper 18 rows of the Optacon display; 4 msec after their termination, a masking stimulus came on. This masker consisted of two complementary patterns that could be presented independently (see Figure 31.8 for examples of complementary patterns); the duration of each was 26 msec. The independent variable was the onset asynchrony between the two complementary halves of the masker. The dependent variable was the amount of masking, defined as the difference in percentage of correct recognition with and without a masker. The amount of masking averaged across four observers i s plotted as a function of onset asynchrony. When the two complementary halves of the masker were simultaneous, the masking was minimal. As the two halves were increasingly separated in time, the amount of masking increased to a maximum and then declined to the value for a single pattern mask (Craig, 1982a).

TACTUAL PERCEPTION
STATIC
SCAN
SLIT-SCAN
SEGMENT
APPARENT MOVEMENT-I
APPARENT MOVEMENT-II
TRACE
Figure 31 .I 1. Various display modes used for presenting two-dimensional patterns to the skin. The figure schematically portrays successive frames of activation of a 5-by-5 tactile display for the letter X under different display modes. The static mode presents the pattern in a fixed location throughout the total stimulus exposure. The scan mode involves steady movement of the pattern from right to left across the display (and skin). In the slit-scan mode the pattern is revealed as if scanned by a vertical slit moving from left to right across the pattern. The segment mode presents separate strokes or segments of the pattern in succession. The apparent movement I mode is similar to the segment mode except that only the endpoints of each segment are displayed rather than all of the points definingeach segment. The relative timing of the endpoints is adjusted so that the observer experiences smooth apparent movement between the endpoints of each segment. The apparent movement I1 mode is similar except that there is some temporal overlap of the activations of the two endpoints. In the trace mode, the points defining each pattern are presented sequentially, as if the pattern were being cursively traced. Because of space limitations, only seven of ten frames in the trace mode are depicted.
makes simultaneous contact with the skin without lateral dis- placement, and the scan mode, in which there is relative move- ment between the pattern and the skin surface (usually from right to left on the tactile display). In braille and Optacon reading, the patterns move relative to the skin surface as in the scan mode, except that the reader has active control over the scanning process. The static and scan modes are similar in that the entire pattern makes simultaneous contact with the skin part of the time during its presentation (provided that the display area or skin area is not smaller than the pattern). If the pattern is small relative to the array size, the entire pattern may be in contact with the skin for a high proportion ofthe total stimulus duration.
A minor variation on the static mode is one in which there is very slight motion (jitter) of the pattern about a fmed position on the skin or tactile display (Bliss, Crane, & Link, 1966; Loomis, 1981a, 1982; Loomis, Note 1, Note 2). This jitter serves to prevent the tactile image from fading or losing definition, as is commonly experienced with static tactile patterns. However, because the pattern remains in a roughly constant position and only modest differences have been reported between the static and jitter modes (Bliss, Crane, & Link, 1966; Loomis, 1981a), the jitter mode will be subsumed under the static mode in the discussion of performance and display modes.
Four of the remaining modes differ from the above in that the elements of the pattern are presented individually over time; accordingly, these modes are referred to collectively as sequential modes. In the trace mode, the pattern is cursively traced as if scanned by a moving point aperture, much in the
manner of "finger writing on the back." The segment mode is similar except that the pattern is displayed stroke by stroke rather than point by point, with the segmentation into strokes determined by the experimenter. The two apparent-motion modes were designed to economize on time relative to the segment mode (Shimizu, 1982; Shimizu et al., 1982). With proper timing, tactile apparent movement (Kirman, 1974a) along the path between the stimulated points gives rise to the impression of a line stroke without the necessity of stimulating intermediate positions. In the apparent movementl (AM I) mode, the stimulator defining one end of each line segment is activated and then turned off before the other endpoint is activated. In the apparent movement 11 (AM II) mode, the activations of the two stimulators overlap partially in time.
The last display mode (slit-scan) is a compromise between the static and trace modes. In this mode, the pattern is presented as if scanned by a vertical slit moving from left to right across the stationary pattern. Stimulation within each vertical section is simultaneous whereas the different sections are displayed sequentially.
Figure 31.12 summarizes the results of several experiments showing the effects four different display modes have on pattern perception. All of these experiments used relatively long stimulus presentations; stimulus duration was 1.0-1.5 sec in the studies by Apkarian-Stielau and Loomis (1975), Craig (1981), and Loomis (1974, 1980) and approximately 3.5 sec in the study by Shimizu et al. (1982). The results on the left of the figure were obtained with the midtorso where spatial sensitivity is poor (Weinstein, 1968). Shimizu et al. presented katakana letters on a 10-by-10 array of solenoid vibrators (on 15-mm centers) placed on the abdomen, thus making the letters 135 mm high. Apkarian-Stielau and Loomis (1975) and Loomis (1974) pre- sented uppercase Roman letters, 18 rows high, on the TVSS display for the back, making the letters 204 mm high. The data of Shimizu et al. (1982) are similar to results obtained in a less controlled experiment by Beauchamp, Matheson, and Scadden (1971) comparing the effects of the scan and trace modes on letter recognition with the 20-by-20 TVSS back display. The data on the right of Figure 31.12 were obtained with the Optacon display stimulating the ventral surface of the left index finger (Craig, 1981; Loomis, 1980); the uppercase Roman letters were 18 rows high (20 mm) on the Optacon display except in the cases indicated where they were only 12 rows high (13 mm).
The effects of display mode are not invariable but depend upon stimulus duration. Figure 31.13 gives the data from an experiment in which stimulus duration (display time) was varied (Craig, 1981); the 26 uppercase Roman letters were presented to the finger using an Optacon display. Display time was defined as the maximum duration of any element of the pattern (Craig, 1981). Thus, if the letter X were to traverse the display in the scan mode, as in Figure 31.11, display time would be measured from the moment the lower left point of the letter appeared a t the right of the display until it disappeared at the left of the display. This definition contrasts with pattern duration (see Figure 31.141, which is measured from the time the first element of the pattern appears on the display until the last element disappears. The two definitions imply that when display time is held constant, pattern duration is much greater in, say, the segment mode than in the static mode.
The results of a similar experiment (Shimizu, 1982), this time using the palm, are presented in Figure 31.14. The stimuli were the 46 katakana characters and were displayed using an array of solenoid vibrators seven columns wide and nine rows

PERCEPTUAL ORGANIZATION AND COGNITION
. = Roman letters, back 0 = Roman letters, back A = Katakana letters. abdomen
I I Static Slit-scan
Scan Segment
NDEX FINGER
0 0
0
0 =Roman letters. 20 mm 1
0 =Roman letters. 20 m m 0 =Roman letters, 13 mrn ~
TACTILE DISPLAY MODE
I Static
Figure 31.12. Character recognition accuracy as a function of display mode. The figure summarizes the results of several experiments on the effects of four different display modes. (See Figure 31.1 1 .) Where given, the error bars represent plus or minus one standard error of the mean. At the left of the figure are given the results obtained with the midtorso. The stimuli were either the 26 uppercase Roman letters displayed on the back or the 46 katakana characters displayed on the abdomen (. Apkarian-Stielau & Loomis, 1975; 0 Loomis, 1974; A Shimizu, Saida, Wake, Nakamura, & Ohzu, 1982). At the right are given the results obtained with the ventral surface of the index finger. The stimuli were uppercase Roman letters either 13 mm or 20 mm in height presented on the Optacon display (0 Craig, 1981 ; 0 0 Loomis, 1980). For patterns presented to the midtorso, the static mode leads to the poorest performance while the segment mode leads to the best performance. For 20-mm letters presented to the finger, the static and scan modes result in the best performance.
I Slit-scan
high (on 7-mm centers); the letters were thus 56 mm in height. On a given trial the number of pulses per tactor was held con- stant, but over trials the number of pulses per tactor (at a rate of 80 per second) was varied to change the display time of a character. Thus, in the AM I (apparent movement I) and AM I1 modes, there were two, four, eight, and 16 pulses per tactor while in the segment mode there were two, six, 12, and 24 pulses per tactor. The time interval between successive strokes was constant in the sequential modes a t 80 msec. Because of differences between the modes, the pattern durations averaged across characters varied from one mode to the next (Figure 31.14).
One firm generalization that can be made about the results in Figures 31.12 and 31.14 is that of all display modes, the static mode gave the poorest recognition performance for the palm and midtorso; recognition performance with both Roman and katakana letters in these studies averaged about 35% correct (Apkarian-Stielau & Loomis, 1975; Loomis, 1974; Shimizu, 1982; Shimizu et al., 1982). For these same body loci, recognition accuracy a t the longer durations was nearly perfect for modes in which the patterns were presented segment by segment (Shimizu, 1982; Shimizu et al., 1982). In sharp contrast, when the Optacon display was used with the finger, the static mode led to performance that was equal to or better than that obtained with the other display modes; on an absolute scale, practiced observers recognized uppercase Roman letters in the static mode with an accuracy approaching 90% correct (Craig, 1980,1981), a level much higher than that reported for the midtorso (Ap- karian-Stielau & Loomis, 1975; Loomis, 1974). In the one case where the static mode was inferior with the finger (Loomis,
Scan Segment
19801, Roman letters 13 mm high were used rather than the more usual size of 20 mm (Craig, 1980, 1981).
To simplify the discussion of these results, we begin by considering only the results obtained for pattern durations greater than 1 sec. What most demands explanation is the robust finding that when patterns are presented sequentially recog- nition performance for the midtorso and palm is much better than when the entire pattern is presented simultaneously in the static mode; when the finger is used for sensing, however, the superiority of sequential presentation completely disappears.
An explanation for the superiority of the sequential display modes has been proposed by Loomis (1974,1981b). I t is based on the idea of low-pass spatial filtering by the cutaneous sense and applies only in situations where tactile pattern perception is being limited by the spatial resolution of the cutaneous sense. The basic reasoning is as follows. When statically presented patterns are small relative to the spatial resolution of the cu- taneous sense, the cortical representations of the patterns are low-pass spatially filtered versions of the original patterns. With a sufficient degree of low-pass filtering, many of the features that distinguish the patterns from each other are lost in the cutaneous transfer, resulting in poor recognition performance. If, however, the elements of a pattern are presented sequentially, a s in the trace and segment modes, the cortical representation of the stimulus a t each instant of time is a low-pass-filtered version of the element or elements appearing on the display. In the trace mode, where only a single point is present on the display a t each instant, the cortical representation is the impulse response of the cutaneous sense corresponding to the point on the skin being stimulated. As argued by Loomis (1981b), the

TACTUAL PERCEPTION
8 0 u [ FINGER
DISPLAY TIME (milliseconds)
Figure 31.13. Character recognition performance as a function of display time and display mode. (See Figure 31.1 1 .) The stimuli were the 26 uppercase Roman letters presented to the index finger using the Optacon display. Display time was defined as the maximum duration of any element of the pattern as it remained stationary or moved across the display. Except for the shortest display times, the static mode led to superior recognition performance (Craig, 1981 ).
observer can in principle recognize the spatial pattern in the trace mode by virtue of the changing location of the impulse response as a function of time, provided that no other stage involved in the recognition process, such as short-term memory, is limiting performance. This argument can be extended to account for the superiority of the segment and apparent move- ment modes relative to the static mode. By similar reasoning, performance in the slit-scan mode ought to be intermediate between that of the static mode and these other modes, since scanning amounts to simultaneous presentation in one dimen- sion (along the slit) and sequential presentation in the other (the direction of slit travel). The results of Figure 31.12, showing that performance is sometimes intermediate and sometimes not, suggest that other factors may limit performance in the slit-scan mode.
The fact that sequential presentation was sometimes su- perior to simultaneous presentation, as i t was with the palm (Shimizu, 1982), abdomen (Shimizu et al., 19821, and back (Ap- karian-Stielau & Loomis, 1975; Loomis, 19741, and sometimes not, as in the case of the finger (Craig, 19811, does not refute the above explanation. As stated earlier, there should be an advantage of sequential presentation only when cutaneous spatial resolution is limiting recognition performance. When letters 18 rows (20 mm) high are displayed on the Optacon, the performance of practiced observers is nearly 90% correct (Craig, 1980, 1981), showing that the spatial bandwidth of cutaneous processing for the finger is adequate for the recognition of up- percase Roman letters of this size; however, the sparse evidence that is available (Figure 31.6) suggests that the spatial resolution of the finger does limit performance for letters smaller than this that are displayed on the Optacon (perhaps because of weak excitation of mechanoreceptive units by the bimorph reed stimulahrs). Since the palm, abdomen, and back are of consid- erably poorer spatial resolution than the finger (Weinstein, 19681, it is a t least plausible that the essential difference between the
results obtained for the finger with large letters and those ob- tained for the other body loci is explicable in terms of whether the recognition of statically presented letters is limited by spatial resolution a t the start. Adding to the plausibility of this argument is the suggestive finding of Loomis (1980) that the slit-scan mode yielded slightly better recognition performance than the static mode when small letters 12 rows (13 mm high) on the Optacon display were presented to the finger, but not when larger letters (20 mm) were presented. A more decisive exper- iment would have used still smaller letters and purely sequential presentation, such as the trace or segment mode, rather than the slit-scan mode, which is partly sequential and partly si- multaneous.
When display times or pattern durations much shorter than 1 sec are used, the ranking of the display modes in terms of recognition accuracy changes for the finger (Figure 31.13) but not for the palm (Figure 31.14). It is no surprise that for very short display times (e.g., 4 msec in Figure 31.13) different modes that stimulate the same points on the skin during the presen- tation interval should result in the same recognition accuracy, because the limited temporal resolution of cutaneous processing makes simultaneous and sequential presentation functionally equivalent (Craig, 1981). Of greater interest are the results for display times on the finger of 26 and 100 msec (Figure 31.13) and for the shorter pattern durations on the palm (Figure 31.14). They indicate that performance with the sequential modes is much worse than a t longer display times, while there is little change in performance with the static mode. At present, the decline in performance with decreasing stimulus duration is not well understood.
3.1.8. Spatiotemporal Pattern Masking. Pattern masking can be defined as the reduction in the detectability or identi- fiability of a pattern brought about by the manipulation of
=Segment
= AM-II
200 500 1000
MEAN PATTERN DURATION (milliseconds)
Figure 31.14. Character recognition performance as a function of mean pattern duration and display mode. (See Figure 31.1 1 .)The stimuli were the 46 katakana characters presented to the palm by means of a 7-by-9 vibrotactile display. Pattern duration was the total time it took to present a pattern within a given display mode. In contrast to the results of Figure 31.13, the static mode resulted in the poorest recognition performance over the entire range of pattern durations, and quite high levels of performance were obtained with the sequential modes (segment, apparent movement I, and apparent movement II) (Shimizu, 1982).

PERCEPTUAL ORGANIZATION AND COGNITION
other stimulus information that is overlapping or contiguous in time andlor space. Possible explanations of tactile pattern masking, like those offered in connection with visual masking, are of a wide variety. An example of a "sensory" explanation would be the following: The target pattern and the masking stimulus, by virtue of their spatial and temporal contiguity and the spatiotemporal filtering of cutaneous processing, are partially or wholly integrated over time and space. Under the assumption that intensity coding of the output includes a compressive non- linearity or is greatly limited in dynamic range (see Legge & Foley, 19801, the effective intensity (contrast) of the pattern is attenuated, thus resulting in reduced identifiability of the target (Craig, 1982b; Eriksen, 1966; Eriksen & Collins, 1967, 1968; Loomis, 1981b). An alternative theory also relies upon spatial and temporal integration of target and masker but does not require attenuation of the target elements (features) by some nonlinear process. In this "cognitive" theory (Craig, 1982b), the observer is unable to distinguish the features defining the target pattern from those defining the masking pattern within the composite of the two stimuli. Because the existing tactile results impose little constraint on theorizing, of which these are just two, we largely confine our discussion of masking to the more significant empirical findings. In this discussion we recognize the following logical possibilities involving two patterns: overlap in time and in space; overlap in time but not in space; overlap in space but not in time; and overlap in neither. The first pos- sibility has not been studied and consequently will not be dis- cussed.
3.1.8.1. Lateral Masking. This term refers to the masking of one pattern by another that overlaps it in time but not in space (although spatial contiguity of the two is essential). A clear illustration of lateral masking can be observed in Figure 31.5 by comparing the average legibility of braille characters in isolation (set 4 in Figure 31.4) with that of the braille char- acters with rectangular surround (set 6 in Figure 31.4). The addition of the same surround to each braille character greatly reduces its identifiability. Because of the similarity between the tactile and visual data brought about when the visual stimuli were blurred prior to viewing (Loomis, Note I), this example of lateral masking would seem a good candidate for explanation in terms of the spatial filtering of cutaneous processing and some nonlinear coding stage (e.g., Legge & Foley, 1980).
3.1.8.2. Temporal Masking of Spatially Overlapping Stim- uli. Much research has been devoted to pattern masking where the two patterns occupy the same location a t different times. What follows are some of the principal points that have emerged from this work. All of Craig's work was done with the Optacon, while Schindler and Knapp (1976) used an Optacon-like display on the finger and Bliss, Crane, Link, and Townsend (1966) used an ai j e t display extending over several fingers.
1. Simple patterns, like letters, presented in close succes- sion interfere with the recognition of one another, whether displayed in the static mode (Bliss, Crane, Link, & Townsend, 1966; Craig, 1978; Schindler & Knapp, 1976) or in the scan mode (Craig, 1976, 1977).
2. Craig (1982b) has found that in the static mode, a uni- form masking field (an energy masker) causes much less forward and backward masking of letters than does a structured field (pattern masker), even though the energy masker activated 108 pins of the Optacon display and the pattern masker an average of 41. The results of the experiment are shown in Figure 31.15. As a simple way of changing effective masker intensity
A = Forward pattern 0 = Backward energy 0 = Backward pattern
---I-+/ I I I I I
No 10 20 30 40 50 6 Mask
MASKER DURATION (milliseconds)
Figure 31.15. The differential masking effects of energy and pattern maskers. The target stimuli were uppercase Roman letters presented to the finger using the upper 18 rows of the Optacon display. The energy masker consisted of activation of all 108 pins in these upper 18 rows. The pattern maskers were structured patterns of activation of these upper 18 rows with the average number of pins activated equal to 41. The average recognition accuracy for four observers is plotted as a function of type of masker (energy or pattern), masker duration, and whether it preceded (forward masking) or followed (backward masking) the target pattern. The results indicate that pattern maskers interfered much more with target recognition despite the fact that fewer pins on the display were activated. Also, the greater masking effects with increasing masker duration indicate temporal integration of the masking stimulus (Craig, 1982b).
independently ofletter intensity, the masker duration was varied within the range oftemporal summation. As seen in the figure, increasing effective masker intensity (duration) increased both forward and backward masking, with pattern maskers inter- fering more with target recognition throughout the range of durations. As noted by Craig (1982b), this basic result and some of the details closely parallel the results of experiments dealing with visual pattern masking.
Masking by a uniform field is consistent with the idea of nonlinear processing of intensity following spatiotemporal in- tegration (low-passfiltering). However, the greater interfering effect of a pattern mask argues either for the alternative idea in which pattern and masking elements cannot be distinguished by the observer or for some other notion, like that of interruption of processing (Breitmeyer & Ganz, 1976; Massaro, 1975).
3. The amount of backward masking exceeds the amount of forward masking for both static and scan modes (Craig, 1976, 1978, 1980). This can be seen in Figure 31.16 (from Craig, 1980). An energy masker was used, and the display times of masker and letter were fixed at close to 100 msec. Craig (1980) observed that the asymmetry ofthe masking function was similar to what has been reported in the vision literature.
3.1.8.3. Metacontrast. Finally, there is the category of masking where the target and masker overlap neither in time nor in space, although they are in close proximity both spatially and temporally. These are the conditions for the type of masking

TACTUAL PERCEPTION
known as metacontrast (Alpern, 1953; Breitmeyer & Ganz, 1976; Turvey, 1973; Weisstein, 1972). Two experiments on tactile metacontrast have been reported (Weisenberger & Craig, 1982). In these the target patterns (six geometric shapes) were pre- sented for 26 msec on rows 5 to 14 of the Optacon display as depicted in Figure 31.17. The masking stimuli were rows of stimulation just above and below the target stimuli (Figure 31.17). The masking stimuli were also of 26 msec duration and were presented a t various onset asynchronies relative to the targets. Weisenberger and Craig found several results similar to those reported in the vision literature. Among them was the finding that maximum metacontrast occurred not a t zero asyn- chrony (simultaneous target and masker) but when the masker onset followed target onset by about 50 msec, as shown in Figure 31.18. This and other results indicate a considerable similaritv between the mechanisms underlying tactile and visual meta- contrast.
3.1.9. Perception of Patterns Composed of Widely Spaced Elements. Geldard (1957, 1960,1970) argued that the potential of the cutaneous sense as a sensory channel substituting for vision or hearing is best realized by matching tactile displays to the sensory capacities of the cutaneous sense; this view implies that optimal tactile displays may ultimately prove to have little in common with either visual or auditory displays. With this motivation, Geldard began the investigation of "coded" displays, so named (Craig & Sherrick, 1982) because the correspondence between distal and proximal stimulation is determined by rules chosen by the researcher (Craig & Sherrick, 1982; Geldard, 1974); these contrast with so-called pictorial displays (Craig & Shenick, 19821, like the Optacon, which provide a spatial iso- morphism between distal and proximal stimulation. In one ap-
Forward masking Backward masking
TIME BETWEEN LETTER AND MASKER (millisecondsl
Figure 31.16. Recognition accuracy as a function of the time between target letter and masker. The target stimuli were uppercase Roman letters presented to the finger using the Optacon display. In the static mode, they remained fixed on the display for 100 msec. In the scan mode, they moved from right to left across the display with each element having a duration (display time) of 104 msec. The masker was 18 rows high and six columns wide. In the static mode, it filled the upper 18 rows of the display for 104 msec. In the scan mode, it moved from right to left with each element having a display time of 104 msec. The time between target and masker was defined as the interval between offset of the last element of one pattern (target or masker) and onset of the first element of the other. Positive values represent backward masking where the target preceded the masker. The point indicated by -= represents letter recognition with no masking stimulus present. The data shown are the average values of four observers. They indicate that for both static and scan modes backward masking is greater than forward masking, a result commonly found in vision when a pattern mask is used (Craig, 1980).
Figure 31 .I 7. Stimulus patterns used in an experiment on tactile metacontrast. These were stimuli presented to the finger using the Optacon display. The pattern with rows 1 4 and 15-1 8 activated was the masking stimulus. The remaining six stimuli were the target patterns (Weisenberger & Craig, 1982).
plication, Geldard (1957) placed five vibrators a t widely sepa- rated locations on the ventral thorax. The dimension of locus was crossed with three discriminable levels of vibration and three of duration to give a total of 45 combinations, of which 40 were assigned letters, numerals, and common words as labels, thus defining the "vibratese" alphabet. ARer 12 hours ofpractice, three subjects were able to recognize singly presented vibratese characters with an accuracy averaging about 90% correct. Gel- dard (1960) also reported that after 35 hours of training one subject was able to receive vibratese sentences transmitted a t the rate of 38 five-letter words per minute with 90% accuracy.
Two subsequent studies on the feasibility of "coded displays have investigated the tactile discrimination of spatial patterns with elements widely spaced relative to the two-point threshold (Geldard & Shenick, 1965; Gilson, 1968); in this work only locus was employed as a coding dimension. In the first of these studies (Geldard & Sherrick, 19651, ten vibrators were located on the ventral surface of the body, as shown in Figure 31.19; prior to the experiment, each vibrator was adjusted to 15 dB SL. In the experiment proper, first one pattern, consisting of from one to nine active vibrators, was presented for 100 msec followed 0.5 sec later by the second pattern, with an equal number of vibrators and also of 100 msec duration. On half of the trials the patterns were identical and on the other half they were different. The subject's task was to respond "same" or "different" to each pair; feedback was not given. The two in- dependent variables were the number of elements in each of the two patterns (numerosity) and the number of elements shared by the two patterns (communality). The dependent variable was the percentage of correct responses on "different" trials. Because the data on "same" trials were not included in deter- mination of the dependent variable, its variations could reflect variations in discriminability and/or variations in the bias to respond "different." As might be expected, the percentage of correct responses declined with both numerosity and commu- nality. However, when the performance data for numerosity values 4 through 8 were plotted as a function of percent com- munality (percentage of common elements), they combined to form a single function, shown in Figure 31.20.

PERCEPTUAL ORGANIZATION AND COGNITION
No Forward Backward mask masking masking
STIMULUS ONSET ASYNCHRONY (milliseconds)
Figure 31.18. Results of an experiment on tactile metacontrast using the stimuli of Figure 31 . I 7. The target stimuli and masker all were presented in the static mode for 26 msec each. The abscissa gives the stimulus onset asynchrony (SOA) between target and masker. Positive values represent backward masking where the target preceded the masker. The data shown are the average values for four observers. As is commonly found in the vision literature, maximum masking was obtained with a positive SOA of approx- imately 50 msec. (Weisenberger & Craig, 1982).
The second such experiment (Gilson, 1968) used a display of ten vibrators, one for each ofthe fingers. To minimize confusion between homologous positions of the two hands, the vibrators on one hand were positioned 2.5 cm more proximal than those on the other. Aside from placement of the stimulators, the pro- cedure was essentially that of Geldard and Sherrick (1965). Besides expressing the data as a function of percent commu- nality, Gilson analyzed the results in terms of the percentage of pattern elements that shifted from one hand to the other in the transition from the first pattern to the second. Figure 31.20 gives the results for the 0% and 33% shifts. Gilson's results and those of Geldard and Sherrick (1965) indicate the level of per- formance that obtains when displays with widely separated stimulators are used; when compared with the results of a similar experiment using vibrators contained within a 105-mm square on the thigh (Gottheil, Cholewiak, & Shenick, 1978), perform- ance was much better using the distributed displays, as can be seen in Figure 31.20. While such displays may be optimal in pattern discrimination tasks by virtue of their minimizing the spatial interactions between the stimulators, they may inhibit perceptual organization of the pattern elements (Kirman, 1973) and thus limit performance in tasks requiring identification of the patterns.
In another experiment using a multifinger display, the ob- server's task was not to discriminate or identify spatial patterns, but to report which stimulators comprising each pattern had been activated (Bliss, Crane, Mansfield, & Townsend, 1966). The display consisted of 24 airjet stimulators, one for each in- terjoint segment of the fingers of both hands (thumbs excluded). In earlier training sessions, subjects learned to associate al- phabetic labels with the 24 segments. In the experimental ses- sions, from 2 to 12 segments were stimulated simultaneously in a 100-msec presentation, after which subjects attempted to
identify as many as possible. In a subsequent analysis of the error data, Hill and Bliss (1968) developed a model to account for the pattern of confusions between stimuli presented to same and to different fingers.
3.1.1 0. Tactile Speech. The feasibility of using the tactile sense to communicate speech is demonstrated by the success some deaf-blind individuals have attained with the Tadoma method, a technique whereby the listener places his or her hand on the speaker's face as shown in Figure 31.21 (Norton, Schultz, Reed, Braida, Durlach, Rabinowitz, & Chomsky, 1977). The requirement of physical contact between speaker and lis- tener, however, greatly restricts the listener's opportunities for speech reception; for this and other reasons, many attempts have been made to communicate speech through touch by picking up and displaying the speech signal onto the skin of the listener using electronic translation devices (Kirman, 1973). Future devices such as these may permit the comprehension of speech of a remote speaker using only touch. Existing devices already show promise as useful supplements to lipreading and as aids in teaching the deaf to form speech sounds (Reed, Durlach, & Braida, 1982). Because four excellent reviews of tactile speech are available (Kirman 1973, 1982; Reed, Durlach, & Braida, 1982; Richardson & Frost, 1977), we will merely sketch some of the issues, approaches, and findings.
Three interrelated issues need to be addressed when at- tempting to communicate speech through the skin (Kirman, 1982): (1) What speech information ought to be displayed? (2) What type of tactile display ought to be used to optimize infor- mation transfer through the tactile sense? (3) How should the speech information be mapped onto the tactile display? As Kir- man has noted, too few researchers in this area have approached the problem of tactile speech analytically. The result has been that, when a device has failed to result in effective speech com- prehension, the rezisons for its failure have generally been im- possible to isolate.
In connection with the first issue, existing methods of tactile speech communication fall into two basic categories: those making use of the acoustic speech signal and those making use of articulatory information. Most systems are of the former
Figure 31.19. Locations on the ventral surface of the body used for placement of vibrotactors in an experiment on pattern discrimination (Geldard & Sherrick, 1965).

TACTUAL PERCEPTION
(1965) = Gilsan (1968) 0% shift
a = Gottheil.Cholewiak and
COMMUNALITY (percent)
Figure 31.20. Results of three experiments on pattern discrimination. On each trial two brief patterns were presented in close succession. The first of these consisted of from one to nine elements; the second always had the same number of elements, but on half of the trials one or more of the elements were different. The observer's task was to respond whether the two patterns were the same or different. On the abscissa, percentage of communality represents the percentage of elements shared by the two patterns. The ex- periment by Celdard and Sherrick (1965) used the body display shown in Figure 3 1.1 9 with each element of a pattern corresponding to one stimulator. Cottheil, Cholewiak, and Sherrick (1 978) used an 8-by-8 vibrotactiledisplay placed against the thigh; each element consisted of a 2-by-2 submatrix of stimulators. Cilson (1 968) used ten vibrotactile stimulators, one for each of the ten fingers. The 0% shift condition represents "different" trials on which all stimulator changes from the first to the second pattern were confined to one hand. The parameter, 33% shift, represents trials on which one-third of the stimulator changes involved shifts to the other hand. The results indicate that performance is best with the body display (where the elements are widely separated) and poorest with the display on the thigh.
type, for the speech signal is picked up by microphone and delivered to the display. The Tadoma method is of the latter type, for the listener senses directly information that is closely tied to articulation (e.g., lip and jaw movements and airflow through the mouth). Systems of the former type are a t a dis- advantage, for the listener must detect the invariances in the stimulation that signify the speech information against the background of acoustic variation not pertinent to the speaker's intended communication.
The decision of which tactile display to use would ideally be based on knowledge of cutaneous spatiotemporal sensitivity, of other aspects of tactile pattern perception, and of any special requirements pertaining to speech. With this knowledge still largely unavailable, researchers have had to choose displays on the basis of trial and error and the existing technology. The result has been that research on tactile speech has been con- ducted using an enormous variety of displays. Experiments have used both vibrotactile and electrocutaneous stimulation, have coded speech using intensity, pulse frequency, andlor spatial patterning, and have varied widely in terms of number of stim- ulators, body locus, and spatial configuration of the stimulators (e.g., one or two spatial dimensions).
The last issue concerns the mapping of speech information onto the display. In the case of systems using the acoustic speech signal, there is the obvious choice of whether to use a time- intensity representation, analogous to the output of the tympanic
membrane, or a time-varying spectral display, analogous to the output of the cochlea. Most investigators have chosen the latter alternative. Even with this choice, there remain many questions, among them the following: How should the speech spectrum be allocated to the different stimulators? Should acoustic power in each band be represented by intensity of tactile stimulation or by a second spatial dimension? Should the mapping of intensity be linear or nonlinear? How should the speech information in each epoch be displayed (e.g., simultaneously or sequentially)?
Obviously, the sheer variety of potential and existing sys- tems of tactile speech makes difficult the task of determining which system has the greatest promise. The task is made even more difficult by the diversity of experimental procedures used to evaluate tactile speech systems (Kirman, 1982; Reed, Durlach, & Braida, 1982). Experiments vary greatly in terms of the speech stimuli used in training and testing (e.g., sentences, words, syllables, and single phonemes), in the number of speakers used to create the speech tokens, in the backgrounds of the subjects (e.g., age, degree of hearing loss, amount of training), and in the dependent variables used to measure performance (comprehension accuracy, recognition of single items, discrim- ination accuracy). What would seem essential for developing an understanding of tactile speech is a more analytical approach to the problem, structured in terms of the three issues identified by Kirman (1982) and confined to a few performance tasks. Moreover, observers must be given sufficient training and prac- tice so that performance ceilings properly reflect the capabilities of the tactile speech system in conjunction with the observer (Reed, Durlach, & Braida, 1982).
Figure 31.21. Schematic representation of hand placement on a speaker's face using the Tadoma method of speech reception. The Tadoma method is used by deaf-blind people to receive speech information. The thumb is placed vertically with its tip over the speaker's upper lip, the little finger is oriented along the mandibular ridge with its tip near the temporal-mandibular joint, and the remaining fingers fan out over the cheek. Using this method, the Tadoma listener picks up lip movements, jaw movements, laryngeal vibration, and oral airflow (Norton, Schultz, Reed, Braida, Durlach, Rabin- owitz, & Chomsky, 1977; Reed, Durlach, & Braida, 1982).

PERCEPTUAL ORGANIZATION AND COGNITION
Because of the success of the Tadoma method, it is valuable to consider the technique in greater detail. The Tadoma listener "reads" speech by placing the hand over the speaker's face and neck (Figure 31.21). The thumb is placed vertically with its tip over the speaker's upper lip, the little finger is oriented along the mandibular ridge with its tip near the temporal-mandibular joint, and the remaining fingers fan out over the cheek (Norton et al., 1977).
A series of studies on the Tadoma method has been conducted by Reed and her colleagues with two classes of subjects: deaf- blind observers who lost their sight and hearing early in life and who have used Tadoma for many years (Class A); and ob- servers with normal vision and hearing who have had little training in Tadoma (Class B). These experiments have examined performance on a wide variety of tests, ranging from the dis- crimination of simple speech sounds to comprehension of con- nected speech. The following are several of their findings.
1. In the conventional ABX paradigm (see Chapter 27, by Jusczyk) involving the discrimination of vowels, consonants, and combinations thereof, both Class A observers and Class B observers, aRer only modest amounts of focused training, per- formed at levels of 70-100% correct, with chance correspond- ing to 50% correct (Norton et al., 1977; Reed, Doherty, Braida, & Durlach, 1982; Reed, Durlach, Braida, & Schultz, 1982; Reed, Rubin, Braida, & Durlach, 1978). The highest performance was obtained in tasks involving discrimination of randomly seleded pairs of monosyllabic words while the lowest performance was recorded in tasks involving the discrimination of vowels preceded and followed by fixed consonants (CVC context).
2. In identification tasks, the most expert Class A observer recognized 55% of 24 consonants correctly when followed by a vowel (CV context) and 56% of 15 vowels and diphthongs in a CVC context (Reed, Durlach, Braida, & Schultz, 1982); the cor- responding scores for Class B observers with specialized training were 73% and 82% (Reed, Doherty, Braida, & Durlach, 1982). When words were selected at random from a very large set, performance was poorer but still well above chance, with Class A observers scoring c o m t l y 26-56% of the time (Reed, Durlach, & Braida, 1982). No comparable data have' been obtained for Class B observers, but Reed, Durlach, and Braida (1982) judged that performance would be very poor.
3. The most expert Class A observer was able to report correctly approximately 75% of key words in a standardized sentence test when the sentences were spoken at the normal rate of 5 syllables per second (Norton et al., 1977). This increased to 93% correct with a rate of 2.6 syllables per second. Other Class A observers have done nearly as well (Reed, Durlach, & Braida, 1982). Class B observers would not be expected to per- form this well on sentences without much more extensive training (Reed, Durlach, & Braida, 1982).
Reed, Durlach, and Braida (1982) concluded from the sim- ilarity of performance of Class A and Class B observers on the discrimination and identification tasks and from the superior performance of Class A observers on the sentence tests that Class A observers were making much use of contextual infor- mation in the comprehension of ordinary speech. They also concluded on the basis of the results with nonsense syllables, monosyllabic words, and sentences that the best Tadoma users attain performance levels comparable to auditory speech per- ception at a signallnoise level of 6 dB (Reed, Durlach, & Braida, 1982; Reed, Durlach, Braida, & Schultz, 1982).
Based on a variety of data, Reed, Durlach, and Braida (1982) 1 have conjectured that the "primary physical actions sensed by I the Tadoma reader are lip movements, jaw movements, laryngeal i vibration, and oral air flow (with muscle tension and nasal air flow playing secondary roles)" (Reed, Durlach, & Braida, 1982, pp. 3-4). They and their colleagues are presently working with an artificial electromechanical Tadoma display to determine experimentally the relative importance of each of these actions for the Tadoma listener and to employ this knowledge in the development of more effective tactile speech displays.
3.2. judgments Mediated by Temporal and Intensive Cues
3.2.1. Judging Material Composition and Surface Texture Through Vibration. According to Katz (cited in Krueger, 1970), observers are able to distinguish a variety of materials, such as wood, metal, and porcelain, merely from the vibrations felt in the handle of a hammer used to tap the material. Moreover, reliable judgments are said to be possible when the hammer makes contact with the material for durations as short as 4 msec.
With regard to surface quality, Katz (1936; cited in Krueger, 1970) claimed that vibration is essential to the perception of texture (particularly roughness). In support, he observed that one can judge surface roughness almost as well when one moves a stylus held in the hand over the surface as when the hand itself makes contact. Similarly he observed that the driver of a car judges the smoothness of the road surface by vibrations in the steering wheel. Although he was correct in claiming that vibration can be informative about surface texture, he probably was incorrect in claiming that vibration per se is the basis for ordinary texture perception using the bare hand. (The discussion of ordinary tactual texture perception is presented in Section 5.1.)
3.2.2. Spatial Localization Using Temporal and Intensive Cues. Vision and audition serve us well for detecting, localizing, and recognizing distant objects. The deaf-blind, however, are not totally lacking in the ability to sense objects and events beyond arm's reach, for the sense of touch provides some ca- pability for localizing distant sources of vibration (Katz, 19361, this ability being akin to seismography. For example, Helen Keller (1908) claimed the ability to observe movements and activities of people in the same room merely from vibrations transmitted through the floor to her feet.
Whether in natural settings the tactile sense is actually capable of localizing sources of vibration in distance from the observer has not been demonstrated, but directional localization is well established. Katz (1936), for example, observed that deaf observers could judge the direction of tapson a table using vibrations sensed by the hands in contact with one edge. In other work, he found that subjects could tell which end of a long pole had been tapped by vibrations sensed when the two hands grasped the pole near its middle.
More systematic work on directional localization began with von Bekhsy (1955). He used the amplified signals from two microphones, 20 cm apart, to drive two artificial cochleas, one on each forearm, as shown in Figure 31.22. Each cochlea consisted of a fluid-filled plastic tube, one side of which had a membrane that vibrated like the basilar membrane. When dri- ven by a piston at one end, traveling waves were set in motion along the membrane and the surface of the forearm. Von BekW

TACTUAL PERCEPTION
Figure 31.22. Diagram of apparatus for investigating tactile localization of sound. Microphones separated by distance D picked up sound from a distant source. The difference in times of arrival at the two microphones is indicated by At. The signals from the microphones, after amplification, were used to drive two cochlea models, one on each arm. A piston at one end set up vibrations within the fluid of the cochlea resulting in traveling waves along the membrane in contact with the ventral surface of the forearm. High frequencies created the greatest displacements of the membrane nearest the piston, while low frequencies created the greatest displacements at the opposite end (von Bekesy, 1955).
reported that when the sound source was far from the micro- phones tactile and auditory localization were similar, stating that, "if sharp clicks are used, the skin's sensitivity for time differences measured by spatial localization is about half that of the ear . . ." (von BBkBsy, 1955, p. 841).
In contrast, Gescheider (1965) found that time differences within the range that are effective for audition were quite in- effective for tactile sound localization. Gescheider compared auditory and tactile sound localization by driving either a pair of headphones or vibrators stimulating the tips of the two index fingers; the input signals were electronically generated clicks simulating real sounds. He independently varied the binaural time and binaural intensity differences a t the two earphones and vibrators using values of each that corresponded to azimuths ranging from -90" left of the subject's head and body through 0" (straight ahead) to 90" right. For 0" azimuth, the auditory and tactile stimuli were presented a t 60 dB SL and 40 dB SL, respectively. Figure 31.23 gives the results; these were obtained with subjects who were given feedback after each judgment in only Condition IT, in which both intensity (I) and time (T) cues were varied together. Plotted are the mean perceived directions (indicated by pointer) as a function of source azimuth, sensory modality, and cue condition. When the time difference cue was held constant a t a value corresponding to 0" azimuth while the intensity cue was varied (Condition I), performance with touch was nearly the same as when both intensity and time cues were varied (Condition IT). On the other hand, when time was varied with..the intensity cue constant (Condition C), there was very little change in perceived direction. Gescheider also confirmed in this work that, when time differences several times greater than those occumng in a natural sound field were used, the influence on bilateral tactile localization was minimal. Ges- cheider concluded that intensity difference alone serves as an effective cue for tactile localization. The reason for the discrep-
ancy between Gescheider's results and von BBkBsy's claim is not clear, for von BBkBsy provided neither data nor details of his method.
Besides the mean perceived azimuths of Figure 31.23, Ges- cheider reported measures of directional accuracy. The mean absolute errors for clicks in the IT condition were 8.0" for hearing and 10.3" for touch. The values for 1-sec noise bursts and 187- Hz tones, filtered of transients, were 12.8" and 15.6" for hearing
9 0 I AUDITORY
SOUND SOURCE LOCATION (degrees)
Figure 31.23. Results of an experiment comparing auditory and tactile directional localization of sound. Electronically generated signals were used to simulate clicks at varying azimuths from - 90" left of the observer's head through 0" (straight ahead) to 90' right. Intensity ( I ) and time (T) differences in the two channels were manipulated independently to simulate binaural intensity and time differences. The auditory stimuli were delivered through earphones, while the tactile stimuli were presented to two vibrators, one for each of the left and right index fingers. On a given trial an observer was presented with a stimulus corresponding to some azimuth and responded by pointing in the judged direction. Feedback was given in only the IT condition, in which both intensity and time cues were provided. Plotted are the mean perceived azimuths as a function of source azimuth, sensory mo- dality, and cue condition. When the time cue was varied with the intensity cue held constant (condition T), there was a systematic effect on perceived azimuth for audition, but none whatsoever for touch. Under the conditions of this experiment, the cutaneous sense appears not to respond to time differences over a range that is quite effective for audition (Gescheider, 1965).

Table 31.2. Mean Erron of Auditory and Tactile Directional Judgments for Two Conditions of Observation and Three Egocentric Distances of the Sound Source
Passive Active Auditory Tactile Auditory Tactile
Near 5.12 11.79 4.89 5.15 Middle 5.64 13.06 4.83 6.46 Far 6.46 13.53 5.56 6.43
Observers indicated the perceived directional location of the sound source by facing that direction. The mean errors are given in degrees. Results show that when head movements are permitted during the perceptual judgment (active condition), tactile directional localization is comparable to auditory localization, but when head movements are not permitted (passive condition), tactile localization is considerably worse. (From Richardson, B. L., & Frost, B. I . Perception and Psychophysics, 1979, 25, 340. Reprinted by permission.)
and 24.8" and 14.3" for touch. These results indicate tactile discrimination of azimuth rivaling that of hearing, albeit with artificial displays and with feedback provided during training. Whether unaided and untrained directional localization of taps on a table surface, as studied by Katz, exhibits the same accuracy remains to be determined.
Other work on tactile sound localization has been reported by Frost, Richardson, and their colleagues (Frost & Richardson, 1976; Richardson & Frost, 1979; Richardson, Wuillemin, & Saunders, 1978). They employed an experimental arrangement consisting of two microphones mounted on the observer's head that provided the input signals, after amplification, to either a pair of earphones or two vibrators stimulating the two index fingers. In one such experiment reported by Richardson and Frost (1979), observers judged the direction and distance of buzzing sounds in either an active or a passive condition. On each trial, the sound stimulus was presented at one of three egocentric distances (17.5,45, and 80 cm) and one of 13 directions ranging from 60" left of the median plane to 60" right with a spacing of 10". The observer indicated the perceived distance of the sound stimulus by responding "near," "medium," and "far." In the active condition, the observers could rotate their heads during the judgment and indicated the perceived direction of the stimulus by bringing their heads to rest facing in that direction. In the passive condition, observers faced directly ahead during the stimulus presentation and indicated the perceived direction by facing that direction upon termination of the stim- ulus. The results were clear in indicating that when subjects
PERCEPTUAL ORGANIZATION AND COGNITION
were permitted to move their heads in the active condition, tactile localization in both direction and distance was equal to auditory localization, whereas when the head was held stationary (passive condition) tactile localization was considerably poorer than auditory localization with performance in both modalities being worse than in the active condition. The results for the directional judgments are given in Table 31.2. A similar pattern of results for directional localization was found earlier by Frost and Richardson (1976) in a task involving just one distance. In related work, Richardson et al. (1978) found that when two stimuli that were perceptually distinct in quality were simul- taneously present in the field, observers were able to resolve them directionally provided that the angular separation was greater than 4.4" for touch and 2.7" for audition. In contrast with the work on the localization of single sources, they found no difference between the active and passive conditions, whether touch or audition was used.
3.3. Tactile Tracking
Attempts to use the cutaneous sense for displaying tracking information to operators of vehicles (e.g., airplanes and heli- copters) have been motivated primarily by the need for additional sensory channels to reduce visual overload (Burke, Gilson, & Jagacinski, 1980; Geldard, 1957). References for most of the studies on tracking using tactile displays may be found in Hill (1970), Jagacinski, Flach, and Gilson (1983), Schmid and Bekey (1978), and Triggs, Levison, and Sanneman (1974). For a thor- ough introduction to the concepts of tracking, see Chapter 39, by Wickens.
The nany studies on tactile tracking vary considerably in terms of methodology; the dimensions along which they vary include the type of tracking task, complexity of the input signal, vehicular dynamics, stimulus dimensions used to represent the input or error signals, body locus used for placement of the display, and indexes of performance. Rather than attempt to summarize the studies in this area, we will describe the methods and results of one experiment from each of two studies (Hill, 1970; Jagacinski et al., 1983); these experiments investigated two of the more promising tactile displays and compared their performance with that obtained using visual displays.
The two studies were similar in methodology. In both, the command signal to be tracked by the subject (operator) was a time-varying voltage that was the sum of many sine waves of different frequencies. As depicted in Figure 31.24, the subject's
System lnput System output
Feedback 1
Error signal
Figure 31.24. System diagram for a tracking task. In the visual and tracking studies discussed in this chapter, the command signal consisted of a sum of temporal frequencies. The operator's task was to minimize the error signal (the difference between the input signal and the output of the vehicle being controlled). Only the error signal was displayed to the operator. The operator responded by moving a control, the output of which was transformed by the vehicle dynamics to give the system output.
Operator Vehicle - Control dynamics

TACTUAL PERCEPTION
control movements were transformed by the dynamics of the simulated vehicle, in this case an integrator. The output of the vehicle was then subtracted from the command signal to provide the error signal, which was in turn displayed to the subject. The subject's task was to manipulate the control to minimize the error signal; such a task is referred to as compensatory tracking. (See Chapter 39, by Wickens.) Also, because the com- mand signal parameters and system dynamics remained con- stant, the task is termed stationary tracking.
Hill (1970) studied performance with a variety of tactile displays, but we report the results obtained with just one. It consisted of seven ai j e t s configured for either one finger, three fingers, the dorsal hand, or the forearm. The jet in the center of the display represented no error, while the first and seventh jets, when activated, represented full-scale error. Pulse repetition rate of an activated jet was 160 Hz. The command signal was a sum of equal-amplitude sine waves, the frequencies of which are indicated in Figure 31.25. The control was a hand-operated joystick. The data for three subjects and the three best display placements (ventral finger, ventral surfaces of three fingers, and dorsal hand) were averaged and then subjected to describing function analysis, the goal of which is to account for as much of the data as possible in terms of a linear transfer function in the temporal frequency domain. (See Wickens, Chapter 39.) The results obtained for the combined operatorlvehicle are given in Figure 31.25(a).
The visual tracking task was the same except for the display, which consisted of a horizontal line that moved vertically on a CRT; excursions from the center position were proportional to error. The results of the describing function analysis are pre- sented in Figure 31.25(b).
The second of the two studies (Jagacinski et al., 1983) made use of a display developed by Fenton (1966). It was a buttonlike rectangular section that moved in and out of the control handle manipulated by the operator. When there was no error signal, the section remained flush with the handle, and when there was an error, i t protruded in the appropriate direction. The thumb and opposing fingers were used to sense protrusion of the section; in response, the subject moved the control handle in the direction of protrusion. The visual display consisted of a horizontal line that moved vertically on a CRT screen, as in the study by Hill (1970). In both the visual and tactile tasks, an integrating vehicle was used, and the command signal was a sum of sine waves, as shown in Figure 31.25. In addition to the condition in which the value displayed to the observer was the error signal (the "unquickened" condition), there was a condition in which the displayed value was the sum of the error signal and its rate of change (the "quickened" condition). The visual and tactile data for the combined operatorlvehicle were analyzed in terms of describing functions; the results for the best subject in each of the unquickened display conditions are given in Figure 31.25.
A second analysis involved computation of the following index: mean-squared tracking error normalized by the mean- squared input signal; this measure was computed for the eight 3-minute tracking periods on the last day of practice. The values obtained in the four conditions are plotted in Figure 31.26; each datum represents a different subject. These results indicate that, with quickening, tracking performance was comparable in the tactile and visual conditions. Without quickening, the tactile display led to slightly worse performance.
Results in a nonstationary tracking task in which the vehicle dynamics were changed until tracking became unstable indicated
a = Jagacinski, Flach
30
20 -
10 0 - -
FREQUENCY (radians/second)
TACTILE 0 = Hill (1970)
= Jagacinski, Flach and Gilson (1 983) '21' ................ ................-
Figure 31 .ZS. Describing functions obtained from two experiments com- paring performance on a stationary tracking task using tactile and visual displays. The command signals were sums of temporal frequencies (in rad/ sec), the values of which are indicated for each function. In both (a) and (b) the upper function represents the amplitude portion of the describing function and the lower one the phase portion. The tactile results of Hill (1970) were based on composite data obtained with an airjet display placed at several different body loci. The tactile results of Jagacinski, Flach, and Gilson (1983) were based on data obtained with a buttonlike rectangular section that moved in and out of the control handle. Protrusion of the section from the handle in either direction was sensed by the thumb and opposing finger. The visual results in both studies were based on data obtained with a visual display consisting of a horizontal line segment, the vertical position of which (on a CRT) represented the error signal. In both studies, a simple integrating vehicle was used and the describing functions shown are those for the combined operator/vehicle (the describing functions plotted in Figure 8 of Jagacinski. Flach, and Gilson, 1983, were based on the same data but represent the operator without the vehicle). The results of the two studies are quite similar and indicate that tracking performance with the tactile displays was only slightly worse than that obtained with the visual displays.
that performance was significantly better with the visual display, with and without quickening; performance with the quickened tactile display, however, was approximately equal to that with the unquickened visual display. Taken together, the results of Hill (1970) and Jagacinski et al. (1983) indicate that, whereas existing tactile tracking displays are on the whole inferior to visual displays, performance with tactile displays can approach the performance with visual displays under some conditions. Becaw relatively little research has been invested in the design

PERCEPTUAL ORGANIZATION AND COGNITION I I
UNQUICKENED QUICKENED
Figure 31 .Xi. Compar~son of tracking performance using tactile and visual displays. The tactile and visual displays were those described in connection with Figure 31.25 (Jagacinski, Flach, & Gilson, 1983). The data were obtained in a 3-min stationary tracking task with an integrating vehicle and command signal consisting of the nine temporal frequencies indicated in Figure 31.25. In the unquickened condition, the signal displayed to the operator was the error signal alone. In the quickened condition, the signal displayed was the sum of the error signal and its rate of change. The dependent measure was the mean-squared tracking error (over the 3 min) normalized by the mean- squared input signal. Each plotted datum represents a different subject in the experiment. The results indicate that, with quickening, tracking perform- ance was comparable in the tactile and visual conditions. Without quickening, the tactile display led to slightly worse performance. (From R. J. Jagacinski, J. M. Flach, & R. D. Gilson, A comparison of visual and kinesthetic-tactual displays for compensatory tracking, IEEE Transactions on Systems, Man and Cybernetics, 13. Copyright 1983 by IEEE. Reprinted with permission.)
of tactile displays, further research should improve their effec- tiveness.
4. KINESTHETIC PERCEPTION
Kinesthesis provides information about the relative positions and movements of the parts of the body (static and dynamic ~os ture ) as well as about muscular effort. Research indicates that the sensing of static and dynamic posture is largely based on signals from muscle and skin receptors (see McCloskey, 1978; Chapter 13 by Clark & Horch); joint receptors seem to make little contribution, and the role of efference copy (the correlate of muscle efference available to higher brain centers) is very much in doubt. The review by McCloskey (1978) and Chapter 13 of this Handbook, by Clark and Horch, are comprehensive accounts of the physiology and psychophysics of kinesthesis. For discussions of the role of afferent and efferent kinesthetic mechanisms in motor performance see Kelso (1977,1978), Kelso and Stelrnach (1976), Laszlo and Bairstow (1983), and McCloskey (1978).
The following section describes the primary findings dealing with kinesthetic space perception. These fragmentary results constitute just the beginning ofwhat hopefully will be a thorough and systematic investigation of kinesthetically perceived space. Beyond its own intrinsic interest, the value of such an inves- tigation will be its clarification of veridical and nonveridical
haptic perception, which depends upon both kinesthetic and 1 cutaneous information. I I
4.1. Tactual Egocenter 1 I I
A concept that has proven useful in vision is that of the visual egocenter (Howard & Templeton, 1966). In the simplest of terms, it is the position in "space" at which a person experiences himself or herself to be. A more precise definition is that of the "direct egocenter" (Howard & Templeton, 1966); it is the point of con- vergence in physical space of lines of visual direction (Howard & Templeton, 1966; Roelofs, 1959). (A line of visual direction is the locus of points in physical space having the same apparent angular direction from the observer.) Operationally the direct egocenter would be the intersection of the axes of rods judged by an observer to be "pointing" a t himself or herself. The concept of egocenter is important, for it coordinates physical space and phenomenal space by identifying the origin of phenomenal space with a particular location within physical space. With the head stationary and the eye free to move, the monocular egocenter coincides with the eye's center of rotation (Howard & Templeton, 1966). With the head mobile, one would expect it to coincide with the head's center of rotation (see Blumenfeld, 1936).
If a tactual egocenter should exist, one could attempt to determine its position by having observers construct lines of tactual directions by kinesthetically orienting rods so that they appear to point in the direction of the "self." However, as Blu- menfeld (1936, p. 138) has suggested in an insightful but little- known paper, the tactual egocenter may not be fixed relative to the body but might well vary with the part of the body used in making the judgments; he even speculated that the tactual egocenter might coincide with the joint (shoulder, elbow, wrist) about which most of the limb rotation occurs.
4.2. judgment of Parallelism in Kinesthetic Space
Blumenfeld (1936) had observers construct lines that were ki- nesthetically parallel to each other and to the median plane of the body. Working within the horizontal plane 20-25 cm below the shoulders, he anchored two threads to needles that were 62 cm in front of the observer and equidistant from the subject's median plane. The independent variables were the separation between the two needles and the distances from the observer a t which measurements of parallelism were taken (see Figure 31.27). The subject arranged the threads so that they were phenomenally parallel to the median plane and to each other. The results for one representative subject are shown in Figure 31.27. The phenomenally parallel lines were asymmetric and divergent toward the body; the smaller the separation between the anchors, the greater the degree of divergence. Blumenfeld interpreted the physical divergence of phenomenally parallel lines as an indication that the location of the tactual egocenter depends upon rotations of the wrist, shoulder, and elbow joints.
4.3. Apparent Curvature of Straight Lines
Straight horizontal lines in the fronto-parallel plane, when ex- plored by the hand, appear slightly convex toward the observer (Blumenfeld, 1936; Hunter, 1954; Rubin, 1936); to appear straight, the lines must be made concave (bowed outward). The illusion is greater for blindfolded, sighted observers than for blind observers (Hunter, 1954) and is greater when the forearm rotates about the elbow than when the entire outstretched arm

TACTUAL PERCEPTION
Left Right
DISTANCE FROM MEDIAN PLANE (centimeters)
Figure 31.27. Results of an experiment on the judgment of parallelism in kinesthetic space. In this experiment, the observer constructed lines in space that were kinesthetically parallel to each other and to the median plane of the body. The constructions were performed on a horizontal board in front of the observer and roughly 25 cm below the shoulders. Two threads were anchored to the board 62 cm in front of the observer's pectoral plane and equidistant from the median plane (at distances of 5, 15, 25, 35,40, and 45 cm). The observer's task was to grasp the two threads near the needles, pull them taut, and then allow the hands to proceed along them in a proximal direction. The lateral positions of the threads at the next nearer measuring distance (e.g., 42 cm) were marked by the experimenter. After the results of several such determinations were averaged, the needles were moved to these new positions, and the subject once again set the threads to appear parallel. By proceeding segment by segment in this fashion, kinesthetically parallel lines were constructed. The results of one observer are given in the figure. The phenomenally parallel lines were asymmetric and divergent toward the body (Blumenfeld, 1936).
rotates about the shoulder (Davidson, 1972a; Rubin, 1936). When judgments are made about approximately horizontal lines that curve vertically within the fronto-parallel plane, judgment of straightness is essentially veridical (Davidson, 1972a).
4.4. Anisotropy of Distance in Kinesthetic Space
Consider a cylinder of nonzero radius, the axis of which coincides with that of the upper torso of a person's body. Radial lines are lines orthogonal to the axis while tangential lines are lines that are tangent to the cylindrical surface. It has been shown many times (Cheng, 1968; Davidon & Cheng, 1964; Day & Wong, 1971; Deregowski & Ellis, 1972; Marchetti & Lederman, 1983; Reid, 1954; Wong, 1977) that when an observer judges distances in kinesthetic space by moving the finger or hand between the endpoints defining each distance, radial distances are phenomenally greater than physically equal tangential distances. Thus, an observer feeling an L-shaped figure lying flat on a table directly in front would experience the line segment lying in the median plane as longer than the physically equal segment in the fronto-parallel plane. On average, the studies cited above indicate that in order for tangential lengths to match radial lengths phenomenally they must be approximately 10% greater physically. This radial-tangential effect is evidence of an anisotropy of kinesthetic space. Other evidence, however, suggests that kinesthetic space is locally homogeneous, for two radial lengths or two tangential lengths that are physically
equal are also phenomenally equal provided they are approx- imately the same distance from the observer (Cheng, 1968; Davidon & Cheng, 1964; Day & Wong, 1971; Deregowski & Ellis, 1972; Marchetti & Lederman, 1983; Wong, 1977).
In addition to its reliability across observers (e.g., see Davidon & Cheng, 1964, p. 2791, the radial-tangential effect is quite robust. It has been found both in experiments where the observer set two lengths to subjective equality (Cheng, 1968; Davidon & Cheng, 1964; Day & Wong, 1971; Deregowski & Ellis, 1972; Marchetti & Lederman, 1983) and in experiments where the observers attempted to set a single prescribed length on each trial (Wong, 1977). It has held despite incidental vari- ations between studies, such as the elevation of the stimulus configuration relative to the shoulder, and is relatively inde- pendent of other variables, such as the degree of arm extension (Marchetti & Lederman, 1983) and the mass added to the arm (Marchetti & Lederman, 1983). Unfortunately, no compelling explanation has yet been offered for the effect.
4.5. Anisotropy of Orientation in Kinesthetic Space
For lines within a fronto-parallel plane, visual discrimination of orientation is noticeably worse for oblique lines than for vertical or horizontal lines (Annis & Frost, 1973; Appelle, 1972). Such an "oblique effect" has been demonstrated for kinesthetic perception as well (Lechelt, Eliuk, & Tame, 1976; Lechelt & Verenka, 1980). Lechelt and Verenka (1980) had subjects match

PERCEPTUAL ORGANIZATION AND COGNITION
the orientation of two rods within a fronto-parallel plane using vision and kinesthesis separately. In the kinesthetic condition, the subject adjusted the orientation of the comparison rod felt with the left hand until it appeared to match the orientation of the standard rod felt by the right hand. In the visual condition, matches were carried out using the same rods, which appeared self-luminous in an otherwise dark room; adjustment of the comparison rod was performed by remote control. The average results for 16 subjects, each of whom participated in all con- ditions, are given ih Figure 31.28. Strong oblique effects were found for both kinesthesis and vision, with kinesthetic errors a t all orientations being about twice as great. In addition, there was a significant interaction between sensory modality and method of judgment; that is, relative to delayed comparison, simultaneous comparison of the two rods led to poorer perform- ance with touch and better performance with vision.
4.6. Influence of Hand Movement on Judgments of Kinesthetic Distance
Lederman, Klatzky, and Barber (1985) investigated the effect that tracing a curved raised path with one finger had on the judgment of the euclidean distance between the two endpoints of the path. The two endpoints were separated by values in the range of 2.5-15.2 cm, and the paths connecting the endpoints ranged in length from one to eight times the euclidean distance. Each stimulus path to be traced was placed on a table in front of the observer. Using the right index finger, the observer traced the path going from the startpoint to the endpoint with retracings of the path permitted. In some conditions, the leR index finger was held stationary a t the startpoint during the entire traverse of the path. The observer indicated the perceived euclidean distance between the startpoint and the endpoint by subse- quently positioning the two index fingers along a scale in front of the observer. For both blind and blindfolded sighted observers, traversing the curved path with the right finger caused an overestimation of the reported euclidean distance, regardless of whether the left index finger was a t the startpoint serving as a perceptual anchor. For the longer curved path lengths in some of their experiments, the mean reported euclidean distance was over twice the physical distance. These results indicate that judgments of kinesthetic distance between two points in space or between the fingers of two hands are subject to con- siderable error, with movement of one hand along a curved path between them producing a significant biasing effect.
5. HAPTIC PERCEPTION
Most tactually based perceptual and motor activity involves both cutaneous and kinesthetic information. It is worthwhile noting some of the many functions of haptic perception: the sensing of fabrics by the hand; the sensing of food texture by the mouth; the sensing of vibrations in machinery that signify normal or abnormal operation; the facilitation of the joining of machine parts during assembly with and without the aid of vision; the identification of solid objects and their spatial ar- rangement; the sensing of imperfections and dirt on the surfaces of objects; the examination of internal organs of the body by palpation; the examination of unseen portions of the teeth using dental probes; and the sensing of weight, center of gravity, and moment of inertia of hefted objects. Research in artificial in- telligence has as one of its goals the performance of functions
Figure 31.28.
- = Delayed comparison, visual c - = Simultaneous, tactual
STIMULUS ORIENTATION [degrees)
Accuracy with which two rods can be matched in orientation using either vision or kinesthesis. Two rods were positioned within a fronto- parallel plane of the observer. The observer's task was to match the variable rod in orientation to that of the standard. Both rods pivoted about one end, with 0" representing the upright position and 90°, one-fourth of a clockwise rotation. In the tactual task, the observer felt the standard with the right hand and adjusted the comparison with the left hand until it appeared to match. In the visual task, the two rods alone were visible, and the observer adjusted the comparison rod on the left by remotecontrol. In the simultaneouscondition, both rods were available throughout theadjustment. In the delayed comparison condition, the observer felt or saw the standard for 5 sec, waited for 10 sec, and then made the matching adjustment without further access to the standard. Performance was measured in terms of the mean absolute error (ignoring sign). The results shown are the average values for 16 observers. A strong "oblique" effect was found for both touch and vision; that is, the errors of reproduction were much greater with angles of 45", 1 3S0, 225", and 31 5" than with 0" and 90". For the oblique orientations, there was an interaction of sensory modality and adjustment condition (Lechelt 81 Verenka, 1980).
such as these by intelligent robots. For humans at least, haptic perception is still of much broader significance, for it contributes much to social and sexual communication, to individual devel- opment, and to the aesthetic appreciation of both ar t and daily life. For an introduction to the full range of"haptics" see Kennedy (1978) and RBvBsz (1950).
5.1. Texture Perception
Tezture refers to most of the physical properties of objects, fluids, and substances excluding large-scale shape. Texture does not include temperature, but it does include such attributes as sur- face roughness, hardness, elasticity, and viscosity. It is important to keep the attributes of perceived texture conceptually and terminologically distinct from the physical properties that give rise to them. Unfortunately, adequate descriptions of most physical textures are not yet available, and they are not likely to be until we know more about the mechanics of the skin and about the relative contributions of the cutaneous and kinesthetic senses to texture perception.

TACTUAL PERCEPTION
5.1.1. Roughness Perception. This treatment of texture perception will concentrate on the perception of roughness be- cause it is the one textural dimension that has received sys- tematic study by psychophysicists and physiologists alike. It is surprising that there is no agreed-upon definition of roughness; for present purposes it will be defined as undulations or pro- trusions of a surface that are of a much smaller scale than-the fingertip but large enough to permit tactual discrimination be- tween the surface in question and one that is smooth. Despite the amount of research devoted to the perception of roughness, its full understanding awaits better knowledge of the mechanics of skin stimulation. Although the models of statics proposed by Phillips and Johnson (1981b) and Taylor and Lederman (1975) constitute a good beginning, more needs to be known about the physical interaction between skin and texture when there is relative motion between the two.
5.1.1.1. Principles of Neural Coding. Johnson and Lamb (1981) and Lamb (1983a) have identified four candidate prin- ciples for the neural coding of texture (and form as well). As- suming that there are multiple types of mechanoreceptive units defining different neural channels, these are the possibilities: (1) The neural code is based on the spatiotemporal responses of one or more of the channels; (2) the neural code is based on just the spatial modulations of the responses; (3) the neural code is based on just the temporal modulations ofthe responses; or (4) the neural code is based on just the total intensities (or average rates) of the responses. Several hypotheses have been explicitly put forth concerning either the adequate stimulus for, or the coding principle underlying, the perception of rough- ness. Katz (cited in Krueger, 1970, 1982) proposed that the "vibratory sense" and skin vibrations from relative motion be- tween hand and texture play an essential role in the perception of roughness. Lederman (1982) and Taylor and Lederman (1975) hypothesized that the effective stimulus for roughness perception is the instantaneous spatial deformation of the skin; movement between texture and skin serves only to keep the tactile image from fading (corresponding to diminution of neural activity a t either peripheral or central levels). The third hypothesis, pro- posed first by Richards (1979) and later by Johnson (1983; Johnson & Davidson, 19811, is that surface texture (including roughness) is coded by the relative total responses of the various types of mechanoreceptive units, which in humans are the slowly adapting type I (SA I), slowly adapting type I1 (SA 111, rapidly adapting (RA), and Pacinian (PC) derents (see Section 3.1.1.2); this is a restatement of the fourth coding principle mentioned above and is analogous to that for the coding of color a t the level of the cone responses (Richards, 1979).
To relate the different hypotheses to one another, it is useful to elaborate the four coding principles identified by Johnson and Lamb (1981) and Lamb (1983a). Consider an area A of the fingertip that is stimulated by a surface of homogeneous texture; define x and y as the spatial coordinates of the skin surface, xmin, xmax, ymin, and ymax as the limiting values of the area A, and s(ny,t) as the spatiotemporal pattern of skin stimulation. Also consider that the epoch of time At under consideration is just long enough for the texture code to be fully defined, say, on the order of 100 msec. Now assume that there are four spa- tiotemporal filters, fi, corresponding to dense and uniform two- dimensional arrays of the four types of mechanoreceptive units. Each of the four channels transforms the input spatiotemporal pattern of skin stimulation s(xy,t) into a spatially and temporally filtered response pattern ri(xy,t) defined over the same region of space-time; the response pattern is given by the convolution
of the stimulus pattern with the spatiotemporal impulse re- sponse, fi(xy,t), of the component mechanoreceptive unit:
y max x min
i t = j 1 1 , , t l f ) d d t (4)
t- At y min x min
where
fi( = fi (X - x', y - Y', t - t ' ) .
Finally, assume that the code C for the perceived texture is the four-dimensional vector:
where the gi are functions of the spatiotemporal responses. What distinguishes the different coding principles is the type of in- formation lost by the functions g,.
If one or more of the functions gi preserve information about both spatial and temporal patterning in the channel re- sponses, then we define the resulting neural code as a spati- otemporal code. This can be expressed symbolically as
If the different spatioternporal filter functions fi are of sufficiently high spatial and temporal bandwidth, the information contained in C ought to specify fully the input spatiotemporal pattern on the skin.
If the functions gi discard information about the temporal modulation of all of the channel responses during the epoch, then we define the resulting neural code as a strictly spatial code. We write this symbolically as
If the functions gi discard information about the spatial modulation of all the channel responses over the area A, then the resulting neural code is a strictly temporal code. Symbolically,
Finally, if the gi are functionals that map all information. about spatial and temporal patterning over the spatiotemporal region in question onto univariant intensities or rates, then the code can only be some function of these intensities or rates; we define the resulting neural code as an intensive code. Sym- bolically,
where the gi are scalars representing some aspect of the response of each of the channels. This is the coding principle hypothesized by Richards (1979) and Johnson (1983).
There are at least two ways of interpreting Katz's hypothesis that vibration is essential to the perception of roughness. One is that the different mechanoreceptive channels require some

PERCEPTUAL ORGANIZATION AND COGNITION
temporal variation a t the skin in order for them to be properly excited. This interpretation would be entirely consistent with pure intensive coding by one or more of channels having limited response to steady (dc) pressure. The more interesting inter- pretation is that the code for texture depends upon temporal modulation of the responses of one or more of the spatiotemporal channels. This latter interpretation of Katz's hypothesis is con- sistent with either spatiotemporal or temporal coding.
The third proposal (Lederman, 1982; Taylor & Lederman, 1975) states that the adequate stimulus for perceived roughness is the instantaneous deformation of the skin. This implies that the neural code for roughness does not depend upon temporal patterning in any of the channels. This proposal is thus consistent with either intensive or spatial coding.
None of the hypotheses has been elaborated as a model detailing how a given spatiotemporal disturbance on the skin surface is transformed into a specific pattern of cortical activity or into a perceived texture. Hence, it is often not obvious what implications any of these empirical findings has for each of the three hypotheses.
5.7.7.2. Mechanoreceptor Responses to Textured Sur- faces. Three studies (Darian-Smith, Davidson, & Johnson, 1980; Darian-Smith & Oke, 1980: Lamb, 1983a) have examined the responses of mechanor&eptive units in rhesus monkeys to textured surfaces. The surfaces were either spatial gratings with a smoothed rectangular-wave depth profile that varied in spatial periodicity (Darian-Smith & Oke, 1980) or two-dimen- sional pincushion-like patterns that also varied in spatial pe- riodicity (Darian-Smith et al., 1980; Lamb, 1983a); as such, these qualify as rough surfaces by the definition given earlier. The textures were moved a t different velocities over the surface of the stationary digit pad while the activity of a single SA, RA, or PC afferent was recorded. The study by Darian-Smith and Oke (1980) established that the one stimulus feature directly represented in the response of each type of unit was the temporal frequency of vibration set up in the region of the unit's receptive field; this temporal frequency (in Hz) was given by the velbcity of the grating (in mm sec-') divided by the spatial period of the grating (in mm cycle-'). For each type of unit the temporal response was time-locked to temporal frequency over quite a range of frequencies. The SA units responded best to temporal frequencies in the range of 20-60 Hz, RA units to those in the range of 60-200 Hz, and PC units to those in the range of 100- 300 Hz.
Because different combinations of spatial periodicity and velocity gave rise to the same temporal frequency, a single unit could not code either variable unequivocally. On the other hand, a dense array of identical and independent units could in prin- ciple represent not just the velocity and spatial period i f the grating but its detailed spatial structure. The same conclusion was reached by Darian-Smith et al. (1980) in connection with the two-dimensional pincushion-like patterns that they studied. Although the three studies (Darian-Smith et al., 1980; Darian- Smith & Oke, 1980; Lamb, 1983a) did not, nor did they intend to, establish which principle is used to code roughness in general, Lamb (1983a) found stimuli for which intensive (rate) coding by a single class of mechanoreceptive units seemed likely.
5.1.1.3. Psychophysics of Roughness 5.1.1.3 (a). NEGLIGIBLE ROLE OF KINESTHESIS. Lederman (1981, 1983) had observers estimate the apparent roughness of textured surfaces in two conditions. In one, the observer moved the finger across the stationary surface; in the other, the surface was
passed beneath the finger that was held stationary by a brace. Both finger force and relative velocity between finger &d surface were equated between conditions. The stimuli were metal plates with regularly spaced parallel grooves; the various stimuli dif- fered in terms of groove width. The experiment showed that there was no difference in judgments of roughness between the two conditions, in terms of either the mean estimates or the variability of the estimates for a given stimulus. Since the sta- tionary finger condition involved neither active nor passive kinesthetic perception of the motion between finger and plate, the results indicate that estimates of perceived roughness depend solely on the tactile sense.
In a related study, Lamb (1983b) found that roughness discrimination as well does not depend upon active or passive kinesthesis. The textured stimuli were rectangular arrays of raised dots that varied in terms of the spatial period of the dots in one direction. In the "active" (active haptic) condition, the observer moved the finger over the stimulus texture. In the "passive" (tactile) condition, the immobilized finger was stim- ulated by a texture mounted on a rotating drum. On each trial, the observer responded whether two textures presented in close succession were the same or different in spatial period. There was essentially no difference in discrimination performance between the two conditions. 5.1.1.3 (b). VARIABLES INFLUENCING PERCEIVED ROUGHNESS. Two early studies on perceived roughness used sandpapers and emery cloths that varied in grit value (reciprocal of particle size). Ste- vens and Harris (1962) had subjects make magnitude estimates of both roughness and smoothness of emery cloths and found that the two perceptual dimensions were power functions of grit value with exponents of 1.5 and -1.5, respectively; this result indicates that smoothness and roughness are reciprocally related. Ekman, Hosman, and Lindstrom (1965) also had subjects judge roughness and smoothness, this time of sandpapers. They specified the sandpapers in terms of the static coefficient of friction (re the finger) and found that the two perceptual di- mensions were power functions of this variable and again in- versely related. The power function exponents were found to vary considerably across subjects.
Understanding of roughness perception has been advanced considerably by the use of textured stimuli that vary in terms of just a few physical parameters. The psychophysical work has employed metal plates with equally spaced parallel grooves cut or etched into them. The depth profile of a section of the plate running orthogonally to the grooves is that of a periodic rectangular waveform; the depth of the grooves is always suf- ficient to avoid bottoming out of the finger. Two parameters that specify the different plates are groove width and land width (spacing between grooves); the spatial period is the sum of groove width and land width, and spatial periodicity is the reciprocal of spatial period. Other variables that have been studied include contact force, scanning velocity, and skin temperature. In all this work, subjects scanned the metal plates in a direction per- pendicular to the grooves using the fingertips of one of more fingers; subjects responded by giving a number judged propor- tional to the perceived roughness of each plate (method of mag- nitude estimation). The major findings are given below.
1. The most important stimulus determinant of perceived roughness is groove width (Lederman, 1974, 1981; Lederman & Taylor, 1972; Taylor & Lederman, 1975). Figure 31.29 gives the results from Ex~eriment 4 of Lederman (1974) in which contact force and groove width were varied and land width was

TACTUAL PERCEPTION
NOMINAL GROOVE WIDTH (millimeters)
Figure 31.29. Perceived roughness of grooved plates as a function of nominal groove width and finger force. The stimuli were metal plates with regularly spaced parallel grooves; they differed from each other in groove width. The space between grooves (land width) was constant across the set of plates at 0.25 mm. On a given trial, the observer moved the tip of the middle finger back and forth over the stimulus plate (orthogonal to the grooves). Finger force was varied by means of an apparatus fashioned after an arm balance. The observer judged the perceived roughness of the plate and responded with a verbal magnitude estimate proportional to perceived roughness. The geometric means of the estimates of six observers are plotted against nominal groove width and finger force. Perceived roughness increased with both finger force and groove width (Lederman, 1974).
held constant. (Spatial period covaried with groove width since spatial period is the sum of groove width and land width.)
2. W h e n moove width was held constant and land width - was varied (resulting in covariation of spatial period), perceived roughness varied only slightly (Lederman, 1974; Lederman & Taylor, 1972). The results given in Figure 31.30 are from Ex- ~ e r i m e n t 3 of Lederman (1974).
3. Spatial period per se has a minimal effect on perceived roughness. This can be understood by comparing the results of Figures 31.29 and 31.30. By design, the land and groove widths of Figure 31.29 corresponded to the groove and land widths, respectively, of Figure 31.30 (Lederman, 1974). This means that the spatial periods of the gratings of the two experiments covered precisely the same range with spatial period increasing with groove width in Figure 31.29 and with land width in Figure 31.30. Whereas perceived roughness increased dramatically with groove width (and spatial period) in Figure 31.29, i t remained constant or decreased with land width (and spatial period) in Figure 31.30. This is important, for it shows that spatial pe-
- riodicity (fimdamental spatial frequency) is not a major variable influencing the perceived roughness of these types of stimuli. Furthermore, because the temporal pulse frequency of a me- chanoreceptive unit would be equal to the spatial periodicity of the grating times the relative velocity between skin and grating, this result also suggests that temporal pulse frequency does not control perceived roughness.
4. Stimulus velocity over a t least a twelvefold range has a negligible effect on perceived roughness, whether it is the hand that moves or the stimulus relative to the stationary hand (Lederman, 1974, 1983). This finding poses a problem for the temporal coding principle, because of the large variation in
temporal pulse frequency accompanying the variation in stim- ulus velocity. However, one can salvage the idea by arguing for roughness constancy under conditions where the observer knows the relative velocity between finger and stimulus, either by way of kinesthesis or, in the stationary finger conditions, by cutaneous processing alone.
5. Contact force has a substantial influence on perceived roughness. Evidence of this is given in both Figure 31.29 and Figure 31.30.
6. Varying skin temperature from 10 to 43°C causes a sizable increase in perceived roughness of grooved plates, es- pecially those with groove widths of less than 0.5 mm (Green, B. G., Lederman, & Stevens, J. C., 1979).
Findings 1 through 5 motivated development of a model of roughness perception (Taylor & Lederman, 1975) based on the idea that the adequate stimulus for perceived roughness is some aspect of the instantaneous deformation of the skin. From sim- ulations of static skin deformation as a function of contact force, groove width, and land width, they identified the parameter of deformation that best accounted for perceived roughness. If A, is the cross-sectional area of skin deviating from its resting position within the grooves of the grating, the best-fitting pa- rameter is the integrated value of A, over the region of fingertip in contact with the grating. 5.1.1.3 (c). SELECTIVE ADAPTATION AND PERCEIVED ROUGHNESS. AS discussed in Section 3.1.1.2 (b), there is converging psycho- physical evidence for a t least two functionally distinct mech- anisms of cutaneous sensibility in humans (Gescheider & Ver- rillo, 1979; Verrillo, 1968; Verrillo & Gescheider, 1979). For
CL w m L 0
0 . 3 0 =Low. 28 gf = Medium. 112 gf
A = High. 448 gf
0 . 2 0.1 0.2 0.5
NOMINAL LAND WIDTH (millimeters)
Figure 31.30. Perceived roughness of grooved plates as a function of nominal land width and finger force. The stimuli were metal plates with regularly spaced parallel grooves; they differed from each other in land width (the spacing between grooves). The groove width was constant across the set of plates at 0.25 mm. On a given trial, the observer moved the tip of the middle finger back and forth over the stimulus plate (orthogonal to the grooves). Finger force was varied by means of an apparatus fashioned after an arm balance. The observer judged the perceived roughness of the plate and responded with a verbal magnitude estimate proportional to perceived roughness. The geometric means of the estimates of four observers are plotted against nominal land width and finger force. Perceived roughness increased with finger force, decreased with the largest land values, and was essentially constant over most of the range of smaller land values (Lederman, 1974).

PERCEPTUAL ORGANIZATION AND COGNITION
one of these mechanisms, the function relating absolute threshold to vibration frequency is similar to the tuning curve of the Pacinian corpuscle, with peak sensitivity a t about 250 Hz; ac- cordingly, this mechanism has been referred to as the Pacinian system. The other mechanism has a much flatter frequency sensitivity function and is normally more sensitive than the Pacinian system to frequencies of less than 50 Hz; it is referred to as the non-Pacinian system. One of the ways in which the two mechanisms have been distinguished is in terms of fre- quency-selective adaptation to vibration. High-frequency vi- bration reduces the sensitivity of the Pacinian mechanism more than that of the non-Pacinian system, whereas low-frequency vibration adapts the non-Pacinian system more (Gescheider & Verrillo, 1979).
Lederman, Loomis, and Williams (1982) took advantage of this differential adaptation of the two mechanisms in a study of roughness perception. There were three adaptation conditions, in each of which the subject rested the distal pad of the index finger on the large contactor of a vibrator. The finger was exposed in one condition to intense 20-Hz stimulation, in the second to intense 250-Hz stimulation, and in the third (control) to just
1.0, SUBJECT '5' 1
LOG GROOVE WIDTH (millimeters)
Figure 31.31. Null effect of adaptation to vibration on the perceived rough- ness of grooved plates. In this experiment, there were three adaptation con- ditions, in each of which the observer rested the index finger pad on the large contactor of a vibrator. In the first condition, the finger was exposed to intense 250-Hz vibration; in the second, to intense 20-Hz vibration; and in the third, to steady pressure of the contactor (control condition). Mea- surements confirmed that vibration sensitivity of the finger was attenuated by adaptation to the two frequencies. Under the same conditions of adaptation, subjects judged the roughness of grooved metal plates. The adaptation state was maintained by permitting the observer to remove the finger from the contactor only for brief periods during which the roughness judgments were made. The results of the three observers indicate no systematic effects of adaptation to vibration on perceived roughness (Lederman, Loomis, & Williams, 1982).
the steady pressure of the contactor. Estimates of vibration magnitude by three subjects in each condition demonstrated that there were large selective adaptation effects. That is, adaptation to 20-Hz vibration selectively attenuated the per- ceived magnitude of subsequent 20-Hz vibration relative to that of subsequent 250-Hz vibration, and the converse was true for adaptation to 250 Hz. The important result, however, was that when magnitude estimates were made of the roughness of grooved plates under precisely the same conditions of adaptation there were no discernible effects of adaptation state. The results for the three subjects are given in Figure 31.31. The finding that perceived roughness was not affected under conditions that presumably altered the relative sensitivities of the mechanisms mediating cutaneous sensibility argues against the coding principle proposed by Richards (1979) and Johnson (1983). Fur- thermore, if the perceived 20-Hz and 250-Hz vibration mag- nitudes correspond to the excitations of the adapted mechanisms, this result is inconsistent with the idea that the code for rough- ness is the temporal modulation of either the Pacinian or non- Pacinian mechanism responses. However, the result would be consistent with the idea that just one of the underlying mech- anisms involved in cutaneous sensibility codes roughness if it were true that that particular mechanism (say, the SA I channel) was unaffected by adaptation to either 20 Hz or 250 Hz. 5.1.1.3 (d). ROUGHNESS DISCRIMINATION. Morely, Goodwin, and Darian-Smith (1983) studied the discrimination of grooved plates that varied in spatial period. The groove widthlland width ratio was held constant for all of the stimuli, which consisted of two standards with spatial periods of 770 km and 1002 km and a large number of comparison stimuli varying in spatial period above and below the values of the standards. On a given trial, two identical standards and one comparison were set into three adjacent slots, with one of the standards always at the leftmost position. The subject's task was to detect the odd stimulus using one finger by feeling the three stimuli in any sequence for up to 10 sec; there were no constraints on the motions of the finger or the force applied. Averaged over subjects and the two stan- dards, the just noticeable increment or decrement (for 75% correct discrimination) was 5.2% of the period of the standard. When two subjects later performed the same experiment with the 1002-km standard using static touch rather than movement of the finger, the just noticeable difference for the two subjects increased from 46 km (4.6%) to 103 km (10.3%L
A more systematic investigation of roughness discrimination has been reported by Lamb (1983b). The stimuli were rectangular arrays of raised dots varying in terms of the spatial period in one direction; because dot size within a series was held constant, the increase in spacing between rows ("groove" width) was equal to the increase in spatial period. Two textured stimuli were presented on each trial, the first being a standard of fixed period and the second a comparison that was either equal or unequal in period to the standard. The obsewer's task was to report whether the comparison was the same as or different from the standard. The discrimination index, d', increased linearly with the percentage of change in spatial period over a considerable range of the smaller values. The change in period required for 75% correct responding (d' = 1.35) was approximately 2% and 2.5% for standards with spatial periods of 2.0 and 1.0 mm, respectively. Discrimination performance was little affected by whether the subject moved the finger across the stimuli ("active" touch mode) or the stimuli were moved across the finger C'pas- sive" touch mode), by the type and velocity of scanning motions used in the "active" touch mode, and by the manipulation of

TACTUAL PERCEPTION
contact force (65 g and 100 g) in the "passive" touch mode. When contact time with the tile was decreased to 0.3 sec from the 1.2 sec used otherwise in the "passive" touch mode, per- formance dropped substantially, indicating that 0.3 sec is too short to permit good discrimination. 5.1.1.3 (e). ROUGHNESS ENHANCEMENT. Subjects are better able to detect a very small (e.g., 13 Fm high) raised line against an otherwise smooth surface when they feel it through a piece of paper moving with the finger than when they feel it using the bare finger (I. E. Gordon & Cooper, 1975). In a similar vein, the perceived roughness of some textures, such as abrasives covered by ordinary paper, is greater when the textures are scanned by the finger covered with an additional piece of paper than when scanned by the bare finger (B. G. Green, 1981; Led- erman, 1978a, 197813). However, roughness enhancement does not occur with all or perhaps even a majority of textures. For instance, uncovered sandpapers feel rougher with the finger bare than with the finger covered (B. G. Green, 1981). The data demonstrating these two opposing results are given in Figure 31.32 (from B. G. Green, 1981).
One possible explanation of roughness enhancement is based on Ledeman's suggestion (1978a, 1978b) that when the skin moves laterally over a surface the resulting shear forces (those tangential to the skin) might lead to neural activity that masks the signals corresponding to deformations of the skin normal to the surface. Supporting this interpretation are the results of one experiment (Ledeman, 197813). The independent variable was the relative shearing force produced as the finger moved across each textured surface. Each of four textured stimuli was
0 = Bare sandpaper, bare finger 0 = Bare sandpaper. covered finger A = Covered sandpaper. covered finger A = Covered sandpaper, bare finger
RECIPROCAL OF GRIT NUMBER
Figure 31.32. Perceived roughness of sandpapers as a function of intervening materials. The stimuli were sandpapers either covered with thin adhesive tape or bare; they are specified in terms of the reciprocal of grit value. Observers judged the perceived roughness of the sandpapers and then verbally responded with a magnitude estimate proportional to perceived roughness. Observers judged roughness of either bare or covered sandpapers with the bare finger or with the finger covered with tape. The results given in the figure are the geometric means of 15 observers. They indicate that when the sandpapers were bare perceived roughness was greater when the finger was bare than when it was covered; however, when the sandpapers were covered, perceived roughness was greater when the finger was also covered than when it was bare (Green, 1 981 1.
prepared by forming a layer of g!ass beads on a flat surface; the physical roughness of the four stimuli varied by virtue of the average diameter of the beads used for each (measured as the width of the sieve aperture). Three different conditions of touching were arranged to produce three different levels of shear for the same normal force between finger and surface. In the low shear condition the spherical beads were free to roll over the glass sheet as the subject's finger, covered with two layers of tissue paper, passed over them. In the medium shear condition the beads were glued to the glass sheet and were covered with one sheet of tissue paper; the subject moved the finger, covered by a second sheet, over the covered beads. In the high shear condition, the beads were again glued to the surface and were covered with two sheets of tissue paper, over which the subject's bare finger passed. Independent measurements confirmed the ordering of shear forces for a constant normal force. The results of the experiment are shown in Figure 31.33.
5.1.2. Perception of Other Textural Dimensions. Stevens and Guirao (1964) had subjects judge the viscosity of seven liquids under three conditions: (1) by stirring them with a rod held in the hand (with eyes closed); (2) by viewing them as the container was shaken; and (3) by stirring them with a rod and viewing them at the same time. The power function relating apparent viscosity to viscosity was virtually the same in all three conditions.
Cussler, Zlotnick, and Shaw (1977) asked subjects to rate each of 14 liquids in terms of the ten adjectives used most often to describe cosmetics: thick, thin, spreadable, soft, hard, smooth, creamy, dry, warm, and cool. From a multiple-regression analysis of the responses, they determined which three attributes best predicted the occurrence of the responses to the remaining seven attributes; they were smooth, thin, and warm. Cussler et al. then determined the rheological properties of the liquids that corresponded to the adjectives smooth and thin. Smoothness was found to be closely related to the friction force and thinness to the viscous force.
5.2. Haptic Perception of Two- and Three- Dimensional Form
5.2.1. Visual Substitution Devices as "Haptic Systems!' One of the important contributions of optical-to-tactile image trans- lation devices such as the Optacon and the TVSS is the stim- ulating effect they have had on thinking about "haptic touch." In normal haptic perception, the cutaneous sensory surface is part of the limb that is actively moved through space. These conversion devices typically have an optical sensor (camera) that is separate from the tactile display. Research with the Optacon has shown that having the tactile display on one hand while the other hand performs the exploratory motions presents no difficulty whatsoever for the observer. Similarly, one of many intriguing observations made by White, Bach-y-Rita, and their associates in research with the TVSS (Bach-y-Rita, 1972; White, 1970; White et al., 1970) was that when subjects were given control of the camera for a long period of training they eventually ceased to be aware of the stimulation of the skin, instead ex- periencing objects in phenomenally objective space. This ob- servation accords with the conclusion of Katz (cited in K ~ e g e r , 1970, 1982), Gibson (1966), and Weber (184611978) that the objective pole of experience predominates when observers ac- tively explore with touch (see Sections 2.1 and 2.2). In a phe- nomenological account of learning to use the TVSS, Guarniero (1974) observed that when he was given control of the camera

PERCEPTUAL ORGANIZATION AND COGNITION
NOM l NAL SIEVE APERTURE Wl DTH (mi c r ons)
Figure 31.33. Perceived roughness of textured surfaces as a function of the degree of shear between surface and finger. Each of the stimuli in this condition was prepared by forming a layer of beads on a flat surface. The physical roughness of the stimuli varied by virtue of the average diameter of the beads used for each (measured as the width of the sieve aperture). Three different conditions of touching were arranged to produce three levels of shear for the same normal force between finger and surface (see text for details). The values of perceived roughness in the figure are the geometric means of 35 observers. They indicate that the lower the shear force the higher the perceived roughness of a surface (Lederman, 1978a, 197813).
he was able to distinguish between image motions produced by camera scanning and those produced by motion of the distal object; however, when the camera was moved by someone else, he could not distinguish the two.
5.2.2. Comparison of Tactual Modes. By investigating how tactual perception and performance depend upon tactual mode one can discern the sources of information used by the observer in any given task; in particular, one can assess the relative contributions of cutaneous and kinesthetic stimulation and the importance of active control in the pickup of information. This section presents the experimental findings dealing with the effects of tactual modes on perception. It makes use of the ter- minology developed in Section 2.1 and represented in Table 3 1.1. Where different modes within the tactile category were employed, these are indicated using additional descriptors bor- rowed from the section on tactile display modes (Section 3.1.7).
Recall that the active-passive distinction adopted here is consistent with that used in the literatures dealing with kin- esthetic sensibility, motor control, and perceptual adaptation; i t refers to the observer's degree of control over the pickup of information. Gibson (1962, 1966) and others since then have often used a different meaning for passive touch, equating i t with what we have termed tactile perception. These two different uses ofpassive have led to some confusion. In our discussion of some experiments, we refer to the different tactual modes using our terminology, but we also indicate the author's terminology in parentheses when it was different.
5.2.2.1. Tactual Modes and Perception of Two-Dimensional Patterns. Reading text using the Optacon and braille depends little on whether the subject scans the text actively (with the camera or with the sensing hand in the Optacon and braille cases, respectively) or the tactile "print" moves beneath the
stationary hand (Craig & Shemck, 1982; Day & Dickinson, 1979; Grunwald, 1965). This suggests that it is cutaneous in- formation that is important, not kinesthetic information.
Gibson (1962) reported results of an experiment demon- strating that "active touch" leads to better perception of two- dimensional shape than does "passive touch,'' by which Gibson was refemng to tactile perception. Subjects attempted to rec- ognize simple two-dimensional shapes (cookie cutters of mean diameter equal to 2.5 cm) presented in one of three ways. In the tactile static (passive static) condition, the forms were pressed statically into the subjects' palms. In the tactile sequential (passive moving) condition, the forms were rotated back and forth while being pressed into the subjects' palms. Finally, in the active haptic (active) condition, subjects were free to scan the forms with their fingers in whatever way they wished. Rec- ognition accuracy in the three conditions was 49%, 72%, and 95%, respectively. (An additional condition, a variant of the tactile static mode in which the presentation was more carefully controlled, resulted in 29% accuracy.) Gibson rightly concluded that the experiment demonstrated the superiority of "active touch" over "passive touch," but the experiment failed to indicate whether the superiority of "active touch" was due to the active element of control, the contribution of kinesthetic information, or the higher spatial acuity of the fingers relative to the palms.
Four studies have repeated Gibson's (1962) experiment but with a few significant changes. Schwartz, Perey, and Azulay (1975) presented the "cookie cutter" stimuli in three tactual modes, two of them the tactile static and active haptic modes used by Gibson. In their third mode, which is best described as a tactile sequential mode, the edge of the form was passed se- quentially under the subject's outstretched and stationary finger, in a roughly circular traverse of the pattern. They found virtually identical results as Gibson in the replicated conditions (rec- ognition accuracies of 94% and 39% in the haptic active and tactile static conditions) but found a surprisingly high 93% accuracy in the tactile sequential mode. They interpreted these results as showing that "passive touch," that is, tactile perception, is not necessarily worse than "active touch."
Two other partial replications of Gibson's (1962) experiment were carried out by Cronin (1977) and by Heller and Myers (1983). Both experiments were much the same as Gibson's except that in the active haptic condition, subjects felt the forms using the palm, rather than the fingers, thus controlling the variable of body locus. Cronin (1977) found that the tactile static condition led to significantly worse recognition performance than the other two conditions, which were not significantly different from each other. In contrast, Heller and Myers (1983) found that the active haptic mode was significantly better than the two tactile modes, which were not significantly different from each other.
The last of the four experiments was conducted by Heller (1980). Stimuli were presented either for 2 sec or until the subject responded (unlimited duration) in each of four conditions. There were two active haptic modes, in which subjects freely explored raised two-dimensional patterns (nine in all) with either the fingers (Condition 1) or the palm (Condition 2). In the tactile static mode (Condition 3), the same patterns were presented to the palmar surface, while in the tactile sequential mode (Con- dition 4), the same shapes were traced in the stationary palm with a stylus. Recognition accuracy for Conditions 1 through 4 were 80%, 64%, 49%, and 32% for unlimited duration and 54%, 41%, 298, and 31% for 2 sec. All of the unlimited-duration values were significantly different, while in the 2-sec conditions only the "active-fingers" condition led to performance signifi-

TACTUAL PERCEPTION 31 -33
cantly different from the rest. These results do suggest that active haptic touch is better than both modes of tactile perception when simple two-dimensional patterns are being felt.
Contrasting shaprly with the findings mentioned above are the results of several experiments by Magee and Kennedy (1980). In their first experiment they compared "active" and "passive" perception of raised line drawings (of familiar objects) that were roughly 15 cm on a side. In the active haptic (active) condition, subjects traced the perimeter of the drawing with the finger, while in the passive haptic (passive) condition, the experimenter moved the subject's hand around the pattern. The passive group did significantly better in identifying the patterns. In a second experiment, the performance of active and yoked-passive subjects was compared, and once again the passive group performed better. These results prompted a third experiment in which one group of subjects (in the tactile se- quential condition) felt the raised drawing pass beneath the stationary finger while another group (in the passive kinesthetic condition) had their fingers passively moved by the experimenter over a nontangible image of the drawing. The passive kinesthetic group performed about as well as the earlier haptic passive groups had done, while the tactile sequential group performed quite poorly. Magee and Kennedy concluded that, in this task, passive kinesthesis was the predominant source of information and that the poorer performance of the active haptic group (in comparison with passive haptic) was possibly the result of the subjects' becoming confused between planned and executed movements. Regardless of the interpretation, i t is contrary to Gibson's claim that having control over the pickup of information leads to better performance.
5.2.2.2 Tactual Modes and Perception of Three-Dimensional Objects. We know of no studies that compare the perception of three-dimensional objects under the different tactual modes discussed. Yet i t is here that one most expects the active haptic mode to excel over all other tactual modes (tactile, kinesthetic, and passive haptic) by virtue of both the availability of kin- esthetic information and the control the observer exerts over the pickup of information (Gibson, 1962, 1966).
5.2.3. Percussion. Percussion is a technique used by phy- sicians in assessing the location of internal organs (Katz, 1930, 1936). The physician places the finger of one hand at various positions on the patient's body and taps on the skin with a finger of the other hand. By sensing the reflected vibrations at the different positions, the physician can judge the location of the organ being sought. Katz (1930, 1936) experimented with percussion using a crude physical model. He fashioned geo- metrical shapes out of lead and embedded them in cushioning within a cardboard box. By tapping the sides of the box, subjects were able to discriminate among the forms, even when auditory cues were eliminated.
5.2.4. Tactual Stereognosis. Tactual stereognosis is the tactual perception of three-dimensional form. Although people ordinarily perceive three-dimensional objects by palpation (manipulation by the hand), some are adept at using the feet and most can recognize objects placed within the mouth.
5.2.4.1. Oral Stereognosis. Oral stereognosis is the rec- ognition of three-dimensional objects using the tongue andlor sensory surfaces within the mouth. Weinberg, Lyons, and Liss (1970) compared recognition of 20 simple geometrical solid shapes using vision, manual stereognosis (palpation by the hand), and oral stereognosis and obtained mean recognition accuracies for yQung adults of 99%, 90%, and 74%, respectively. Further
information on oral stereognosis may be found in two volumes edited by Bosma (1967,1970) and in a brief discussion by Gibson (1966, pp. 143-144).
5.2.4.2. Manual Stereognosis 5.2.4.2 (a). RECOGNITION OF COMMON OBJECTS. Klatzky, Led- erman, and Metzger (1985) investigated the ability of observers to identify common objects by touch. The subjects were 20 blindfolded, sighted college students. The stimuli were 100 common objects that could be held easily in the hands and when seen were unambiguously identifiable by name. Potential au- ditory cues were masked by white noise fed into earphones. On each of the 100 trials, one of the objects was placed on a table directly in front of the subject; upon receiving a tactile ready signal, the subject picked up the object and began feeling it. Out of the 2000 responses given by all 20 subjects only 83 were incorrect, of which four were omissions and 14 were names of an object unrelated to the stimulus. A conservative estimate of identification accuracy was accordingly 96% correct. Fur- thermore, 68% of the responses occurred within 3 sec of initial contact with the object and 94% within 5 sec of contact.
5.2.4.2 (b). FUNCTIONS OF MANUAL SCANNING MOTIONS. According to Zinchenko and Lomov (1960) the micromotions and macro- motions of the hand performed during acquisition of object in- formation parallel similar motions of the eyes during visual perception. The function of the very small movements of the hand (micromotions) is to continue proper excitation of the re- ceptors and associated pathways in order to keep the tactile images from fading perceptually. The macromotions are those actually involved in the acquisition of object information. They have been divided into two major categories based on function: (1) exploratory motions; and (2) pursuit motions. There are two phases to exploration. During the "searching" phase, the observer scans the tactual field seeking the object of interest. These mo- tions are rapid and continuous, and they involve minimal use of tactile information. During the "directing" stage, the hands seek out a "reckoning-off" point (a prominent point of reference on the object, usually the topmost extremity). The directing phase establishes the position of the object relative to the body within the phenomenal tactual field.
Following the exploratory motions, one observes the pursuit motions with micromotions superimposed. One function of pur- suit motions is to "measure" various aspects of the object, some- times on the basis of the length of time taken to traverse part of the object. A characteristic feature of the pursuit stage, ana- logous to what has been observed with vision, is that the hands do not palpate the object in smooth continuous motion, but pause when the fingers reach critical points in the object contours, such as corners and linear intersections.
Adding to our descriptive knowledge of manual stereognosis are the findings and observations of Davidson (1972a, 1972b), Gibson (1962,1966), and &vBsz (1950). Beyond this, and very much needed in the study of stereognosis, are models specifying the internal representations that guide observers' seeking of information, representations similar to those hypothesized for vision (see Ballard & Brown, 1982; Marr, 1982).
5.2.4.2 (c) . HAPTIC PERCEPTION OF OBJECT ATTRIBUTES
1. Proportion. Appelle, Gravetter, and Davidson (1980) had subjects indicate whether different rectangular forms, varying in size, had the same or different proportions. On the basis of the subjects' introspective reports and their performance under different instructional sets, the authors concluded that

PERCEPTUAL ORGANIZATION AND COGNITION
proportion is neither directly nor spontaneously perceived by the haptic sense, as seems to be the case in vision.
2. Curvature. I. E. Gordon and Morison (1982) investi- gated the haptic detection and discrimination of curvature of small smooth surfaces. The stimuli were plano-convex lenses varying in the degree of curvature of the upper convex surface. The lens surfaces were masked off to leave an open strip of 10 mm by 20 mm across the center. Observers scanned this strip using the fingertip. A two-alternative forced-choice judgment was employed in which on a given trial two stimuli were pre- sented in a random order. In the detection task, the standard stimulus was a blank lens with flat surface, while in the dis- crimination task, it was a lens with some degree of curvature. In both tasks, the subject had to identify the lens of greater curvature. Each curvature was specified by the maximum el- evation of the convex surface at its peak relative to that at its edge (base-to-peak height). The average absolute threshold for 20 subjecb was 0.09 mm (base to peak). The average difference threshold was 0.10 mm (base to peak) for a 0.12 mm standard and 0.12 mm for a 0.14 mm standard.
3. Moment oflnertia. The moment of inertia of an object is a measure of its inertial resistance to rotation; it depends upon the axis of rotation. Kreifeldt and Chuang (1979) created cylindrical test stimuli that were of equal mass and had their centers of gravity (CG) at their geometrical centers but varied in their moments of inertia (along the long axes). The stimuli of the Experiment 1 were representative of metal safety razors in size and mass; they were 12.7 cm long and 1.9 cm in diameter. Those of Experiment 2 were representative of tennis rackets, being 68.6 cm by 3.2 cm and of appropriate mass. On each trial subjects were given a standard and one comparison and were asked to rotate them and then to judge which appeared more "top-heavy." In Experiment 1 subjects grasped the cylindrical stimuli at their CG between thumb and index finger. In Ex- periment 2 the stimuli were grasped 7.6 cm from one end. In both cases, the moments of inertia were calculated from the point of rotation. The difference thresholds for moment of inertia were defined in terms of 75% correct ~erformance. When ex- pressed as proportions (Weber fractionsjof the moment of inertia of the standards, they were in the range of roughly 0.2-0.45. In general, this proportion increased with moment of inertia, thus failing to satisfy Weber's law. Kreifeldt and Chuang in- terpret a proportion of 0.28 by way of the following example. If two pencils, one 19 cm long and the other 21.5 cm long and the two of equal weight, were compared by an observer in terms of moment in inertia (by rotation about the center), they would be correctly ordered about 75% of the time. 5.2.4.2 (d). PALPATION THROUGH INTERVENING MATERIAL. A skillful physician can judge the approximate location, size, and shape of abdominal organs or of a fetus within the uterus by palpating the skin of the patient. Katz (1936) noted the report of one physician who was able to achieve satisfactory results using palpation even though his fingers were anesthetized. A more systematic investigation of palpation dealt with how well ob- servers could detect lumps in silicone breast models as a function of the hardness of the lumps and their depths within the sub- strate (Bloom, Criswell, Pennypacker, Catania, & Adam, 1982).
5.2.5. Imagined Rotation of Tactually Perceived Ob- jects. Research on the imagined rotation of visually perceived objects (Cooper & Shepard, 19821, first reported by Shepard and Metzler (1971), has proven a useful way to investigate the in- ternal representations observers have of objects. A logical ex-
tension of the vision work has been to examine the tactually based representations of objects that blind observers have. In the first of two such studies the stimuli were a nonsense form and its mirror image (Marmor & Zaback, 1976). One of these was presented in upright orientation to one hand while the same form or its mirror image was presented to the other hand in one of five orientations. It was found that the reaction times of subjects to judge whether the two objects were same or different increased linearly with the angular difference between the two objects. This finding and the introspective reports of the subjects (congenitally blind, adventitiously blind, and sighted) gave clear evidence that they were imagining the rotation of these tactually sensed objects.
In the second study (Carpenter & Eisenberg, 19781, the letters F and P and their mirror images were used as stimuli. On a given trial, one of the stimuli was placed horizontally on a table at one of six orientations relative to the median plane of the subject's body. The subject placed his hand directly on top of the letter and had to respond whether it was normal or reversed. The average reaction time data for 12 congenitally blind subjects are given in Figure 31.34. Again reaction time systematically increased with the angular departure from up- right orientation. The reaction times were much longer than those typically found in visual studies, but control experiments showed that the longer haptic reaction times were related to modality, not to whether subjects had had prior visual expe- rience. By varying the orientation of the arm relative to the body during the haptic task, Carpenter and Eisenberg showed
ANGULAR DEPARTURE FROM UPRIGHT (degrees)
Figure 31.34. Latency to respond whether a haptically explored letter was normal or mirror reversed as a function of its angular departure from upright. The stimuli were the letters F and P, and their mirror images; they were 8 cm high, 4 cm wide, and 1 cm deep. On a given trial one of the four stimuli was placed flat on a table in front of the observer in some angular orientation relative to upright (the "top" of the letter lying farthest from the observer). The observer placed one hand on the letter and responded whether it was normal or mirror reversed. The average response latencies for 12 congenitally blind observers are shown as a function of angular departure from upright and as a function of whether the stimulus was normal or reversed. The results indicate that latency to respond is systematically related to the angular de- parture from upright and suggest that congenitally blind observers are able to imagine the rotation of objects sensed tactually (Carpenter & Eisenberg, 1978).

TACTUAL PERCEPTION
that sighted subjects tend to encode orientation of the letter relative to the axis of the arm rather than relative to the median plane of the torso.
5.2.6. Virtual Vantage Point of Tactual Perception. If a simple pattern, such as lowercase b or uppercase L, is drawn on a person's forehead or abdomen, the person is quite likely to report its mirror image. If such a pattern is drawn on the back of the person's head or midtorso, the person is apt to report it in its correct orientation. These two results have been con- firmed and extended in a number of studies, most of them using the observer's phenomenological report of pattern orientation. The three principal findings of the earlier research on this topic are given below.
1. Roughly 70-85% of subjects report patterns drawn on the forehead or abdomen as mirror reversed, while the remaining 1 5 3 0 % report the patterns to be of correct orientation (Allen & Rudy, 1970; Duke, 1966; Holmes, Roeckelein, & Olmstead, 1968; Krech & Crutchfield, 1958; Natsoulas & Dubanoski, 1964).
2. Over 90% of subjects report that they perceive patterns drawn on the back of the head or torso in the correct orientation (Allen &Rudy, 1970; Duke, 1966; Holmes, Roeckelein, & Olm- stead, 1968, Krech & Crutchfield, 1958; Natsoulas & Dubanoski, 1964).
3. With the head facing forward (re the body), patterns drawn on the sides of the head are reported as mirror reversed roughly half the time (Natsoulas & Dubanoski, 1964). When the head is then turned to one side, patterns drawn on the opposite side of the head are more likely to be reversed while those on the same side are less likely to be reversed (Natsoulas & Dubanoski, 1964).
A significant advance in our understanding of these phe- nomena was brought about by the mere change in procedure of drawing the patterns on the mobile hand (Corcoran, 1977). Corcoran observed that, regardless of the location of the hand (whether in front of the head or behind the head), patterns drawn on the palm were reported correctly when the palm was oriented toward a distant point behind the observer. Conversely, if the palm was oriented toward a point well in front of the observer, patterns drawn upon it were reported as reversed. These and other informal observations led Corcoran to formulate a hypothesis in terms of a "disembodied eye." It states that tactile patterns are interpreted as if they were drawn on the surfaces of a transparent body and "viewed" from some point usually well behind and slightly above the observer. The "di- sembodied eye" hypothesis is essentially a restatement of a hypothesis proposed earlier by Duke (1966), but with the mod- ification that the vantage point of the "disembodied eye" need not be behind the observer in all situations.
A second advance in our understanding resulted from two additional methodological changes (Kubovy, Turock, Best, & Marcus, Note 3). The first of these was to substitute phenom- enological reports of the pattern's orientation with forcedchoice judgments between two alternative patterns, an inverted L and its mirror image. The second change involved instructing the subjects to imagine assuming various vantage points relative to the head while identifying patterns drawn at different po- sitions about the head. Two p u p s of subjects participated using two different pairs of "virtual vantage points" (VVPs). One group assumed one VVP in front of the head facing backward Want) and another behind the head looking forward (Behind). The second group assumed one VVP that was inside the head
looking outward normal to the pattern (Inside) and another outside the head looking inward normal to the pattern (Outside). The six locations used about the head were left forehead (FL), forehead (F), right forehead (FR), right occiput (OR), occiput (O), and left occiput (OL). A response was judged correct if the pattern reported was the same as that which would have been seen if viewed from the designated vantage point. Subjects were instructed to respond as quickly as possible but to place more emphasis on accuracy than on latency.
The average reaction times for the different W P s and head positions are given in Figure 31.35. These data indicate that,
STIMULUS POS l T l ON
Figure 31.35. Latency to report the identity of patterns drawn at different locations about the head as a function of the virtual vantage point assumed by the observer. The stimuli were an inverted 1 and its mirror image. On each trial, one of these was drawn at one of six locations about the head: FL-forehead left; F-forehead center; FR-forehead right; OL-occiput left; &occiput center; and OR-occiput right. Observers were asked to report the identity of the pattern in terms of how it would be judged if viewed from a particular virtual vantage point (WP) in space. One group assumed a W P either in front of the head facing backward (Front) or behind the head looking forward (Behind). The second group assumed a VVP either inside the head looking outward normal to the pattern (Inside) or outside the head looking inward normal to the pattern (Outside). The average reaction times for the two groups as a function of head position and W P are shown. The results are consistent with the idea that observers interpret patterns drawn upon the skin from a preferred W P well behind the head and that interpreting patterns from any other W P takes additional time (Kubovy, Turock, Best, & Marcus, Note 13).

PERCEPTUAL ORGANIZATION AND COGNITION
when observers were instructed to assume a WP behind the head looking forward (Behind), reaction times were lower than when they were instructed to assume a W P in front looking back (Front). This result supports the "disembodied eye" hy- pothesis (Corcoran, 1977) if one further supposes that, when subjects imagine adopting a virtual ~ a n t a ~ e - ~ o i n t other than the preferred one (that of the "disembodied eye"), the cognitive process involves one or more additional steps that are less auto- matic. The results obtained with the InsidelOutside group also support this hypothesis, for subjects responded more quickly in the Inside condition than in the Outside condition for patterns drawn on the forehead and more quickly in the Outside condition than in the Inside condition for patterns drawn on the occiput. Error data (not shown) also support the general pattern of results.
These phenomena have implications for both tactile and haptic pattern perception and for the design of sensory prostheses. The results of Corcoran (1977) obtained with the hand demonstrate very clearly that the perception of tactile patterns is a function of the perceived static posture of the body surface on which they are drawn; going further, they suggest that the pattern orientation is represented in terms of distal space rather than in terms of body surface coordinates. This conclusion makes intelligible the finding of Moser and Houck (1970) that a significant proportion of subjects reported patterns presented to the upper surface of the tongue as inverted or mirror reversed. It also raises the possibility that, if tactile displays such as those used for presenting tracking and speech information are positioned on the hand or arm, perceptual errors might result with the limb in unusual orientations.
Although virtually all of the work on this topic has involved the perception of tactile patterns drawn on the skin of a passive obsewer, it is incorrect to think of these phenomena as reflecting properties of cutaneous processing. Oldfield and Phillips (1983) have reported that when obsewers feel raised letters with the finger the letters appear of normal orientation when they face the observer, but are perceptually reversed when they face away. As the authors of this chapter have obsewed, these results are no less vivid when large two-dimensional raised patterns are employed, patterns that require considerable movements of the hand and fingers. Thus, the phenomena are rightly considered within the province of haptic perception. As the phenomena come to be better understood, they may be found to be mani- festations of yet a more general level of functioning dealing with spatial perception and cognition.
6. CONCLUDING REMARKS
It is our belief that understanding of the sense of touch, like understanding of all complex systems, will derive from a "meaningful decomposition" of the system into a minimal set of concepts a t one or more functional levels (Marr, 1982; Simon, 1962; Ullman, 1980). We are confident that the coarse decom- position of touch into cutaneous and kinesthetic components adopted here and elsewhere is the appropriate starting point. Even without probing the physiological mechanisms of each of these two subsystems, much progress toward an understanding of touch can be achieved by (1) assessing the properties of each subsystem that determine the stimulus information that is and is not available to the observer, and (2) investigating the nature of internal tactual representation. Unfortunately, relatively little research has been done on either problem. The result is that our knowledge of touch consists of only fragmentary concepts
and findings, some dealing with basic fimdional properties (e.g., cutaneous sensitivity, limits of kinesthetic space perception) and others with capabilities of the system as a whole (e.g., the identification of three-dimensional objects). One hopes that the parallel investigations of touch at several functional levels will lead in the not too distant future to a comprehensive under- standing of tactual perception and tactually based performance.
ACKNOWLEDGMENT
The authors are grateful to the following people who assisted us during preparation of the chapter: Ruzena Bajcsy, Roger Cholewiak, James Craig, Francis Clark, Brian Craske, Donald MacLeod, the late Leon Harmon, Richard Jagacinski, Kenneth Johnson, Jacob Kirman, Roberta Klatzky, Charlotte Reed, Carl Sherrick, Tenji Wake, and Deborah Wheeler. We also express our appreciation to general editors Kenneth Boff and Lloyd KauFman for their thoughtful and detailed reviews. Our greatest appreciation goes to Michael Kubovy, whose editorial efforts proved immensely valuable in pointing out the weaknesses in our thought and expression.
REFERENCE NOTES
1. Loomis, J. M. Tactile and visual legibility of seven character sets. Paper presented at the meeting of the Psychonomic Society, 1983.
2. Loomis, J. M. Unpublished work. 3. Kubovy, M., Turock, D., Best, T. L., & Marcus, J. The virtual vantage
point for the identification of cutaneous patterns. Manuscript in preparation.
REFERENCES
Allen, D. B., & Rudy, K. P. Perception of simple figures drawn upon the body surface. Perceptual and Motor Skills, 1970,30,369-370.
Alpern, M. Metacontrast. Journal of the Optical Society of America, 1953,43,648-657.
Annis, R. C., & Frost, B. Human visual ecology and orientation anisotropies in acuity. Science, 1973,182,729-731.
Anstis, S. M. A chart demonstrating variations in acuity with ret- inal position. Vision Research, 1974,14, 589492.
Apkarian-Stielau, P., & Loomis, J. M. A comparison of tactile and blurred visual form perception. Perception and Psychophysics, 1975, 18,362468.
Appelle, S. Perception and discrimination as a function of stimulus orientation: The "oblique effect" in man and animals. Psychological Bulletin, 1972, 78,266-278.
Appelle, S., Gravetter, F. J., & Davidson, P. W. Proportion judg- ments in haptic and visual form perception. Canadiun Journal of Psychology, 1980,34, 161-174.
Arbib, M. A., Overton, K. J., & Lawton, D. T. Perceptual systems for robots. Interdisciplinary Science Reviews, 1984,9,31-46.
Austin, T. R., & Sleight, R. B. Accuracy of tactual discrimination of letters, numerals, and geometric forms. Journal of Experimental Psychology, 1952,43,239-247.
Bach-y-Rita, P. Brain mechanisms in sensory substitution. New York: Academic, 1972.
Ballard, D. H., & Brown, C. M. Computer vision. Englewood Cliffs, N.J.: Prentice-Hall, 1982.
Beauchamp, K. L., Matheson, D. W., & Scadden, L. A. Effect of stimulus- change method on tactile-image recognition. Perceptual and Motor Skills, 1971,33, 1067-1070.
Bejczy, A. K. Effect of hand-based sensors on manipulator control per-

TACTUAL PERCEPTION
formance. Mechanism and Machine Theory, 1977,12,547-567. Bledsoe, W. Braille: A success story. In Evaluation of sensory aids
for the visually handicapped. Washington, D.C.: National Academy of Sciences, 1972.
Bliss, J. C. A relatively high-resolution reading aid for the blind. ZEEE Tmnsactions on Man-Machine Systems, 1969,lO.l-9.
Bliss, J. C. Summary of three Optacon-related cutaneous experiments. In F. A. Geldard (Ed.), Cutaneous communication systems and de- vices. Austin, Tex.: The Psychonomic Society, 1974.
Bliss, J. C. Reading machines for the blind. In G. Gordon (Ed.), Active touch: The mechanisms of recognition of objects by manipulation. Oxford: Pergamon, 1978.
Bliss, J. C., Crane, H. D., & Link, S. W. Effect of display movement on tactile pattern perception. Perception and Psychophysics, 1966, 1,195-202.
Bliss, J. C., Crane. H. D., Link, S. W., & Townsend. J. T. Tactile per- ception of sequentially presented spatial patterns. Perception and Psychophysics, 1966,1,125-130.
Bliss, J. C., Crane, H. D., Mansfield, P. K., & Townsend, J. T. Information available in brief tactile presentations. Perception and Psycho- physics, 1966,1,273-283.
Bliss, J. C., Katcher, M. H., Rogers, C. H., & Shepard, R. P. Optical- to-tactile image conversion for the blind. ZEEE Tmnsactions on Man-Machine Systems, 1970,11,58-65.
Bliss, J. C., & Macurdy, W. B. Linear models for contrast phenomena. Journal of the Optical Society of America, 1961,51,1373-1379.
Bloom, H. S., Criswell, E. L., Pennypacker, H. S., Catania, A. C., & Adams, C. K. Major stimulus dimensions determining detection of simulated breast lesions. Perception and Psychophysics, 1982, 32,251-260.
Blumenfeld, W. The relationship between the optical and haptic con- struction of space. Acta Psychologica (Hague), 1936,2, 125-174.
Boring, E. G. Sensation and perception in the history of erperimental psychology. New York: Appleton-Century-Crofts, 1942.
Bosma, J. F. (Ed.). Symposium on om1 sensationandperception. Spring- field, Ill.: Charles C. Thomas, 1967.
Bosma, J. F. (Ed.). Second symposium on oral sensation andperception. Springfield, Ill.: Charles C. Thomas, 1970.
Bracewell, R. N. The Fourier transform and its applications. New York: McGraw-Hill, 1978.
Breitmeyer, B. G., & Ganz, L. Implications of sustained and transient channels for theories of visual pattern masking, saccadic suppres- sion, and information processing. Psychological Review, 1976,83, 1-36.
Brown, E. L., & Deffenbacher, K. Perception and the senses. Oxford: Oxford University Press, 1979.
Burke, M. W., Gilson, R. D., & Jagacinski, R. J. Multi-modal informa- tion processing for visual workload relief. Ergonomics, 1980,23, 961-975.
Biirklen, K. [Touch reading of the blind] (F. K. Merry, trans.). New York: American Foundation for the Blind, 1932.
Campbell, F. W., & Green, D. G. Optical and retinal factors affect- ing visual resolution. Journal ofPhysiology (London), 1965,181, 576-593.
Capraro, A. J., Verrillo, R. T., & Zwislocki, J. J. Psychophysical evidence for a triplex system of cutaneous mechanoreception. Sensory Pro- cesses, 1979,3, 334452.
Carpenter, P. A., & Eisenberg, P. Mental rotation and the frame of reference in blind and sighted individuals. Perception and Psycho- physics, 1978,23, 117-124.
Cheng, M. Tactile-kinesthetic perception of length. American Journal of Psychology, 1968,81,74-82.
Cholewiak, R. W., & Sherrick, C. E. A computer-controlled matrix system for presentation to the skin of complex spatiotemporal patterns. Behavior Research Methods and Instrumentation, 1981,13,667- 673.
Collins, C. C. Tactile television-Mechanical and electrical image pro- jection. ZEEE Tmnsactions on Man-Machine Systems, 1970, 11, 65-71.
Collins, C. C., & Madey, J. M. J. Tactile sensory replacement. Proceedings of the San Diego Biomedical Symposium, 1974,13,15-26.
Cooper, L. A., & Shepard, R. N. Me& images and their transformations. Cambridge, Mass.: M.I.T. Press, 1982.
Corcoran, D. W. The phenomena of the disembodied eye or is it a matter of personal geography? Perception, 1977,6,247-253.
Corker, K., Mishkin, A., & Lyman, J. Achievement ofa sense of operator presence in remote manipulation. (Technical Report No. 60). UCLA School of Engineering and Applied Science. Biotechnology Labo- ratory, 1980.
Cornsweet, T. N. Visualperception. New York: Academic, 1970. Craig, J. C. Pictorial and abstract cutaneous displays. In F. A. Geldard
(Ed.), Conference on vibrotactile communication. Austin, Tex.: The Psychonomic Society, 1974.
Craig, J. C. Vibrotactile letter recognition: The effects of a masking stimulus. Perception and Psychophysics, 1976,20,317-326.
Craig, J. C. Vibrotactile pattern perception: Extraordinary observers. Science, 1977,196,450-452.
Craig, J. C. Vibrotactile pattern recognition and masking. In G. Gordon (Ed.), Active touch: The mechanism of recognition of objects by manipulation. Oxford: Pergamon, 1978.
Craig, J. C. A confusion matrix for tactually presented letters. Perception and Psychophysics, 1979,26,409-411.
Craig, J. C. Modes of vibrotactile pattern generation. Journal of Ex- perimental Psychology: Human Perception and Performance, 1980, 6,151-166.
Craig, J. C. Tactile letter recognition: Pattern duration and modes of pattern generation. Perception and Psychophysics, 1981,30,540- 546.
Craig, J. C. Temporal integration of vibrotactile patterns. Perception and Psychophysics, 1982,32,219-229. (a)
Craig, J. C. Vibrotactile masking: A comparison of energy and pattern maskers. Perception and Psychophysics, 1982,31,523-529. (b)
Craig,'J. C., & Sherrick, C. E. Dynamic tactile displays. In W. Schiff & E. Foulke (Eds.), Tactual perception: A sourcebook. Cambridge, England: Cambridge University Press, 1982.
Cronin, V. Active and passive touch a t four age levels. Developmental Psychology, 1977,13,253-256.
Cussler, E. L., Zlotnick, S. J., & Shaw, M. C. Texture perceived with the fingers. Perception and Psychophysics, 1977,21,504-512.
Daley, M. L., & Singer, M. A spatial resolution measure of cutaneous vision. ZEEE Tmnsactions on Systems, Man, and Cybernetics, 1975, 5,124-125.
Darian-Smith, I., Davidson, I., & Johnson, K. 0. Peripheral neural representation of spatial dimensions of a textured surface moving across the monkey's finger pad. Journal of Physiology (London), 1980,309, 135-146.
Darian-Smith, I., & Kenins, P. Innervation density of mechanoreceptive fibres supplying glabrous skin of the monkey's index finger. Journal of Physiology (London), 1980,309, 147-155.
Darian-Smith, I., & Oke, L. E. Peripheral neural representation of the spatial frequency of a grating moving across the monkey's finger pad. Journal ofPhysiology (London), 1980,309,117-133.
Davidon, R. S., & Cheng, M. H. Apparent distance in a horizontal plane with tactile-kinesthetic stimuli. Quarterly Journal of Experimental Psychology, 1964,16,277-281.
Davidson, P. W. Haptic judgments of curvature by blind and sighted humans. Journal ofExperimenta1 Psychology, 1972,93,43-55. (a)
Davidson, P. W. The role of exploratory activity in haptic perception: Some issues, data, and hypotheses. American Foundation for the Blind Research Bulletin, 1972,24,21-27. (b)
Day, R. H., & Dickinson, R. G. Learning to identifj braille numerals with active and passive touch (Research Note). Australia: Monash University, Victoria, 1979.
Day, R. H., & Wong, T. S. Radial and tangential movement directions as determinants of the haptic illusion in an L figure. Journal of Experimental Psychology, 1971,87,19-22.
de Lange, H. Research into the dynamic nature of human fovea-cortex systems with intermittent and modulated light. Journal of the

PERCEPTUAL ORGANIZATION AND COGNITION
Optical Society of America, 1958,48,777-789. Dennett, D. C. Where am I? In D. C. Dennett (Ed.), Brainstorms.
Montgomery, Vt.: Bradford Books, 1978. Deregowski, J., & Ellis, H. D. Effect of stimulus orientation upon haptic
perception of the horizontal-vertical illusion. Journal of Experi- mental Psychology, 1972,95,14-19.
Duke, J. D. Perception of finger drawings upon the body eurface. Journal of General Psychology, 1966,75,305-314.
Ekman, G., Hosman, J., & Lindstrom, B. Roughness, smoothness, and preference: A study of quantitative relations in individual subjects. Journal of Experimental Psychology, 1965,70,18-26.
Eriksen, C. W. Temporal luminance summation effects in backward and forward masking. Perception and Psychophysics, 1966,1,87- 92.
Eriksen, C. W., & Collins, J. F. Some temporal characteristics of visual pattern perception. Journal ofExperimenta1 Psychology, 1967,74, 476-484.
Eriksen, C. W., & Collins, J. F. Sensory traces versus the psychological moment in the temporal organization of form. Journal of Experi- mental Psychology, 1968,77,376382.
Fenton, R. E. An improved man-machine interface for the driver-vehicle system. ZEEE Transactions on Human Facbrs in Electronics, 1966, 7,150-157.
Foulke, E. The development of an expanded reading code for the blind: Part II [Final progress report, Grant No. OEG-0-8-071185-1811 (032), U.S. Department of Health, Education, and Welfare.] Wash- ington, D.C.: U.S. Government Printing Office, 1973.
Foulke, E. Reading braille. In W. Schiff & E. Foulke (Eds.), Tactual perception: A sourcebook. Cambridge, England: Cambridge Uni- versity Press, 1982.
Freeman, A. W., & Johnson, K. 0. Cutaneous mechanoreceptora in macaque monkey: Temporal discharge pattern evoked by vibration, and a receptor model. Journal of Physiology (London), 1982,323, 21-41. (a)
Freeman, A. W., & Johnson, K. 0. A model accounting for effects of vibratory amplitude on responses of cutaneous mechanoreceptors in macaque monkey. Journal of Physiology (London), 1982,323, 43-64. (b)
Frost, B. J., & Richardson, B. L. Tactile localization of sounds: Acuity, tracking moving sources, and selective attention. Journal of the Acoustical Society ofAmerica, 1976,59,907-914.
Geldard, F. A. Adventures in tactile literacy. American Psychologist, 1957,12,115-124.
Geldard, F. A. Some neglected possibilities of communication. Science, 1960,131,1583-1588.
Geldard, F. A. Vision, audition, and beyond. In W. D. Neff (Ed.), Con- tributions b sensory physiology (Vol. 4). New York: Academic, 1970.
Geldard, F. A. Preface. In F. A. Geldard (Ed.), Cutaneous communication systems and devices. Austin, Tex.: The Psychonomic Society, 1974.
Geldard. F. A,. & Shemck. C. E. Mul t i~ le cutaneous stimulation: The dischmination of vibratory patterns. Journal of the Acoustical So- ciety of America, 1965,37,797-801.
Gescheider, G. A. Cutaneous sound localization. Journal ofErperimentul Psychology, 1965, 70,617-625.
Gescheider, G. A., & Vemllo, R. T. Vibrotadile frequency characteristics as determined by adaptation and masking procedures. In D. R. Kenshalo (Ed.), Sensory functions of the skin of humans. New York: Plenum, 1979.
Gibson, J. J. Observations on active touch. Psychological Review, 1962, 69,477-490.
Gibson, J. J. The senses considered asperceptual systems. Boston, Mass.: Houghton-Mifflin, 1966.
Gill, J. M., & James, G. A. A study on the discriminability of tactual point symbols. American Foundation for the Blind Research Bulletin, 1973,26,19-34.
Gilson, R. D. Some factors affecting the spatial discrimination of vi- brotactile patterns. Perception and Psychophysics, 1968,3, 131- 136.
Ginsburg, A. P. Visual information processing based on spatial filters
constmined by bwlogicarldata (AMRLTR78,129). Wright-Patterson Air Force B e , Ohio: Aerospace Medical k a r c h Laboratory, 1978.
Goodman, J. W. Introduction to Fourier optics. New York: McGraw- Hill, 1968.
Gordon, G. Introduction. In G. Gordon (Ed.), Active buch: The mechanism of recognition of objects by manipulation. Oxford: Pergamon, 1978.
Gordon, I. E., & Cooper, C. Improving one's touch. Nature, 1975,256, 203-204.
Gordon, I. E., & Morison, V. The haptic perception of curvature.Perception and Psychophysics, 1982,31,446-450.
Gottheil, E. F., Cholewiak, R. W., & Shemck, C. E. The discrimination of vibratory pat tern on a tactile matrix. Bulletin of the Psychonornic Society, 1978,11,21-24.
Graham, N. Spatial-frequency channels in human vision: Detecting edges without edge detectors. In C. Harris (Ed.), Visual coding and adaptability. Hilladale, N.J.: Erlbaum, 1980.
Green, B. G. Tactile roughness and the "paper effect." Bulletin of the Psychonomic Society, 1981,18,155-158.
Green, B. G., Lederman, S. L., & Stevens, J. C. The effect of skin tem- perature on the perception of roughness. Sensory Pnxesses, 1979, 3 ,327433.
Green, D. M., & Swets, J. A. Signal detection theory andpsychophysics. New York: Wiley, 1966.
Grunwald, A. P. A Braille-reading machine. Science, 1965, 154, 144-146.
Guarniero, G. Experience of tactile vision. Perception, 1974, 3 , 101-104.
Harmon, L. D. Touch-sensing technology: A review (Technical Report No. MSR80-03). Dearborn, Mich.: Society of Manufacturing Engineers, 1980.
Harmon, L. D. Tactile sensing for robots. In G. Beni & S. Hackwood (Eds.), Recent advances in robotics. New York: Wiley, 1985.
Heller, M. A. Body locus and form perception. Perceptual and Motor Skills, 1977,45,267-270.
Heller, M. A. Reproduction of tactually perceived forms. Perceptual and Motor Skills, 1980,50, 943-946.
Heller, M. A., & Myers, D. S. Active and passive tactual recognition of form. Journal of Geneml Psychology, 1983,108,225-229.
Hill, J. W. Describing function analysis of tracking performance using two tactile displays. IEEE Tmnsactions on Man-MachineSystems, 1970,11,92-101.
Hill, J. W. Limited field of view in reading letterahapes with the fingera. In F. A. Geldard (Ed.), Cutaneous communication systems and devices. Austin, Tex.: The Psychonomic Society, 1974.
Hill, J. W., & Bliss, J. C. Modeling a tactile sensory register. Perception and Psychophysics, 1968,4,91-101.
Hill, J . W., & Sword, A. J. Touch sensors and control. In Pnxeedings of the First National Conference on Remotely Manned Systems, California Institute of Technology, 1973.
Hillis, W. D. A high-resolution imaging touch sensor. International Journal of Robotics, 1982,1,33-44.
Holmes, D. S., Roeckelein, J. E., & Olmstead, J. A. Determinants of tactual perception of finger drawn symbols: Reappraisal. Perceptual and Motor Skills, 1968,27,659-672.
Howard, I. P., & Templeton, W. B. Human spatial orientation. New York: Wiley, 1966.
Hunter, I. M. L. Tactile-kinaesthetic perception of straightness in blind and sighted humans. Qwrterly Journal ofErperimental Psychology, 1954,6, 149-154.
Ivancevic, N. S. Stereometric pattern recognition by artificial touch. Pattern Recognition, 1974,6,77-83.
Jagacinski, R. J., Flach, J. M., & Gilson, R. D. A comparison of visual and kinesthetic-tactual displays for compensatory tracking. IEEE Transactions on Systems, Man and Cybernetics, 1983,13, 1103- 1112.
Jansson, G. Tactile guidance of movement. International Journal of Neuroscience, 1983,19,37-46.
Johansson, R. S. Skin mechanoreceptors in the human hand: Receptive

TACTUAL PERCEPTION
field characteristics. In Y. Zotterman (Ed.), Sensory functions of the skin in primutes. Oxford: Pergamon, 1976.
Johansson, R. S., & Vallbo, A. B. Tactile sensibility in the human hand: Relative and absolute densities of four types of mechanoreceptive units in glabrous skin. Journal ofPhysiology (London), 1979,286, 283400.
Johnson, K. 0. Sensory discrimination: Decision process. Journal of Neurophyswlogy, 1980,43,1771-1792. (a)
Johnson, K. 0. Sensory discrimination: Neural processes preceding dis- crimination decision. Journal ofNeurophysiology, 1980,43,1793- 1815. (b)
Johneon, K. 0. Neural mechanisms of tactual form and texture dis- crimination. Fedemtion Proceedings, 1983,42,2542-2547.
Johnson, K. O., & Davidson, I. A somesthetic coding mechanism for texture like color coding in vision. Society for Neurosciences Abstmcts, 1981, 7,273.
Johnson, K. O., & Lamb, G. D. Neural mechanisms of spatial tactile disnimination: Neural patterns evoked by braille-like dot patterns in t h e monkey. J o u r n a l ofPhysiology (London), 1981, 310, 117-144.
Johnson, K. O., & Phillips, J. R. Tactile spatial resolution: I. Two-point discrimination, gap detection, grating resolution, and letter rec- ognition. Journal ofNeurophysiology, 1981,46,1177-1191.
Katz, D. Der Autbau der Tastwelt. ZeitschrifL fir Psychologie, 1925, Erganzungeband 11.
Katz, D. The vibratory sense and other lectures. University of Maine Studies, Second Series, No. 14. The Maine Bulletin, May 1930,32, 1-163.
Katz, D. A sense of touch: The technique of percussion, palpation, and massage. British Jownal ofPhysical Medicine, 1936,11, (old series), 146-148.
Keller, H. The world I live in. New York: J. F. Tapley, 1908. Kelly, D. H. Spatial frequency, bandwidth, and resolution. Applied
Optics, 1965,4,435-437. Kelly, D. H. Motion and vision. II. Stabilized spatio-temporal threshold
surface. Journal of the Optical Society ofAmerica, 1979,69,1340- 1349.
Kelso, J. A. S. Motor control mechanism underlying human movement reproduction. Journal of Experimental Psychology: Humun Per- ception and Performunce, 1977,3,529-543.
Kelso, J. A. S. Joint receptors do not provide a satisfactory basis for motor timing and positioning. Psychological Review, 1978,85,474- 481.
Kelso, J. A. S., & Stelmach, G. E. Central and peripheral mechanisms in motor control. In G. E. Stelmach (Ed.), Motor control: Issues and trends. New York: Academic, 1976.
Kennedy, J. M. Haptics. In E. C. Carterette & M. Friedman (Eds.), Handbook ofperception (Vol. 8). New York: Academic, 1978.
Kikuchi, T., Yamashita, Y., Sagawa, K., & Wake, T. An analysis of tactile letter confusions. Perception and Psychophysics, 1979,26, 295401.
Kinoshita, G., Aida, S., & Mori, M. A pattern classification by dynamic tactile sense information processing. Pattern Recognition, 1975,7, 243 -25 1.
Kirman, J. H. Tactile communication of speech: A review and an analysis. Psychological Bulletin, 1973,80,54-74.
Kirman, J. H. Tactile apparent movement: The effect of interstimulus onset interval and stimulus duration. Perception and Psychophysics, 1974a, 15,1-6.
Kirman, J. H. Tactile perception of computerderived formant patterns from voiced speech. Journal of the Acoustical Society of America, 1974b,55,163-169.
Kirman, J. H. Current developments in tactile communication of speech. In W. Schiff & E. Foulke (Eds.), Tactual perception: A sourcebook. Cambridge, England: Cambridge Univereity Press, 1982.
Klatzky, R. L., Lederman, S. J., & Metzger, V. A. Identifying objects by touch: An "expert ayatem." Perception and Psychophysics, 1985, 37,299402.
Koenderink, J. J., & van Doom, A. J. Spatiotemporal contrast detection
threshold is bimodal. Optics Letters, 1979,4,3234. Krech, D., & Crutchfield, R. S. Elements ofpsychology. New York: Knopf,
1958. Kreifeldt, J. G., & Chuang, M. Moment of inertia: Psychophysical study
of an overlooked sensation. Science, 1979,206,588-590. Krueger, L. E. David Katz's Der Autbau der Taatwelt: A synopsis.
Perception and Psychophysics, 1970, 7,337341. Krueger, L. E. Tactual perception in hietorical perspective: David Katz's
world of touch. In W. Schiff & E. Foulke (Eds.), Tactual perception: A sourcebook. Cambridge, England: Cambridge University Press, 1982.
Lamb, G. D. Tactile discrimination of textured surfaces: Peripheral neural coding in the monkey. Journal ofPhyswlogy (London), 1983, 338,567 -587. (a)
Lamb, G. D. Tactile disrrimination of textured surEaces: Psychophysical performance measurements in humans. Journal of Physiology (London), 1983,338,551-565. (b)
Laszlo, J. I., & Bairstow, P. J. Kinaesthesis: Its measurement, training and relationship to motor control. Quarterly Journal ofExperimental Psychology, 1983,35A, 411-421.
Lechelt, E. C., Eliuk, J., & Tanne, G. Perceptual orientational asym- metries: A comparison of visual and haptic space. Perception and Psychophysics, 1976,20,463-469.
Lechelt. E. C., & Verenka, A. Spatial anisotropy in intramodal and cross-modal judgments of stimulus orientation: The stability of the oblique effect. Perception, 1980,9,581-589.
Lederman, S. J. Tactile roughness of grooved surfaces: The touching process and effecta of macro- and microsurface shc ture . Perception and Psychophysics, 1974,16,385395.
Lederman, S. J. Heightening tactile impressions of surface texture. In G. Gordon (Ed.), Active touch: The mechanism of recognition of objects by munipuhtion. Oxford: Pergamon Press, 1978. (a)
M e r m a n , S. J. "Improving one's touch" . . . and more. Perception and Psychophysics, 1978,24.164-160. (b)
Lederman, S. J. The perception of surface roughness by active and passive touch. Bulletin of the Psychommic Society, 1981,18,253- 255.
Lederman, S. J. The perception of texture by touch. In W. Schiff & E. Foulke (Eds.), Tactual perception: A sourcebook. Cambridge, En- gland: Cambridge University Press, 1982.
Lederman, S. J. Tactual roughness perception: Spatial and temporal determinants. Canadian Journal of Psychology, 1983,37, 498- 511.
M e r m a n , S. J., Klatzky, R. L., &Barber, P. 0. Spatial and movement- based heuristics for encoding pattern information through touch. Journal ofExperimenta1 Psychology: Geneml, 1985,114,33-49.
Lederman, S. J., Loomis, J . M., & Williams, D. The role of vibration in the tactual perception of roughness. Perception andPsychophysics, 1982,32,109-116.
Lederman, S. J., & Taylor, M. M. Fingertip force, surface geometry, and the perception of roughness by active touch. Perception and Psychophysics, 1972,12,401-408.
Legge, G. E., & Foley, J. M. Contrast masking in human vision. Journal of the Optical Society ofAmerica, 1980, 70,1458-1471.
Linvill, J. G., & Bliss, J. C. A direct translation reading aid for the blind. Proceedings of the ZEEE, 1966,54,40-51.
Loomis, J. M. Tactile letter recognition under different modes of stimulus Perception and ~ s y c h o ~ h ~ s i c s , 1974,16,401-408.
Loomis. J. M. An investigation of tactile hyperacuity. Sensory Processes, - - 1979,3,289402. -
Loomis, J. M. Interaction of display mode and character size in vibro- tactile letter recognition. Bulletin of the Psychommic Society, 1980, 16,385387.
Loomis, J. M. On the tangibility of letters and braille. Perception and Psychophysics, 1981,29,37-46. (a)
Loomis, J. M. Tactile pattern perception. Perception, 1981, 10, 5-27. (b)
Loomis, J. M. Analysis of tactile and visual conhion matrices. Perception and Psychophysics, 1982,31,41-52. .

PERCEPTUAL ORGANIZATION AND COGNITION
Magee, L. E., & Kennedy, J. M. Exploring pictures tactually. Nature (London), 1980,283,287-288.
Marchetti, F. M., & Lederman, S. J. The haptic radial-tangential effect: Two testa of Wong's "momenta of inertia" hypothesis. Bulletin of the Psychonomic Society, 1983,21,43-46.
Marmor, G. S., & Zaback, L. A. Mental rotation by the blind: Does mental rotation depend on visual imagery? Journal ofExperimentul Psychology: Human Perception and Performance, 1976, 2, 515- 521.
Marr, D. Vision. San Francisco: Freeman, 1982. Massaro, D. W. Experimental psychology and information processing.
Chicago: Rand McNally, 1975. McCloskey, D. I. Kinesthetic sensibility. Physiological Reviews, 1978,
58,763-820. Merry, R. V. Fingers for eyes: The story of raised print. Scientific Monthly,
1937,44,273-279. Merzenich, M. M., & Harrington, T. The sense of flutter-vibration evoked
by stimulation of the hairy skin of primates: Comparison of human sensory capacity with the responses of mechanoreceptive afferents innervating the hairy skin of monkeys. Experimental Bmin Re- search, 1969,9,236-260.
Meyers, E., Ethington, D., & Ashcroft, S. Readability of braille as a function of three spacing variables. Journal ofAppliedPsychology, 1958,42,163-165.
Millar, S. Crossmodal and intersensory perception and the blind. In R. D. Walk & H. L. Pick, Jr. (Eds.), Intersensoryperception and sensory integration. New York: Plenum, 1981.
Minsky, M. Telepresence. Omni, 1980,2,44-52. Mishkin, A. H., Corker, K., & Lyman, J. Medical manipulators: A review
(Technical Report No. 63). UCLA School of Engineering and Applied Science: Biotechnology Laboratory, 1981.
Moore, T. J. A survey of the mechanical characteristics of skin and tissue in response to vibratory stimulation. IEEE Tmnsactions on Man-Machine Systems, 1970,11,79-84.
Morely, J. W., Goodwin, A. W., & Darian-Smith, I. Tactile diminination of gratings. Experimental Brain Research, 1983,49,291-299.
Moser, H. M., & Houck, R. E. A study of the lingual orientation of normal and articulatory defective speakers on a test of lingual identification of selected arrangements of haptic forms. In J. F. Bosma (Ed.), Second symposium on oral sensation and perception. Springfield, Ill.: Charles C. Thomas, 1970.
Natsoulas, T., & Dubanoski, R. A. Infemng the locus and orientation of the perceiver from responses to stimulation of the skin. American Journal ofPsychology, 1964,77,281-285.
Nolan, C. Y., & Kederis, C. J. Perceptual factors in bmille word rec- ognition. New York: American Foundation for the Blind, 1969.
Nolan, C. Y., & Moms, J . E. Improvement of tactual symbols for blind children. Louisville, Ky.: American Printing House for the Blind, 1971.
Norton, S. J., Schultz, M. C., Reed, C. M., Braida, L. D., Durlach, N. I., Rabinowitz, W. M., & Chomsky, C. Analytic study of the Tadoma method: Background and preliminary results. Journal of Speech and Hearing Research, 1977,20,514-595.
Okada, T., & Tsuchiya, S. Object recognition by grasping. Pattern Rec- ognition, 1977,9, 111-119.
Oldfield, S. R., & Phillips, J. R. The spatial characteristics of tactile form perception. Perception, 1983,12,615-626.
Penfield, W., & Rasmussen, T. The cerebml cortex of man. New York: Macmillan, 1950.
Phillips, J. R., & Johnson, K. 0 . Tactile spatial resolution. 11. Neural representation of bars, edges, and gratings in monkey primary afferents. Journal ofNeurophysiology, 1981,46,1192-1203. (a)
Phillips, J. R., & Johnson, K. 0. Tactile spatial resolution. 111. A con- tinuum mechanics model of skin predicting mechanoreceptor re- sponses to bars, edges, and gratings. Journal of Neurophysiology, 1981,46,1204-1225. (b)
Phillips, J . R., Johnson, K. O., & Browne, H. M. A comparison of visual and two modes of tactual letter recognition. Perception and Psy- chophysics, 1983,34,243-249.
Polanyi, M. L. Personal knowledge. London: Routledge & Kegan Paul, 1962.
Reed, C. M., Doherty, M. J., Braida, L. D., & Durlach, N. I. Analytic study of the Tadoma method: Further experimenta with inexpe- rienced observers. Journal of Speech and Hearing Research, 1982, 25,216-223.
Reed, C. M., Durlach, N. I., & Braida, L. D. Research on tactile com- munication of speech: A review. ASHA Monogmphs, 1982 (No. 20).
Reed, C. M., Durlach, N. I., Braida, L. D., & Schultz, M. C. Analytic study of the Tadoma method: Identification of consonants and vowels by an experienced Tadoma user. Journal of Speech and Hearing Research, 1982,25, 108-116.
Reed, C. M., Rubin, S. I., Braida, L. D., & Durlach, N. I. Analytic study of the Tadoma method: Discrimination ability of untrained ob- servers. Journal of Speech and Hearing Research, 1978,21,625- 637.
Reid, R. L. An illusion of movement complementary to the horizontal- vertical illusion. Quarterly Journal of Psychology, 1954, 6, 107- 111.
WvBsz, G. Psychology and art of the blind. London: Longmans, Green and Co., 1950.
Richards, W. Quantifying sensory channels: Generalizing colorimetry to orientation and texture, touch, and tones. Sensory Processes, 1979,3,207-229.
Richardson, B. L., & Frost, B. J. Sensory substitution and the design of an artificial ear. Journal of Psychology, 1977,96,258-285.
Richardson, B. L., & Frost, B. J. Tactile localization of the direction and distance of sounds. Perception and Psychophysics, 1979, 25, 336-344.
Richardson, B. L., Wuillemin, D. B., & Saunders, F. J. Tactile discrim- ination of competing sounds. Perception and Psychophysics, 1978, 24,546650.
Roelofs, C. 0. Considerations on the visual egocentre. A c h Psychologim (Hague), 1959,16,226-234.
Rovarno, J., & Virsu, V. An estimation and application of the human cortical magnification factor. Experimental Brain Research, 1979, 37,495410.
Royer, M. S., Rzeszotarski, M. S., & Gilmore, G. C. Application of two- dimensional Fourier transforms to problems of visual perception. Behavioml Research Methods and Instrumentation, 1983,15,319- 326.
Rubin, E. Haptische untersuchungen. ActaPsychologica, 1936,1,285- 300.
Rzeszotarski, M. S., Royer, F. L., & Gilmore, G. C. Introduction to two- dimensional Fourier analysis. Behavioral Research Methods and Instrumentation, 1983,15,308-318.
Sagawa, K., Yamashita, Y., Kikuchi, T., Yamashita, Y., & Wake, T. A study of dot plotter for tactile pattern perception-Readability for Chinese and hiragana characters. Proceedings of the Third Sensory Substitution Symposium, Tokyo, Japan, 1977.
Saida, S., Shimizu, Y., &Wake, T. Computer-controlled TVSS and some characteristics of vibrotactile letter recognition. Perceptual and Motor Skills, 1982,55, 651-653.
Scadden, L. A. Perception of patterned vibratory stimulation: An eval- uation of the Tactile Vision Substitution System. Doctoral disser- tation, University of the Pacific, Stockton, Cal., 1971.
Scadden, L. A. Tactile pattern perception and body loci. Perception, 1973,2,333-336.
Schade, 0. H. Optical and photoelectric analog of the eye. Journal of the Optical Society ofAmerica, 1956,46,721-739.
Schindler; U., & ~ n a i ~ ; A. Ursachen der gegenseitegen Verdeckung von taktil dareebotenen Buchstaben: Unterbrechung. Summation oder verziigerkg? Psychological Research, 1976,38,303-318.
Schmid, H. P., & Bekey, G. A. Tactile information processing by human operators in control systems. IEEE Tmnsactions on Systems, Man, and Cybernetics, 1978,8,860-866.
Schwartz, A. S., Perey, A. L., & Azulay, A. Further analysis of active and passive touch in pattern discrimination. Bulletin of the Psy- chonomic Society, 1975,6, 7-9.

TACTUAL PERCEPTION
Sekuler, R. Spatial vision. Annual Review of Psychology, 1974, 25, 195-232.
Shepard, R. N., & Metzler, J. Mental rotation of three-dimensional objects. Science, 1971,171, 701-703.
Shimizu, Y . Tactile letter display for a reading aid. Proceedings of The Eighth Congress of the InternationalErgonomics Association, Tokyo, Japan, 1982.
Shimizu, Y . , Saida, S., Wake, T. Nakamura, A., & Ohm, H. Optimum design of tactile display for a reading aid. In J. Raviv (Ed.), Uses of computers in aiding the disabled. Amsterdam: North-Holland, 1982.
Shimizu, Y., & Wake, T. Tactile sensitivity to two types of stimulation: Continuous and discrete shifting of a point stimulus. Perceptual and Motor Skills, 1982,54,1111-1118.
Shimizu, Y., & Wake, T. Tactile letter recognition due to a drawing method for sensory substitution. Journal of JapaneseErgorwmics, 1983,19,91-97.
Simon, H. A. The architecture of complexity. Proceedings of the American Philosophical Society, 1962,106,467-482.
Stevens, S. S., & Guirao, M. Scaling of apparent viscosity. Science, 1964,144,1157-1158.
Stevens, S. S., Harris, J. R. The scaling of subjective roughness and smoothness. Journal of Experimental Psychology, 1962,64,489- 494.
Sur, M., Menenich, M. M., & Kaas, J. H. Magnification, receptive-field area, and "hypercolumn" size in areas 3b and 1 of somatosensory cortex in owl monkeys. JournalofNeurophysiology, 1980,44,295- 311.
Talbot, W. H., Darian-Smith, I., Kornhuber, H . H., & Mountcastle, V . B. The sense of flutter-vibration: Comparison of the human ca- pacity with response patterns of mechanoreceptive deren ts from the monkey hand. Journal ofNeurophysiology, 1968,31,301334.
Taylor, M. M., & Lederman, S. J. Tactile roughness of grooved surfaces: A model and the e f f ed of friction. Perception and Psychophysics, 1975,17,2336.
Triggs, T. J., Levison, W. H., & Sanneman, R. Some experience with flight-related electrocutaneous and vibrotactile displays. In F. A. Geldard (Ed.), Cutaneous communication systems and devices. Austin, Tex.: The Psychonomic Society, 1974.
Turvey, M. T. On peripheral and central processes in vision: Inferences from an information processing analysis of masking with patterned stimuli. Psychological Review, 1973,80, 1-52.
Ullman, S. Against direct perception. Behavioml and Bmin Sciences, 1980,3,373381.
Uniform Type Committee of the American Association of Workers for the Blind. Fourth Biennial Report. Outlook for the Blind, 1913, 7, 1-48.
Uniform Type Committee of the American Association of Workers for the Blind. Fifth Biennial Report. Outlook for the Blind, 1915, 9, 1-92.
Vallbo, A. B., & Johansson, R. S. Skin mechanoreceptors in the human hand: Neural and psychophysical thresholds. In Y . Zotterrnan (Ed.), Sensory functions of the skin inprimates. Oxford: Pergamon, 1976.
Vallbo, A. B., & Johansson, R. S. The tactile sensory innervation of the glabrous skin of the human hand. In G. Gordon (Ed.), Active touch--The mechanism of recognition of objects by manipulation. Oxford: Pergamon, 1978.
Verrillo, R. T. A duplex mechanism of mechanoreception. In D. R. Ken- shalo (Ed.), The skin senses. Springfield, Ill.: Charles C. Thomas, 1968.
Veml lo , R. T., & Gescheider, G. A. Psychophysical measurements of enhancement, suppression, and surface gradient effects in vibro- taction. In D. R. Kenshalo (Ed.), Sensory functions of the skin of
humans. New York: Plenum, 1979. Virsu, V., & Rovamo, J. Visual resolution, contrast sensitivity, and the
cortical magnification factor. Experimental Brain Research, 1979, 37,475-494.
von Bbkbsy, G. Human skin perception of traveling waves similar to those on the cochlea. Journal of the Acoustical Society of America, 1955,27,830-841.
von Bbkbsy, G. Similarities between hearing and skin sensations. Psy - chological Review, 1959,66, 1-22.
von Bbkbsy, G. Sensory inhibition. Princeton, N. J.: Princeton University Press, 1967.
von Holst, E. Relations between the central nervous system and the peripheral organs. British Journal of Animal Behavior, 1954,2, 89-94.
Watson, A. B. Detection and recognition ofsimple spatial forms (NASA Technical Memorandum 84353). Ames Research Center, Moffett Field, Cal.: National Aeronautics and Space Administration, 1983.
Watson, A. B., & Ahumada, A. J., Jr. A look at motion in the frequency domain (NASA Technical Memorandum 84352). Ames Research Center, Moffett Field, Cal.: National Aeronautics and Space Administration, 1983.
Weber, E. H. De tactu (H. E. Ross, trans.). New York: Academic, 1978. (Originally published, 1834.)
Weber, E. H. Der Tastsinn (D. J. Murray, trans.). New York: Academic, 1978. (Originally published, 1846.)
Weinberg, B., Lyons, M. J., & Liss, G. M. Studies of oral, manual, and visual form identification in children and adults. In J. F. Bosma (Ed.), Second symposium on om1 sensation andperception. Spring- field, Ill.: Charles C. Thomas, 1970.
Weinstein, S. Intensive and extensive aspects of tactile sensitivity as a function of body part, sex, and laterality. In D. R. Kenshalo (Ed.), The skin senses. Springfield, Ill.: Charles C. Thomas, 1968.
Weisenberger, J. M., & Craig, J. C. A tactile metacontrast effect. Per- ception and Psychophysics, 1982,31,530336.
Weisstein, N. Metacontrast. In D. Jameson and L. M. Hurvich (Eds.), Handbook of sensory physiology (Vol. 7). New York: Springer-Verlag, 1972.
Westheimer, G. Spatial frequency and light-spread descriptions of visual acuity and hyperacuity. Journal of the Optical Society of America, 1977,67,207-212.
White, B. W. Perceptual findings with the Vision-Substitution System. IEEE Tmnsactions on Man-Machine Systems, 1970,11,54-58.
White, B. W., Saunders, F. A., Scadden, L., Bach-y-Rita, P., & Collins, C. C. Seeing with the skin. Perception andPsychophysics, 1970,7, 23-27.
Wilson, H. R., & Bergen, J . R. A four-mechanism model for threshold spatial vision. Vision Research, 1979,19, 1932.
Wong, T. S. Dynamic properties of radial and tangential movements as determinants of the haptic horizontal-vertical illusion with an L figure. Journal of Experimental Psychology: Human Perception and Performance, 1977,3, 151-164.
Zickel, V . E., & Hooper, M. S. The program of braille research: A progress report. International Journal for theEducation of the Blind, 1957, 6, 79-86.
Zigler, M. J. A review of David Katz's Der A d a u der Tastwelt. Psy- chological Bulletin, 1926,23,326336.
Zigler, M. J., & Barrett, R. A further contribution to the tactual per- ception of form. Journal of Experimental Psychology, 1927, 10, 184-192.
Zinchenko, V. P., & Lomov, B. F. The fimctions of hand and eye movements in the process of perception. Problems of Psychology, 1960,1, 12- 26.