tactical allocation to gold - lbma allocation to gold lbma conference, hong kong prepared by:...
TRANSCRIPT

LBMA/LPPM Precious Metals Conference 2012 12 November 2012
1 Session 2 - Morris
For Professional Clients only)
Tactical allocation to gold LBMA conference, Hong Kong
Date: November 2012 Prepared by: Charlie Morris
22
99
7-A
MG
52
99
2d
High quality assets have performed well
Asset quality has been the single greatest factor that
can explain asset price changes since 2000
Equities Consumer brands, low volatility equities
Bonds “Good” government bonds
FX Swiss Franc, Yen, Singapore Dollar
Commodities Gold
Property Prime real estate

LBMA/LPPM Precious Metals Conference 2012 12 November 2012
2 Session 2 - Morris
22
99
7-A
MG
52
99
2d
Measuring asset quality in equities
Equities with low volatility have been rewarded
since 2000
Balance sheet strength, stable cash flows, sustainability of profits, robust
franchises have been highly sought after
These fundamental factors have been reflected in price volatility
We can conclude that high quality equities have low volatility
This is not only true for the stock market, but for all asset classes
22
99
7-A
MG
52
99
2d
Quality in equities
S&P low volatility equities versus high beta equities
1990 to 2000
0
200
400
600
800
1000
1,200
1990 1991 1992 1993 1994 1995 1996 1997 1998 1999
Low Volatility TR High Beta TR S&P 500 TR
1990 to 2000
Source HSBC, Bloomberg. Date range from 31 December 1999 to 30 November 1990.
LBMA/LPPM Precious Metals Conference 2012 12 November 2012
3 Session 2 - Morris
22
99
7-A
MG
52
99
2d
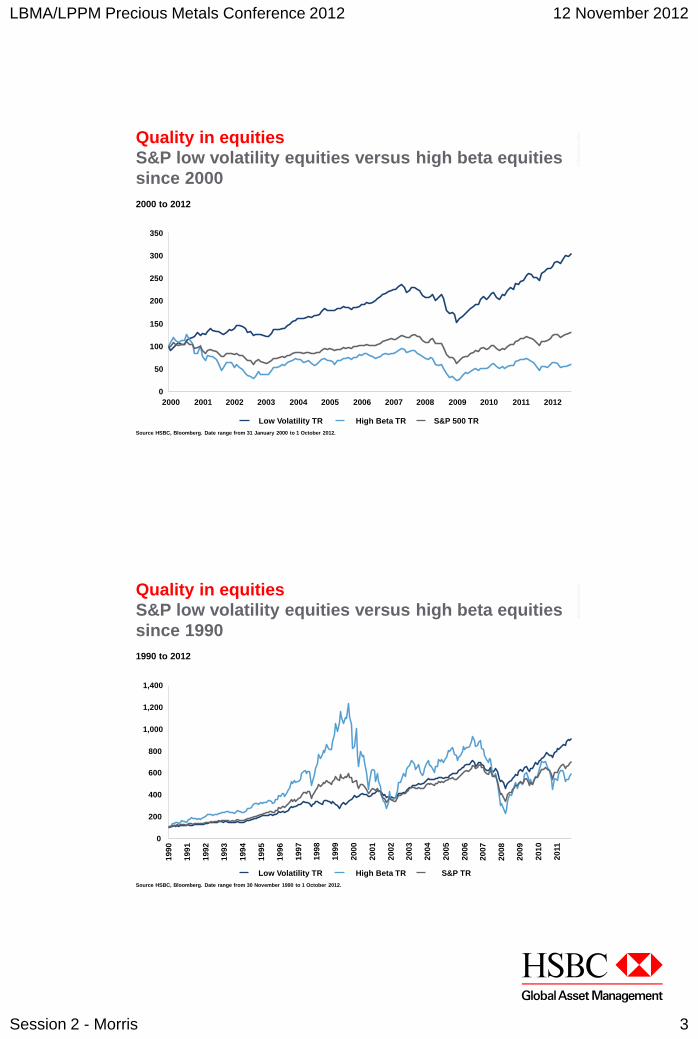
Quality in equities
S&P low volatility equities versus high beta equities
since 2000
2000 to 2012 2000 to 2012
0
50
100
150
200
250
300
350
2000 2001 2002 2003 2004 2005 2006 2007 2008 2009 2010 2011 2012
Low Volatility TR High Beta TR S&P 500 TR
Source HSBC, Bloomberg. Date range from 31 January 2000 to 1 October 2012.
22
99
7-A
MG
52
99
2d
Quality in equities
S&P low volatility equities versus high beta equities
since 1990
1990 to 2012 1990 to 2012
0
200
400
600
800
1,000
1,200
1,400
19
90
19
91
19
92
19
93
19
94
19
95
19
96
19
97
19
98
19
99
20
00
20
01
20
02
20
03
20
04
20
05
20
06
20
07
20
08
20
09
20
10
20
11
Low Volatility TR High Beta TR S&P TR
Source HSBC, Bloomberg. Date range from 30 November 1990 to 1 October 2012.

LBMA/LPPM Precious Metals Conference 2012 12 November 2012
4 Session 2 - Morris
22
99
7-A
MG
52
99
2d
Quality in commodities
The least volatile commodities have delivered the highest returns
A plentiful “above ground” supply broadly correlates with volatility
Supply days is a best estimate as these figures are impossible to
determine with accuracy
Commodity Volatility Supply days
Gold 16% 14,381
Silver 29% 5,755
Copper 27% 231
Wheat 31% 82
Soybeans 31% 57
Corn 29% 47
Oil 33% 46
Natural gas 56% 42
22
99
7-A
MG
52
99
2d
Technical analysis of the gold market
Technical analysis is a trading discipline
– Trend following works best on less volatile securities
– Reversion to the mean works best on more volatile securities
Gold has low volatility follow the trend
– Lower volatility allows the trading strategy to slow down
– Less speed lowers the turnover which cuts trading costs
Technical strategy for gold
– Confirm the bull market
– Determine your “core position” size
– Implement a tactical overlay to increase that position size periodically
LBMA/LPPM Precious Metals Conference 2012 12 November 2012
5 Session 2 - Morris
22
99
7-A
MG
52
99
2d
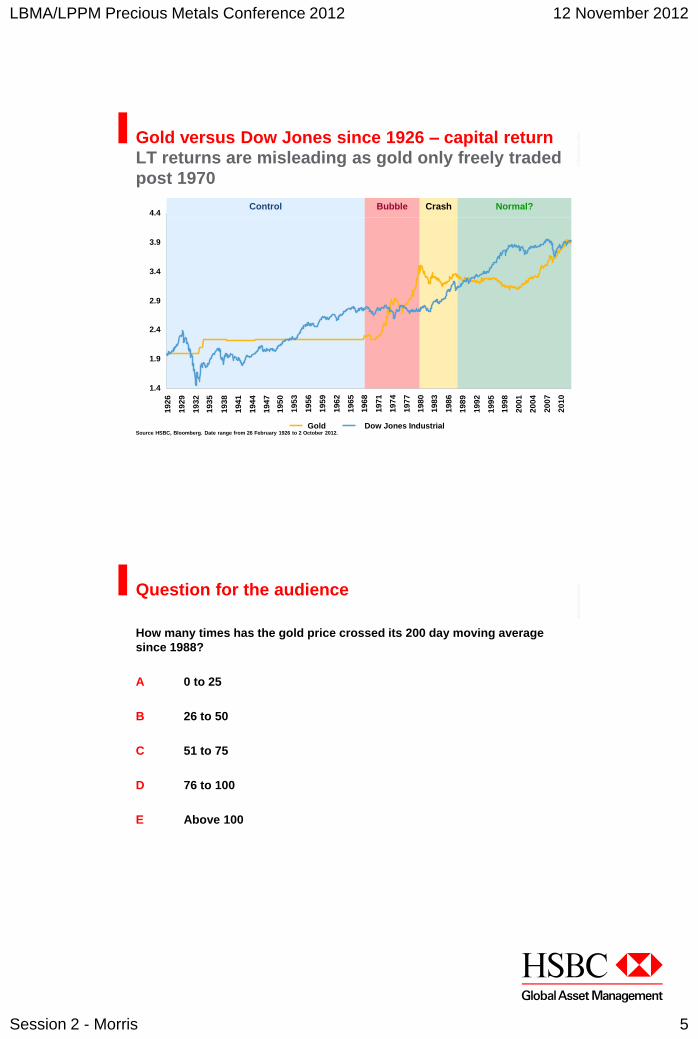
Gold versus Dow Jones since 1926 – capital return
LT returns are misleading as gold only freely traded
post 1970
Normal? Crash Bubble Control
1.4
1.9
2.4
2.9
3.4
3.9
4.4
19
26
19
29
19
32
19
35
19
38
19
41
19
44
19
47
19
50
19
53
19
56
19
59
19
62
19
65
19
68
19
71
19
74
19
77
19
80
19
83
19
86
19
89
19
92
19
95
19
98
20
01
20
04
20
07
20
10
Gold Dow Jones Industrial Source HSBC, Bloomberg. Date range from 26 February 1926 to 2 October 2012.
22
99
7-A
MG
52
99
2d
Question for the audience
How many times has the gold price crossed its 200 day moving average
since 1988?
A 0 to 25
B 26 to 50
C 51 to 75
D 76 to 100
E Above 100
LBMA/LPPM Precious Metals Conference 2012 12 November 2012
6 Session 2 - Morris
22
99
7-A
MG
52
99
2d
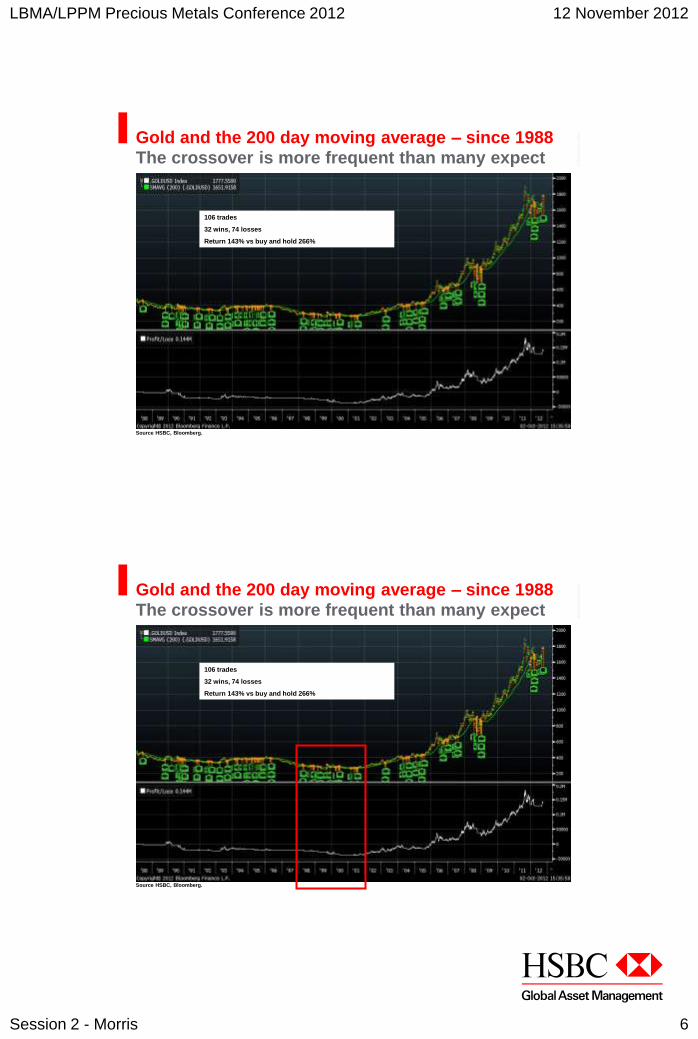
Gold and the 200 day moving average – since 1988
The crossover is more frequent than many expect
106 trades
32 wins, 74 losses
Return 143% vs buy and hold 266%
Source HSBC, Bloomberg.
22
99
7-A
MG
52
99
2d
Gold and the 200 day moving average – since 1988
The crossover is more frequent than many expect
106 trades
32 wins, 74 losses
Return 143% vs buy and hold 266%
Source HSBC, Bloomberg.
LBMA/LPPM Precious Metals Conference 2012 12 November 2012
7 Session 2 - Morris
22
99
7-A
MG
52
99
2d
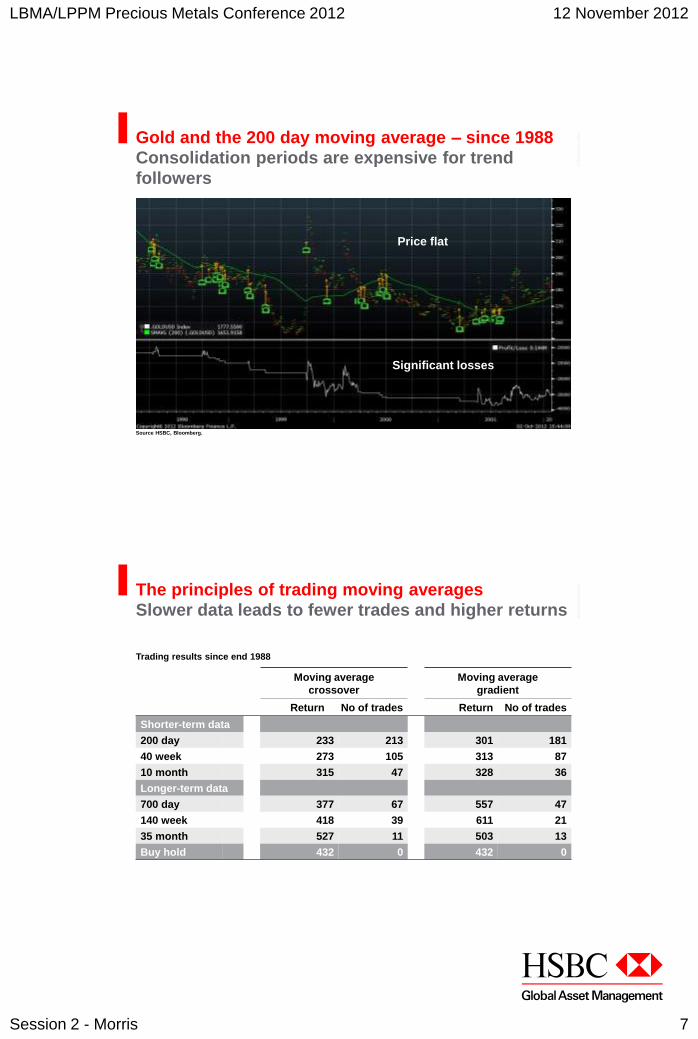
Gold and the 200 day moving average – since 1988
Consolidation periods are expensive for trend
followers
Price flat
Significant losses
Source HSBC, Bloomberg.
22
99
7-A
MG
52
99
2d
Moving average
crossover
Moving average
gradient
Return No of trades Return No of trades
Shorter-term data
200 day 233 213 301 181
40 week 273 105 313 87
10 month 315 47 328 36
Longer-term data
700 day 377 67 557 47
140 week 418 39 611 21
35 month 527 11 503 13
Buy hold 432 0 432 0
The principles of trading moving averages
Slower data leads to fewer trades and higher returns
Trading results since end 1988

LBMA/LPPM Precious Metals Conference 2012 12 November 2012
8 Session 2 - Morris
22
99
7-A
MG
52
99
2d
The tactical and strategic approach
Position size reflects conviction
Large position
No position For illustrative pursposes only.
22
99
7-A
MG
52
99
2d
Gold bear market
No position
The tactical and strategic approach
Position size reflects conviction
Large position
No position For illustrative pursposes only.

LBMA/LPPM Precious Metals Conference 2012 12 November 2012
9 Session 2 - Morris
22
99
7-A
MG
52
99
2d
The tactical and strategic approach
Position size reflects conviction
Large position
Gold bull market No position
100%
90%
80%
70%
60%
50%
40%
30%
20%
10%
For illustrative pursposes only. Amounts shown are approxiamte indications.
22
99
7-A
MG
52
99
2d
The tactical and strategic approach
Position size reflects conviction
Large position
Gold bull market
AND market is timely
No position
100%
90%
80%
70%
60%
50%
40%
30%
20%
10%
For illustrative pursposes only. Amounts shown are approxiamte indications.

LBMA/LPPM Precious Metals Conference 2012 12 November 2012
10 Session 2 - Morris
22
99
7-A
MG
52
99
2d
The tactical and strategic approach
Position size reflects conviction
Large position
Gold bull market
AND market is timely
AND conditions are optimal
No position
100%
90%
80%
70%
60%
50%
40%
30%
20%
10%
For illustrative pursposes only. Amounts shown are approxiamte indications.
22
99
7-A
MG
52
99
2d
LESS when too good to be true
The tactical and strategic approach
Position size reflects conviction
Large position
Gold bull market
AND market is timely
AND conditions are optimal
No position
100%
90%
80%
70%
60%
50%
40%
30%
20%
10%
For illustrative pursposes only. Amounts shown are approxiamte indications.

LBMA/LPPM Precious Metals Conference 2012 12 November 2012
11 Session 2 - Morris
Core gold models
to identify a bull market in gold
22
99
7-A
MG
52
99
2d
Real interest rates
US real rates since 1982
Gold has performed best when real rates are <2%
US Real Rates
(6)
(4)
(2)
0
2
4
6
8
19
82
19
83
19
84
19
85
19
86
19
87
19
88
19
89
19
90
19
91
19
92
19
93
19
94
19
95
19
96
19
97
19
98
19
99
20
00
20
01
20
02
20
03
20
04
20
05
20
06
20
07
20
08
20
09
20
10
20
11
Loose money - bullish
Tight money - bearish Return 347% versus buy and hold 239%
13 occurrences since 1988
The zone is 1.7% to 2%
Source HSBC, Bloomberg. Date range from 31 October 1982 to 2 October 2012.

LBMA/LPPM Precious Metals Conference 2012 12 November 2012
12 Session 2 - Morris
22
99
7-A
MG
52
99
2d
Gold and the long-term trend
Gold in a global currency basket with a 35-month
exponential MA since 1985
Use the gradient and not the crossover
Return 342% vs buy and hold 252%
5 gradient changes since 1988
10 Moving average crosses
0
20,000
40,000
60,000
80,000
100,000
120,000
140,000
160,000
19
85
19
86
19
87
19
88
19
89
19
90
19
91
19
92
19
93
19
94
19
95
19
96
19
97
19
98
19
99
20
00
20
01
20
02
20
03
20
04
20
05
20
06
20
07
20
08
20
09
20
10
20
11
20
12
Gold without dollars Three Year Trend Source HSBC, Bloomberg. Date range from 28 February 1985 to 2 October 2012.
22
99
7-A
MG
52
99
2d
Gold versus the S&P 500
Gold S&P ratio with a 35-month exponential MA
since 1988 – Use the gradient and not the crossover
Return 342% vs buy and hold 252%
18 gradient changes since 1970
3 gradient changes since 1988
0.0
0.2
0.4
0.6
0.8
1.0
1.2
1.4
1.6
1.8
2.0
19
88
19
89
19
90
19
91
19
92
19
93
19
94
19
95
19
96
19
97
19
98
19
99
20
00
20
01
20
02
20
03
20
04
20
05
20
06
20
07
20
08
20
09
20
10
20
11
20
12
.GOLDSPX Index - Last Price EMAVG (35) Source HSBC, Bloomberg. Date range from 31 October 1967 to 2 October 2012.

LBMA/LPPM Precious Metals Conference 2012 12 November 2012
13 Session 2 - Morris
22
99
7-A
MG
52
99
2d
Core model summary
Real interest rates are low – bullish since 2009
The gold trend is strong in a global currency basket – bullish since 2001
Gold is beating equities – bullish since 2002
Gold is in a bull market
22
99
7-A
MG
52
99
2d
Core model summary
Real interest rates are low – bullish since 2009
The gold trend is strong in a global currency basket – bullish since 2001
Gold is beating equities – bullish since 2002
Gold is in a bull market
Therefore the tactical models can now be implemented

LBMA/LPPM Precious Metals Conference 2012 12 November 2012
14 Session 2 - Morris
Tactical models to increase the position size
22
99
7-A
MG
52
99
2d
Gold volatility
Gold in global money 1988 to 2000
Non trending market = model useless
Source HSBC, Bloomberg.

LBMA/LPPM Precious Metals Conference 2012 12 November 2012
15 Session 2 - Morris
22
99
7-A
MG
52
99
2d
Gold volatility
Gold in global money 2000 to 2012
Trending market = model effective
High volatility, mean revert
Low volatility, trend follow
Source HSBC, Bloomberg.
22
99
7-A
MG
52
99
2d
The gold silver ratio
Since 1988
Useful to identify relative value between gold and silver but even better
measure of macro economic risk
When silver is leading leads, gold is more likely to rise
Avoid data mining this series
Silver cheap relative to gold
Silver expensive relative to gold
Average pre 2001 = 72
Average post 2001 = 60
30
40
50
60
70
80
90
100
19
88
19
89
19
90
19
91
19
92
19
93
19
94
19
95
19
96
19
97
19
98
19
99
20
00
20
01
20
02
20
03
20
04
20
05
20
06
20
07
20
08
20
09
20
10
20
11
Source HSBC, Bloomberg. Date range from 21 October 1988 to 3 October 2012.

LBMA/LPPM Precious Metals Conference 2012 12 November 2012
16 Session 2 - Morris
22
99
7-A
MG
52
99
2d
Sentiment
Studying the crowd, not the price
There are numerous was of approaching this inexact science
CFTC data is useful as is the Hulbert Sentiment Index
However the web hits is the most timely and is also the broadest measure
Source www.alexa.com
22
99
7-A
MG
52
99
2d
Long-term
Core
position
Short-term
Large
position
Medium-term
Overweight
position
Return to
long-term
core position
Gold bear market
The tactical and strategic approach
Position size reflects conviction
For illustrative pursposes only. Amounts shown are approxiamte indications.

LBMA/LPPM Precious Metals Conference 2012 12 November 2012
17 Session 2 - Morris
22
99
7-A
MG
52
99
2d
Long-term
Core
position
Short-term
Large
position
Medium-term
Overweight
position
Return to
long-term
core position
Gold bear market
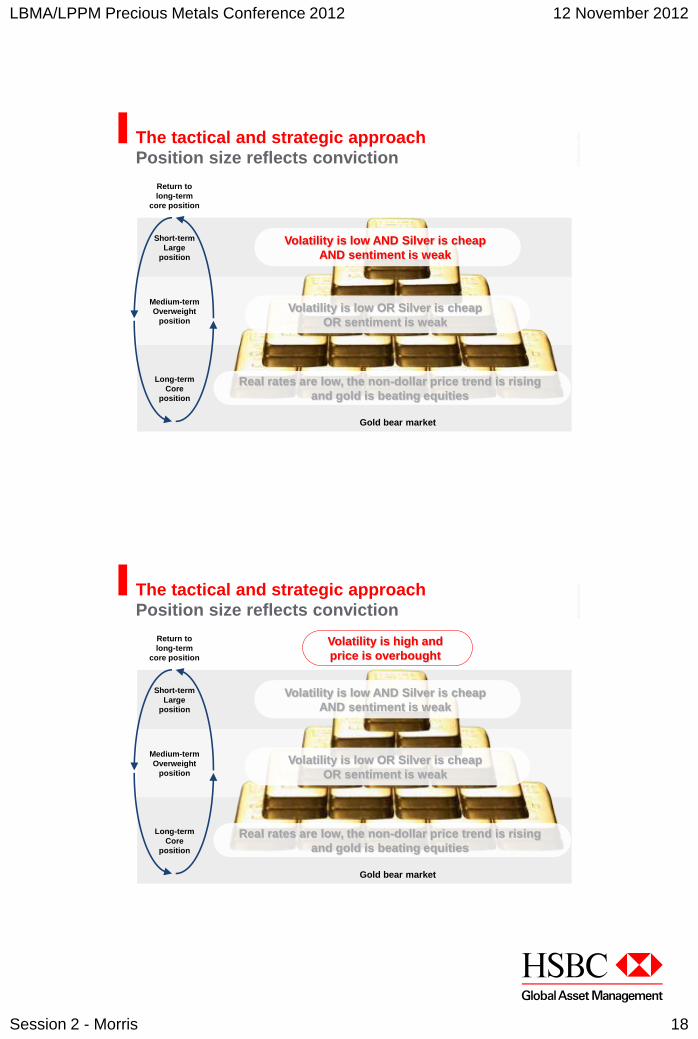
The tactical and strategic approach
Position size reflects conviction
Real rates are low, the non-dollar price trend is rising
and gold is beating equities
22
99
7-A
MG
52
99
2d
Long-term
Core
position
Short-term
Large
position
Medium-term
Overweight
position
Return to
long-term
core position
Gold bear market
The tactical and strategic approach
Position size reflects conviction
Real rates are low, the non-dollar price trend is rising
and gold is beating equities
Volatility is low OR Silver is cheap
OR sentiment is weak
LBMA/LPPM Precious Metals Conference 2012 12 November 2012
18 Session 2 - Morris
22
99
7-A
MG
52
99
2d
Long-term
Core
position
Short-term
Large
position
Medium-term
Overweight
position
Return to
long-term
core position
Gold bear market
The tactical and strategic approach
Position size reflects conviction
Real rates are low, the non-dollar price trend is rising
and gold is beating equities
Volatility is low OR Silver is cheap
OR sentiment is weak
Volatility is low AND Silver is cheap
AND sentiment is weak
Volatility is high and
price is overbought
LBMA/LPPM Precious Metals Conference 2012 12 November 2012
19 Session 2 - Morris
22
99
7-A
MG
52
99
2d
Long-term
Core
position
Short-term
Large
position
Medium-term
Overweight
position
Return to
long-term
core position
Gold bear market
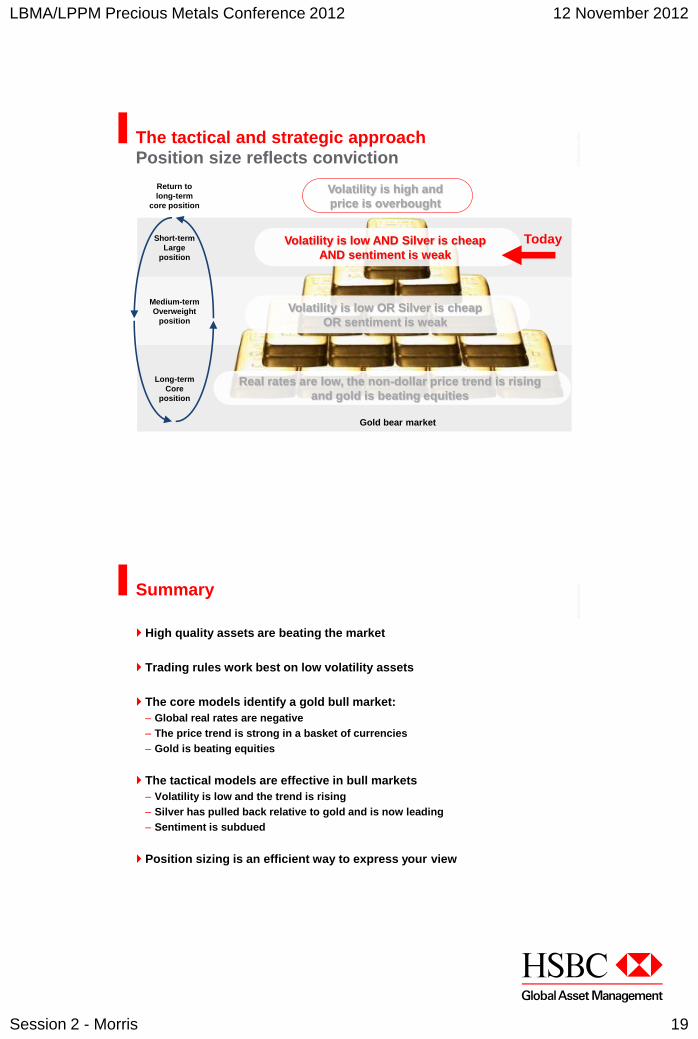
The tactical and strategic approach
Position size reflects conviction
Real rates are low, the non-dollar price trend is rising
and gold is beating equities
Volatility is low OR Silver is cheap
OR sentiment is weak
Volatility is low AND Silver is cheap
AND sentiment is weak
Volatility is high and
price is overbought
Today
22
99
7-A
MG
52
99
2d
Summary
High quality assets are beating the market
Trading rules work best on low volatility assets
The core models identify a gold bull market:
– Global real rates are negative
– The price trend is strong in a basket of currencies
– Gold is beating equities
The tactical models are effective in bull markets
– Volatility is low and the trend is rising
– Silver has pulled back relative to gold and is now leading
– Sentiment is subdued
Position sizing is an efficient way to express your view

LBMA/LPPM Precious Metals Conference 2012 12 November 2012
20 Session 2 - Morris
22
99
7-A
MG
52
99
2d
Disclaimer
This document is issued in the UK by HSBC Global Asset Management, a trading name of HSBC Private Bank (UK) Limited and
HSBC Global Asset Management (UK) Limited. Both are authorised and regulated by the Financial Services Authority and
registered in England at 8 Canada Square, E14 5HQ.
The contents of this document are confidential and may not be reproduced or further distributed to any person or entity,
whether in whole or in part, for any purpose. This document is not intended for distribution to or use by any person or entity in
any jurisdiction or country where such distribution or use would be contrary to law or regulation.
HSBC Global Asset Management has based this document on information obtained from sources it believes to be reliable but
which it has not independently verified. HSBC Global Asset Management and HSBC Group accept no responsibility as to its
accuracy or completeness.
This document is intended for discussion only and shall not be capable of creating any contractual or other legal obligations
on the part of HSBC Global Asset Management or any other HSBC Group company. Care has been taken to ensure the
accuracy of this presentation but HSBC Global Asset Management accepts no responsibility for any errors or omissions
contained therein.
Any forecast, projection or target where provided is indicative only and is not guaranteed in any way. HSBC Global Asset
Management accepts no liability for any failure to meet such forecast, projection or target.
© Copyright. HSBC Global Asset Management 2012. All Rights Reserved. 22997 GD/1012 FP12 - XXXX