table of contents the human related dimensions · pdf filebig bazar at the same price from...
TRANSCRIPT


Table of Contents
Articles
CUSTOMER PREFERENCES WITH REFERENCE TO PRIVATE LABELS OF BIG BAZAAR
Vijay Kumar Reddy Prodhuturi, Dr Jayashankar Prasad Cherukuri, Mr Sambhasivudu Valivella
HYGIENIC HANDLING OF KITCHEN EQUIPMENTS OF MOTHERS IN SOUTHERN DISTRICTS OF TAMIL NADU – INDIA
Ramesh Kumar S
THE HUMAN RELATED DIMENSIONS OF TQM PRACTICES IN SERVICE ORGANIZATIONS: A EMPIRICAL STUDY OF COMMERCIAL BANKS IN HYDERABAD KARNATAKA REGION
Giridhari Tiwari
A STUDY OF CHOICE OF CUSTOMERS TOWARDS DISTRIBUTION CHANNELS OF LIFE INSURANCE INDUSTRY
Sanjay Manocha, Sr. Subhash Chand Chitkara
www.theinternationaljournal.org > RJCBS: Volume: 01, Number: 07, May-2012 Page 1
Abstract
Many of the retailers try to make better profits private labels
as a strategy. For that they have to maintain the performance
of private labels to gain their expected profit margins.
Maintenance of only private brands in the store may not
bring good results and maintenance of national labels alone
may not result in achievement of required profit margins. In
saturated markets, given the intensity of competition,
customer bonding has become more important for the
simple reason that such relationships generate greater profits
for a firm (Juhl, Kristensen, & Ostergaard, 2002; Reichheld
& Sasser, 1990). So they were maintaining a tradeoff
between labels. And the tradeoff should be in a way such
that profit has to be achieved and product availability has to
be in a satisfactory level, and all this is to happen while
strong bonding is created between the customer and the
private labels. This study is taken to find out the
performance of private labels over national labels in the Big
Bazaar store. The data collected related to this study is
analyzed and used for testing the hypothesis using Signed
rank test statistical tool.
Company Profile
BigBazaar is a unit of pantaloon Retail (India) Ltd and
caters to the great Indian Middle class. It is a hypermarket
format head quartered in Mumbai.Itstag-line is “Is se sasta
aur achcha kahin nahin”. It sells a large range of
merchandise at affordable prices, the prices of which it
claims are lowest than the market in so many times. Usually
the items are clubbed together for offers as on the lines of
Wal-Mart and Carrefour, weekend discounts and works on
the same economy model as Wal-Mart and has considerable
success. It is currently operating out of more than 150 stores
and top 25 stores having a cumulative footfall (Number of
visitors) of 30 lakh a month on an average.
Future group led its founder & group CEO Mr. Kishore
Biyani. He is the one of Indian leading business house with
multiple businesses. The retail firms are the core business
activity of future group. Its subsidiaries are presently in
consumer finance, capital, insurance, brand development &
entertainment. First Big Bazaar store open in 2001 in
Kolkata, Hyderabad and Bangalore.
The Indian retail sector is one of the most hectic marketing
activities of all times. The companies are fiercely fighting to
win the hearts of customer, and the FDI into the retail sector
fuels the fire. In India, the first mover advantage goes to
“BIG BAZAAR”. It has created all items under one roof at
low rates, or so it claims. All the merchandising is done
through ARS (Automatic Replacing System).
The large young working population is a preferred customer
segment. BigBazar targets this segment of working women
and home makers who are the primary decision makers.
BigBazar has made a big name in the retail industry of India,
Shopping experience in Big Bazaar is further made a
memorable experience with the discounts on products as well
as discount vouchers available in a variety of amounts, Like
INR 2000, 3000,4000, 5000 and `10000 on all Big Bazar
products and accessories.
Awards and recognition:
In 2007 won the International Retailer of the year´
at US based National Retail Federation Convention
in New York.
In the same year it also won Emerging Retailer of
the year award at the World Retail Congress heal in
Barcelona.
Big Bazaar Privet labels
Big Bazaar is a retailer and sells so many brands
manufactured by some companies. Along with them Big
Bazaar is offering its own brands to the customers. It is
generating turnover above 200 crores from its private labels.
Koryo: in this brad Iron boxes, mixers, micro woven,
Televisions, Air conditioners, coolers, heaters, vacuum
cleaners, electrical stoves, ceiling fans, coffee maker, head
blander, sandwich toaster.
NYX &STUDIO: Party wares, formal shorts, jeans & T-
shorts all men wares are provided.
Spunk: Sports items and T-shorts are available
Promotional activities
Tag -line: Big Bazaar tag-lines are the key components in
advertising. These tag-lines are framed according to
demographic profile of customers. These catchphrases
appeared on hoardings and newspapers in areas where Big
Bazaar was launched. Everybody easily understood and
connected easily with the single line simple. The catch-liners
are in "Hindi - Chan ekebhawkaaju","Bengali - Ruier dame
illish", "Hindi - Stall kebhaw balcony", etc.
Print Advertisements:Newspaper advertisements are
present just before launch of any new scheme. It is to create
aura about the Big Bazaar brand in the customers mind.
TV Advertisements:Big Bazaar spending a lot of money in
Customer Preferences with reference to private
labels or Big Bazaar
Prodhuturi Venkata Vijaykumar (Main & Corresponding Author)
Dr Cherukuri Jayasankaraprasad (Co-Author)
V.Samba Sivudu (Co-Author)

www.theinternationaljournal.org > RJCBS: Volume: 01, Number: 07, May-2012 Page 2
brand building exercise. Its commercials are shown on
various channels in India.
Radio Advertisements:This technique is used in Tier 1 /Tier
2 cities. Now-a-days, it is replaced by advertisements on FM
radio channels.
Reason for buying from big bazaar
Here shopping is a great experience as one can find
almost everything under the single roof. It has
different features which caters all the requirements
of the customers.
o The Food Bazar/the grocery store is the
department selling fruits and vegetables
o Furniture Bazar is a large section dealing
with furniture.
o Electronics Bazar is electronic goods and
cellular phones.
The online shopping portal, shopping products of
Big Bazar at the same price from home.
Pantaloon Retail (India) Limited, is India’s leading retailer.It
operates multiple retail formats in value and lifestyle
segments of the Indian market. Headquartered in Mumbai
(Bombay), operates over 10 million square feet of retail
space, has over 1000 stores across 61 cities in India with
over 30,000 employees. The company’s leading formats
include Pantaloons, chain of fashion outlets, Food Bazaar,
Big Bazaar, uniquely Indian hypermarket chain,
supermarket chain, blends the look, touch and feel of Indian
bazaars with aspects of modern retail like choice,
convenience, quality and Central, a chain of seamless
destination malls. Some of its other formats include, Fashion
StationDepot, Shoe Brand Factory, Factory, Blue Sky, , all,
Top 10, bazaars. The company also operates an online
portal, futurebazaar.com. A subsidiary company, Home
Solutions Retail (India) Limited, a large-format home
solutions store, selling home furniture products and E-Zone
on catering to the consumer electronics segment.
Big Bazaar Wholesale Club
The Big Bazaar Wholesale Club provides an opportunity to
save in bulk as the customers buy in bulk. It brings to
customers bulk deals at wholesale prices. The Big Bazaar
Wholesale Club offers multi-packs and bulk packs of a
selected range of merchandise at wholesale prices. The
merchandise categories are from Food & FMCG to Home
Linen and many more. Customers will not find any
loose/single unit (except fresh) at a Big Bazaar Wholesale
Club. It has created ‘Fashion @ Big Bazaar’, a sub-brand, to
position the format more than food or general merchandise.
Brand building strategy The store brand products are benchmarked to the market
leader in terms of features and benefits and easily captures
customer’s mind due to low price. For example a branded
product is priced at higher and the Big Bazaar’s labeled is
available at lower. Private labels are major impact on
retailer’s activities. Now a day’s frequently decisions’ food
industries and retailers have to face regarding private labels
Sood. J. (1993). The private labels are the brands developed
and managed by distributors (retailers, wholesalers,
foodservices). Retailers print their brands on products and
sell them to final consumers. Store brands are differentiate
retailers themselves from their competitors and to create
loyalty. The manufactures are responsible for the success of
their national brand products retailers play a key role in the
success or failure of their private label products (Sheth, J. N
1972).
Methodology/Analytical procedure
The data collected related to this study is analyzed and used
for testing the hypothesis using Signed rank test statistical
tool. Sampling design was basically done as non-probability
and probability/random sampling. The data is used both
primary and secondary for questionnaire. The survey was
conducted from the customer visiting the Bigbazar Stores.
The percentage analysis charts are shown in this paper for a
better understanding of the novice readers and scholars
studying the retail industry and private labels.
Chart Showing Frequency of purchase of Private labels
Daily 47%
Weekly 33%
Monthly 15%
Yearly 5%
Frequency of purchase

www.theinternationaljournal.org > RJCBS: Volume: 01, Number: 07, May-2012 Page 3
From collected data it is obvious that most of Big Bazaar’s customers are come to the big bazaar daily and some customers
are come to weekly and then some customers are come to the monthly and yearly.
Chart Showing factors that stimulate Preferences of private labels:
It reveals that most of Big Bazaar’s customers wants to the quality and then on the basis of price of the product. Very less
(5%) of the people are looking for after sales service.
Chart showing Source of awareness to customer for private labels:
Most of the people know the private products of the Big Bazaar only when they are visiting. And 23% through newspapers,
20% through reference groups and only 17% from electronic media.
Chart Showing Purchase preference for private labels compared to National Brands:
The customers have mostly opted for functionality, to the next features and then reliability. But when compare these three
options can say that these three are having equal importance.
Price 27%
Quality 56%
Awareness 12%
After sales service
5%
Factors
After visiting the
store 40%
Reference groups
20%
Newspapers 23%
Electronic media 17%
Information Sources
Functionality
38%
Features 34%
Reliability 28%
Purchase Preference

www.theinternationaljournal.org > RJCBS: Volume: 01, Number: 07, May-2012 Page 4
Chart Showing Brand preference for selectedPrivate Label Categories:
For Oils, Jams, Flours, Furniture Private Brands are preferred by most of the people. The remaining national brands were
preferred.
Chart Showing Satisfaction levels of consumers on Private Labels:
18% of the respondents are dissatisfied. The remaining are satisfied. So 82% of the private brand users are favorable.
Research findings and limitations
From the data analyses and interpreted the findings
for the store and products under promotional offers are as
follows
From collected data it is obvious that most of the
customers purchase preference is basing up on the
product functionality then after features and
reliability.
In this research the respondentsmale personae’s
are more than the females
In the customers occupations Employees peoples
are more than to Business and students
Store found located is high more than people store
location is conveniently
Most of the people prefer the privet labels on the
basis of quality and price
From collected data it is obvious that most of
BigBazaar’s customers after using privet labeled
product most of the peoples give the statement is
satisfied another statement is no dissatisfaction
People come to know about the promotional offers
more from after visiting the store and newspapers.
The private labeled products more customers
preferred flours, furniture, oils, hence the
remaining people preferred remaining products.
Most of the customers purchase preference is
based on the product functionality and then
features and reliability.
0
10
20
30
40
50
60
70
80
90
100
Private label
National label
Highly Satisfied
20%
Satisfied 40% no
dissatisfaction
22%
Dissatisfied 18%
Satisfaction level

www.theinternationaljournal.org > RJCBS: Volume: 01, Number: 07, May-2012 Page 5
After using private labeled product most of the
people give the statement is satisfied another
statement is no dissatisfaction.
Conclusion
The Indian retail sector is basically divided into two
categories Organized and Unorganized. So the total
potential of the Indian retail sector is very hard to measure
exactly, as the number in terms of sales and stores grow in
multiples every day. In case of organized sector there are
satisfactory stats developed by numerous researchers and the
Govt. The positive effect of private labels turned out to play
a significant role in creating loyalty among the consumers as
the. The results are reliable with recent prior study of Brown
(2000) and Erik et al. (2011). In the global competition for
foremost share in the wallet of the customers, Retailers are
shelling out millions on the strategic marketing efforts. With
the help of their own private labels the margins that the
organized retailers aim are significant. All these efforts are
not with an unadorned objective of positioning themselves
in the market, but to create a pool of customer who can be
bonded to the organization.The role of private labels in
generating business to the retailers is adorable in the present
scenario. This is due to the increasing inflation and the
prices of basic commodities have turned the consumers from
national and branded items to the cheaper private labels. To
maximize the profits of the retailers own branded products
are receiving the lion share in the advertising budget, which
in turn reaping the best out of customers’ wallet to the
retailers. Most of the private labels are of low prices,
everything available under one roof, spot discounts, other
discounts, coupons etc, and these feature make them the
most preferred items in a mall.
Key References
1. AC Nielsen, 2010, ‘The Crossover Shopper' Comes
of Age as Indian Shoppers become more Loyal to a
Fixed Set of Stores across Shop Types’, available
at: http://in.nielsen.com/news/201011243.shtml
(Accessed on 15 Dec 2010).
2. Brands and National Brands of Cheese. American
Agricultural Economics Association Annual
Meeting. Denver, Colorado, August 1-4, 2004.
3. IRI Marketing Fact Book (1996). Information
Resources, Inc. Annual Report. Associations.
Journal of Marketing Research, Vol. 37, pp. 331-
350.
4. Kaciak, E. & Cullen, C.W. (2006). Analysis of
means-end chain data in marketing research.
Journal of Targeting, Measurement and Analysis
for Marketing. Vol. 15(1), pp. 12-20.
5. Keoleian, G. A., Spitzley, D. V. & McDaniel, J.
(1997). Life cycle design of milk and juice
packaging. Cincinnati, OH: US Environmental
Protection Agency, Office of Research and
Development, National Risk Management
Reserach Laboratory.
6. Klenosky, D. B., Genger, C. E., & Mulvey, M. S.
(1993). Understanding the factors influencing ski
destination choice: A means-end analytic approach.
Journal of Leisure Research. Vol. 25(4), pp. 362-
379.
7. Lal, R. (1990). Manufacturer Trade Deals and
Retail Price Promotions. Journal of Marketing
Research. Vol. 27, pp. 428-444.
8. Lincoln, K. & Thomassen, L. (2008). Private
Label: Turning the Retail Brand Threat into Your
Biggest Opportunity. London: Kogan Page.
9. McConnell, J. D. (1968). Effects of Pricing on
Perceptions of Product Quality. Journal of
Marketing Research. Vol. 5, pp. 300-303.
10. McIntosh, A.J. & Thyne, M. (2005). Understanding
tourist behavior through a means-end approach.
Annals of Tourism Research. Vol. 32 (1), pp. 259-
262.
11. Mehrotra, A. & Agarwal, R. (2009). Private Label
Brands And Their Perception Among Indian Youth.
Faculty Jaipuria Institute of Management,
Lucknow. Article, No. 180.
12. Nandan, Sh. & Dickinson, R. (1994). Private
Brands. Journal of Consumer Marketing, Vol.
11(4), 18-28.
13. Nirmalya, K. & Steenkamp, J-B. E.M (2007).
Private Label Strategy: How to Meet the Store
Brand Challenge, Cambridge: MA: Harvard
Business School Press.
14. Schwartz, S. H. (1994). Are there Universal
Aspects in the Structure and Contents of human
Values? Journal of Social Issues. Vol. 50 (4), pp.
19–45.
15. Semeijn, R. J. A. C. R. & Ambrosini, A. B. (2004).
Consumer evaluations of store brands:effects of
store image and product attributes. Journal of
Retailing and Consumer Services. Vol. 11, pp.
247–258.
16. Sethuraman, R. & Mittelstaedt, J. (1992). Coupons
and Private Labels: A Cross-Category Analysis of
Grocery Products. Psychology and Marketing. Vol.
9, pp. 487-500.
17. Shapiro, E. (1992). P&G Takes On the
Supermarkets With Uniform Pricing. The
NewYorkTimes. April 26, p. 35.
18. Sheth, J. N. & Talarzyk, W.W. (1972). Perceived
Instrumentality and Value Importance as
Determinants of Attitudes. Journal of Marketing
Research. Vol. 9, pp. 6-9.
19. London: Dryden Press.Sood, J. (1993). A multi
country research approach for multinational
communication strategies. Journal of International
Consumer Marketing. Vol. 5, pp. 29–
50.Steenkamp, J.-B.E.M. (1989). Product quality:
An investigation into the concept and how itis
perceived by consumers. Assen/Maastricht: Van
Gorcum.
***

www.theinternationaljournal.org > RJCBS: Volume: 01, Number: 07, May-2012 Page 6
ABSTRACT
The aim of the present research paper is to examine
mothers’ hygienic practices in handling kitchen equipments.
This study highlighted the gaps in awareness and handling
of kitchen equipments and kitchen utensils. The survey was
conducted randomly selected mothers (N=2,685) who had
the primary responsibility in keeping the kitchen equipments
hygienically. The result shows that the urban mothers
regularly clean the kitchen equipments. But this is not
possible among the rural mothers due to the limitations of
time, money, energy and interest. Awareness should create
among the rural mothers regarding evils of not cleaning the
kitchen equipments and improper hygienic practices.
Keywords: Kitchen equipments, Hygienic
Introduction
In our various daily activities at home and work,
hands get quickly contaminated. Some activities such as the
use of toilet paper to clean up following a diarrhoeal
episode, changing the diaper of a sick infant, blowing a nose
and touching of raw food materials, increase the risk of
finger contamination by pathogens. Washing and drying of
hands reduce microbial contamination (Todd EC 2010). In
the implicated food handling, the hands of food handlers are
the sources of pathogens. The most convenient and efficient
way of removing pathogens from hand is a thorough hand
washing practice. There are possibilities of cross-
contamination at home due to incorrect house work
procedures, such as those involved in cleaning, the hygiene
of food preparation, and the care of a baby or the sick
(Bloomfield and Scott 1997). Snelling, A. M., et al., (1991).
It is known that poor hand washing practices inevitably lead
to retention of bacterial and viral pathogens on the hands,
which are obtained from handling raw produce or from toilet
activities. Guzewich, & Ross, (1999); in their study they
analysed different factors for causing the food born diseases.
Finally, they concluded that food handlers and poor hand
washing practices have been implicated as the source of
food borne disease outbreaks. Scott A. R., J. D, Anding,
suggested in their study that proper hand washing is
important to everyone, including low-income families who
often have limited resources for medical treatment.
2. MATERIALS AND METHODS
2.1 SAMPLE SIZE
Quantitative data was collected from 2685 mothers
randomly selected from the five districts of Tamil Nadu.
Equal importance had given both urban and rural mothers.
In the field, data were collected through the questionnaire in
the personal interview mode in the residence of the
respondents after obtaining informed consent from them.
2.2 RESEARCH DESIGN
The survey examines the impact of food safety
knowledge and practices of mothers food adulteration and
unawareness of lodging of complaints during the period of
February 2010 to September 2011 as a part of Doctoral
research work. A food safety and food adulteration
questionnaire was designed, which consisted of
demographic questions (age, education, income, occupation
and locality) and 39 questions covering issues related to
food safety, and food adulteration. The second part of the
study is presented in the paper. The questionnaire was
divided into three sections (1) a demographic section, (2)
hygienic practices and (3) kitchen equipments. The
investigator and research assistants were trained in
collecting data. The questionnaires were prepared in both
English and Tamil. In rural areas, Tamil questionnaires were
given to collect data. In addition, the research assistants
explained the questions in detail. Each respondent took 25 to
30 minutes to complete a questionnaire. Each collected
questionnaire was allotted a separate code number for cross
references. The respondents were interviewed in person by
well structured questionnaire through eight trained research
assistants and the investigator. Approximately, 34% of the
questionnaires were filled in by the respondents while 66%
was guided in filling the questionnaire.
2.3 PILOT STUDY
The questionnaire was pre-tested by collecting data
from 105 mothers both in urban and rural areas in the
months of November and December 2010. This helped to
confirm practical applicability, clarity and to avoid
unnecessary questions. The questionnaire was revised and
restructured based on the results of the pilot study. Some
additional questions were added after evaluating the
questionnaires in the pilot study.
Hygienic handling of Kitchen equipments of
mothers in southern districts of
Tamil Nadu - India Dr. S. Ramesh Kumar,
G. Padma Parvathy, Dr. G. Paulraj, & G.Subbulakshmi,
PG and Research Department of Commerce,
V.O. Chidambaram College, Tuticorin, TamilNadu, India.

www.theinternationaljournal.org > RJCBS: Volume: 01, Number: 07, May-2012 Page 7
2.4 DATA ANALYSIS
The responses from mothers were analyzed by using a
statistical package. Scores for each test category were
calculated by assigning correct responses. Mean responses
with standard deviation and percentage analysis of each
category were calculated and presented in the tabular form.
Cross tabulations and chi-square tests 5% significance level
was used to compare indicators across demographic
characteristics (age, educational level, urban and rural
background).
3. RESULTS AND DISCUSSION
3:1 PROFILE OF RESPONDENTS
TABLE 1 Demographic Characteristic of Respondents
Demographic characteristics Frequency %
Age (n = 2685)
< 25 237 8.8
25-30 771 28.7
31-36 1039 38.7
37-42 362 13.5
> 43 276 10.3
Education (n = 2685)
Illiterate 770 28.7
School level 1453 54.1
College level 462 17.2
Occupation (n = 2685)
Housewife 1577 58.7
Employed 624 23.2
Daily wages 484 18.0
Locality (n = 2685)
Urban 1295 48.2
Rural 1390 51.8
Source: Primary Data
Table 1 shows the demographics of the 2685
mothers by age, education, income, occupation and place of
living. Analyzable questionnaires were obtained from 1295
urban mothers and 1390 rural mothers. They were
randomly from household in India in which they had the
primary responsibility of food preparation at home. None of
them were professional food handlers. These respondents
were interviewed face-to-face by well structured
questionnaire by eight trained research assistant and one
investigator. Appropriately 63% of the questionnaires were
filled in by the respondents, while 37 percent was guided in
filling the questionnaires. The majority of the respondents
(38.7%) were in the age group of 25-30 years. About 54.1%
of the respondents were school level educated and more the
one fourth were (28.7%) illiterate. Of all mothers
interviewed, majority of the respondents (55.4%) were
housewives.
HANDLING OF KITCHEN EQUIPMENTS
One of the main causes of contamination is
improper handling and cleaning of kitchen equipments
before and after every use. Ensuring food safety is possible
only through right cleaning methods of kitchen equipments.
There are different methods followed in cleaning of kitchen
equipments such as manual washing and mechanical
washing. The frequency in cleaning kitchen equipments is
main criterion to avoid food borne illness. In this table,
percentage test is used to analyse the frequency of cleaning
kitchen equipments.
TABLE: 2 Frequency of Cleaning Kitchen Equipments Before and After Use
Table 2 shows that the cleaning of kitchen
equipments before and after use. Majority of the mothers
(61.5%) regularly clean the kitchen equipments before and
after use, 29.9% of the mothers clean kitchen equipments
occasionally and the remaining 8.6% of the mothers never
clean the kitchen equipments before and after use. Majority
of the mothers clean the kitchen equipments before and after
every use.
Cleaning of Equipments before and after using
Respondents Percentage
Regularly 1651 61.5
Occasionally 804 29.9
Never 230 8.6
Total 2685 100.0

www.theinternationaljournal.org > RJCBS: Volume: 01, Number: 07, May-2012 Page 8
TABLE: 3 Cleaning of Kitchen Equipments in Urban and Rural Areas
Locality Cleaning of Equipments before and after using
Total Regularly Occasionally Never
Urban
Respondents 857 367 71 1295
Locality 66.2% 28.3% 5.5% 100.0%
Cleaning of Equipments before and after
using 51.9% 45.6% 30.9% 48.2%
Rural
Respondents 794 437 159 1390
Locality 57.1% 31.4% 11.4% 100.0%
Cleaning of Equipments before and after
using 48.1% 54.4% 69.1% 51.8%
Total
Respondents 1651 804 230 2685
Locality 61.5% 29.9% 8.6% 100.0%
Cleaning of Equipments before and after
using 100.0% 100.0% 100.0% 100.0%
Table 3 indicates the cleaning of kitchen
equipments before and after every use by mothers in
different localities. More than half (51.8%) of the mothers in
rural area affirm to cleaning the equipments before and after
every use. In it, 57.1% of the mothers clean the kitchen
equipments regularly. 31.4% of the mothers clean the
kitchen equipments occasionally and the remaining 11.4%
of the mothers never clean the kitchen equipments. Further,
48.2% of the mothers in urban area, (66.2%) regularly clean
the kitchen equipments. 28.3% of the mothers clean the
kitchen equipments occasionally and the remaining 5.5% of
the mothers never clean the kitchen equipments.
TABLE 4 Locality of Mothers and the Cleaning of Kitchen Equipments
Chi-Square Tests
Value df Asymp. Sig. (2-sided)
Pearson Chi-Square 38.855a 2 .000
*
Likelihood Ratio 39.688 2 .000
Linear-by-Linear Association 35.917 1 .000
N of Valid Cases 2685
Source: Primary Data *Significant at five per cent level
In this table, the ‘P’ value is less than 0.05. The
null hypothesis is rejected at 5% level of significance.
Therefore, there is association between localities and the
cleaning of kitchen equipments before and after use. Hence,
the mothers’ locality is related to the cleaning of kitchen
equipments before and after use. It is concluded that the
urban mothers take more care to clean the kitchen
equipments when compared to rural mothers.
TABLE: 5 Impact of Age Group in Cleaning the Kitchen Equipments
Age
Cleaning of Equipments before and after using
Total Regularly Occasionally Never
Below 25
Respondents 140 74 23 237
Age 59.1% 31.2% 9.7% 100.0%
Cleaning of Equipments before and
after using 8.5% 9.2% 10.0% 8.8%
25-30
Respondents 473 220 78 771
Age 61.3% 28.5% 10.1% 100.0%
Cleaning of Equipments before and
after using 28.6% 27.4% 33.9% 28.7%
31-36
Respondents 638 338 63 1039
Age 61.4% 32.5% 6.1% 100.0%
Cleaning of Equipments before and
after using 38.6% 42.0% 27.4% 38.7%
37-42
Respondents 211 108 43 362
Age 58.3% 29.8% 11.9% 100.0%
Cleaning of Equipments before and
after using 12.8% 13.4% 18.7% 13.5%
Above 43 Respondents 189 64 23 276
Age 68.5% 23.2% 8.3% 100.0%

www.theinternationaljournal.org > RJCBS: Volume: 01, Number: 07, May-2012 Page 9
Cleaning of Equipments before and
after using 11.4% 8.0% 10.0% 10.3%
Total
Respondents 1651 804 230 2685
Age 61.5% 29.9% 8.6% 100.0%
Cleaning of Equipments before and
after using 100.0% 100.0% 100.0% 100.0%
Source: Primary Data
Table 5 indicates the relationship between cleaning
of kitchen equipments before and after use by the mothers of
different age groups. In cleaning the kitchen equipments,
majority (38.7%) of the mothers are in the age group of 31-
36 years. In this age group, 61.4% of the mothers clean the
kitchen equipments regularly, 32.5% of the mothers clean
the kitchen equipments occasionally and the remaining 6.1%
of the mothers never clean the kitchen equipments. In the
age group of 25-30 years (28.7%), 61.3% of the mothers
clean the kitchen equipments regularly, 28.5% of the
mothers clean the kitchen equipments occasionally and the
remaining 10.1% of the mothers never clean the kitchen
equipments before and after use. In the age group of 37- 42
years (13.5%), 58.3% of the mothers clean the kitchen
equipments regularly, 29.8% of the mothers clean the
kitchen equipments occasionally and the remaining 11.9%
of the mothers never clean the kitchen equipments. In the
age group of above 43years (10.3%), 68.5% of the mothers
clean the kitchen equipments regularly, 23.2% of the
mothers clean the kitchen equipments occasionally and the
remaining 8.3% of the mothers never clean the kitchen
equipments before and after use. In the age group of below
25 years, (8.8%), 59.1% of the mothers clean the kitchen
equipments regularly, 31.2% of the mothers clean the
kitchen equipments occasionally and the remaining 9.7% of
the mothers never clean the kitchen equipments before and
after use. It is concluded that, majority of the mothers under
the age group of 31-36 years clean the kitchen equipments
regularly before and after use.
TABLE 6 Age Group of Mothers and Cleaning the Kitchen Equipments
Chi-Square Tests
Value df Asymp. Sig. (2-sided)
Pearson Chi-Square 24.970a 8 .002
*
Likelihood Ratio 25.439 8 .001
Linear-by-Linear Association 1.612 1 .204
N of Valid Cases 2685
Source: Primary Data *Significant at five per cent level
In this table, ‘P’ value is less than 0.05. The null
hypothesis is rejected at 5% level of significance. Therefore,
there is an association between the age of the mothers and
the habits of cleaning the kitchen equipments before and
after use. Hence, the age of the mothers is related to their
habits in cleaning the kitchen equipments before and after
use.
TABLE: 7 Impact of Level of Education in Cleaning the Kitchen Equipments
Educational
Qualification
Cleaning of Equipments before and after using Total
Regularly Occasionally Never
Illiterate
Respondents 423 267 80 770
Educational Qualification 54.9% 34.7% 10.4% 100.0%
Cleaning of Equipments before
and after using 25.6% 33.2% 34.8% 28.7%
School level
Respondents 896 427 130 1453
Educational Qualification 61.7% 29.4% 8.9% 100.0%
Cleaning of Equipments before
and after using 54.3% 53.1% 56.5% 54.1%
College level
Respondents 332 110 20 462
Educational Qualification 71.9% 23.8% 4.3% 100.0%
Cleaning of Equipments before
and after using 20.1% 13.7% 8.7% 17.2%
Total
Respondents 1651 804 230 2685
Educational Qualification 61.5% 29.9% 8.6% 100.0%
Cleaning of Equipments before
and after using 100.0% 100.0% 100.0% 100.0%
Table 7 indicates the relationship cleaning of
kitchen equipments before and after use by mothers of
different educational qualification. In cleaning of kitchen
equipments, more than half (54.1%) of the mothers have
completed their school level education. In this group, 61.7%
of the mothers clean the kitchen equipments regularly before

www.theinternationaljournal.org > RJCBS: Volume: 01, Number: 07, May-2012 Page 10
and after use, 29.4% of the mothers clean the kitchen
equipments occasionally and the remaining (8.9%) the
mothers never clean the kitchen equipments before and after
use. It is followed by (28.7%) of the mothers have no
educational qualification and they are considered illiterate.
Among them, 54.9% of the mothers clean the kitchen
equipments regularly before and after use, 34.7% of the
mothers clean the kitchen equipments occasionally and the
remaining 10.4% of the mothers never clean the kitchen
equipments. In addition, 17.2% of the mothers completed
their college level education. In it, 71.9% of the mothers
clean the kitchen equipments regularly before and after use,
23.8% of the mothers clean the kitchen equipments
occasionally and the remaining 4.3% of the mothers never
clean the kitchen equipments before and after use. It is
concluded that, when compared to mothers with college
education and illiterate mothers, more than half of the
mothers with school level education clean the kitchen
equipments before and after use regularly.
TABLE 8 Education of Mothers and Cleaning the Kitchen Equipments
Chi-Square Tests
Value df Asymp. Sig. (2-sided)
Pearson Chi-Square 38.100a 4 .000
*
Likelihood Ratio 40.019 4 .000
Linear-by-Linear Association 34.619 1 .000
N of Valid Cases 2685
Source: Primary Data *Significant at five per cent level
In this table, the ‘P’ value is less than 0.05. The
null hypothesis is rejected at five per cent level of
significance. Therefore, there is a significant association
between the level of education and the habit of cleaning the
kitchen equipments. Hence, the education level of the
mothers is related to their habit in cleaning of kitchen
equipments before and after uses. It is concluded that, the
level of education influences the mothers in cleaning the
kitchen equipments. When the level of education increases,
the habit of cleaning kitchen equipments also increases.
TABLE: 9 Occupational Impacts on Cleaning of Kitchen Equipments
Occupation Cleaning of Equipments
Total Regularly Occasionally Never
Housewife
Respondents 979 449 149 1577
Occupation 62.1% 28.5% 9.4% 100.0%
Cleaning of Equipments before
and after using 59.3% 55.8% 64.8% 58.7%
Employed
Respondents 392 194 38 624
Occupation 62.8% 31.1% 6.1% 100.0%
Cleaning of Equipments before
and after using 23.7% 24.1% 16.5% 23.2%
Daily wager
Respondents 280 161 43 484
Occupation 57.9% 33.3% 8.9% 100.0%
Cleaning of Equipments before
and after using 17.0% 20.0% 18.7% 18.0%
Total
Respondents 1651 804 230 2685
Occupation 61.5% 29.9% 8.6% 100.0%
Cleaning of Equipments before
and after using 100.0% 100.0% 100.0% 100.0%
Table 9 indicates the relationship cleaning of
kitchen equipments before and after use by mothers in
different occupation. In cleaning of kitchen equipments,
more than half (58.7%) of them are housewives. Among
them, 62.1% of the mothers clean the kitchen equipments
regularly. 28.5% of the mothers clean the kitchen
equipments occasionally and the remaining 9.4% of the
mothers never clean the kitchen equipments. It is followed
by employed mothers (23.2%). Among them, 62.8% of the
mothers clean the kitchen equipments regularly, 31.1% of
the mothers clean the kitchen equipments occasionally and
the remaining 6.1% of the mothers never clean the kitchen
equipments. Further 18% of the mothers receive daily
wages. In the midst, 57.9% of the mothers clean the kitchen
equipments regularly before and after use, 33.3% of the
mothers clean the kitchen equipments occasionally and the
remaining 8.9% of the mothers never clean the kitchen
equipments. Majority of the mothers who are housewives
clean the kitchen equipments regularly before and after
every use.

www.theinternationaljournal.org > RJCBS: Volume: 01, Number: 07, May-2012 Page 11
TABLE: 10 Occupation of Mothers and Cleaning of Kitchen Equipments
Source: Primary Data *Significant at five per cent level
In the study, the ‘P’ value is less than 0.05. The
null hypothesis is rejected at five per cent level of
significance. Therefore, there is a significant association
between the occupation of mothers and their habit of
cleaning the kitchen equipments. Hence, the occupation of
the mothers is related to their habits in cleaning of kitchen
equipments before and after use. It is concluded that,
cleaning of kitchen equipments is influenced by the
occupation of the mothers.
TABLE: 11 Influence of Income in Cleaning the Kitchen Equipments
Monthly Income Cleaning of Equipments
Total Regularly Occasionally Never
Below Rs.5000
Respondents 980 531 173 1684
Monthly Income 58.2% 31.5% 10.3% 100.0%
Cleaning of Equipments 59.4% 66.0% 75.2% 62.7%
Rs.5000-Rs.15000
Respondents 486 205 44 735
Monthly Income 66.1% 27.9% 6.0% 100.0%
Cleaning of Equipments 29.4% 25.5% 19.1% 27.4%
Above Rs.15000
Respondents 185 68 13 266
Monthly Income 69.5% 25.6% 4.9% 100.0%
Cleaning of Equipments 11.2% 8.5% 5.7% 9.9%
Total
Respondents 1651 804 230 2685
Monthly Income 61.5% 29.9% 8.6% 100.0%
Cleaning of Equipments 100.0% 100.0% 100.0% 100.0%
Source: Primary Data
Table 11 indicates the relationship between
cleaning of kitchen equipments before and after use in
different income levels of mothers. In cleaning the kitchen
equipments, majority (62.7%) of the mothers’ monthly
income is below Rs.5000. Among them 58.2% of the
mothers clean the kitchen equipments regularly before and
after use, 31.5% of the mothers clean the kitchen
equipments occasionally and the remaining 10.3% of the
mothers never clean the kitchen equipments before and after
use. The income group of Rs.5000-Rs.15000 (27.4%),
66.1% and 27.9% of the mothers clean the kitchen
equipments regularly and occasionally respectively and the
remaining 6% of the mothers never clean the kitchen
equipments before and after use. Only 9.9% of the mothers’
monthly income is above Rs.15000. Among them, 69.5% of
the mothers clean the kitchen equipments regularly before
and after use, 25.6% of the mothers clean the kitchen
equipments occasionally and the remaining 4.9% of the
mothers never clean the kitchen equipments before and after
use.
TABLE: 12 Monthly Income of Mothers and Cleaning the Kitchen Equipments
Chi-Square Tests
Value df Asymp. Sig. (2-sided)
Pearson Chi-Square 28.147a 4 .000
*
Likelihood Ratio 29.224 4 .000
Linear-by-Linear Association 26.385 1 .000
N of Valid Cases 2685
Source: Primary Data *Significant at five per cent level
In this table, the ‘P’ value is less than 0.05. The null
hypothesis is rejected at five per cent level of significance.
Therefore, there is a significant association between the
income of mothers and their habits of cleaning the kitchen
equipments. Hence, the income level of the mothers is
related to their habits of cleaning kitchen equipments before
and after use.
CONCLUSION
Majority of mothers (61.5%) regularly clean the
kitchen equipments. Only negligible respondents (8.6%)
never clean the equipments. The middle age group of
mothers (31-36 years) takes regular effort to clean kitchen
equipments compare to other age groups of mothers. In the
different levels of education, school level educated mothers
give more importance to clean the kitchen equipments than
Chi-Square Tests
Value df Asymp. Sig. (2-sided)
Pearson Chi-Square 12.939a 6 .044
*
Likelihood Ratio 13.449 6 .036
Linear-by-Linear Association .169 1 .681
N of Valid Cases 2685

www.theinternationaljournal.org > RJCBS: Volume: 01, Number: 07, May-2012 Page 12
the illiterate and college level educated mothers.
Housewives take much effort to clean the kitchen
instruments before and after cleaning use.
In compare to different levels of income of mothers,
majority of the income group of below RS.5,000 never clean
the kitchen equipments. The mothers in the age group of
below 30 years and the mothers in the illiterate and college
level mothers should be advised to regular cleaning of
kitchen equipments. Awareness should be created among
the employed and daily wagers about the importance of
hygienic practices of cleaning kitchen equipments for the
family health.
REFERENCES
Todd, EC,
http://www.ncbi.nlm.nih.gov/pubmed?term=%22Todd
%20EC%22%5BAuthor%5D Michaels BS, Smith D,
Greig JD, Bartleson CA., (2010). Outbreaks where
food workers have been implicated in the spread of
food borne disease. Part 9. Washing and drying of
hands to reduce microbial contamination. Department
of Advertising Public Relations and Retailing,
Michigan State University, East Lansing, Michigan
48824, USA. [email protected]. J Food Prot. Oct;
73(10):1937-55.
Bloomfield, S. F., & Scott, E. (1997). Cross-contamination
and infection in the domestic environment and the role
of chemical disinfectants. Journal of Applied
Microbiology, 83(1), 1–9.
Snelling, A. M., Kerr, K. G., & Heritage, J. (1991). The
survival of Listeria monocytogenes on fingertips and
factors affecting elimination of the organism by
handwashing and disinfection. Journal of Food
Protection, 54, 343–348.
Guzewich, J. J., & Ross, M. P., (1999). White paper, section
one: A literature review pertaining to food borne
disease outbreaks caused by food workers caused by
food workers. 1978–1998.
Scott A. R., J. D. Anding; Hand washing Practices of Low-
Income Women Enrolled in the Expanded Food and
Nutrition Education Program of Texas Author(s): A. R.
Scott, J. D. Anding; Department of Nutrition and Food
Science, Texas Agri Life Extension Service, College
Station, TX.
***

www.theinternationaljournal.org > RJCBS: Volume: 01, Number: 07, May-2012 Page 13
Abstract
This paper attempted to explore the human related aspects of
TQM practices in Service organizations (commercial
banks). Soft TQM signifies any forms of business efforts
dedicated to human-related dimensions of TQM, namely,
leadership and top management commitment, customer
focus, training and education, empowerment, and reward &
recognition. The samples of the study were 250 employees
of commercial banks located in Hyderabad Karnataka
region. The tool of analysis used in this study was
descriptive statistics. The finding of the study showed that
all Soft TQM dimensions were well implemented as part of
commercial bank’s quality management practices with
empowerment appears to be a dominant practice. The result
of the study prescribed potential implications for the
management of commercial banks in Hyderabad Karnataka
region to include human related aspect of TQM as an
integral part of the company’s strategic vision to obtain
higher level of employees’ commitment.
Keywords : Empowerment, Human aspects, Management
commitment, Service organization, TQM.
I. Introduction & Literature review
A number of researchers urge that for TQM to be fully
successful, it requires a wide-ranging adoption of “softer”
approaches (Schonberger,1994) whose dimensions
comprise, in essence, elements of human resources
management (Dale et al., 1994, Wilkinson, 1992). In
addition, substantial amount of inquiries on the linkage
between various TQM facets with company performance
showed that it is the software determinants of TQM that
mainly affect business performance (Powell, 1995;
Sureshchandar et al.,2002; Weeks et al., 1995). For
example, Powell (1995) found that only three out of the 12
dimensions of TQM, namely, top executive’s dedication,
open management, and empowerments, are significantly
related to the whole business results. He concluded that
“STQM oriented companies can surpass their rivals with no
supplementing TQM philosophy”.
Sureshchandar (2002) investigated the association of total
quality service (TQS) with customer perception on service
quality and concluded that TQS elements, all together, are
definitely excellent forecasters of service quality. Besides,
the soft side of TQS (including top leaders commitment,
customer orientation, empowerment, staff member’s
contentment, training and education, reward and
recognition) appear to be more important than the hard side
of TQM in positively affecting consumer perception on
service. The results of these inquiries support the statement
that TQM is human-oriented management approach (Evans
& Lindsay, 2002).
Unlike other resources like technology, for instance, Human
Resources (HR) are different because their skills are unique,
which cannot be replicated flawlessly by their rivals, hence
making it a natural aptitude for synergy (Evans & Lindsay,
2002; Rahman, 2002). Therefore, to be effective, TQM
adoption should depend mostly on the enthusiasm, expertise,
dedication and extra-role behavior of staff members in
organizations. It has been argued that the benefits of TQM
will come to surface when business organizations seriously
consider employees as the critical success factor for TQM
adoption (Pfeffer, 1994).
Due to its significance, increasing attention has been paid by
scholars in examining human factors in TQM (e.g. Boselie
& Van der Wiele, 2002; Brah, et al., 2002; Chen, 1997; Fok
et al., 2000; Helen & Gerry, 1996; Karia & Abu Hassan
Asaari, 2006; Mehra & Ranganathan, 2008; Montes et al.,
2003; Ooi et al., 2005; Ooi et al., 2006; Powell, 1995, Yang,
2006). TQM HR-related facets such as joint effort,
participative management, ingeniousness, effectual
communication, consumer response, workers participation
and autonomy, staff members and leaders trust and
encouragement, have been looked into (Guimaraes, 1996).
But despite the existing works, the number is still deficient.
For that reason, more inquiries on the soft dimensions of
TQM in service settings are certainly needed.
Leadership plays a role as a determinant of successful TQM
implementation. According to Kochan et al. (1995),
employees should be held accountable for any deviation
between business achievement and applied technology
capacity. As claimed by Mehra and Ranganathan (2008),
quality improvement program cannot be treated as the
responsibility of the production department alone; instead it
becomes every one’s job in the institution. Quality
enhancement should work as an important belief and guide
in running the business. Hence, everybody in the
organization should enthusiastically participate in the
overall business.
A number of scholars have suggested that the survival of a
business is determined by its ability to integrate HRM and
TQM into operation (Redman & Mathews, 1998). Quality
scholars, researchers, lecturers and practitioners are aware
The Human related dimensions of TQM practices
in service organizations: A empirical study of
commercial banks in Hyderabad, Karnataka Region
Giridhari Tiwari, Asst. Prof., MBA dept., Rural Engineering College, Bhalki , Dist : Bidar (Karnataka)
Dr. P.T. Chaudhari, Professor, Head Commerce dept., M. J. College, Jalgaon (Maharashtra)

www.theinternationaljournal.org > RJCBS: Volume: 01, Number: 07, May-2012 Page 14
that HR matters can be at the centre of the quality theory
and that worker participation and dedication are the critical
success factor in implementing quality programs (Blackburn
& Rosen, 1993; Hart & Schlesinger, 1991; IPM, 1993;
Soltani et al., 2004)..
To date, scholars and practitioners appeared to be concerned
with the inquiry and adoption of the hard sides of quality
upgrading (mainly ISO 9000 certification), which are
evidenced in the literatures since 1990s. However, there is a
growing interest among scholars on the need for a shift in
quality thought by giving more attention on the management
of labor and also on strategic human resources management
(Blackburn & Rosen, 1993; Soltani et al., 2004; Vouzas,
2004). It is suggested in the literature that TQM
implementation will fail if applied in isolation; therefore it
should be integrated with other management approach such
as HRM. To this end, additional effort should be made to
assess organization by appraising their HR capacity and the
prospective level of quality adoption (Vouzas, 2007).
II. Objectives of the study
1. To understand the various human related aspects of
soft TQM practice by commercial banks in
Hyderabad Karnataka region.
2. To study & analyze the human resources
dimensions are integrated with practices soft total
quality management (TQM) in commercial banks
of Hyderabad Karnataka region.
3. This study is attempted to describe the extend of
soft total quality management (TQM) practice by
commercial banks in Hyderabad Karnataka region.
III. Hypotheses H0 : HR related dimensions of soft TQM practices
have a significant positive effect on employee
performance of commercial banks in Hyderabad
Karnataka region.
H1 : HR related dimensions of soft TQM practices
do not have a significant positive effect on
employee performance of commercial banks in
Hyderabad Karnataka region.
IV. Methodology
This study is descriptive in nature which describes soft
TQM practices by commercial banks in Hyderabad
Karnataka region. The survey instrument was six-page
questionnaire divided into three sections. The first section
was designed to obtain the respondents profile and
particulars of the company with regards to nature of
business and mode of execution. The second section relates
to the implementation of Soft TQM programs and is divided
into five parts. The research statements were developed by
the researchers, taking into account the past literature and in
consultation with experts in the industry. The third section
in the questionnaire relates to employees work related
outcomes, however they are not presented in this paper.
The variables measured in this study consist of five
dimension of Soft TQM as the independent variables,
namely:Top Management Commitment; Customer Focus;
Training and Education; Employee Empowerment; and
finally Reward and Recognition. The methods of analysis
used were descriptive statistics and the respondents of the
study were employees of commercial banks located in
Hyderabad Karnataka region. The study was conducted
between July 2011 until December 2011. About 500
questionnaires were sent to respondents and 265 were
returned. However only 250 were usable for further
analysis.
V. Results
The following table describes the means and standard
deviation bank’s commitment to Soft TQM in Hyderabad
Karnataka region.
Table 1: Descriptive Statistics on Soft TQM (n=250)
Table 1: Descriptive Statistics on Soft
TQM (n=250)
Minimum Maximum Mean Std. Deviation
Top Management Commitment 2.00 7.00 5.7312 0.86296
Reward and Recognition 1.50 7.00 5.7545 0.91518
Education and Training 1.71 7.00 5.5972 0.88225
Employee Empowerment 1.75 7.00 5.9256 0.78529
Customer Focus 1.00 7.00 5.2781 1.01720
Table 1 shows that Commercial banks in HK region
emphasize more employee empowerment (mean= 5.9256,
standard deviation= 0.78529) than other dimensions of Soft
TQM. On a Likert’s seven point scale (1= very low to 7=
very high), it can be concluded that commercial banks in
HK region pay good attention to the implementation of top
management commitment, customer focus, and employee
empowerment. Detailed responses on soft TQM are
presented in Table 2.
Table 2: Item Score for Each Construct
Factor 1: Top Management Commitment
Items 1) Top mgmt. actively participates in quality management and improvement process
2) Top mgmt. empowers employees
3) Top mgmt. arranges adequate resources for employee’s education and training
4) Top mgmt. pursues long term business success
5) Top mgmt. actively promotes and communicates the culture of service quality and excellence
6) Top mgmt. encourages staff participation when setting quality management strategy

www.theinternationaljournal.org > RJCBS: Volume: 01, Number: 07, May-2012 Page 15
Items 1 2 3 4 5 6 7 Total
1 F
P
0
0
2
0.8
4
1.6
17
6.8
102
40.8
50
20.0
75
30,0
250
100.0
2 F
P
0
0
0
0
5
2.0
23
9.2
75
30.0
81
32.4
66
26.4
250
100.0
3 F
P
0
0
2
0.8
8
3.2
20
8.0
60
24.0
88
35.2
72
28.8
250
100.0
4 F
P
1
0.4
1
0.4
5
2.0
21
8.4
64
25.6
78
31.2
80
32.0
250
100.0
5 F
P
0
0
0
0
10
4.0
32
12.8
58
23.2
83
33.2
67
26.8
250
100.0
6 F
P
0
0
2
0.8
5
2.0
22
8.8
71
28.4
75
30.0
75
30.0
250
100.0
Total 1 14 111 540 2150 2730 3045 8591
Total score for Top Management Commitment - (8591/10500) *100 = 81.8% (very good)
Factor 2: Rewards and Recognition
Items 1) Co. improves working conditions in order to recognize employee quality improvement efforts
2) The Co’s compensation system encourages team and individual contributions
3) Rewards and recognitions system within the company is based on work quality
4) Employee’s reward and penalties are clearly communicated
5) Employees are involved in determining kind of rewards
Items 1 2 3 4 5 6 7 Total
1 F
P
1
0.4
3
1.2
4
1.6
27
10.8
71
28.4
77
30.8
67
26.8
250
100.0
2 F
P
2
0.8
1
0.4
5
2.0
34
13.6
64
25.6
82
32.8
62
24.8
250
100.0
3 F
P
2
0.8
0
0
11
4.4
32
12.8
65
26.0
83
33.2
57
22.8
250
100.0
4 F
P
4
1.6
1
0.4
12
4.8
50
20.0
64
25.6
59
23.6
60
24.0
250
100.0
5 F
P
15
6.0
2
0.8
19
7.6
75
30.0
40
16.0
48
19.2
51
20.4
250
100.0
Total 24 14 153 872 1520 2094 2079 6756
Total score for Reward and Recognition - (6756/8750) *100% = 77.2 % (very good)
Factor 3: Education and Training (ET)
Items
1) Resources are available for employee’s education and training within the company
2) Quality and customer service training are given to staff throughout the company
3) Employees are trained on how to use quality management methods
4) Employees are involved in the evaluation and improvement of the training program
5) Employees are consistently trained on team building and group dynamics
6) Our institution consistently link quality training with spiritual values
7) Employees are encouraged to accept education and training within the company satisfaction
Items 1 2 3 4 5 6 7 Total
1 F
P
1
0.4
2
0.8
6
2.4
24
9.6
66
26.4
83
33.2
68
27.2
250
100.0
2 F
P
0
0
3
1.2
4
1.6
18
7.2
61
24.4
80
32.0
84
33.6
250
100.0
3 F
P
2
0.8
0
0
4
1.6
32
12.8
64
25.6
79
31.6
69
27.6
250
100.0
4 F
P
0
0
1
0.4
7
2-8
40
16.0
63
25.2
77
30.8
62
24.8
250
100.0
5 F
P
0
0
1
0.4
18
7.2
18
7.2
71
28.4
80
32.0
62
24.8
250
100.0
6 F
P
2
0.8
0
0
8
3.2
36
14.4
70
28.0
71
28.4
63
25.2
250
100.0
7
F
P
8
3.2
5
2.0
9
3.6
56
14.4
62
24.8
45
18.0
65
25.2
250
100.0
Total 13 24 168 896 2285 3090 3311 9787

www.theinternationaljournal.org > RJCBS: Volume: 01, Number: 07, May-2012 Page 16
Total Score for Education and Training - (9787/12250)*100% = 79.9% (very good)
Factor 4: Empowerment
Items 1) The company always encourages me to offer ideas about workplace improvement
2) I am fully responsible for the work that I have been assigned to
3) Our staffs are encouraged to work as a team rather than individual their responsibility
4) Employees are given adequate authority in controlling the quality of their jobs
Items 1 2 3 4 5 6 7 Total
1 F
P
0
0
0
0
2
0.8
15
6.0
61
24.4
75
30.0
97
38.8
250
100.0
2 F
P
0
0
1
0.4
6
2.4
31
12.4
75
30.0
76
30.4
61
24.4
250
100.0
3 F
P
0
0
0
0
12
4.8
13
5.2
54
21.6
73
29.2
98
39.2
250
100.0
4 F
P
0
0
2
0.8
2
0.8
12
4.8
53
21.2
103
41.2
78
31.2
250
100.0
Total 0 6 66 284 1215 1962 2338 5871
Total score for Empowerment - (5871/7000)*100% = 83.9% (very good)
Factor 5: Customer focus
Items 1) The company conducts a customer satisfaction survey every year
2) We continuously build and sustain a customer oriented culture
3) All employees believe that delivering high quality service to customers are their responsibility
4) Our Co. directs resources optimally for meeting and exceeding customer satisfaction
Items 1 2 3 4 5 6 7 Total
1 F
P
4
1.6
2
0.8
10
4.0
38
15.2
61
24.4
72
28.8
63
25.2
250
100.0
2 F
P
1
0.4
3
1.2
4
1.6
28
11.2
60
24.0
82
32.8
72
28.8
250
100.0
3 F
P
1
0.4
1
0.4
2
0.8
9
3.6
55
22.0
78
31.2
104
41.6
250
100.0
4 F
P
0
0
10
4.0
3
1.2
23
9.2
63
25.2
84
33.6
67
26.8
250
100.0
Total 6 32 57 392 1195 1896 2142 5720
Total Score for Customer Driven - (5720/7000)*100% = 81.7% (very good)
Note: F = Frequencies; P = %age
Based on the above analysis, three out of five dimensions of
soft TQM have a score above 80%. It can be concluded that
the implementation of soft TQM in commercial banks in
Hyderabad Karnataka region is very good. Employee
empowerment is among the best practice of soft TQM
dimension in bank with a score of 83.9%. However,
commercial banks should be concerned about rewards &
recognition as it shows lowest score than other dimensions
of soft TQM.
VI. Discussion
There are five dimension of soft TQM: top management
commitment, reward and recognition, education and
training, empowerment, and customer focus. As mentioned
earlier, commercial banks in Hyderabad Karnataka region
emphasize more on employee empowerment (mean=
5.9256, standard deviation= 0.78529) than other dimensions
of soft TQM. On a seven-point scale (1= very low to 7=
very high), it can be concluded that commercial banks in
Hyderabad Karnataka region pay good attention to the
implementation of top management commitment, customer
focus and employee empowerment. Based on descriptive
statistics performed on each category of soft TQM, as
depicted in table 2, conclusion can be made regarding best
practices in commercial banking in Hyderabad Karnataka
region.
There are three best practices of top management
commitment based on the responses obtained. A majority
(90.8%) of respondents agree that top management of
commercial banks in HK region actively participate in
quality management and improvement process, while 88.8%
agree that top management pursue long term business
success & empowers employees. The third best practices are
related to top management commitment in commercial
banks to encourage staff participation when setting quality
management strategy, as reported by 88.4% of the
respondents. Leaders should authorize and support their
employees to participate in quality improvement effort, and
develop cross-functional teamwork and customer-supplier
partnership. True leaders should promote quality in several
ways. In fact, a leader can inspire people to do things they

www.theinternationaljournal.org > RJCBS: Volume: 01, Number: 07, May-2012 Page 17
do not believe they can do. Commercial bank’s top
management commitment in this case are aligned with the
world’s leading practices on quality leadership in which
leaders should build a strategic vision and precise quality
values that serve as a source for business decision; create
high expectations; show strong personal commitment and
participation in quality which appears to be a missionary-
like fashion; assimilate quality values into every day
leadership and management; and uphold quality excellence
environment (Evans & Lindsay, 2002).
Among the best practices related to the second dimension of
STQM are as follows: improvement of working condition
by bank’s management in order to recognize quality
improvement efforts (86.0%); the compensation system of
commercial banks is considered good because it encourages
team and individual contributions towards the company’s
betterment (83.2%). This successful practice is already
applied by some quality-oriented companies in the world.
The second practice revealed in this case is good
compensation schemes, that should attract, retain and
motivate employees individually and teams, which as
reported 83.2 % of respondents. The third best practice is
related to the reward and recognition system imposed by
commercial banks in HK region (82 %) that is based on the
quality of work performance. Leading companies place a
strong emphasis on recognizing and rewarding behavior, not
just results (Evans & Lindsay, 2002). Awards systems that
go against quality values should be modified and eliminated.
The other two indicators of rewards and recognition
construct obtain a score below 80%. Only 73.2% of the
respondents support the view that “employees of the
commercial banks perceived that rewards and penalties were
not optimally communicated”. Unexpectedly, the fifth
indicator of reward and recognition obtains the lowest score.
Only 55.6 % support the statement that employees are
involved in determining kind of rewards. This means
employees thought that institutions do not involve their
employees in determining rewards and kinds. Most
important of all, rewards should create favorable work
behaviors that increase customer satisfaction.
The third dimension of soft TQM is education and training.
The top three best perceived practices are: quality and
customer service training are given to staff throughout the
company (90 %), there is a sufficient amount of resources
available for education and training within commercial
banks (86.8%) and employees are consistently trained on
team building and group dynamics (85.2 %). Despite
education and training being one of the largest initial costs
in a total quality initiative, commercial banks management
in Hyderabad Karnataka region have shown satisfactory
efforts in improving their employees quality through
education and training. Quality related training and
education would enhance the knowledge and skills of
Commercial bank employees which result in job efficiency
and effectiveness. Every production effort should be
performed at the lowest possible cost, as zero defect is a
performance standard. Zero defect means doing things right
the first time and every time. Such performance can only be
shown by well-educated and trained employees.
The fourth dimension of soft TQM is empowerment.
Around 93.6 % of commercial banks employees in
Hyderabad Karnataka region agree that Employees are given
adequate authority in controlling the quality of their jobs and
93.2% respondents agree that the institution always
encourages employees to offer ideas about workplace
improvements. Moreover, education and training is
promoted as a necessary step towards empowerment. Highly
educated employees are expected to make better decision
than those who are not. In addition, 90 % of respondents
feels that they are encouraged to work as a team rather than
individual within the companies. Empowerment requires
substantial training & commercial banks management
devotion to resources to education and training support the
process of empowerment. Individual and teams within the
commercial banks are empowered to make decisions that
affect quality and customer satisfaction.
The fifth dimension of soft TQM is customer focus. In
quality-oriented firms, every effort made must be customer
driven. This is also the case for commercial banks in
Hyderabad Karnataka region. The assessment made on
Commercial banks customer orientation indicates that
94.8% believe that delivering high quality services to
customers are their responsibility,85.4 % of respondents
agree that their institutions direct resources optimally to
meet and/or exceed customer satisfaction and support the
idea that continuously building and sustaining a customer-
oriented culture. Finally 78.4% employees report that their
institutions conduct customer satisfaction survey every year.
Management of Commercial banks are aware that focusing
on customer is not just a matter of quality issue; but it is
rather a sound business practice. High competition in the
industry forces Commercial banks to provide excellent
services to customers so that customer retention is
accomplished. Through customer satisfaction survey, the
management of commercial banks could gauge the level of
customer satisfaction and evaluate and improve their
internal processes.
VII. Conclusion and Recommendations
This study contributes to the understanding to the human
related aspects of TQM practice by commercial banks. It has
been revealed from this
study that the human resources related dimensions of soft
total quality management have a significant positive effect
on the employee performance in the commercial banks of
Hyderabad Karnataka region. Hence the hypotheses is
accepted.
Empowerment appears to be a dominant practice of soft
TQM among commercial banks management followed by
rewards and recognition and top management commitment.
Successful soft TQM implementation with respect to top
management commitment, reward and recognition,
education and training, empowerment, and customer focus,
is crucial to develop favorable work attitudes and behaviors
such as job satisfaction, organizational commitment,
organizational citizenship behavior, and loyalty. These
findings suggest several courses of action for improving

www.theinternationaljournal.org > RJCBS: Volume: 01, Number: 07, May-2012 Page 18
work related outcomes of commercial bank employees in
Hyderabad Karnataka region. First, there should be strong
top management commitment on quality of human
resources; second, reward system should be based on quality
performance & it should be clearly communicated; third,
investment should be made on employee education and
training; fourth spiritual values must be integrated with
human resources management in commercial banks. To
obtain employee favorable behavior at work, continuous
training facilities must be provided. Furthermore,
competency based human resources management training
should be adopted to ensure employees effectiveness &
efficiency at work.
References
1. Blackburn, R. and Rosen, B. (1993), Total quality and
human resources management: lessons learned from
Baldridge award-winning companies‟‟, Academy of
Management Executive, Vol. 17 No. 3, pp. 49-66.
2. Boselie, P., & vander Wiele, A. T. (2002). Employee
perceptions of HRM and TQM and the effects on
satisfaction and intention to leave. Managing Service
Quality, 12(3), 853-864.
3. Brah, S. A., Lee, S. L., & Rao, B. M. (2002).
Relationship between TQM and performance of
Singapore companies. International Journal of Quality
and Reliability Management, 19(4), 356-379.
4. Chen, W. H. (1997). The human side of total quality
management in Taiwan: Leadership and human
resources management. International Journal of Quality
& Reliability Management, 14(1), 24-45.
5. Dale, B. G., Cooper, C. L., & Wilkinson, A. (1997).
Managing quality and human resources: A guide to
continuous improvement,Oxford: Blackwell
6. Evans, J. R., & Lindsay, W. M. (2002). The
management and control of quality (5th ed.). Cincinnati,
OH: South-Western.
7. Fok, L., Hartman, S., Patti, A., & Razek, J. (2000).
Human factors affecting the acceptance of total quality
management. International Journal of Quality and
Reliability Management, 17(7), 714-729.
8. Guimaraes, T., (1997), Assessing employee turnover
intentions before/after TQM, International Journal of
Quality and Reliability Management, Vol.14 No.1,
pp.46-63
9. Helen S., &, Gerry S. (1996). HRM and TQM linkages:
A comparative case analysis. International Journal of
Manpower, 17(6/7), 89
10. Pfeffer, J. (1994). Competitive advantage through
people. Boston, MA: Harvard Business School Press.
Institute of Personnel Management, (1993), Quality:
People Management Matters, IPM Research Series,
Short Run Press Ltd, Exeter.
11. Karia, N., and Abu Hassan Asaari, M.H., (2006), The
effects of total quality management practices on
employee work-related attitudes,The TQM Magazine,
Vol.8, No.1, pp 30-43
12. Kochan, T.A, Gittell, J.H. and Lautsch, B.A. (1996),
Total quality management and human resource systems:
an international comparison, The International Journal
of Human Resources Management, Vol.6 No.2, pp201-
22
13. Mehra, S. and Ranganathan, S, (2008), Implementing
total quality management with a focus on enhancing
customer satisfaction, International Journal of Quality
and Reliability Management, Vol. 25 No. 9, pp. 913-
927
14. Montes, F., Jover, A. and Gernandez, L., (2003),
Factors affecting the relationship etween total quality
management and organizational performance,
International Journal of Quality & Reliability
Management, Vol.20, No.2, pp.189-209
15. Ooi K.B., Safa, M.S., and Arumugam, V, (2006), TQM
practices and affective commitment: a case of
Malaysian semiconductor packaging organizations,
International Journal of Management and
Entrepreneurship, Vol.2, No.1, pp. 37-55
16. Powell, T. (1995). Total quality management as
competitive advantage: A review and empirical study.
Strategic Management Journal, 16, 15-37.
17. Schonberger, R. J. (1994). Human resource
management lessons from a decade of total quality
management and reengineering. California
Management Review, 36(4), 109-123.
18. Soltani, E., Gennard, J., van der Meer, R.B. and
Williams, T. (2004), „„HR performance evaluation in
the context of TQM: a review of the literature‟‟,
International Journal of Quality & Reliability
Management, Vol. 21 No. 4, pp. 377-96 .
19. Surechandar, G. S., Rajendran G., & Anantharaman R.
N. (2002). The relationship between management
perception of total quality service and customer
perceptions of service quality. Total Quality
Management, 13(1), 69-88.
20. Vouzas, F, 2007, Investigating the human resources
context and content on TQM, business excellence and
ISO 9001:2000, Measuring Business Excellence, Vol.
11 no. 3 2007, pp. 21-29,
21. Wilkinson, A., Allen, P. and Snape, E. (1991), TQM
and the management of labor, Employee Relations, Vol.
13 No. 1, pp. 24-31.
22. Wilkinson, A. (1992). The other side of quality: Self
issues and human resources dimension. Total Quality
Management, 3(3), 323-329.
23. Yang, C.C. (2006), “ An integrated model of TQM and
GE-Six Sigma”, International Journal of Six Sigma and
Competitive Advantage, Vol.1, No.1, pp.97-105
***

www.theinternationaljournal.org > RJCBS: Volume: 01, Number: 07, May-2012 Page 19
ABSTRACT
In today’s scenario, Insurance Companies must move from
merely selling Insurance to marketing it as an essential
financial product. The distributors play a dual role – as
trusted financial advisors for the clients and trusted business
associates for the Insurance companies.
An insurer needs to think about the appropriate distribution
channel to reach its target customer as well as the product
that it is going to sell. The choice of customer and the nature
of product will influence the distribution structure. However
in India, joint ventures are formed such that distribution
structures are often pre-determined by the nature of partners.
For instance, if one of the partners in a tie-up is a bank, the
focus is commonly on bancassurance whereas if the joint
venture is one with a corporate house, invariably the
majority business is through the agency channel. This
implies that the insurer’s decision on product features;
pricing and target market will necessarily be influenced by
the distribution structure that the joint venture is endowed
with.
Keeping in mind the importance of distribution channels in
life insurance industry the present research consists of a
study of concept of insurance, distribution channels of life
insurance and also a survey has been done by the researcher
to know preferences of customers towards choice of
distribution channels like insurance advisors, bancassurance,
brokers, corporate agents etc. for buying insurance plans.
1. INSURANCE
1.1 CONCEPT OF INSURANCE
Definition of Insurance1
Insurance is a policy from a large financial institution that
offers a person, company, or other entity reimbursement or
financial protection against possible future losses or
damages.
Insurance is something that everyone will need sometime,
and it's worth understanding it before you buy.
Insurance include vehicle insurance, which includes auto,
motorcycle, and boat insurance, health insurance, life
insurance, home insurance, travel insurance, personal
property insurance, keyman insurance, dental insurance,
rental insurance, and more.
1 http://www.economywatch.com/insurance/DOAccession
07/06/11
What is Insurance
Insurance is a form of risk-management which spreads the
risk of many people in exchange for small payments from
each individual. Specifically, insurance transfers some type
of risk (accident, theft, natural disaster, illness, etc) from
one person or group to a more financially-sound entity in
exchange for a payment (also known as an insurance
premium). Premiums are often annual or monthly, but
depending on the type of insurance they can be at other
intervals.
For example, a consumer can pay a certain amount to an
insurer such as ICICI Lombard each year to insure that
person's car. This sum represents the insurance company's
assessment of the likelihood that the car will be damaged or
wrecked. These data are normally taken from historical
figures relating to the age, sex, profession, driving record,
and accident history of the insured, as well as statistics
concerning make and model of the car and its accident
record, as well as the engine size, number of passengers, and
even color of the vehicle.
Statistically, if the make and model of the vehicle in
question, and/or its driver have been in numerous accidents,
the insurance company will charge a higher premium in
order to hedge expected losses. As the risk increases, so too
do the premiums. In fact, sometimes, insurance companies
will not even insure certain people and/or vehicles as the
chance of them having to make a payout (in the event of an
accident) will be almost guaranteed.
Definition of Life Insurance
Insurance that guarantees a specific sum of money to a
designated beneficiary upon the death of the insured or to
the insured if he or she lives beyond a certain age.Life
insurance is meant to replace the loss of earned income on
the death of the breadwinner. An individual may insure to
protect the education or marriage plans of his children or to
offset a home loan liability on his untimely death2.
1.2 LIFE INSURANCE: DISTRIBUTION CHANNELS3
2 http://www.shvoong.com/medicine-and-health/1773832-exact-
meaning-life-insurance/#ixzz1RVL0qH32DOAccession 06/05/11 3 http://www.docstoc.com/docs/53255029/6-Distribution-of-life-insurance-products-in-India-and-inherent-risks-Kunj-Behari-10th-GCA D.O.Accession 26/06/11
A Study of choice of customers towards
distribution channels of Life Insurance Industry
Sanjay Manocha, Assistant Professor, BVIMR, New Delhi, India
Sr. Subhash Chand Chitkara, Reader & Head (Retired), Department of Commerce, S.S.V. (PG)
College, Hapur (U.P.), India

www.theinternationaljournal.org > RJCBS: Volume: 01, Number: 07, May-2012 Page 20
Two distinct forms of distribution systems may be
recognised viz. personal distribution systems and direct
response systems. Personal distribution systems include
channels like agencies, bancassurance and work site
marketing. Direct response distribution systems are methods
whereby the client purchases the insurance directly. This
segment, which utilizes various media such as the internet,
telemarketing, direct mail, call centers etc., is just beginning
to grow.
Traditionally, tied agency has been the primary channel for
insurance distribution in the Indian market. Whilst this
continues, there is increasing contribution by bancassurance
and an emergence of other channels such as Direct
Marketing/Tele Marketing, brokers, call centres and mall-
assurance.
Agency, as a channel of insurance distribution involves
selling insurance policies through tied agents which are
hired by insurance companies on a commission basis. Prior
to 2000, the Life Insurance Corporation of India (“LIC”)
was the only player in the Indian insurance market and it
emphasised on hiring agents to sell its insurance policies. At
that time, LIC had around 800,000 agents across the
country. Therefore it was not surprising that agency was the
core distribution channel in the insurance market, when the
market was opened up to new entrants.
With over 2,000 branches and one million agents to
distribute its policies at present, LIC’s distribution structure
is still agency dominated. It emphasises on hiring local
agents in every locality, which helps build credibility of the
agents with the customers and provides a sense of security
to the policyholders while buying the policies.
With the liberalisation of insurance sector in 2000, many
private insurers emerged in the market. This also saw an
emergence of alternative distribution channels besides
agency, such as bancassurance, tele-marketing, corporate
agents etc.
Important as it is, tied agency is expected to continue to be a
dominant channel of insurance distribution in the coming
years. It provides an opportunity to develop a good
distribution network quickly across the country, including
rural areas. Many companies are constantly increasing their
agency force in order to capture a larger market.
Even within the channel, companies are looking at
innovations to improve the low productivity of agents,
which has been a cause of concern for long. There have
been suggestions in the media that productivity levels have
been low because of companies focusing more on head
count expansion rather than improving productivity as well
as due to relatively lower levels of commissions. Some
companies are now beginning to understand the social needs
and attitudes of the consumers and are accordingly
sensitizing their agents. For instance, there is a considerable
respect for age in Indian society and a general belief that an
older person knows better. Playing on such sentiments, there
may be a case for recruiting some older people to sell
products such as pensions and annuities. To increase
penetration in rural areas, some companies have found it
beneficial to recruit more female agents in rural areas, with
whom women customers can relate, e.g. nurses, gram
sevikas, and thus target the female segment of the
population more effectively. Max New York Life has
adopted a version of this strategy by appointing gram
sahayaks to sell and service the rural customers.
Emergence of bancassurance
Bancassurance, as the name suggests, refers to sale of
insurance policies through the bank’s established branch
network. It is basically selling insurance products and
services by leveraging the large customer base of a bank and
fulfilling, both, the banking and insurance needs of the
customer at the same time.
With the entry of private players in the Indian insurance
market, bancassurance emerged as an important channel of
distribution for insurance products. Banks have emerged as
the preferred alternative distribution channel in the last 3 to
4 years. India has close to 69,000 bank branches spread over
rural and urban locations, offering a good network for
potential insurance penetration. For the private insurers,
bancassurance channel contributes about 20% to 30% of the
business volumes.
Other alternative distribution channels
Many insurers, in order to gain an edge over the others and
capture a larger market share are beginning to use
alternative distribution channels such as corporate agency,
brokers, direct mail, tele-marketing etc.
Corporate agency refers to any third party corporate/firm
licensed by the IRDA as a "corporate agent" to distribute
life insurance business. Current and potential corporate
agents range from multi-level marketing companies to
finance and Non-Banking Finance Companies (“NBFCs”),
stock brokers and so on. Most insurers have tied-up with
NBFCs to provide extra leverage on distribution.
Individual Financial Advisor (“IFA”) is another potential
channel for insurance distribution, though presently it is
virtually non-existent in India. IFAs are independent
professionals who offer unbiased advice on financial
matters. In the UK, the term IFA was coined to describe
advisors working independently for their clients, rather than
representing an insurance company. As of now life
insurance business written through IFAs is relatively low in
India, but looking at the experience of other developed
markets, this channel’s potential cannot be ruled out.
Another set of channels, which are undeveloped in India are
Direct Mail (“DM”) and Tele Marketing (“TM”). This
mainly refers to marketing of insurance policies via the mail
or over the phone.
2. REVIEW OF PRESENT LITERATURE
Considering that the Indian Insurance industry relies heavily
on the traditional agency distribution channel, the IRDA
Chairman suggested the need to develop alternative
distribution channels of independent intermediaries,
Bancassurance, Direct Marketing, the Internet, and
Telemarketing - all of which cost less and enable reaching a
wider target market.
Though various aspects of Insurance have been studied so
far, not much attention has been paid to the distribution
channel analysis of the Insurance sector companies. A brief
survey of the studies done on Insurance is presented briefly.

www.theinternationaljournal.org > RJCBS: Volume: 01, Number: 07, May-2012 Page 21
On 19th
January 1956, the government promulgated Life
Insurance (Emergency Provisions) Ordinance through which
it took temporary charge of the Life Insurance business of
154 Indian and non-Indian insurers and of 75 provident fund
societies operating in the country (Aggarwal, 1960). On
18th June 1956, the government brought the bill in the
parliament for the formation of LIC. The bill, better known
as Life Insurance Corporation of India Act, 1956, came into
force on 1st September 1956 through which the government
took over the Life Insurance business of the country. The
LIC is a monopolistic and monolithic institution, the only
exception being the postal Life Insurance and a few
compulsory schemes of Life Insurance for state employees
managed by some state governments.
Edmister (1987) opines that Insurance is a mechanism,
which involves two fundamental characteristics, viz.,
transferring and shifting risk from one individual to a group
and sharing losses on some equitable basis by all members
of the group. Insurance companies using the law of large
numbers predict what percentage of persons of a group
would die at a certain age and thus prepare tables containing
these percentages called Mortality Statistics. These
Mortality Statistics are an important aspect of portfolio
management of the company because the timing and
frequency of death affect the timing and amount of liquid
asset that the company needs.
Bhole (1999) comments, that, historically, Life Insurance
Corporation of India, and, General Insurance Corporation of
India, dominates Insurance sector. The Government set up
the Malhotra Reforms Committee in 1993 to make
recommendations for reforms and privatization in Indian
Insurance. Consequent to it, these six international
Insurance chains were allowed to enter the Indian Insurance
Market in early 1996 by tying up with India’s leading
industrial groups but this process of privatization suffered a
setback when the Insurance Regulatory Authority (IRA) Bill
was withdrawn.
Anand Prakash (2006) in his article, “Revitalization of
Rural Markets through Insurance”, has mentioned that
awareness is the most important thing as people in poor
regions are not familiar with the concept of Insurance.
Insurance companies must work around this problem as a
corporate social responsibility in countries like India where
there is no state social security system.
The traditional agency channel for doing so may not be
sustainable in the longer term in rural segment unless
significant changes are made towards poor training, lower
productivity, ineffective sales management, part-time sales
of low quality, and high agent turnover.
Shikha Sharma, MD, ICICI Prudential Life Insurance
Co. Ltd. (2009), in her article, “Life Insurance - The
Challenges Ahead”, has mentioned that Increasing the
penetration of Insurance is probably the single greatest
challenge before Life insurers today. Not only is it just over
one-fifth of the insurable population of this country actually
insured, but most of those who possess Life Insurance are
underinsured - evident from the fact that in a country of over
1 billion people, Life Insurance premium until very recently
formed only 1.8 per cent of GDP. In fact, it’s in recognition
of the huge potential of the market and the need to make
Insurance, particularly Life Insurance, available on a wider
scale, that the government opened the industry to private
players.
A large part of the success of the new entrants ran be
attributed to the government appointed Insurance
Regulatory and Development Agency (IRDA), which
developed the regulatory framework. The regulations
governing the Life and non-Life insurers are pragmatic and
forward-looking, ensuring the customer is protected and
creating an environment for thriving private sector
participation and a level playing field.
Undoubtedly, the largest beneficiaries of privatization have
been the customers, who now have an array of policies to
choose from, a number of channels to approach insurers
through, levels of customer service so far unseen in this
industry, and more information about their investments than
ever before.
3. RESEARCH METHODOLOGY
This research under consideration is an attempt to study the
customer preferences towards life insurance among other
saving alternatives, with the following objectives.
Objectives of the Study:
The study is conducted with the following objectives;
To know about concept of Insurance
To know about various distribution channels
Customer preferences towards choice of
distribution channels for buying life Insurance
plans.
Customer consideration of various parameters like
name & reputation of the company, low premiums,
rate of return, risk coverage and tax savings before
buying life Insurance plans.
Scope of Study: This study is conducted in commercial
location in New Delhi, which is Connaught place, regarded
as Central Business District (CBD) by collecting primary
data through Questionnaires.
Nature of Research: The study is of an analytical nature. It
is also a hypothesis testing research, as hypothesis are
developed as follows-
Hypothesis 1: - Before buying Life Insurance Plans
customers considers only the name and reputation of the
company.
Hypothesis 2: - Before buying Life Insurance Plans
customers considers the following parameters;
Low premiums
Rate of return
Risk covered
Tax Savings
Hypothesis 3: - Customers prefer to purchase life insurance
plans from insurance advisors.
Sample Selection : The purposive sampling has been used
for selecting offices from the universe.
Sample Size: 500
5. CONCLUSION
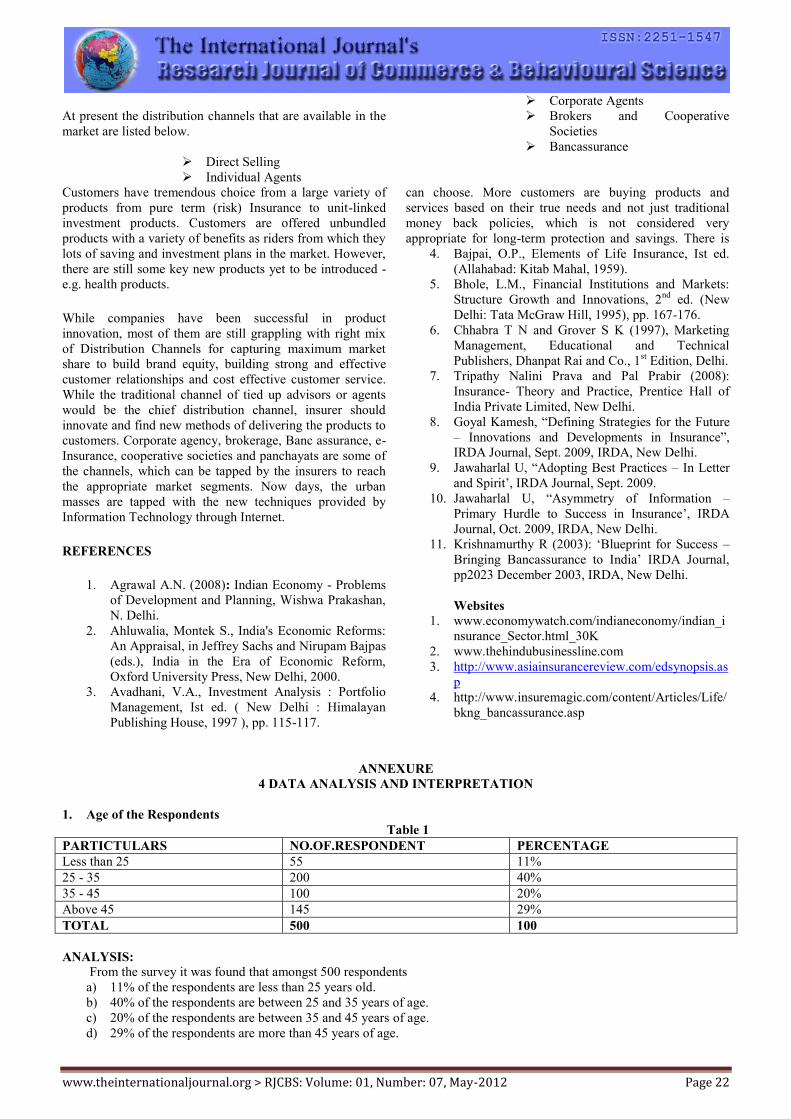
www.theinternationaljournal.org > RJCBS: Volume: 01, Number: 07, May-2012 Page 22
At present the distribution channels that are available in the
market are listed below.
Direct Selling
Individual Agents
Corporate Agents
Brokers and Cooperative
Societies
Bancassurance
Customers have tremendous choice from a large variety of
products from pure term (risk) Insurance to unit-linked
investment products. Customers are offered unbundled
products with a variety of benefits as riders from which they
can choose. More customers are buying products and
services based on their true needs and not just traditional
money back policies, which is not considered very
appropriate for long-term protection and savings. There is
lots of saving and investment plans in the market. However,
there are still some key new products yet to be introduced -
e.g. health products.
While companies have been successful in product
innovation, most of them are still grappling with right mix
of Distribution Channels for capturing maximum market
share to build brand equity, building strong and effective
customer relationships and cost effective customer service.
While the traditional channel of tied up advisors or agents
would be the chief distribution channel, insurer should
innovate and find new methods of delivering the products to
customers. Corporate agency, brokerage, Banc assurance, e-
Insurance, cooperative societies and panchayats are some of
the channels, which can be tapped by the insurers to reach
the appropriate market segments. Now days, the urban
masses are tapped with the new techniques provided by
Information Technology through Internet.
REFERENCES
1. Agrawal A.N. (2008): Indian Economy - Problems
of Development and Planning, Wishwa Prakashan,
N. Delhi.
2. Ahluwalia, Montek S., India's Economic Reforms:
An Appraisal, in Jeffrey Sachs and Nirupam Bajpas
(eds.), India in the Era of Economic Reform,
Oxford University Press, New Delhi, 2000.
3. Avadhani, V.A., Investment Analysis : Portfolio
Management, Ist ed. ( New Delhi : Himalayan
Publishing House, 1997 ), pp. 115-117.
4. Bajpai, O.P., Elements of Life Insurance, Ist ed.
(Allahabad: Kitab Mahal, 1959).
5. Bhole, L.M., Financial Institutions and Markets:
Structure Growth and Innovations, 2nd
ed. (New
Delhi: Tata McGraw Hill, 1995), pp. 167-176.
6. Chhabra T N and Grover S K (1997), Marketing
Management, Educational and Technical
Publishers, Dhanpat Rai and Co., 1st Edition, Delhi.
7. Tripathy Nalini Prava and Pal Prabir (2008):
Insurance- Theory and Practice, Prentice Hall of
India Private Limited, New Delhi.
8. Goyal Kamesh, “Defining Strategies for the Future
– Innovations and Developments in Insurance”,
IRDA Journal, Sept. 2009, IRDA, New Delhi.
9. Jawaharlal U, “Adopting Best Practices – In Letter
and Spirit’, IRDA Journal, Sept. 2009.
10. Jawaharlal U, “Asymmetry of Information –
Primary Hurdle to Success in Insurance’, IRDA
Journal, Oct. 2009, IRDA, New Delhi.
11. Krishnamurthy R (2003): ‘Blueprint for Success –
Bringing Bancassurance to India’ IRDA Journal,
pp2023 December 2003, IRDA, New Delhi.
Websites
1. www.economywatch.com/indianeconomy/indian_i
nsurance_Sector.html_30K
2. www.thehindubusinessline.com
3. http://www.asiainsurancereview.com/edsynopsis.as
p
4. http://www.insuremagic.com/content/Articles/Life/
bkng_bancassurance.asp
ANNEXURE
4 DATA ANALYSIS AND INTERPRETATION
1. Age of the Respondents
Table 1
PARTICTULARS NO.OF.RESPONDENT PERCENTAGE
Less than 25 55 11%
25 - 35 200 40%
35 - 45 100 20%
Above 45 145 29%
TOTAL 500 100
ANALYSIS:
From the survey it was found that amongst 500 respondents
a) 11% of the respondents are less than 25 years old.
b) 40% of the respondents are between 25 and 35 years of age.
c) 20% of the respondents are between 35 and 45 years of age.
d) 29% of the respondents are more than 45 years of age.

www.theinternationaljournal.org > RJCBS: Volume: 01, Number: 07, May-2012 Page 23
2) Occupation of the Respondents
Table 2
PARTICULARS NO.OF.RESPONDENT PERCENTAGE
Business man 170 34%
Professionals 90 18%
Job holders 185 37%
Others 55 11%
TOTAL 500 100%
ANALYSIS:
From the survey it was found that amongst 500 respondents
a) 34% of the respondents are businessmen.
b) 18% of the respondents are professionals.
c) 37% of the respondents are jobholders.
d) 11% of the respondents are background.
3) Average Annual Income of Respondents
Table 3
PARTICULARS NO.OF.RESPONDENT PERCENTAGE
Up to 1 lakh 165 33%
1 lakh - 3 lakh 215 43%
3 lakh - 5 lakh 100 20%
5 lakh & above 20 4%
TOTAL 500 100%
ANALYSIS:
From the survey it was found that amongst 500 respondents
a) 33% of the respondents have an average annual income up to 1 lakh
b) 43% of the respondents have an average annual income from 1 lakh to 3 lakh
c) 20% of the respondents have an average annual income from 3 lakh to 5 lakh
d) 4% of the respondents have an average annual income above 5 lakh
4) Percentage of Respondents Having Life Insurance Policy.
Table 4
PARTICULARS NO.OF.RESPONDENT PERCENTAGE
Yes 280 56%
No 220 44%
TOTAL 500 100%
ANALYSIS:
From the survey it was found that amongst 500 respondents
Only 56% have taken life insurance policy and out of these 56% means 280 respondents –
5) Percentage of respondent’s towards decision influencing factors to purchase Insurance plan:
Give numbers 1 to 5: While;
a. For Strongly Agree
b. For Agree
c. Neutral
d. For Disagree
e. For Strongly Disagree
Table 5
PARTICUALRS
NO.OF.RESPONDENT
Numbers
1 2 3 4 5
Total
Name and reputation of
the company 280 - - - - 280
Low premiums - 28 22 36 194 280
Rate of return - 25 185 28 42 280
Risk covered - 180 31 38 31 280
Tax Savings - 47 42 178 13 280
TOTAL 280 280 280 280 280

www.theinternationaljournal.org > RJCBS: Volume: 01, Number: 07, May-2012 Page 24
a) Response For Name And Reputation Of Company As A Particular
ANALYSIS:
From the survey it was found that amongst 280 respondents
100% tick for name and reputation of the company as strongly agree.
b) Response For Low Premiums As A Particular
ANALYSIS:
10% opted for Low premiums as agree.
8% opted for Low premiums as neutral.
13% opted for Low premiums as disagree.
69% opted for Low premiums as strongly disagree.
c) Response For Rate Of Return As A Particular
ANALYSIS
9% opted for Rate of return as agree.
66% opted for Rate of return as neutral.
10% opted for Rate of return as disagree.
15% opted for Rate of return as strongly disagrees.
d) Response For Risk Covered As A Particular
100%
0% 0% 0% 0% Name and reputation of the company
Low Premiums
Rate of Return
Risk covered
Tax Savings
0%
10%
8%
12%
70%
strongly agree Agree
Neutral Disagree
Strongly Disagree
0%
9%
66%
10%
15%
0%
strongly agree Agree
Neutral Disagree
Strongly Disagree
0%
64%
11%
14% 11%
strongly agree agree
Neutral Disagree
strongly Disagree
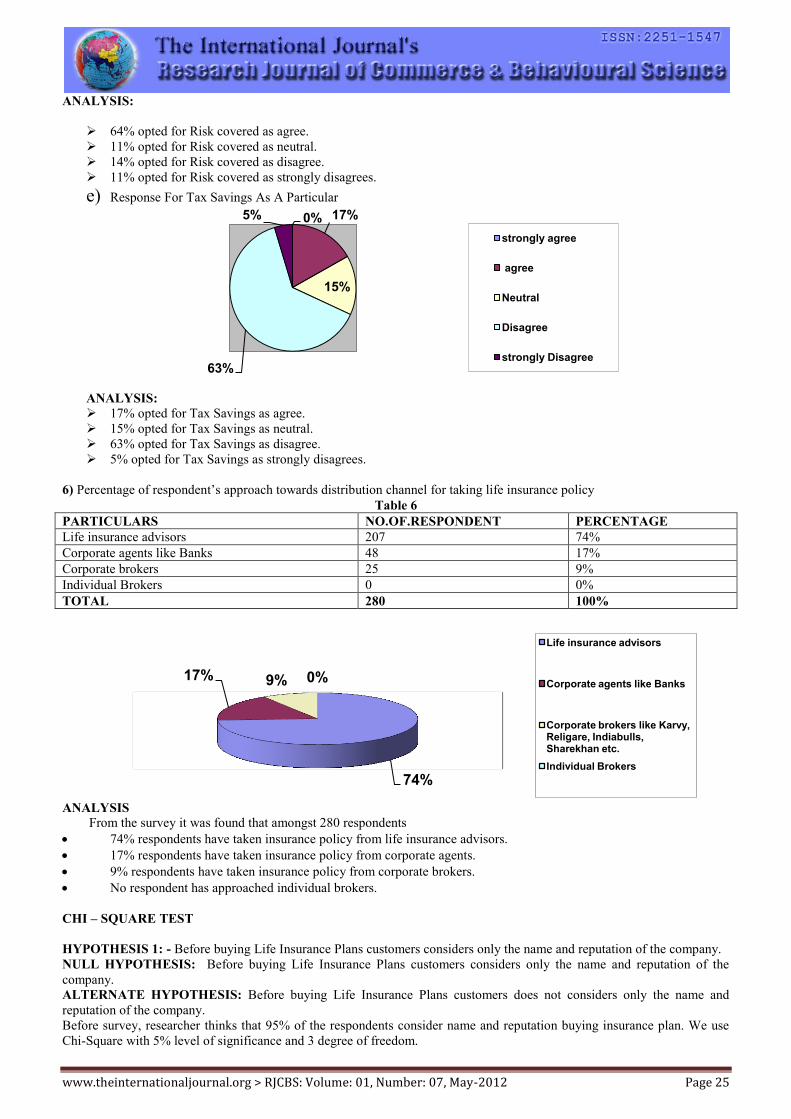
www.theinternationaljournal.org > RJCBS: Volume: 01, Number: 07, May-2012 Page 25
ANALYSIS:
64% opted for Risk covered as agree.
11% opted for Risk covered as neutral.
14% opted for Risk covered as disagree.
11% opted for Risk covered as strongly disagrees.
e) Response For Tax Savings As A Particular
ANALYSIS:
17% opted for Tax Savings as agree.
15% opted for Tax Savings as neutral.
63% opted for Tax Savings as disagree.
5% opted for Tax Savings as strongly disagrees.
6) Percentage of respondent’s approach towards distribution channel for taking life insurance policy
Table 6
PARTICULARS NO.OF.RESPONDENT PERCENTAGE
Life insurance advisors 207 74%
Corporate agents like Banks 48 17%
Corporate brokers 25 9%
Individual Brokers 0 0%
TOTAL 280 100%
ANALYSIS
From the survey it was found that amongst 280 respondents
74% respondents have taken insurance policy from life insurance advisors.
17% respondents have taken insurance policy from corporate agents.
9% respondents have taken insurance policy from corporate brokers.
No respondent has approached individual brokers.
CHI – SQUARE TEST
HYPOTHESIS 1: - Before buying Life Insurance Plans customers considers only the name and reputation of the company.
NULL HYPOTHESIS: Before buying Life Insurance Plans customers considers only the name and reputation of the
company.
ALTERNATE HYPOTHESIS: Before buying Life Insurance Plans customers does not considers only the name and
reputation of the company.
Before survey, researcher thinks that 95% of the respondents consider name and reputation buying insurance plan. We use
Chi-Square with 5% level of significance and 3 degree of freedom.
0% 17%
15%
63%
5%
strongly agree
agree
Neutral
Disagree
strongly Disagree
74%
17% 9% 0%
Life insurance advisors
Corporate agents like Banks
Corporate brokers like Karvy, Religare, Indiabulls, Sharekhan etc.
Individual Brokers

www.theinternationaljournal.org > RJCBS: Volume: 01, Number: 07, May-2012 Page 26
Observation Expectancy O-E (O-E) 2 (O-E)2/E
100 95 5 25 0.26
Degree of freedom =1
Level of Significance = 5%
Result:-
At 5% level of significance and 1 degree of freedom our calculated value of Chi- Square is 0.26. But Table value of Chi –
Square is 3.84 at same degree of freedom. So, our null hypothesis is accepted. It Means customers consider only company
name and reputation before purchasing Policy.
HYPOTHESIS 2: - Before buying Life Insurance Plans customers considers the following parameters;
Low premiums
Rate of return
Risk covered
Tax Savings
Null Hypothesis
Before buying Life Insurance Plans customers considers the following parameters;
Low premiums
Rate of return
Risk covered
Tax Savings
Alternate Hypothesis
Before buying Life Insurance Plans customers does not consider the following parameters;
Low premiums
Rate of return
Risk covered
Tax Savings
Respondents Preference Towards Above Listed Parameters (Observed)
Table 7
PARTICUALRS
NO.OF.RESPONDENT
Numbers
1 2 3 4 Total
Low premiums 28 22 36 194 280
Rate of return 25 185 28 42 280
Risk covered 180 31 38 31 280
Tax Savings 47 42 178 13 280
TOTAL 280 280 280 280 1120
Table 8
Expectancy Table
PARTICUALRS
NO.OF.RESPONDENT
Numbers
1 2 3 4 Total
Low premiums 70 70 70 70 280
Rate of return 70 70 70 70 280
Risk covered 70 70 70 70 280
Tax Savings 70 70 70 70 280
TOTAL 280 280 280 280 1120
Note: - Formula for Calculation: Row Total X Column Total/ Grand Total
Table 9
Calculation Table of Chi Square Table
Particulars Obs. (O) Exp. (E) O-E (O-E)2 (O-E)2/E
Low Premium (1) 28 70 -42 1764 25.2
Low Premium (2) 22 70 -48 2304 32.91
Low Premium (3) 36 70 -34 1156 16.5
Low Premium (4) 194 70 124 15376 219.66

www.theinternationaljournal.org > RJCBS: Volume: 01, Number: 07, May-2012 Page 27
Rate of Return (1) 25 70 -45 2025 28.93
Rate of Return (2) 185 70 115 13225 188.93
Rate of Return (3) 28 70 -42 1764 25.2
Rate of Return (4) 42 70 -28 784 11.2
Risk Covered (1) 180 70 110 12100 172.86
Risk Covered (2) 31 70 -39 1521 21.73
Risk Covered (3) 38 70 -32 1024 14.63
Risk Covered (4) 31 70 -39 1521 21.73
Tax Saving (1) 47 70 -23 529 7.56
Tax Saving (2) 42 70 -28 784 11.2
Tax Saving (3) 178 70 108 11664 166.63
Tax Saving (4) 13 70 -57 3249 46.41
Total X2 =1011.28
Note:- Critical Value of Chi-Square at 10% Significance Level and 9 Degree of Freedom = 21.7
Degree of Freedom (r-1) (c-1) = (4-1) (4-1) = 9
Test of Significance Level = 10%
Result: At 10% Level of Significance and 9 degree of freedom, we found that the calculated value of chi-square (1011.28)
is much higher than table value of chi-square (21.7). It means, before buying Life Insurance Plans customers does not
consider the following parameters;
Low premiums
Rate of return
Risk covered
Tax Savings
Hence, Our Null Hypothesis Rejected.
HYPOTHESIS STATED: 3
“Customer prefers to purchase life insurance plans from insurance advisors” This statement is expected to be believed 85%,
and observed as 74%.
Null Hypothesis: The difference observed is significant, and the difference is due to the Sampling.
Alternate Hypothesis: The difference observed is insignificant. So, the Observed percentage should be the actual value for
Customer prefers to purchase life insurance plans from insurance advisors.
CHI – SQUARE TEST
Customer prefers to purchase life insurance plans from insurance advisors
(% AGE)
(Expected) (Observed) [(O-E) ^2]/E
85 74 1.42
DEGREE OF FREEDOM, df = (n-1) = 1
CRITICAL VALUE = 3.84
(Value of CHI-SQUARE for 5% level for one degree of freedom is 3.84)
HERE CRITCAL VALUE IS GREATER THAN THE CALCULATED VALUE.
ACCEPT THE NULL HYPOTHESIS, i.e.
Customer prefers to purchase life insurance plans from insurance advisors”. This statement is expected to be believed 85%,
and observed as 74 %. And the difference is due to the Sampling.
***