table of contents - tesda setg highlights.pdf · table of contents i. background 1 ... philippine...
TRANSCRIPT


Table of Contents
I. Background 1
II. Highlights of the Results
1. Profile of 2013 TVET Graduates 3
2. Competency Assessment and Certification of TVET Graduates 7
3. Labor Force Participation of TVET Graduates 9
3.1 Length of Job Search 12
4. Employment of TVET Graduates 12
4.1 Employment of Certified TVET Graduates 18
4.2 Employment of Graduates of Scholarship Programs 19
4.3 Employment of TVET Graduates of TESDA Technology Institutions
21
4.4 Skills Utilization and Employment Facilitation 22
III. Conclusions and Recommendations 24


1
I. BACKGROUND
TESDA, the lead government agency in Technical Vocational and Education and
Training (TVET) in the country, is mandated to provide relevant, accessible, high quality and
efficient technical vocational education and skills trainings in support of the development of
high quality Filipino middle level manpower responsive to and in accordance with the
Philippine development goals and priorities as embodied in Section 2 of the TESDA Act of
1994. In pursuit of its mandate, TESDA enables the Filipino skilled workforce more
employable, productive and flexible to the changing requirements of industry and the labor
markets, both domestic and overseas.
Government wants nothing more than for unemployment rate to go down. In 2013,
the annual employment rate was 92.7%; in October 2014, it reached 94.0%; and, in January
2015, preliminary results from the Labor Force Survey (LFS) show 93.4%.
This encouraging scenario and the rising demands of the competitive labor market
raised several TVET issues and concerns. Are the graduates provided with quality
education and training in preparation for their employment? Do the graduates possess the
skills and competencies that the employers require? Are the program interventions and other
support initiatives able to enhance the employability of the graduates?
TESDA has institutionalized the conduct of study on the employability of TVET
graduates to regularly monitor and assess the efficiency and effectiveness of TVET provision
based on the employment outcomes of its graduates. The study also serves as feedback
mechanism on the status of implementation of major TVET policies and programs such as
program registration, competency assessment and certification, and scholarships.
The 2014 Study on the Employability of TVET Graduates covered 2013 TVET
graduates in all training delivery modes namely: institution-based, enterprise-based and
community-based.
Generally, the study aims to assess the relevance and effectiveness of TVET
Programs. It intends to generate national and regional data and information on the
employability of TVET graduates and employment-related indicators. The results of the
study will serve as a tool in determining policy recommendations that will guide TESDA in its
planning and policy making as Authority.
Specifically, the study aims to generate national data/information in order to:
Estimate the employment rates and skills utilization of the TVET graduates
Estimate the length of job search in finding employment
Identify employment facility availed in finding employment
Analyze types of employment and TVET qualifications that have better chances
of employment for the graduates
Determine income levels of employed graduates
Identify the incentives given by the employers to the employed certified
graduates
Identify reasons for unemployment and for not joining the labor force

2
The list of 2013 TVET graduates of regular and scholarship programs from MIS 03-02
submitted by the Regional/Provincial Offices to the Central Office served as the sampling
frame from where the sample respondents were selected.
Stratified random sampling was adopted in this 2014 study, with the regions as the
identified strata. Systematic random sampling was applied in the selection of sample
respondents per stratum. A confidence level of 95% and 0.05 margin of error were adopted
in determining the sample size. Clearance and approval from the Philippine Statistical
Authority (PSA) was obtained before the conduct of survey.
A total of 15,709 TVET graduates were surveyed out of the total of 1,006,983 TVET
graduates in 2013. The graduates of TWSP and TTIs are integral part of the study.
The survey was done through personal interviews of the sampled graduates or key
informants using structured questionnaire.

3
II. HIGHLIGHTS OF THE RESULTS
1. Profile of 2013 TVET Graduates
A total of 1,006,983 TVET graduates in 2013 were covered by the study.
NCR posted the highest number of TVET graduates with 194,555 (19.3%); followed
by Region IV-A and Region III, with 166,530 (16.5%) and 128,645 (12.8%),
respectively. These three regions comprised 48.6% (489,730) of the total graduates.
CARAGA and ARMM had the lowest percentage share with 1.1% each (Table 1).
Table 1. TVET Graduates by Region, Philippines: 2013
Region Female Male Total % Share
NCR 111,332 83,223 194,555 19.3
CAR 15,710 15,664 31,374 3.1
Region 1 31,230 40,500 71,730 7.1
Region 2 5,671 7,375 13,046 1.3
Region 3 66,091 62,554 128,645 12.8
Region 4A 81,707 84,823 166,530 16.5
Region 4B 12,765 15,557 28,322 2.8
Region 5 12,672 19,480 32,152 3.2
Region 6 13,144 8,584 21,728 2.2
Region 7 33,651 47,051 80,702 8.0
Region 8 12,832 15,180 28,012 2.8
Region 9 23,076 23,552 46,628 4.6
Region 10 22,296 28,824 51,120 5.1
Region 11 27,448 29,485 56,933 5.7
Region 12 12,453 20,248 32,701 3.2
CARAGA 4,794 6,569 11,363 1.1
ARMM 5,110 6,332 11,442 1.1
Total 491,981 515,002 1,006,983 100 Note: Numbers and totals do not add up due to rounding.
Male TVET graduates accounted for
51.1% (515,002) while their female
counterparts composed 48.9% (491,891)
(Figure 1).
The institution-based mode of training
delivery consistently produced the majority
of TVET graduates at 64.9% (653,358).
Across all regions, only Region VI had the
community-based mode of delivery
outnumbering the institution-based with
16,410 (75.5%) and 4,394 (20.2%),
respectively.

4
Graduates of enterprise-based training programs remained the lowest among the
three delivery modes, estimated at 50,903 (5.1%). Given the demographic and the
economic situation of ARMM, no graduates from enterprise-based training program
were noted. (Table 2)
Table 2. TVET Graduates By Region, By Delivery Mode of Training, Philippines: 2013
Region
Delivery Mode of Training
Total Institution-based
% Enterprise
-based %
Community-based
%
NCR 130,727 67.2 3,776 1.9 60,052 30.9 194,555
CAR 20,252 64.5 1,167 3.7 9,955 31.7 31,374
Region 1 46,818 65.3 4,177 5.8 20,735 28.9 71,730
Region 2 8,198 62.8 778 6.0 4,070 31.2 13,046
Region 3 99,357 77.2 8,429 6.6 20,859 16.2 128,645
Region 4A 100,392 60.3 17,047 10.2 49,091 29.5 166,530
Region 4B 18,417 65.0 28 0.1 9,876 34.9 28,322
Region 5 25,452 79.2 276 0.9 6,424 20.0 32,152
Region 6 4,394 20.2 924 4.3 16,410 75.5 21,728
Region 7 54,550 67.6 5,616 7.0 20,536 25.4 80,702
Region 8 22,455 80.2 638 2.3 4,918 17.6 28,012
Region 9 21,424 45.9 5,755 12.3 19,449 41.7 46,628
Region 10 29,425 57.6 1,511 3.0 20,184 39.5 51,120
Region 11 37,457 65.8 669 1.2 18,807 33.0 56,933
Region 12 21,380 65.4 86 0.3 11,234 34.4 32,701
CARAGA 6,497 57.2 25 0.2 4,842 42.6 11,363
ARMM 6,163 53.9 5,279 46.1 11,442
Total 653,358 64.9 50,903 5.1 302,722 30.1 1,006,983
Out of the 296,298 graduates of scholarship programs, 52% (154,126) were TWSP
beneficiaries. This is expected since more budget was allocated for TWSP.
Eight percent (8% or 24,726) were PESFA scholars and the remaining 40% (117,446)
were products of other scholarship programs. Other scholarship programs include,
Cash for Training Program (C4TP), PDAF, LGUs scholarships, among others.
Male graduates of scholarships comprised 53.8% (159,523) (Table 3).
Table 3. TVET Graduates, By Type of Scholarship, By Sex, Philippines: 2013
Type of Scholarship Female % Male % Total
TWSP 70,687 45.9 83,439 54.1 154,126
PESFA 12,046 48.7 12,680 51.3 24,726
Others 54,042 46.0 63,404 54.0 117,446
Total 136,776 46.2 159,523 53.8 296,298

5
Consistent with the previous studies, most of the 2013 TVET graduates were high
school graduates (554,946 or 55%) and belong to the 15-24 age bracket (592,855 or
58.9%).
A sizable number of TVET graduates were college undergraduates and college
graduates and beyond with 13.8% and 16%, respectively.
There were few TVET graduates who were 14 years old and below (3,422 or 0.3%).
These graduates were not yet part of the labor force.
Females (with college degree) who took TVET programs outnumbered their male
counterparts (Table 4).
Table 4. TVET Graduates, by Sex, by Educational Attainment, by Age Group, Philippines: 2013
Indicator Female % Male % Total %
Highest Grade Completed
College Graduate and beyond 79,943 16.2 59,138 11.5 139,082 13.8
College Undergraduate 81,883 16.6 79,545 15.4 161,429 16.0
Tech-Voc graduate 14,842 3.0 20,521 4.0 35,363 3.5
Tech-Voc undergraduate 8,569 1.7 11,691 2.3 20,259 2.0
High school graduate 254,107 51.6 300,839 58.4 554,946 55.1
High school undergraduate 37,036 7.5 31,317 6.1 68,354 6.8
Elementary graduate 10,831 2.2 7,875 1.5 18,706 1.9
Elementary undergraduate 4,438 0.9 3,988 0.8 8,426 0.8
No grade completed 331 0.1 87 0.02 418 0.04
Total 491,981 100.0 515,002 100 1,006,983 100
Age Group
15 - 24 268,953 54.7 323,902 62.9 592,855 58.9
25 - 34 112,224 22.8 116,736 22.7 228,960 22.7
35 - 44 59,469 12.1 45,043 8.7 104,512 10.4
45 - 54 30,734 6.2 18,503 3.6 49,237 4.9
55 - 64 14,774 3.0 7,444 1.4 22,218 2.2
65 and above 3,739 0.8 2,041 0.4 5,780 0.6
Not indicated 2,088 0.4 1,334 0.3 3,422 0.3
Total 491,981 100 515,002 100 1,006,983 100
Figure 2 shows that graduates of
WTR programs accounted for 65%
(654,323) while 16.1% (161,850) were
graduates of NTR programs. The
remaining 18.9% (190,809) were
graduates of non-registered but
monitored programs implemented by
other government agencies and non-
government organizations (NGOs).

6
Graduates under the tourism sector comprised the largest share of 23.4% (235,994)
of the total.
They were followed by those from the sectors of health, social and other community
development services, electronics, and information and communication technology
with the same percentage distribution of 12% each (Table 5).
Table 5. TVET Graduates by Sector, Philippines: 2013
Sector Female Male Total %
Distribution
Agriculture and Fishery 15,448 18,187 33,634 3.3
Automotive and Land Transportation 9,012 71,654 80,666 8.0
Construction 6,159 63,405 69,564 6.9
Decorative Crafts 5,362 431 5,793 0.6
Electronics 52,066 68,815 120,881 12.0
Entrepreneurship 12,870 11,095 23,965 2.4
Footwear 129 117 247 0.04
Furniture And Fixtures 264 189 453 0.02
Garments 15,418 3,622 19,039 1.9
Health, Social and Other Community Development Services
95,994 26,535 122,529 12.2
Heating, Ventilation, Air conditioning and Refrigeration (HVAC)
425 7,476 7,902 0.8
Information and Communication Technology
66,950 53,743 120,693 12.0
Language 7,677 8,237 15,914 1.6
Livelihood 24,381 6,836 31,217 3.1
Maritime 231 4,656 4,887 0.5
Metals and Engineering 4,860 62,003 66,863 6.6
Processed Food and Beverages 22,764 9,505 32,269 3.2
Tourism 146,250 89,744 235,994 23.4
TVET 3,013 6,014 9,027 0.9
Visual Arts 405 405 0.04
Wholesale and Retail Trading 2,708 2,334 5,041 0.5
Total 491,981 515,002 1,006,983 100
More than half (53.9% or 542,527) of the total graduates indicated employment/getting
a job as their reason for taking up TVET programs. 29.7% (299,074) mentioned skills
upgrading/enhancement while only 0.1% (528) wanted to increase their income.
(Table 6).

7
Table 6. Reasons of the TVET Graduates for Taking up TVET Programs, Philippines: 2013
Reasons for Taking up the Program TVET Graduates %
Share Female Male Total
For employment/to get job 243,977 298,550 542,527 53.9
For promotion/ Increase in income 31,246 19,509 50,755 5.0
For skills upgrading/enhancement 152,019 147,055 299,074 29.7
Nothing to do 4,772 3,190 7,962 0.8
Personal use/interest/hobby 40,859 29,210 70,070 7.0
To increase income 528 528 0.1
TVET qualification is popular 11,610 10,539 22,149 2.2
Others 6,970 6,947 13,917 1.4
Total 491,981 515,002 1,006,983 100
Majority of the TVET graduates
(71%) were not employed before
training (Figure 3) and did not take
the YP4SC (Table 7). This implies
that TESDA has to review or make
an assessment on the use and
merits of YP4SC.
Table 7. Youth Profiling for Starring Careers (YP4SC), Philippines: 2013
Type of Scholarship
Took YP4SC Did not Take YP4SC Total Graduates Female Male Total Female Male Total
TWSP 37,275 47,169 84,444 33,412 36,270 69,682 154,126
PESFA 7,022 9,302 16,323 5,025 3,378 8,403 24,726
Other Scholarship Program
20,665 30,786 51,451 33,377 32,618 65,996 117,446
Non-Scholars 108,686 125,148 233,834 246,519 230,331 476,850 710,685
Total 173,648 212,404 386,052 318,333 302,597 620,931 1,006,983
2. Competency Assessment and Certification of TVET Graduates
As reflected in Figure 2 on TVET Graduates by Type of Program Registration,
graduates of WTR programs accounted for 65% (654,323). They are required to
undergo the competency assessment.
However, despite the mandatory assessment policy of TESDA, 27.5% (or 173,965) of
the TVET graduates of WTR programs did not take the competency assessment.

8
The top 3 reasons cited by the respondents for not taking competency assessment
were: No money/financial constraints (18.3% or 32,877) followed by no time/working/
schooling/abroad (18.1% or 32,499) and non-availability of assessment tools/test
package (14.4% or 25,961). The first reason indicates that TESDA needs to review
the National TVET Competency Assessment and Certification (NATCAC) guidelines
and consider those graduates with financial limitations (Table 8).
Table 8. Reasons of TVET Graduates of WTR Programs for Not Taking Competency Assessment, Philippines: 2013
Reasons Female Male Total % Share
Assessment tools/test package not available 13,201 12,760 25,961 14.4
Assessment officer/assessor not available 322 440 762 0.4
No assessment officer/assessor in the area 382 1,745 2,127 1.2
Assessment center not available/not accessible 1,265 640 1,906 1.1
No assessment center in the area 885 733 1,618 0.9
Assessment not mandatory 12,367 10,374 22,741 12.6
Skills and knowledge learned not sufficient 4,093 4,656 8,748 4.9
No money/financial constraints 16,162 16,714 32,877 18.3
No time/working/schooling/abroad 15,489 17,010 32,499 18.1
Schedule not known 6,947 6,734 13,682 7.6
Others 6,011 4,877 10,888 6.1
Not indicated 12,267 13,889 26,156 14.5
Total 89,392 90,573 179,965 100
A total of 474,359 (72.5%) TVET graduates of WTR Programs took the competency
assessment with a certification rate of 95.2%.
Graduates from all the sectors exhibited high certification rates. (Table 9)
Table 9. Certification Rates of TVET Graduates of WTR Programs, By Sector, Philippines: 2013
Sector Took
Assessment
Result Certification Rate Passed Failed
Agriculture and Fishery 7,065 6,548 517 92.7
Automotive and Land Transportation 50,312 47,338 2,974 94.1
Construction 40,627 38,544 2,083 94.9
Electronics 72,541 67,006 5,535 92.4
Garments 7,402 6,866 536 92.8
Health, Social and Other Community Development Services
50,059 47,807 2,252 95.5
Heating, Ventilation, Air Conditioning and Refrigeration (H-VAC)
5,227 5,015 212 96.0
Information and Communication Technology
16,035 14,803 1,232 92.3
Maritime 1,317 1,317 100
Metals and Engineering 53,339 51,419 1,920 96.4

9
Sector Took
Assessment
Result Certification Rate Passed Failed
Processed Food and Beverages 7,446 7,446 100
Tourism 156,493 150,869 5,624 96.4
TVET 6,261 6,165 97 98.5
Visual Arts 131 131 100
Wholesale and Retail Trading 104 104 100
Total 474,359 451,379 22,980 95.2
3. Labor Force Participation of TVET Graduates
The labor force participation rate of 2013 TVET Graduates was 69% (694,335),
indicating that 7 out of every 10 TVET graduates have joined the labor force after
finishing the training program. This is higher than the national Labor Force
Participation Rate (LFPR) of 63.7% of the Labor Force Survey (LFS) as of January
2015.
By age group, TVET graduates between 25 - 34 and 35 - 44 registered the highest
labor force participation rates with 81.5% and 79.5%, respectively.
Male TVET graduates were more active than their female counterparts with 72.4%
and 65.3%, respectively.
By highest grade completed, TVET graduates with college education registered the
highest at 82.7%.
The high school undergraduates posted the lowest at 43.5%. (Table 10)
Table 10. Labor Force Participation Rate of TVET Graduates, By Sex, By Age Group, By Highest Grade Completed, Philippines: 2013
Indicator Not in the
Labor Force In the Labor
Force Total
Graduates Participation
Rate
Sex
Female 170,518 321,463 491,981 65.3
Male 142,131 372,871 515,002 72.4
Total 312,648 694,335 1,006,983 69.0
Age Group
15 – 24 220,701 372,154 592,855 62.8
25 – 34 42,379 186,580 228,960 81.5
35 – 44 21,428 83,084 104,512 79.5
45 – 54 14,598 34,639 49,237 70.4
55 – 64 7,625 14,592 22,218 65.7
65 and above 2,527 3,253 5,780 56.3
Not indicated 3,390 32 3,422 0.9
Total 312,648 694,335 1,006,983 69.0

10
Indicator Not in the
Labor Force In the Labor
Force Total
Graduates Participation
Rate
Highest Grade Completed
College Graduate and beyond
24,044 115,038 139,082 82.7
College Undergraduate 53,503 107,926 161,429 66.9
Tech-Voc graduate 8,465 26,898 35,363 76.1
Tech-Voc undergraduate 5,134 15,126 20,259 74.7
High school graduate 172,318 382,628 554,946 68.9
High school undergraduate 38,589 29,765 68,354 43.5
Elementary graduate 6,580 12,126 18,706 64.8
Elementary undergraduate 3,850 4,576 8,426 54.3
No grade completed 166 252 418 60.2
Total 312,648 694,335 1,006,983 69.0
In terms of delivery mode, graduates of enterprise-based training programs registered
the highest LPFR over those from the two delivery modes. They were more active to
join the labor force and look for employment since they were exposed to the actual
operations of the industries. (Table 11)
Table 11. Labor Force Participation Rate of TVET Graduates,
by Training Delivery Mode, Philippines: 2013
Training Delivery Mode Not in the
Labor Force In the Labor
Force Total
Graduates LFPR
Institution-based 192,242 461,116 653,358 70.6
Enterprise-based 8,578 42,325 50,903 83.1
Community-based 111,828 190,893 302,722 63.1
Total 312,648 694,335 1,006,983 69.0
Those in Region XI registered the highest labor force participation rate with 78%,
followed by Regions VI and III, with 75% and 73.6%, respectively. Those in ARMM
posted the lowest at 52.2%. (Table 12).
Table 12. Labor Force Participation Rate of TVET Graduates, by Region,
Philippines: 2013
Region Not in the
Labor Force In the Labor
Force Total
Graduates LFPR
NCR 56,591 137,964 194,555 70.9
CAR 11,926 19,448 31,374 62.0
Region 1 22,658 49,072 71,730 68.4
Region 2 3,931 9,115 13,046 69.9
Region 3 33,939 94,706 128,645 73.6
Region 4A 57,262 109,268 166,530 65.6
Region 4B 8,804 19,518 28,322 68.9

11
Region Not in the
Labor Force In the Labor
Force Total
Graduates LFPR
Region 5 10,225 21,927 32,152 68.2
Region 6 5,424 16,304 21,728 75.0
Region 7 26,499 54,203 80,702 67.2
Region 8 9,314 18,698 28,012 66.7
Region 9 18,183 28,445 46,628 61.0
Region 10 15,929 35,191 51,120 68.8
Region 11 12,532 44,401 56,933 78.0
Region 12 9,289 23,412 32,701 71.6
CARAGA 4,668 6,695 11,363 58.9
ARMM 5,472 5,970 11,442 52.2
Total 312,648 694,335 1,006,983 69.0
Out of 333,246 TVET graduates who were not looking for work during the survey, 50%
(166,716) were students. Those with household and family duties registered 23% or
76,536 (Table 13).
There were more females (53.5% or 178,188) who did not look for work than their
male counterparts (46.5% or 155,058).
Table 13. Reasons of TVET Graduates for Not Looking for Work, Philippines: 2013
Reasons Sex
Female Male Total %
Distribution
Tired/no work available 5,584 7,919 13,503 4.1
Awaiting results of previous application 9,816 14,027 23,842 7.2
Temporary illness/disability 3,190 3,391 6,582 2.0
Bad weather 486 304 790 0.2
Waiting for rehire/job recall 5,142 6,697 11,839 3.6
Too young/old retired/permanent disability 7,302 7,498 14,800 4.4
Household/family duties 54,900 21,635 76,536 23.0
Schooling 80,641 86,075 166,716 50.0
Others 6,802 3,865 10,668 3.2
Not indicated 4,324 3,647 7,971 2.4
Total 178,188 155,058 333,246 100

12
3.1 Length of Job Search
Majority of the TVET graduates (42.7.4% or 124,533) found their first job between 1-3
months after they finished the training program. More than twenty-two
percent (22.7%) found jobs in less than a month while 13.2% found employment after
3 to 6 months of job search. Only 10.6% had a job search of more than 6 months
(Table 14).
Table 14. Length of Job Search after the Training, Philippines: 2013
Length of Job Search Employed TVET Graduates
% Share Female Male Total
Less than 1 Month 31,793 34,516 66,309 22.7
1 - 3 Months 57,150 67,383 124,533 42.7
4 - 6 Months 16,561 21,859 38,419 13.2
More than 6 months 14,569 16,472 31,041 10.6
Not indicated 16,013 15,285 31,298 10.7
Total 136,086 155,514 291,600 100
4. Employment of TVET Graduates at Time of Survey
The employment rate for the 2013 TVET graduates during the survey was estimated
at 65.4%.
Table 15 provides comparison of the employment rates over the 5-year period. No
significant increase was registered from 2010, 2012 and 2013 TVET graduates. It
should be noted that the 2010 TVET graduates were surveyed only in 2013, which
gave them longer lead time in searching for jobs; thus, they had higher employment
rate compared to the 2012 and 2013 graduates.
Table 15. Employment Rate of TVET Graduates from 2008-2014 Studies,
Philippines: 2013
Year of Study Coverage ER
2008 2006 TVET Graduates 55.1
2011 2009 TVET Graduates 60.9
2012 2011 TVET Graduates 62.0
2013 2010 TVET Graduates 65.9
2012 TVET Graduates 65.3
2014 2013 TVET Graduates 65.4
Those in Region II posted the highest employment rate of 85.3%, followed by those in
Region 6, with 79.7%.
Consistent with previous studies, ARMM again registered the lowest employment rate
of 31.8%. This can be attributed to the peace and order situation and lack of
employment opportunities in the region.

13
Of the total employed graduates, 98,245 (21.6%) came from NCR; 67,455 (14.9%),
from Region IV-A; and, 61,635 (13.6%), from Region III. These are the locations of
many business enterprises in the country (Table 16).
Table 16. Employment Rate of TVET Graduates, By Region, Philippines: 2013
Region Not in the
Labor Force
In the Labor Force Total TVET Graduates
ER Not Employed
Employed Total
NCR 56,591 39,719 98,245 137,964 194,555 71.2
CAR 11,926 5,527 13,921 19,448 31,374 71.6
Region 1 22,658 13,466 35,607 49,072 71,730 72.6
Region 2 3,931 1,343 7,772 9,115 13,046 85.3
Region 3 33,939 33,071 61,635 94,706 128,645 65.1
Region 4A 57,262 41,814 67,455 109,268 166,530 61.7
Region 4B 8,804 5,822 13,696 19,518 28,322 70.2
Region 5 10,225 7,841 14,086 21,927 32,152 64.2
Region 6 5,424 3,313 12,991 16,304 21,728 79.7
Region 7 26,499 28,403 25,800 54,203 80,702 47.6
Region 8 9,314 6,693 12,004 18,698 28,012 64.2
Region 9 18,183 13,225 15,220 28,445 46,628 53.5
Region 10 15,929 11,294 23,897 35,191 51,120 67.9
Region 11 12,532 15,196 29,206 44,401 56,933 65.8
Region 12 9,289 6,881 16,530 23,412 32,701 70.6
CARAGA 4,668 2,560 4,134 6,695 11,363 61.8
ARMM 5,472 4,074 1,896 5,970 11,442 31.8
Total 312,648 240,239 454,095 694,335 1,006,983 65.4
There were more
employed male TVET
graduates than their
female counterparts, with
244,527 and 209,569,
respectively.
Employment rate was also
slightly higher among the
males (65.6%) compared
to the females (65.2%).
(Figure 4)

14
Graduates from the community-based trainings had the highest employment rate of
67.9%. (Table 17).
Graduates of the enterprise-based training registered the lowest among the three
delivery modes of training at 52.5%. It went down from 83.1% employment rate in
2011 IES which is 30 percentage points lower than 52.5% employment rate in the
current study. TESDA should seriously study the impact of the enterprise-based
training, both from the graduates and the employers’ perspectives and consider the
policy on how enterprise-based training would gain ground to partner companies.
Table 17. Employment Rate of TVET Graduates, by Training Delivery Mode, Philippines: 2013
Training Delivery Mode Employed TVET Graduates
ER Female Male Total
Institution-based 124,445 177,842 302,287 65.6
Enterprise-based 11,847 10,358 22,205 52.5
Community-based 73,277 56,327 129,603 67.9
Total 209,569 244,527 454,095 65.4
Table 18 shows the type of work that TVET graduates were engaged in.
Seventy-nine percent (79.5% or 360,859) of the TVET graduates were employed as
wage and salary workers in private establishments. Majority of them were graduates
of institution-based training programs.
Own-account workers registered 18.9% which is 5 percentage points higher than the
2012 TVET graduates. A significant number (73,653 or 16.2%) were self-employed.
Unpaid family workers registered 1.6% only.
Most of the graduates of enterprise-based training delivery were employed in private
establishments.
Table 18. Employed TVET Graduates by Class of Worker, by Training Delivery Mode, Philippines: 2013
Class of Worker
Training Delivery Mode Total
Employed % Institution-
based %
Enterprise-based
% Community-
based %
Wage and Salary Workers
256,051 84.7 20,604 92.8 84,204 65.0 360,859 79.5
Private household 27,560 9.1 1,088 4.9 11,572 8.9 40,220 8.9
Private establishment
192,378 63.6 18,507 83.3 51,035 39.4 261,920 57.7
Government/ government corporation
26,038 8.6 901 4.1 15,583 12.0 42,522 9.4
Employed in family operated farm or business
10,075 3.3 108 0.5 6,014 4.6 16,197 3.6

15
Class of Worker
Training Delivery Mode Total
Employed % Institution-
based %
Enterprise-based
% Community-
based %
Own account workers
46,062 13.9 1,437 6.5 42,361 32.7 85,860 18.9
Self-employed 35,610 11.8 1,244 5.6 36,799 28.4 73,653 16.2
Employer in family-operated farm or business
6,452 2.1 193 0.9 5,562 4.3 12,207 2.7
Unpaid family worker
4,173 1.4 166 0.7 3,038 2.3 7,376 1.6
Total 302,287 100 22,205 100 129,603 100 454,095 100
By sex, there were more employed male graduates in all classes except in
government/government corporation (Table 19). This is consistent with the data from
Civil Service Commission (CSC) showing more female employees than males in the
government bureaucracy.
Table 19. Employed TVET Graduates by Class of Worker, by Sex, Philippines: 2013
Class of Worker
Sex
Female Male Total %
Wage and Salary Workers 165,438 195,420 360,859 79.5
Private household 24,367 15,853 40,220 8.9
Private establishment 111,814 150,106 261,920 57.7
Government/government corporation
22,264 20,258 42,522 9.4
Employed in family operated farm or business
6,994 9,202 16,197 3.6
Own account workers 40,809 45,052 85,860 18.9
Self-employed 34,970 38,684 73,653 16.2
Employer in family-operated farm or business
5,839 6,368 12,207 2.7
Unpaid family worker 3,322 4,055 7,376 1.6
Table 20 shows the employment figures of graduates by sector.
Graduates of Visual Arts; TVET; Agriculture and Fishery; Language; Decorative
Crafts; Health, Social and Other Community Development Services; and Construction
showed high employment rates, ranging from 70.1% to 100%.
They were followed by graduates of Entrepreneurship, Automotive and Land
Transportation, Garments, Metals and Engineering, with employment rates ranging
from 63.7% to 68.2%.

16
Table 20. Employment of TVET Graduates by Sector , Philippines: 2013
Sector Employed TVET Graduates
ER Female Male Total
Visual Arts 257 257 100.0
TVET 3,013 5,095 8,108 96.3
Agriculture and Fishery 6,607 9,792 16,399 73.4
Language 4,667 4,894 9,560 72.6
Decorative Crafts 2,248 174 2,421 71.7
Construction 1,779 34,220 36,000 70.6
Health, Social and Other Community Dev’t. Services 47,506 12,003 59,509 70.1
Entrepreneurship 7,543 4,530 12,073 68.2
Automotive and Land Transportation 3,873 37,883 41,757 67.6
Garments 7,640 1,512 9,151 66.4
Metals and Engineering 2,490 33,178 35,668 63.7
Electronics 21,186 29,978 51,163 62.8
Heating, Ventilation, Air Conditioning and Refrigeration (HVAC)
222 3,351 3,573 62.7
Information and Communication Technology 28,039 20,896 48,934 62.7
Maritime 82 2,104 2,187 62.6
Tourism 55,687 37,669 93,356 61.8
Livelihood 7,866 1,956 9,822 60.6
Processed Food and Beverages 8,704 4,404 13,108 60.5
Furniture And Fixtures 74 24 97 45.3
Footwear 47 47 28.7
Wholesale and Retail Trading 297 609 905 27.0
Total 209,569 244,527 454,095 65.4
It will be noted that only 9 TVET qualifications registered employment rates higher than the national employment rate of 65.4%. (Table 21)
Table 21. TVET Qualifications with Higher Employment Rate than the National Employment Rate: Philippines: 2013
Training Program Completed Employed ER
Information and Communication Technology (ICT)
Finishing Course for Call Center Agents NC II 8,500 76.7
Health, Social and Other Community Development Services
Household Services NC II 6,951 72.7
Hilot (Wellness Massage) NC II 5,790 75.9
Automotive and Land Transportation
Driving NC II 6,164 79.5
Automotive Servicing NC I 5,766 67.3
Electronics
Electrical Installation and Maintenance NC II 12,146 70.6
Garments
Dressmaking NC II 4,096 71.0

17
Training Program Completed Employed ER
Tourism
Bread and Pastry Production NC II 10,693 69.4
TVET
Trainers Methodology Level I 6,811 97.2
By nature of employment, 50.5% (229,222) were employed in short-term jobs or
business (Table 22). Around 67% of them had average monthly income of less than
₱10,000.00, which is below the minimum monthly salary.
Table 22. Employed TVET Graduates by Nature of Employment, Philippines: 2013
Nature of Work Employed TVET
Graduates %
Permanent job/business/unpaid family work 192,896 42.5
Short-term or seasonal job/business/unpaid family work 229,222 50.5
Worked for different employers on day to day or week to week basis
20,223 4.5
Not indicated 11,754 2.6
Total 454,095 100
Local employment opportunities are still available as shown in Table 23. Majority of
the employed graduates (348.427 or 76.7%) were working within their province.
About 6 out of every 100 employed TVET graduates (28,687 or 6.3%) were working
overseas.
Table 23. Employed TVET Graduates, By Location of Work, Philippines: 2013
Location of Work Employed TVET Graduates
% Share Female Male Total
Within the province 164,826 183,602 348,427 76.7
Outside the province but within the region 15,563 20,464 36,027 7.9
Outside the region 14,780 26,174 40,954 9.0
Outside the country 14,400 14,287 28,687 6.3
Total 209,569 244,527 454,095 100
Almost fifty-seven percent (56.9% or 258,449) of employed TVET graduates were
receiving less than ₱10,000.00 average monthly income, which is below the average
basic minimum wage (Table 24).
More females were receiving less than ₱5,000.00 average monthly income.

18
Table 24. Average Monthly Income of Employed TVET Graduates, Philippines: 2013
Average Monthly
Income
Sex
Female Male Total
Employed %
Less than 5,000 49,784 42,980 92,764 20.4
5,000-9,999 69,569 96,116 165,685 36.5
10,000-14,999 34,400 43,123 77,522 17.1
15,000-19,999 20,479 22,153 42,633 9.4
20,000 and over 20,278 21,639 41,917 9.2
Not indicated 15,058 18,516 33,574 7.4
Total 209,569 244,527 454,095 100
4.1 Employment of Certified TVET Graduates
Region II posted the highest employment rate of certified TVET graduates with 87%;
followed by Region VI, with 84.6%. However, it can be noted that they were among
the four regions with small number of certified graduates.
Region III had the most number of employed certified TVET graduates (with 38,829 or
17.6%), followed by NCR (with 34,172 or 15.5%) and Region IV-A (with 30,955 or
14%) (Table 25).
Table 25. Employment Rate of Certified TVET Graduates, By Region, Philippines: 2013
Region Not in the
Labor Force
In the Labor Force Total Certified
Graduates Not
Employed Employed Total ER
NCR 17,186 13,084 34,172 47,256 72.3 64,442
CAR 5,847 2,166 7,894 10,060 78.5 15,907
Region 1 9,766 6,071 22,065 28,136 78.4 37,902
Region 2 1,517 729 4,885 5,614 87.0 7,131
Region 3 18,280 19,293 38,829 58,122 66.8 76,402
Region 4A 20,949 12,903 30,955 43,858 70.6 64,807
Region 4B 4,596 4,051 7,374 11,426 64.5 16,022
Region 5 5,100 4,426 9,927 14,354 69.2 19,453
Region 6 350 272 1,497 1,769 84.6 2,119
Region 7 6,595 17,401 15,107 32,509 46.5 39,104
Region 8 5,414 4,130 8,189 12,319 66.5 17,733
Region 9 3,005 3,027 3,481 6,508 53.5 9,513
Region 10 5,211 6,108 10,028 16,136 62.1 21,347
Region 11 7,124 10,676 15,443 26,118 59.1 33,242
Region 12 3,643 3,610 7,983 11,594 68.9 15,236
CARAGA 1,654 1,328 2,226 3,554 62.6 5,209
ARMM 2,234 2,480 1,095 3,576 30.6 5,810
Total 118,471 111,758 221,150 332,907 66.4 451,379

19
Certified TVET graduates registered an employment rate of 66.4%, which is slightly
higher than the national employment rate. (Table 26).
Moreover, employment rate of female certified graduates was higher (67.3%) than
their male counterparts (65.9%).
Table 26. Employment Rate of Certified TVET Graduates, By Sex, Philippines: 2013
Certified TVET Graduates
Not in the Labor Force
In the Labor Force Total Certified
Graduates Not
Employed Employed Total ER
Female 56,087 43,021 88,390 131,411 67.3 187,498
Male 62,384 68,737 132,760 201,497 65.9 263,881
Total 118,471 111,758 221,150 332,908 66.4 451,379
Among these employed certified
graduates, 50% did not receive any
incentive from their employers. Only
26.4% said that they were given
incentives (Figure 5).
Almost 41% received salary
increases; 29%, job security; and,
23%, promotion.
Table 27. Incentives Given to Employed Certified Graduates, Philippines: 2013
Type of Incentives Number %
Salary Increase 26,900 40.8
Promotion 15,093 22.9
Job Security 19,127 29.0
Others 4,748 7.2
Total 65,868 100
4.2 Employment of Graduates of Scholarship Programs
The employment rate of 2013 scholars was 69%, a bit higher that the 68.2% of 2012
scholars.
More male scholars were employed than female scholars.
Table 28. Employment Rate of TVET Graduates, By Type of Programs, Philippines: 2013
Type of Program Employed TVET Graduates
ER Female Male Total
Scholarship Program 69,199 82,660 151,859 69.0
Non-Scholarship Program 140,370 161,867 302,237 63.7
Total 209,569 244,527 454,095 65.4

20
Among the scholarship programs, the employment rate of TWSP scholars was
registered at 71.9%, higher by 6 percentage points than the national employment rate
(Table 29). Also, it was 3 percentage points higher than the 2012 TWSP scholars.
Table 29. Employment Rate, By Type of Scholarship Program, Philippines: 2013
Type of Scholarship
Not in the Labor Force
In the Labor Force Total Graduate Scholar
Not Employed
Employed Total ER
TWSP 34,399 33,632 86,095 119,727 71.9 154,126
PESFA 7,069 7,676 9,982 17,657 56.5 24,726
Other Scholarship Programs
34,666 26,998 55,782 82,780 67.4 117,446
Total 76,134 68,306 151,859 220,164 69.0 296,298
The TVET qualifications (with National Certificates) of TWSP and PESFA scholars
with high employment rates are shown in Table 30.
The top three are Driving (with 100%), Health Care Services (93.4%) and Tour
Guiding Services (88.7%).
Table 30. TVET Qualifications under TWSP and PESFA with Employment Rate Higher
than the National, Philippines:2013
Sector/TVET Qualification Employed ER
Agriculture and Fishery
Horticulture NC II 312 85.9
Automotive and Land Transportation
Driving NC III (Straight Truck / Bus) 1,003 100
Driving NC II 1,787 88.5
Construction 2,951 74.5
Carpentry NC II 496 81.7
Electrical Installation and Maintenance NC II 2,456 73.2
Electronics
Mechatronics Servicing NC II 283 70.7
Computer Hardware Servicing NC II 4,394 65.3
Health, Social and Other Community Development Services
Health Care Services NC II 498 93.4
Household Services NC II 274 92
Hilot (Wellness Massage) NC II 3,953 78.9
Caregiving NC II 211 66.7
Massage Therapy NC II 1,149 65.9
Information and Communication Technology
Finishing Course for Call Center Agents NC II 5,478 80.1
Programming NC IV 560 68.6
21
Sector/TVET Qualification Employed ER
Metals and Engineering
Shielded Metal Arc Welding (SMAW) NC II 5,067 65.4
Pipefitting NC II 658 78.6
Tourism
Tour Guiding Services NC II 268 88.7
Bread and Pastry Production NC II 2,653 85.4
Events Management Services NC III 453 82.8
Commercial Cooking NC II 3,499 73.4
Food and Beverages Services NC II 5,927 70.8
Front Office Services NC II 767 69.4
Food and Beverage Services NC III 1,364 66.7
TVET (Trainers Methodology Level I) 2,653 97.4
English Proficiency Training Program 2,596 90.9
Total (Higher than National ER) 48,757 75.7
Other Qualifications 47,320 64.8
Total Graduates (TWSP and PESFA) 96,077 69.9
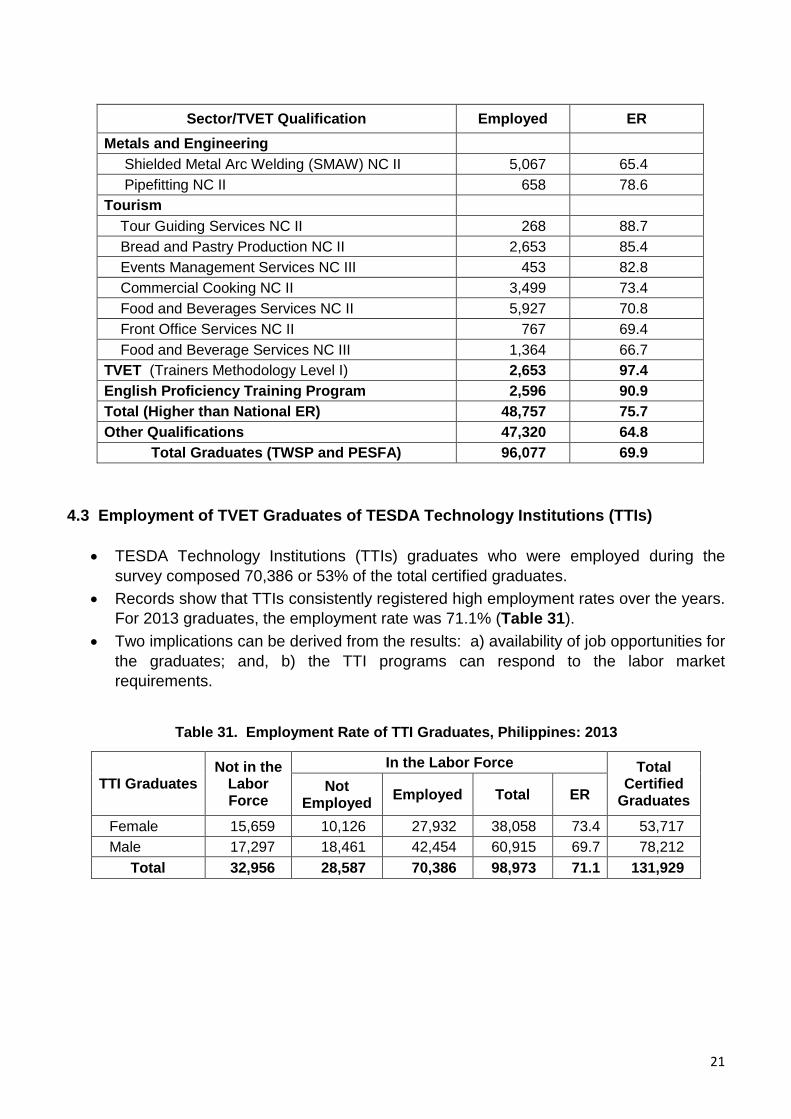
4.3 Employment of TVET Graduates of TESDA Technology Institutions (TTIs)
TESDA Technology Institutions (TTIs) graduates who were employed during the
survey composed 70,386 or 53% of the total certified graduates.
Records show that TTIs consistently registered high employment rates over the years.
For 2013 graduates, the employment rate was 71.1% (Table 31).
Two implications can be derived from the results: a) availability of job opportunities for
the graduates; and, b) the TTI programs can respond to the labor market
requirements.
Table 31. Employment Rate of TTI Graduates, Philippines: 2013
TTI Graduates Not in the
Labor Force
In the Labor Force Total Certified
Graduates Not
Employed Employed Total ER
Female 15,659 10,126 27,932 38,058 73.4 53,717
Male 17,297 18,461 42,454 60,915 69.7 78,212
Total 32,956 28,587 70,386 98,973 71.1 131,929

22
By region, more employed certified TTI graduates were in Regions III, V, IV-A, I and
VIII (Table 32). These are among the regions where there are more TTIs.
High employment rates were registered in NCR, CAR, Regions I, II, III, IV-A and VI.
Table 32. Employment Rate of Certified TTI Graduates, By Region, Philippines: 2013
Region Not in the
Labor Force
In the Labor Force Total Certified TTI Graduates Not
Employed Employed Total ER
NCR 80 47 771 817 94.3 897
CAR 1,768 540 2,180 2,720 80.1 4,488
Region 1 1,202 792 5,508 6,300 87.4 7,502
Region 2 627 343 2,895 3,238 89.4 3,865
Region 3 1,686 1,913 8,257 10,170 81.2 11,856
Region 4A 815 1,094 5,455 6,549 83.3 7,364
Region 4B 1,605 1,113 2,161 3,274 66.0 4,879
Region 5 1,642 2,063 4,583 6,646 69.0 8,288
Region 6 68 62 252 314 80.3 383
Region 7 667 2,372 2,813 5,186 54.3 5,853
Region 8 2,584 1,587 4,147 5,734 72.3 8,319
Region 9 1,613 2,004 1,526 3,530 43.2 5,143
Region 10 1,079 1,491 1,707 3,198 53.4 4,277
Region 11 1,144 1,861 3,830 5,691 67.3 6,835
Region 12 780 394 1,229 1,624 75.7 2,403
CARAGA 98 213 353 566 62.3 664
ARMM 20 211 45 257 17.7 277
Total 17,479 18,101 47,712 65,813 72.5 83,292
4.4 Skills Utilization and Employment Facilitation
Skills utilization consistently remains high over the years. Majority or 57.7% (261,874)
of the employed graduates indicated that skills/competencies they acquired were very
useful in their present jobs.
However, almost 21% or 93,909 specified that the skills/competencies they acquired
have no use in their present jobs. (Table 33)
Table 33. Skills Utilization of Employed TVET Graduates, Philippines: 2013
Skills Utilization Employed TVET Graduates
% Share Female Male Total
Very useful 117,197 144,677 261,874 57.7
Some use 47,830 50,481 98,312 21.7
No use at all 44,541 49,368 93,909 20.7
Total 209,569 244,527 454,095 100.0

23
Referral system and walk-in applicants remained the major means of looking for jobs
as indicated in Table 34. The two represent almost 66%.
The Blue Desk of TESDA and the PESO, as the government employment facility,
programs accounted only 2.0% and 2.4%, respectively. This implies that TESDA
has to strengthen the Blue Desk. Moreover, coordination and linkages with PESO at
the local levels have to be intensified.
Table 34. Employed TVET Graduates by Type of Employment Facility Availed, Philippines: 2013
Job Facilitation Employed TVET Graduates
% Female Male Total
Blue Desk 3,440 5,807 9,247 2.0
PESO 5,648 5,222 10,870 2.4
Internet Job Posting 8,822 9,572 18,394 4.1
Newspaper Advertisements 5,899 5,008 10,907 2.4
Referral from friends/relatives 71,313 92,458 163,771 36.1
Walk-in application 61,781 72,801 134,582 29.6
Others 45,445 45,796 91,241 20.1
Not indicated 7,221 7,862 15,083 3.3
Total 209,569 244,527 454,095 100

24
III. CONCLUSIONS and RECOMMENDATIONS
Skills is an important element for employment. Acquisition of competencies has
consistently been recognized as one of the key factors in poverty reduction program of the
government. Acquiring the right skills needed by the labor market will ensure the workers to
engage into any productive economic activity. Consequently, increased employability of
persons would contribute to economic growth of the country.
TESDA, as the authority in TVET, has gained the confidence of the Administration in
addressing the skills development of the Filipino labor force. Responsiveness to the needs
of the labor market is expected from TVET. Training investment for TVET has been
consistently increasing over the years. From ₱2.971B in 2013, it reached ₱5.117B in 2014.
The TWSP on other hand, grew by 100% during the same period.
Based on the results, increasing the employability of TVET graduate can be achieved
through:
1. Enterprise-based Training. Improving the implementation of enterprise-based
training is necessary given its dwindling performance and the decreasing
participation of the partner industries.
Undertake purposive review and assessment of the enterprise-based training
system in the country. This includes revisiting the policies, guidelines (especially
on documentary requirements) and strategies on how to attract partner
companies. A study on the impact of the enterprise-based training, both from the
graduates and the employers’ perspectives, maybe undertaken.
TESDA to adopt the practices of foreign countries since the current signal from
international agencies is towards strengthening the enterprise-based training.
Undertake more aggressive approach in the promotion of enterprise-based
program.
TESDA to continuously participate in the deliberation of the proposed
Apprenticeship Bill.
2. Competency Assessment and Certification. Enhancing the competency assessment
and certification program is essential.
Intensify the participation and involvement of the industry, particularly in
competency standards development, in order to increase the acceptability and
employability of certified TVET graduates. This includes wider and more
selective representation of the industry representatives.
Continuous support to TVET clientele who are financially inadequate should be
maintained. Free competency assessment should be provided, to give them
opportunity to acquire the National Certificate (NC), a requirement especially for
those who plan to work overseas. Guidelines on the Competency Assessment
and Certification for Workers (CACW) could consider this concern.

25
3. Scholarship Programs
Ensure that scholarship programs are very accessible to the marginalized or
underprivileged constituents especially those in the rural areas.
There should be close monitoring of TVET providers with scholarship programs
especially in the employment of their graduates. TVET providers with good
employment records of their graduates, may be given more slots as incentive.
4. Entrepreneurship Program
Promote entrepreneurial activities to widen the employment opportunities of
TVET graduates.
5. Support Program
TESDA and DOLE-PESO should assist/facilitate the establishment of Labor
Market Information Units in all tech-voc institutions (with accredited TVET
programs) through capacitating them on job placements, jobs matching and
other elements of employment.

26

27

28