table of contents - fisher...
TRANSCRIPT
TABLE OF CONTENTS
QUICK START GUIDE........................................................................................iii
Flow chart: Cleaning, Testing and Corrective Action Procedures ................ iv
INTRODUCTION ..................................................................................................1
The SystemSURE II ATP Detection Program....................................................1 Components of the SystemSURE II ATP Detection System ...........................2 Overview of this guide ........................................................................................2
SECTION 1: An overview of the SystemSURE II ATP Detection Program .....4
1.1 What is ATP?......................................................................................4 1.2 Measuring ATP with bioluminescence technology .............................4 1.3 Interpreting results on the SystemSURE II luminometer ....................5 1.4 Benefits of routine ATP testing ...........................................................5 1.5 Other applicable uses for the SystemSURE II ATP
Detection System...........................................................................6
SECTION 2: Using your SystemSURE II ATP Detection System ....................7
2.1 Proper sampling procedure ........................................................................7 2.1.1 Collecting samples with the Ultrasnap device .................................7 2.1.2 Measuring ATP with the SystemSURE II luminometer....................9 2.1.3 General precautions and warnings................................................10 2.1.4 Ensuring correct results with calibration controls ..........................11
2.2 Where to do ATP testing............................................................................12 2.2.1 Establishing your facility’s test locations (control points) ...............12 2.2.2 Types of contact areas ..................................................................12 2.2.3 Diagram of typical production floor control points..........................14 2.2.4 Monitoring individual control points ...............................................15
2.3 Determining ATP threshold levels for your facility.................................16 2.3.1 Options for setting up ATP threshold levels ..................................16 2.3.2 General Pass/Caution/Fail levels ..................................................18 2.3.3 Storing and viewing threshold data ...............................................19
i

2.4 When to perform ATP testing....................................................................20 2.5 Corrective action procedures ...................................................................21 2.4 Continuous improvement..........................................................................23 2.5 Managing and tracking your data with DataSURE II Software...............23
2.5.1 Setting up Program Data and Location Information ......................25 2.5.2 Writing threshold data to the SystemSURE II luminometer ...........26 2.5.3 Uploading test results from the SystemSURE II luminometer .......26 2.5.4 Producing trend analysis graphs and reports with the
Data Analysis Tool.......................................................................27
SECTION 3: Further help.................................................................................28
3.1 Troubleshooting .........................................................................................28 3.2 Glossary ......................................................................................................29 3.3 Appendix A: Typical ATP threshold guidelines .....................................30 3.4 Other Hygiena products ............................................................................31 3.5 Contact Information ...................................................................................32
ii
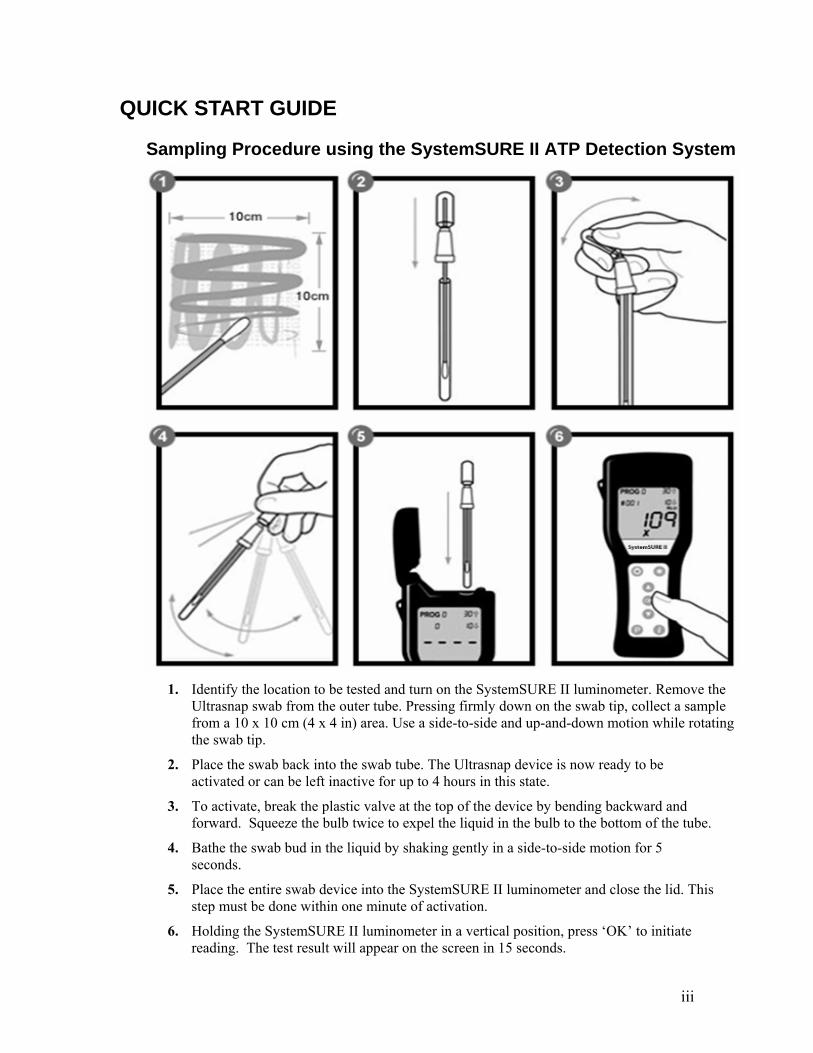
QUICK START GUIDE Sampling Procedure using the SystemSURE II ATP Detection System
1. Identify the location to be tested and turn on the SystemSURE II luminometer. Remove the Ultrasnap swab from the outer tube. Pressing firmly down on the swab tip, collect a sample from a 10 x 10 cm (4 x 4 in) area. Use a side-to-side and up-and-down motion while rotating the swab tip.
2. Place the swab back into the swab tube. The Ultrasnap device is now ready to be activated or can be left inactive for up to 4 hours in this state.
3. To activate, break the plastic valve at the top of the device by bending backward and forward. Squeeze the bulb twice to expel the liquid in the bulb to the bottom of the tube.
4. Bathe the swab bud in the liquid by shaking gently in a side-to-side motion for 5 seconds.
5. Place the entire swab device into the SystemSURE II luminometer and close the lid. This step must be done within one minute of activation.
6. Holding the SystemSURE II luminometer in a vertical position, press ‘OK’ to initiate reading. The test result will appear on the screen in 15 seconds.
iii
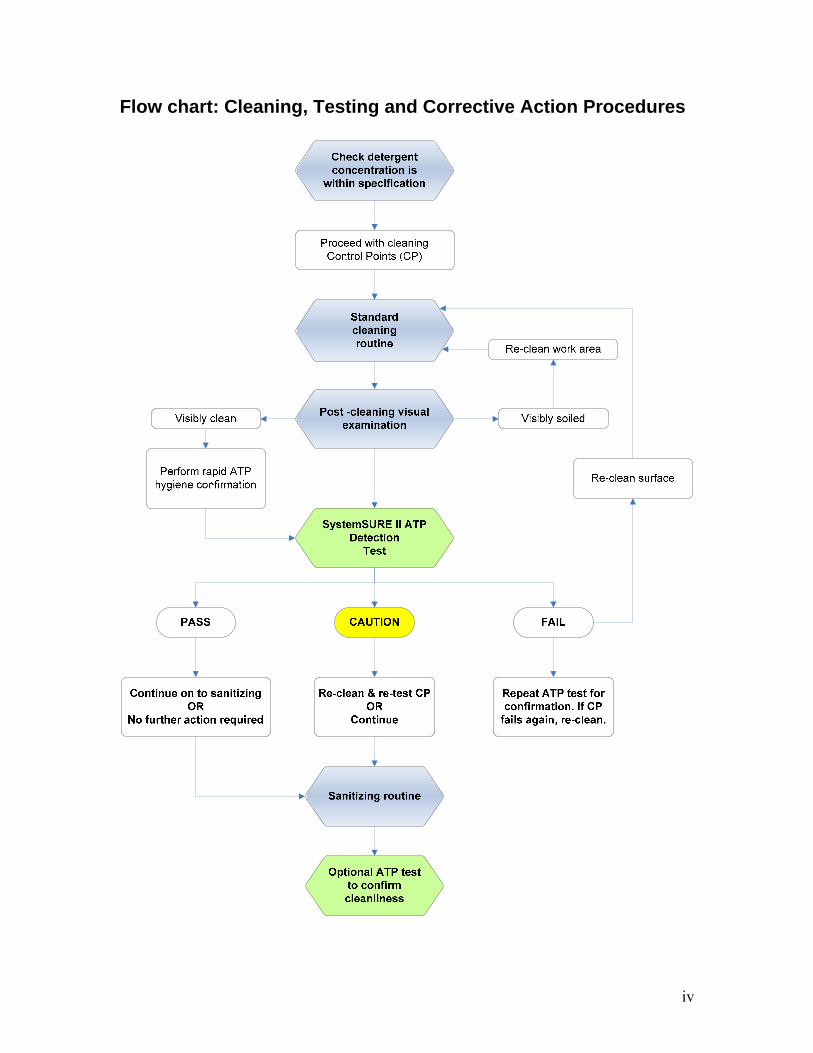
Flow chart: Cleaning, Testing and Corrective Action Procedures
iv
INTRODUCTION
The SystemSURE II ATP Detection Program
In today’s market, impeccable hygiene control is an increasingly critical issue for industries involved in the manufacturing and distribution of consumable products. Hygiena’s SystemSURE II ATP Detection Program offers a state-of-the-art solution for organizations looking to advance the hygienic status of their facilities. Recognized worldwide for accuracy, ease-of-use and affordability, the SystemSURE II ATP Detection System is used extensively throughout the food and beverage processing industries, as well as healthcare and pharmaceutical industries, hospitals, restaurants, supermarkets and other facilities where rapid detection of contamination is crucial. The SystemSURE II ATP Detection System enables organizations to:
Instantly assess the cleanliness of production surfaces, allowing immediate corrective action to be taken
Reduce the use of conventional microbiological testing methods that
are slow, labor intensive and costly
Monitor water quality
Enhance sanitation training, as well as verify efforts of sanitation personnel
Record and track test results to identify problem areas, make
improvements and show due diligence and compliance with HACCP, Sanitation Standard Operating Procedures (SSOPs) and industry regulations
Optimize the use of sanitation chemicals
Protect brand image by increasing product quality and avoiding recalls
1
The guidelines detailed within this manual are applicable to multiple business sectors, including but not limited to:
Food and Beverage industry Food Service Hospitality Government Education Pharmaceutical and Healthcare fields
Components of the SystemSURE II ATP Detection System
The SystemSURE II ATP Detection System includes three components:
SystemSURE II Luminometer – a user-friendly, handheld light-reading unit that provides precise, on-site hygiene test results. Used with the Ultrasnap sample testing device, extremely low levels of contamination can be detected in just 15 seconds.
Ultrasnap Sample Testing Device – a convenient, all-in-one ATP
sampling device that is activated with a simple swab, snap and squeeze action.
DataSURE II Data Analysis Software – a powerful software
program that allows users to upload test results to a database, analyze trends and generate reports.
Hygiena’s luminometer, sample testing devices and software are all designed for ease-of-use and reliability, enabling both technical and non-technical staff to operate the SystemSURE II ATP Detection System without difficulty.
Overview of this guide
This guide is designed to assist users in setting up and operating their own ATP hygiene monitoring program using the SystemSURE II ATP Detection System. The contents of this manual include:
Quick Start Guide
A quick reference on how to use the SystemSURE II ATP Detection System, the Quick Start Guide is included at the beginning of this manual. Included with it is a flow chart that illustrates the basic steps involved in cleaning, testing and corrective action procedures.
2
Section I: An overview of the SystemSURE II ATP Detection Program
This section discusses what ATP is, how it’s used in rapid hygiene bioluminescence testing, as well as the benefits of an ATP monitoring programand other applicable uses for the SystemSURE II System.
Section II: Using your SystemSURE II ATP Detection System
This section provides step-by-step practical instructions for how to use theSystemSURE II ATP Detection System as part of your hygiene monitoringprogram. It includes information on how to properly collect and test samples,where and when to do ATP testing, determining Pass/Fail levels, taking corrective action, and using the DataSURE II software package to manage and track test results over time.
Section III: Further help
3
Section III offers Troubleshooting information, a Glossary of Terms, usefulAppendices, as well as contact information.
SECTION 1: An overview of the SystemSURE II ATP Detection Program The SystemSURE II ATP Detection Program is a rapid hygiene monitoring program designed to help organizations achieve optimal hygiene status within their facilities. The Program combines the three-part SystemSURE II ATP Detection System with a comprehensive monitoring plan to test, record and track biological contamination on production surfaces and in water samples. A key feature of the SystemSURE II ATP Detection System is its use of bioluminescence technology to identify and measure adenosine triphosphate, commonly known as ATP.
1.1 What is ATP?
ATP is an energy molecule found in all plant, animal and microbial cells. It fuels metabolic processes such as cellular reproduction, muscle contraction, plant photosynthesis, respiration in fungi and fermentation in yeast. All organic matter (living or once-living) contains ATP, including food, bacteria, mold and other microorganisms. The detection of ATP on a surface therefore indicates the presence of biological matter that may not otherwise be visible to the eye. In industries where hygiene control is crucial, ATP testing is an excellent tool for detecting and measuring biological matter on surfaces and in water. Hygiena’s SystemSURE II ATP Detection System uses ATP bioluminescence technology to measure extremely low levels of organic residue.
1.2 Measuring ATP with bioluminescence technology
The Ultrasnap ATP Sample Testing Device contains a natural enzyme found in fireflies. This enzyme, called luciferase, produces a simple bioluminescence (light-producing) reaction when it comes into contact with ATP. Using bioluminescence technology, the SystemSURE II luminometer can measure extremely low levels of ATP collected with the Ultrasnap device.
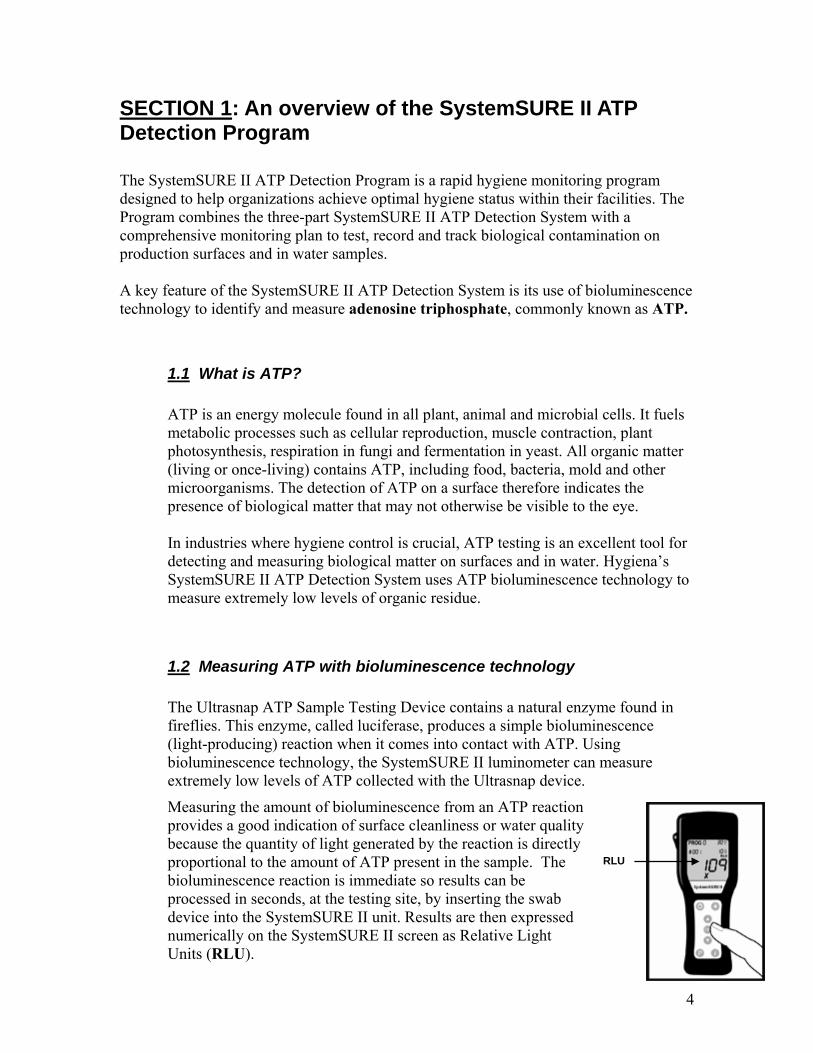
Measuring the amount of bioluminescence from an ATP reaction provides a good indication of surface cleanliness or water quality because the quantity of light generated by the reaction is directly proportional to the amount of ATP present in the sample. The bioluminescence reaction is immediate so results can be processed in seconds, at the testing site, by inserting the swab device into the SystemSURE II unit. Results are then expressed numerically on the SystemSURE II screen as Relative Light Units (RLU).
RLU
4
1.3 Interpreting results on the SystemSURE II luminometer
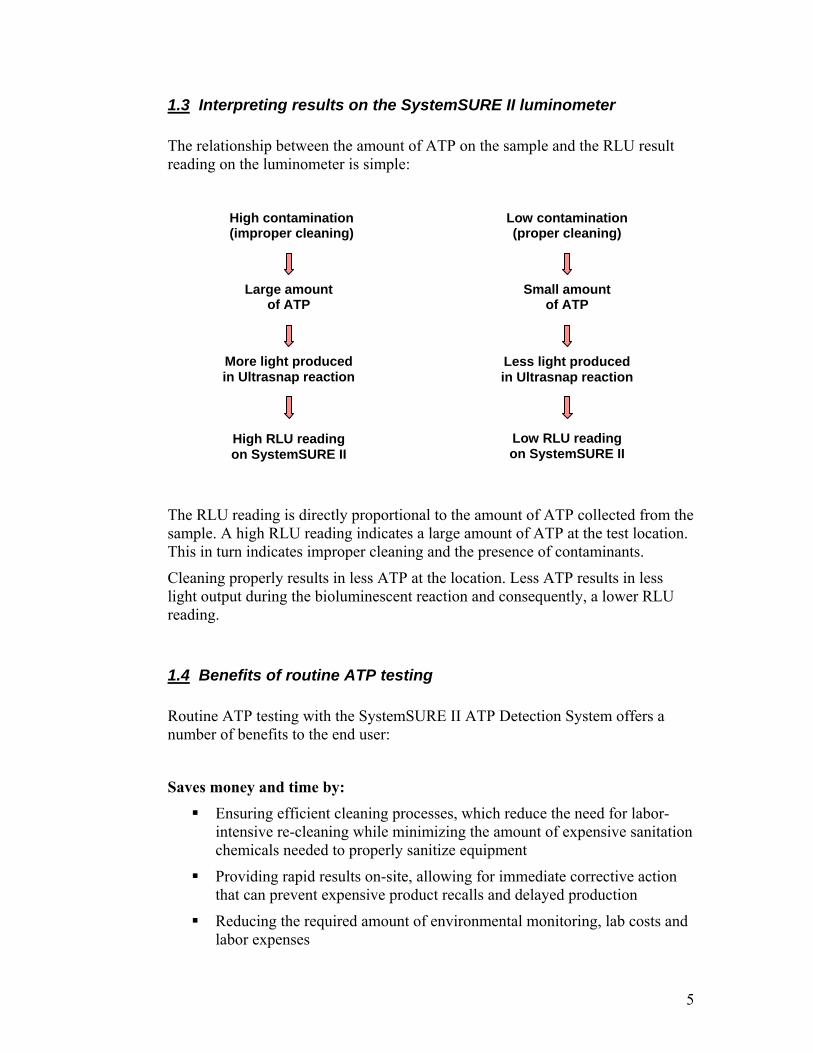
The relationship between the amount of ATP on the sample and the RLU result reading on the luminometer is simple:
High contamination
(improper cleaning) Low contamination (proper cleaning)
Large amount of ATP
Small amount of ATP
More light produced in Ultrasnap reaction
Less light produced in Ultrasnap reaction
Low RLU reading on SystemSURE II
High RLU reading on SystemSURE II
The RLU reading is directly proportional to the amount of ATP collected from the sample. A high RLU reading indicates a large amount of ATP at the test location. This in turn indicates improper cleaning and the presence of contaminants.
Cleaning properly results in less ATP at the location. Less ATP results in less light output during the bioluminescent reaction and consequently, a lower RLU reading.
1.4 Benefits of routine ATP testing
Routine ATP testing with the SystemSURE II ATP Detection System offers a number of benefits to the end user:
Saves money and time by:
Ensuring efficient cleaning processes, which reduce the need for labor-intensive re-cleaning while minimizing the amount of expensive sanitation chemicals needed to properly sanitize equipment
Providing rapid results on-site, allowing for immediate corrective action that can prevent expensive product recalls and delayed production
Reducing the required amount of environmental monitoring, lab costs and labor expenses
5
Provides brand protection by:
Increasing product quality and shelf-life
Preventing food-borne illness and health violations that can compromisethe brand image
Demonstrating to clients and auditors that food safety is a priority
1.5 Other applicable uses for the SystemSURE II ATP Detection System
In addition to routine ATP hygiene monitoring, there are also other usefulapplications for the SystemSURE II ATP Detection System:
Troubleshooting – ATP testing with your SystemSURE II provides a way to expose microbial contamination and other issues that might be causing higher than normal plate counts in environmental testing. It may also be useful in determining the factors affecting end-product screening results (such as product inconsistency or spoilage).
Randomized testing – The SystemSURE II system can be used to audit cleaning efficacy by doing random spot checks of designated testing locations. A large number of test locations are set up. Of these locations, a select number are tested daily or weekly on a randomized or rotating schedule.
Production line disassembly – During a routine full line disassembly and reassembly, it is recommended to do copious amounts of ATP testing to find and clean all areas of machinery that have the potential to harbor harmful bacteria.
Validation of hand cleanliness –
Training – The SystemSURE II ATP Detection System is an effective tool for teaching sanitation crews proper cleaning procedures, since it gives them on-the-spot feedback.
6
ATP testing can be used to verifyproper washing techniques and cleanliness of employees’ hands whenused directly on skin. When doing this type of testing, it is important toidentify appropriate pass/fail levels taking into account naturally occur-ring ATP levels in skin cells. To find out more about using ATP testing to verify hand cleanliness, contact a Fisher sales representative.

SECTION 2: Using your SystemSURE II ATP Detection System
Proper sampling at critical test locations, correct use of the luminometer and sampling devices, and accurate data management are crucial components of the SystemSURE II ATP Detection Program. Consistency in the procedures used ensures accurate results. Effective record keeping and documentation of results allows for helpful analysis and data retrieval during an audit.
This section will explain how to:
collect a sample using the Ultrasnap device use the SystemSURE II luminometer to measure ATP determine where and when to test control points set Pass/Caution/Fail thresholds follow corrective action procedures upload results to the DataSure II database for storage and analysis
2.1 Proper sampling procedure
Before collecting a sample for testing, the surface should be visibly clean. If any soiling or residue is apparent, re-clean the work area before testing.
2.1.1 Collecting samples with the Ultrasnap device
1. Remove the Ultrasnap device from the package. Next, remove the outer tube by holding onto the double ring base of the Snap-Valve while pulling down on the tube. The swab tip comes pre-moistened with a detergent that breaks down biofilm* on the test surface. Condensation may be visible on the inside of the swab tube. This is normal. Do not touch the swab tip or shaft with fingers or anything else, as this will contaminate the test. Discard any swabs that accidentally get tainted or activated.
NOTE: For optimal performance, swabs that have been removed from cold storage should stand for 10 minutes at room temperature before use.
2. Collect a sample with the Ultrasnap device using the guidelines below. Be careful not to overload the swab bud with too much sample. The Ultrasnap device is designed to detect trace amounts of contamination, therefore no sample residue should be visible on the swab. An excessive amount of sample may interfere with the bioluminescence reaction and produce an inaccurate test result. * For a definition of biofilm, please see the Glossary section of this guide.
7
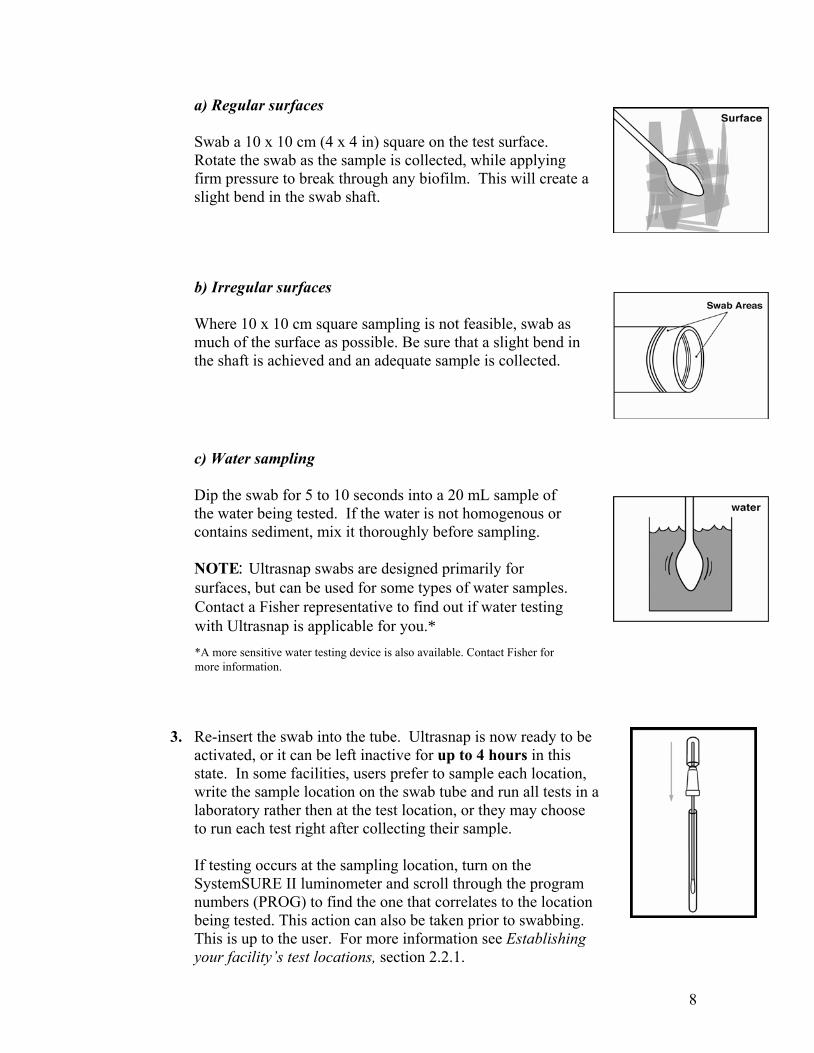
a) Regular surfaces
Swab a 10 x 10 cm (4 x 4 in) square on the test surface.Rotate the swab as the sample is collected, while applyingfirm pressure to break through any biofilm. This will create a slight bend in the swab shaft.
b) Irregular surfaces
Where 10 x 10 cm square sampling is not feasible, swab as much of the surface as possible. Be sure that a slight bend in the shaft is achieved and an adequate sample is collected.
c) Water sampling
Dip the swab for 5 to 10 seconds into a 20 mL sample ofthe water being tested. If the water is not homogenous or contains sediment, mix it thoroughly before sampling.
NOTE
3. Re-insert the swab into the tube. Ultrasnap is now ready to be activated, or it can be left inactive for up to 4 hours in thisstate. In some facilities, users prefer to sample each location,write the sample location on the swab tube and run all tests in a laboratory rather then at the test location, or they may choose to run each test right after collecting their sample.
If testing occurs at the sampling location, turn on the SystemSURE II luminometer and scroll through the programnumbers (PROG) to find the one that correlates to the location being tested. This action can also be taken prior to swabbing. This is up to the user. For more information see Establishingyour facility’s test locations, section 2.2.1.
8
: Ultrasnap swabs are designed primarily forsurfaces, but can be used for some types of water samples.Contact a Fisher representative to find out if water testingwith Ultrasnap is applicable for you.*
*A more sensitive water testing device is also available. Contact Fisher for more information.

4. Holding the device upright, activate the Ultrasnap by bending
the bulb at the top until the plastic Snap-Valve breaks, then bend once more in the opposite direction. Squeeze the bulb twice to expel the liquid-stable reagent contained in the bulb and allow it to flow to the bottom of the tube.
5. Gently shake the device with a side-to-side motion, bathing the swab bud in the liquid-stable reagent. The test is now activated and the bioluminescence reaction is taking place. For optimal results, the reading should be taken on the SystemSURE II luminometer within 5 to 60 seconds of activation.
2.1.2 Measuring ATP with the SystemSURE II luminometer
1. Open the lid on the SystemSURE II luminometer, and insert the activated Ultrasnap device into the reading chamber. Close the lid, making sure to keep the machine upright.
2. Press “OK” on the SystemSURE II to initiate measurement of RLU output. Results are displayed on the screen in 15 seconds.
9
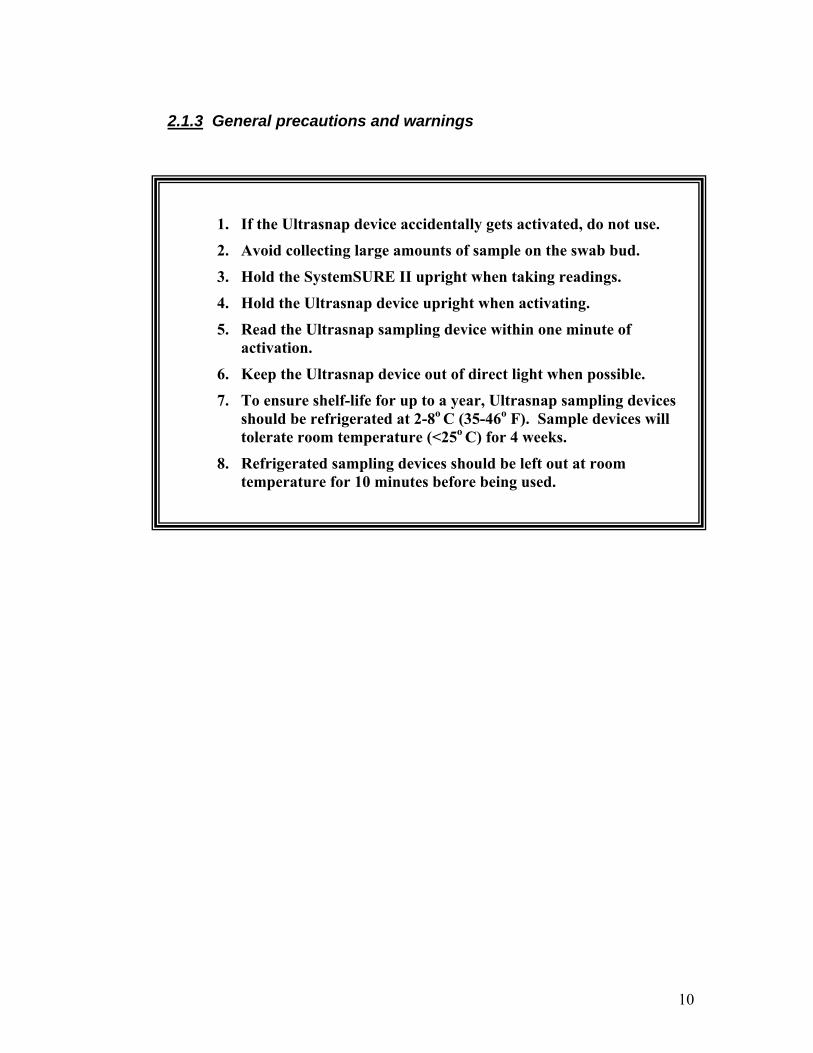
2.1.3 General precautions and warnings
1. 2. 3. 4. 5.
6. 7.
8.
If the Ultrasnap device accidentally gets activated, do not use.
Avoid collecting large amounts of sample on the swab bud.
Hold the SystemSURE II upright when taking readings.
Hold the Ultrasnap device upright when activating.
Read the Ultrasnap sampling device within one minute of activation.
Keep the Ultrasnap device out of direct light when possible.
To ensure shelf-life for up to a year, Ultrasnap sampling devicesshould be refrigerated at 2-8o C (35-46o F). Sample devices will tolerate room temperature (<25o C) for 4 weeks.
Refrigerated sampling devices should be left out at room temperature for 10 minutes before being used.
10

2.1.4 Ensuring correct results with calibration controls
To help ensure the accuracy of test results, the SystemSURE II luminometer is programmed to automatically self-calibrate every time the instrument is turned on. During the 60-second calibration, it checks the light sensor and adjusts to temperature and humidity. To further verify test result accuracy, Hygiena offers two calibration kits that are recommended for periodic use with your SystemSURE II ATP Detection System: the Calibration Control Rod Kit for testing the luminometer, and the Positive Control Kit for testing Ultrasnap devices.
Calibration Control Rod Kit (Part # PCD4000) It’s recommended that you verify calibration of the SystemSURE II luminometer with the Calibration Control Kit once a month. Incorporating the Calibration Control Kit into your overall Quality Control program will confirm that the instrument is within specifications and operating correctly.
Each kit contains a Positive rod and a Negative rod. The Positive rod emits a very low level of radiation, producing a constant light output that can be measured in RLUs to verify proper calibration of the unit. The Negative Rod produces low-light or zero (0) RLU and is used to check that background light is not entering the instrument, while ensuring that the light detector is calibrating correctly. For instructions on how to use the Calibration Control Rod Kit, as well as how to interpret results, consult the product insert.
Positive Control Kit (Part # CK25) The Positive Control Kit is used for validating the efficacy and quality of the Ultrasnap ATP Sample Testing Device. It comes with 25 sealed glass vials, each of which contain an identical amount (approx. 5 x 10-13 moles) of freeze-dried ATP and sugars to provide a predictable result if Ultrasnap devices are used and stored correctly.
Each vial provides a sample which produces a positive result when tested with the Ultrasnap. Positive Controls should be used to test one device in each bag of 25 devices or whenever there is concern about the product’s storage temperature or shelf life. Incorporating the Positive Control Kit into the overall Quality Control program will validate results of the SystemSURE II and the Ultrasnap. For instructions on how to use the Positive Control Kit, as well as how to interpret results, consult the product insert.
11
2.2 Where to do ATP testing
2.2.1 Establishing your facility’s test locations (control points)
Before sample tests are taken, you need to identify areas within your facility that are at risk for contamination from product residue or microbe growth. These areas should be designated as “control points” in your hygiene monitoring plan. A control point should provide reliable feedback on the cleanliness of a particular piece of equipment or area during testing. It’s important that ATP testing is routinely performed on all control points, including product contact areas (direct and indirect) and hard-to-clean sites on your processing and handling lines.
If you currently have HACCP or SSOP programs in place, or if you conduct environmental testing, you may choose to use the same test locations established for these programs as your control points for ATP monitoring.
If you haven’t previously established test locations, you need to determine
where your facility’s areas of contamination risk are. This can be done by swabbing multiple areas on equipment and production line surfaces after routine cleaning. ATP levels will be higher in those spots that are harder to clean, spots that are missed in your current cleaning procedure, and spots that have developed biofilms. These areas should be established as control points for routine testing and monitoring.
2.2.2 Types of contact areas
Your ATP testing plan should include the following locations:
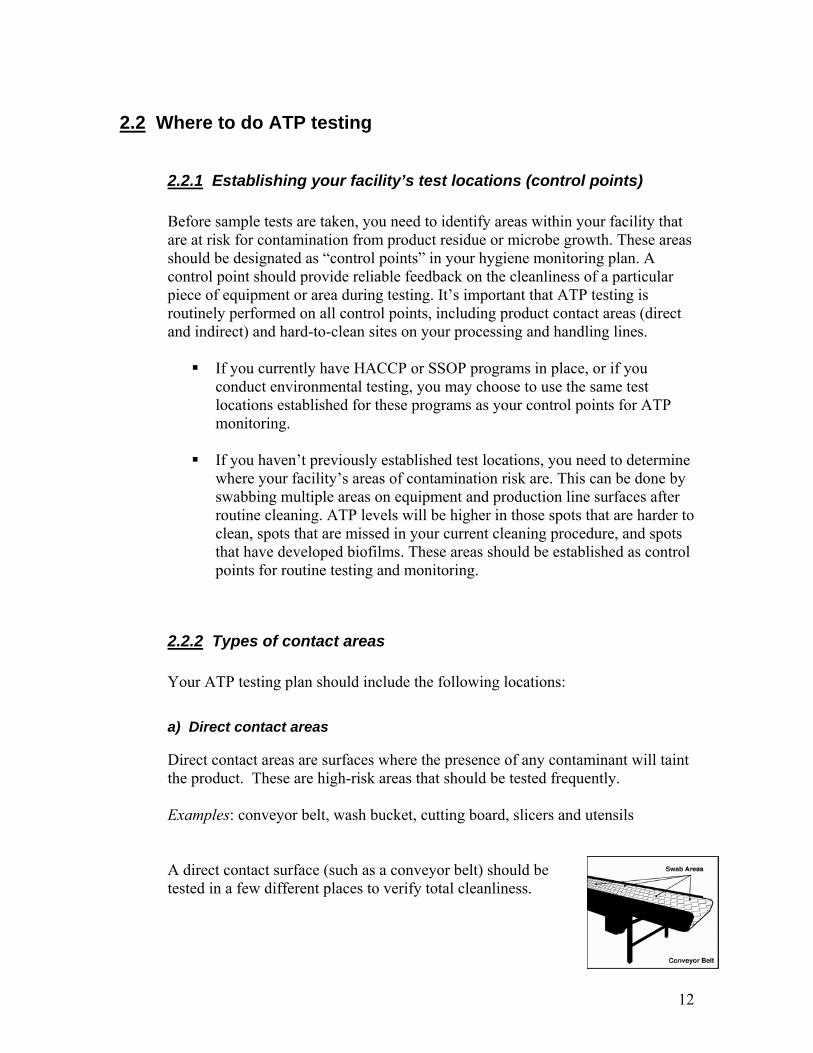
a) Direct contact areas
Direct contact areas are surfaces where the presence of any contaminant will taint the product. These are high-risk areas that should be tested frequently.
Examples: conveyor belt, wash bucket, cutting board, slicers and utensils A direct contact surface (such as a conveyor belt) should be tested in a few different places to verify total cleanliness.
12
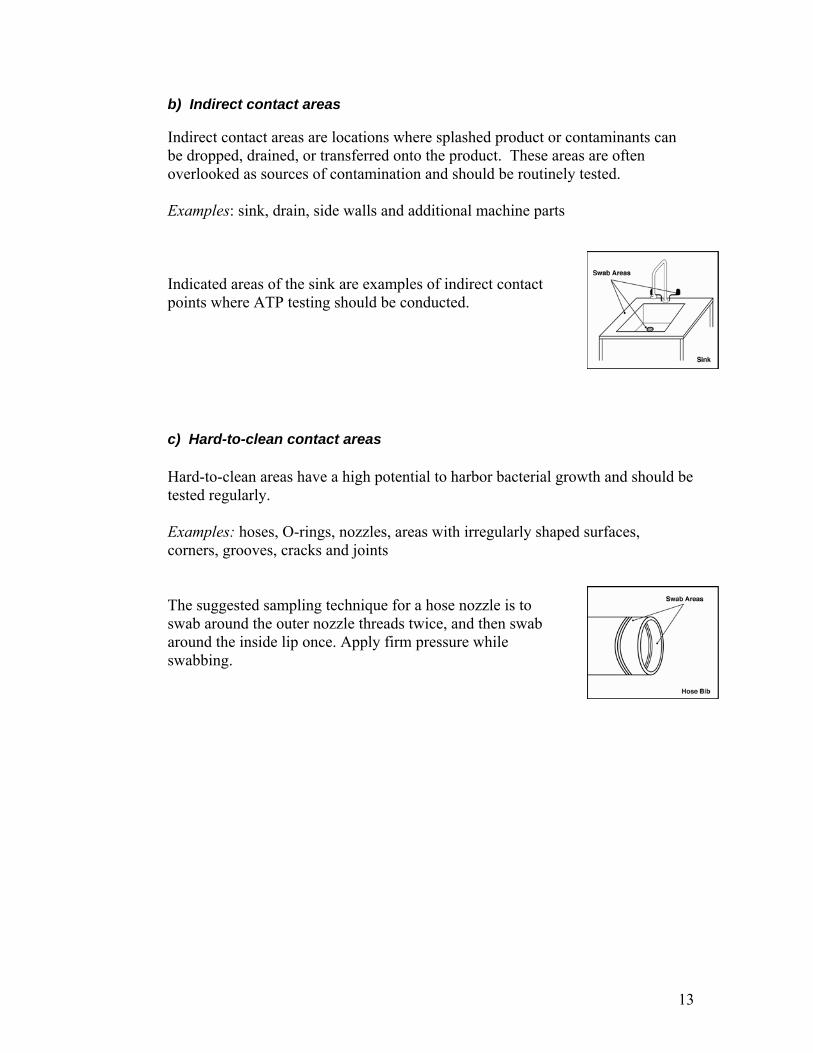
b) Indirect contact areas
Indirect contact areas are locations where splashed product or contaminants can be dropped, drained, or transferred onto the product. These areas are often overlooked as sources of contamination and should be routinely tested.
Examples: sink, drain, side walls and additional machine parts
Indicated areas of the sink are examples of indirect contact points where ATP testing should be conducted.
c) Hard-to-clean contact areas
Hard-to-clean areas have a high potential to harbor bacterial growth and should be tested regularly.
Examples: hoses, O-rings, nozzles, areas with irregularly shaped surfaces, corners, grooves, cracks and joints
The suggested sampling technique for a hose nozzle is to swab around the outer nozzle threads twice, and then swab around the inside lip once. Apply firm pressure while swabbing.
13
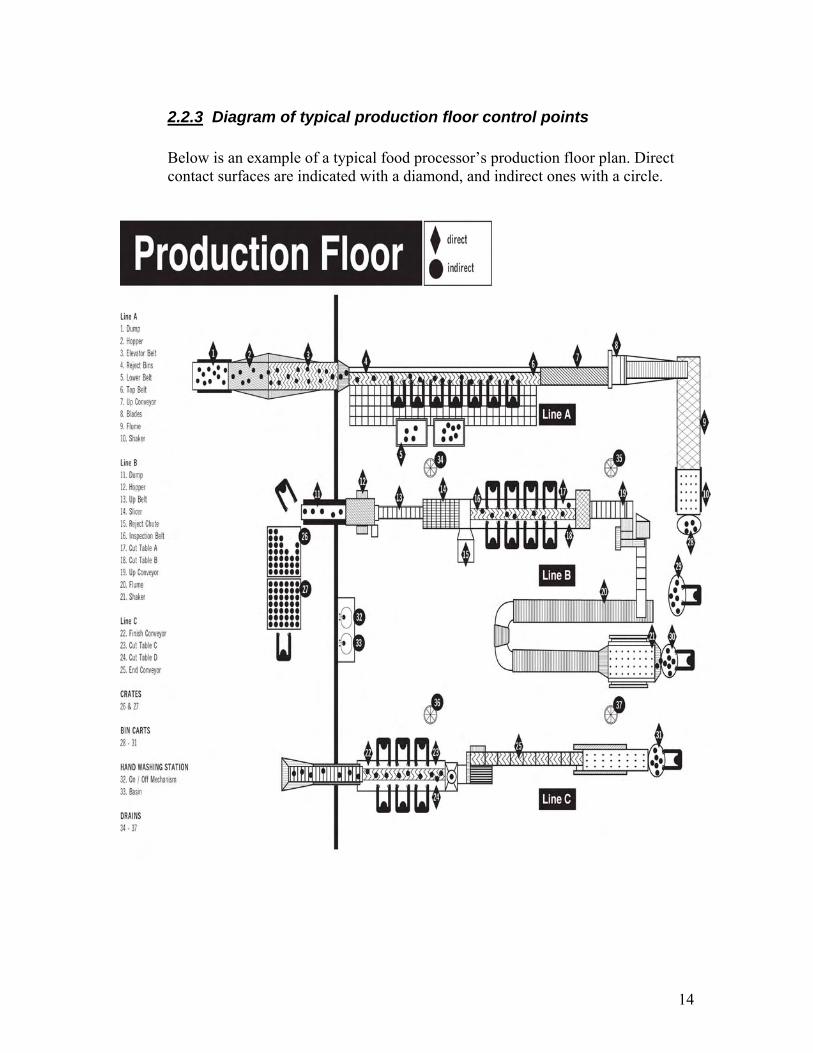
2.2.3 Diagram of typical production floor control points
Below is an example of a typical food processor’s production floor plan. Direct contact surfaces are indicated with a diamond, and indirect ones with a circle.
14
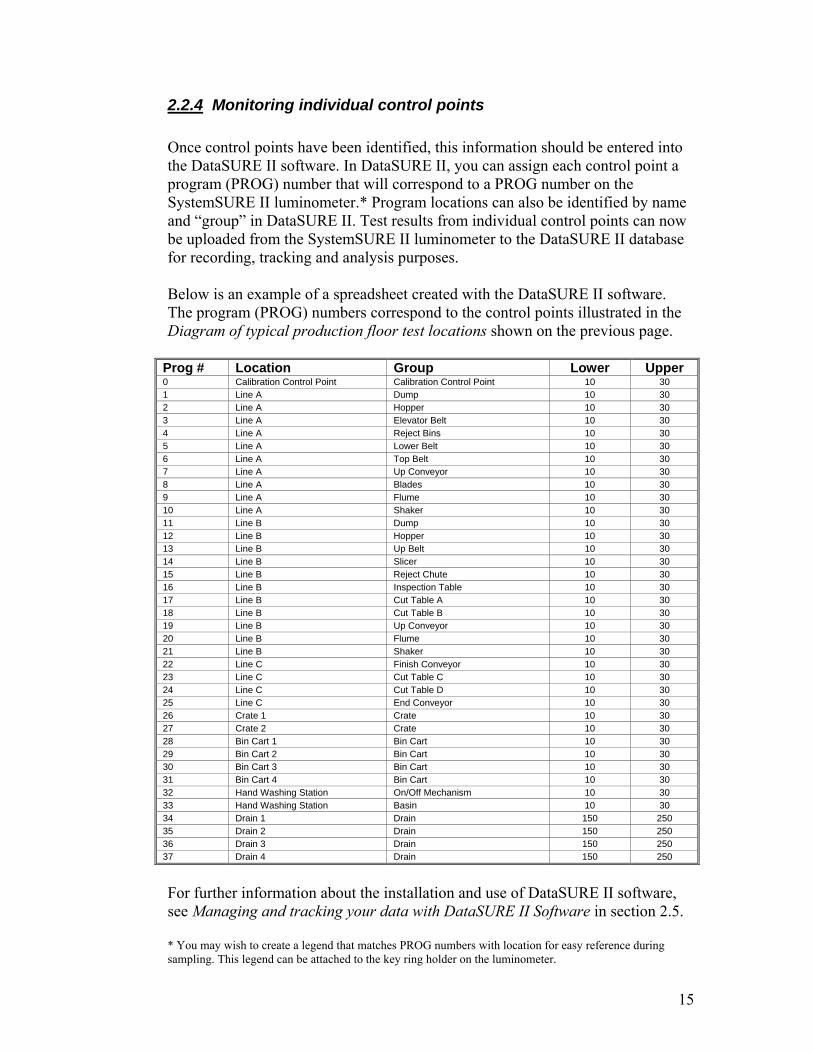
2.2.4 Monitoring individual control points
Once control points have been identified, this information should be entered into the DataSURE II software. In DataSURE II, you can assign each control point a program (PROG) number that will correspond to a PROG number on the SystemSURE II luminometer.* Program locations can also be identified by name and “group” in DataSURE II. Test results from individual control points can now be uploaded from the SystemSURE II luminometer to the DataSURE II database for recording, tracking and analysis purposes. Below is an example of a spreadsheet created with the DataSURE II software. The program (PROG) numbers correspond to the control points illustrated in the Diagram of typical production floor test locations shown on the previous page.
Prog # Location Group Lower Upper 0 Calibration Control Point Calibration Control Point 10 30 1 Line A Dump 10 30 2 Line A Hopper 10 30 3 Line A Elevator Belt 10 30 4 Line A Reject Bins 10 30 5 Line A Lower Belt 10 30 6 Line A Top Belt 10 30 7 Line A Up Conveyor 10 30 8 Line A Blades 10 30 9 Line A Flume 10 30 10 Line A Shaker 10 30 11 Line B Dump 10 30 12 Line B Hopper 10 30 13 Line B Up Belt 10 30 14 Line B Slicer 10 30 15 Line B Reject Chute 10 30 16 Line B Inspection Table 10 30 17 Line B Cut Table A 10 30 18 Line B Cut Table B 10 30 19 Line B Up Conveyor 10 30 20 Line B Flume 10 30 21 Line B Shaker 10 30 22 Line C Finish Conveyor 10 30 23 Line C Cut Table C 10 30 24 Line C Cut Table D 10 30 25 Line C End Conveyor 10 30 26 Crate 1 Crate 10 30 27 Crate 2 Crate 10 30 28 Bin Cart 1 Bin Cart 10 30 29 Bin Cart 2 Bin Cart 10 30 30 Bin Cart 3 Bin Cart 10 30 31 Bin Cart 4 Bin Cart 10 30 32 Hand Washing Station On/Off Mechanism 10 30 33 Hand Washing Station Basin 10 30 34 Drain 1 Drain 150 250 35 Drain 2 Drain 150 250 36 Drain 3 Drain 150 250 37 Drain 4 Drain 150 250
For further information about the installation and use of DataSURE II software, see Managing and tracking your data with DataSURE II Software in section 2.5. * You may wish to create a legend that matches PROG numbers with location for easy reference during sampling. This legend can be attached to the key ring holder on the luminometer.
15
2.3 Determining ATP threshold levels for your facility
Setting correct Pass, Caution and Fail levels is a fundamental part of running a successful ATP hygiene monitoring program. These threshold levels may vary depending on the type of product being manufactured or processed as well as the surface or liquid being checked. However, the formulas used to determine Pass, Caution and Fail levels are always the same.
There are two different standards by which to set up Pass/Fail levels: Routine Cleaning and Vigorous Cleaning. The Vigorous Cleaning setup option is used by facilities requiring extremely high hygiene standards and/or which have easy-to-clean surfaces. Both methods produce similar results with slight variation.
Hygiena also provides general recommended threshold levels, which meet most manufacturers’ hygiene standards. Examples of some typical threshold guidelines specific to the food and beverage industry can also be found in Typical ATP threshold guidelines, in Appendix A.
2.3.1 Options for setting up ATP threshold levels
a) Routine Cleaning
1. Identify control points in your facility.
2. Clean product surfaces to the level that daily sanitation programs should achieve.
3. Conduct an ATP test at each location. Take 5-10 replicate tests at each
location over the course of several days.
4. To determine the Pass limit: Calculate the average RLU for each location based on the 5-10 test results. To do this, add all test results, then divide the sum by the number of tests taken. The resulting number is your average RLU. This number is your Pass limit.
5. To determine the Fail limit: Multiply the Pass limit by 3. The
resulting number is your Fail limit.
6. To determine the Caution limit*: The area between the Pass and Fail thresholds is the Caution zone.
NOTE: In some cases, test results from individual control points within a facility or specific area are consistently within a similar range of each other. In this case, the user may choose to apply a single Pass/Caution/ Fail standard to all control points within that area or facility.
16
b) Vigorous Cleaning
1. Identify control points in your facility.
2. Clean all surfaces thoroughly (2 or more times) to achieve the maximum level of cleanliness possible. This may include a total production line disassembly.
3. Conduct an ATP test at each location. Take 5-10 replicate tests at each
location over the course of several days.
4. To determine the Pass limit: Calculate the average RLU for each location based on the 5-10 test results. This average RLU is considered to be the Pass level.
5. To determine the Fail limit: Multiply the Pass limit by 2 for easy-to-
clean areas and by 3 for harder-to-clean areas.
6. To determine the Caution limit*: The area between the Pass and Fail thresholds is the Caution zone.
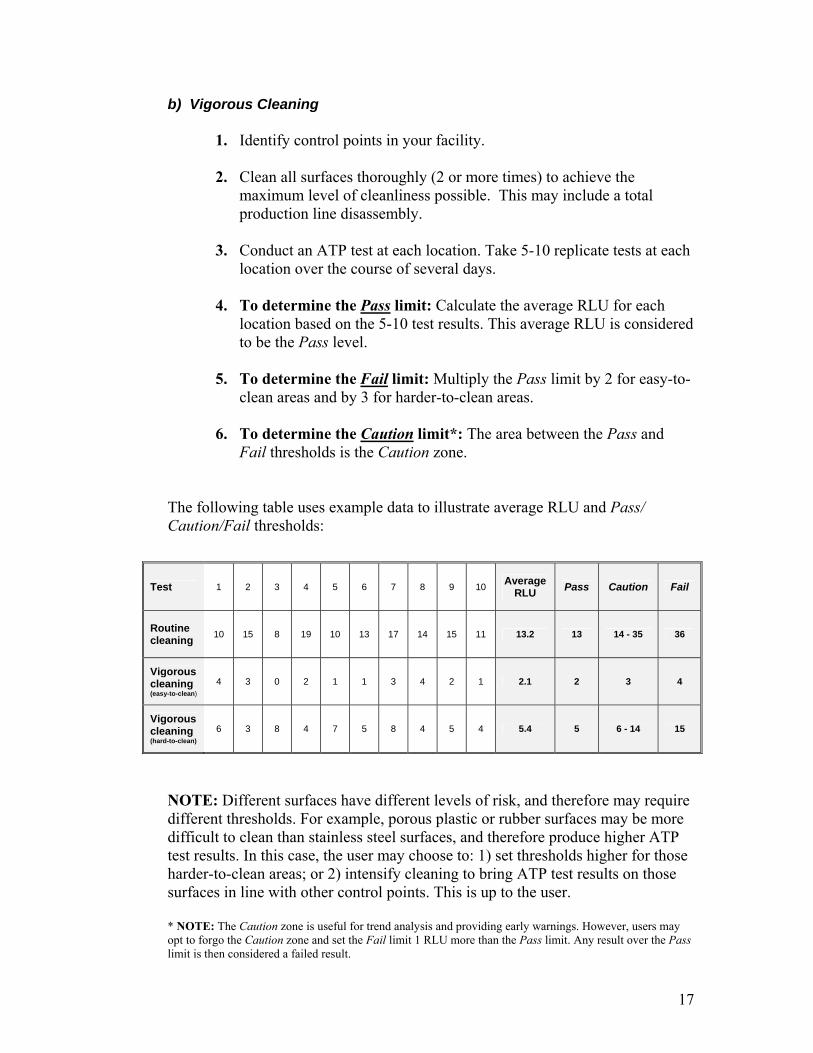
The following table uses example data to illustrate average RLU and Pass/ Caution/Fail thresholds:
Test 1 2 3 4 5 6 7 8 9 10 Average RLU Pass Caution Fail
Routine cleaning 10 15 8 19 10 13 17 14 15 11 13.2 13 14 - 35 36
Vigorous cleaning (easy-to-clean)
4 3 0 2 1 1 3 4 2 1 2.1 2 3 4
Vigorous cleaning (hard-to-clean)
6 3 8 4 7 5 8 4 5 4 5.4 5 6 - 14 15
NOTE: Different surfaces have different levels of risk, and therefore may require different thresholds. For example, porous plastic or rubber surfaces may be more difficult to clean than stainless steel surfaces, and therefore produce higher ATP test results. In this case, the user may choose to: 1) set thresholds higher for those harder-to-clean areas; or 2) intensify cleaning to bring ATP test results on those surfaces in line with other control points. This is up to the user. * NOTE: The Caution zone is useful for trend analysis and providing early warnings. However, users may opt to forgo the Caution zone and set the Fail limit 1 RLU more than the Pass limit. Any result over the Pass limit is then considered a failed result.
17

2.3.2 General Pass/Caution/Fail levels
For facilities that opt not to set their own ATP thresholds, Hygiena offers two general guidelines for threshold levels based on the type of surface being tested. These are common levels used for ATP hygiene monitoring, and are based on plate count and ATP correlation studies. They may or may not suit the standards at every facility. To determine independent ATP thresholds follow the “Routine Cleaning” or “Vigorous Cleaning” options described above.
a) Easy-to-clean surfaces
SystemSURE II General Thresholds
Easy-to-Clean Surfaces Pass Caution Fail
RLU < 10 11 – 19 > 20
PASS = Less than 10 RLU CAUTION = Between 11 and 19 RLU FAIL = Greater than 20 RLU
b) Hard-to-clean surfaces SystemSURE II
General Thresholds Hard-to-Clean Surfaces
Pass Caution Fail
RLU < 10 11 – 29 > 30
PASS = Less than 10 RLU CAUTION = Between 11 and 29 RLU FAIL = Greater than 30 RLU
18
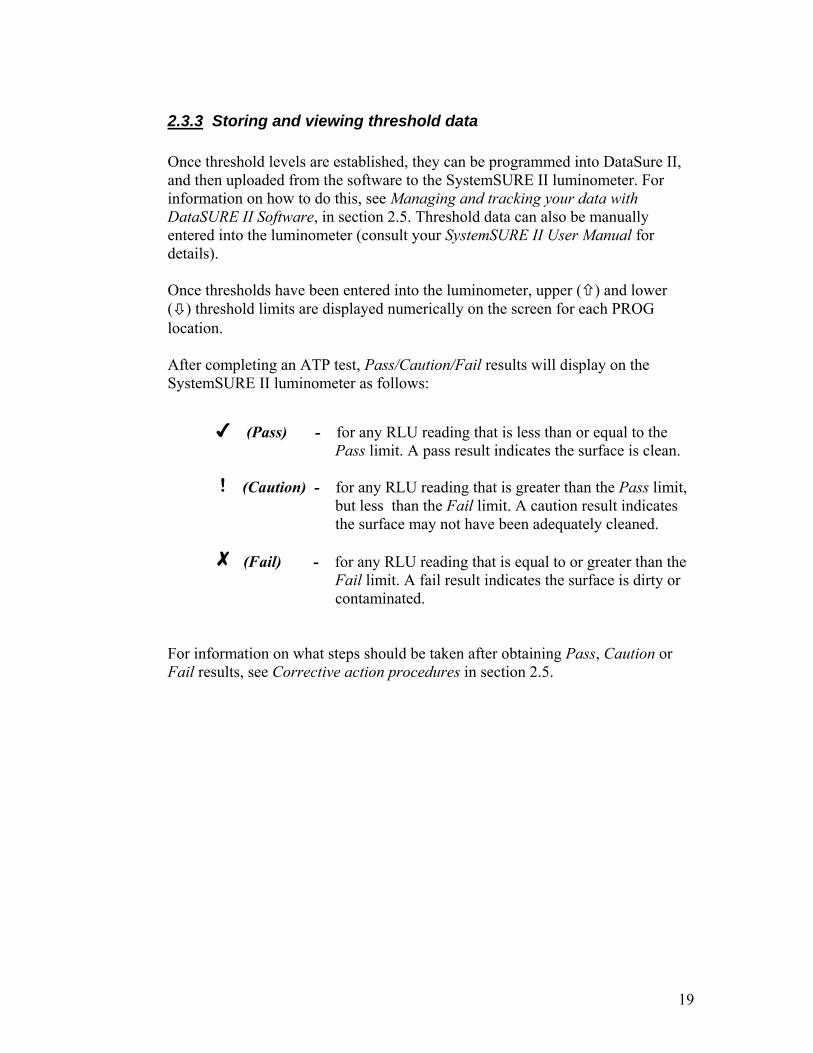
2.3.3 Storing and viewing threshold data Once threshold levels are established, they can be programmed into DataSure II, and then uploaded from the software to the SystemSURE II luminometer. For information on how to do this, see Managing and tracking your data with DataSURE II Software, in section 2.5. Threshold data can also be manually entered into the luminometer (consult your SystemSURE II User Manual for details). Once thresholds have been entered into the luminometer, upper ( ) and lower ( ) threshold limits are displayed numerically on the screen for each PROG location. After completing an ATP test, Pass/Caution/Fail results will display on the SystemSURE II luminometer as follows:
(Pass) - for any RLU reading that is less than or equal to the
Pass limit. A pass result indicates the surface is clean.
(Caution) - for any RLU reading that is greater than the Pass limit, but less than the Fail limit. A caution result indicates the surface may not have been adequately cleaned.
(Fail) - for any RLU reading that is equal to or greater than the
Fail limit. A fail result indicates the surface is dirty or contaminated.
For information on what steps should be taken after obtaining Pass, Caution or Fail results, see Corrective action procedures in section 2.5.
19
2.4 When to perform ATP testing
Once control points have been established and ATP threshold levels have been set, you should develop a sampling frequency plan.
Sampling frequency should be based on the level of contamination risk associated with the control point being tested. Factors determining the level of risk include:
surface robustness and susceptibility to contaminationdegree of difficulty to clean frequency of contact with product for food processors, number of types of food being processed on a machine, which increases the potential for cross-contamination and allergens
Critical (high-risk) control points should be tested on a daily basis, after each cleaning. You may also choose to test after product line changes, after daily/employee shift changes, and or any time prior to start-up. Lower-risk controlpoints may not need to be tested as frequently.
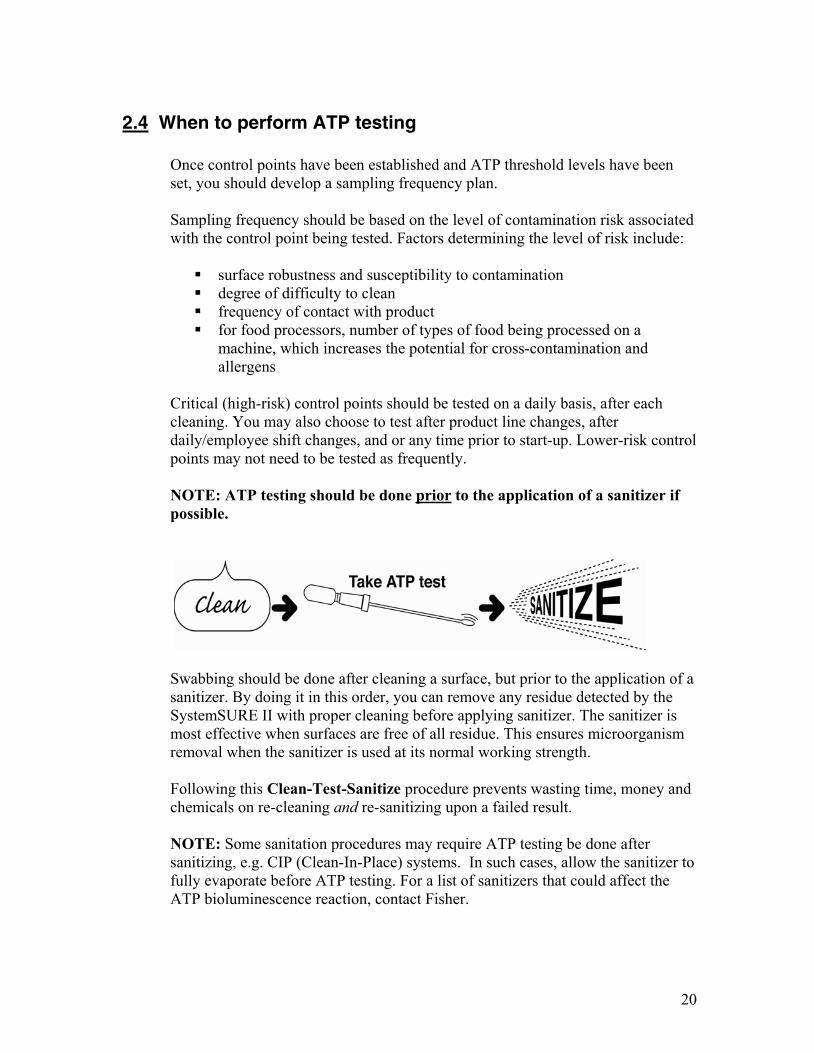
NOTE: ATP testing should be done prior to the application of a sanitizer if possible.
Swabbing should be done after cleaning a surface, but prior to the application of a sanitizer. By doing it in this order, you can remove any residue detected by the SystemSURE II with proper cleaning before applying sanitizer. The sanitizer is most effective when surfaces are free of all residue. This ensures microorganismremoval when the sanitizer is used at its normal working strength.
Following this Clean-Test-Sanitize procedure prevents wasting time, money and chemicals on re-cleaning and re-sanitizing upon a failed result.
NOTE: Some sanitation procedures may require ATP testing be done after sanitizing, e.g. CIP (Clean-In-Place) systems. In such cases, allow the sanitizer to fully evaporate before ATP testing. For a list of sanitizers that could affect the ATP bioluminescence reaction, contact Fisher.
20
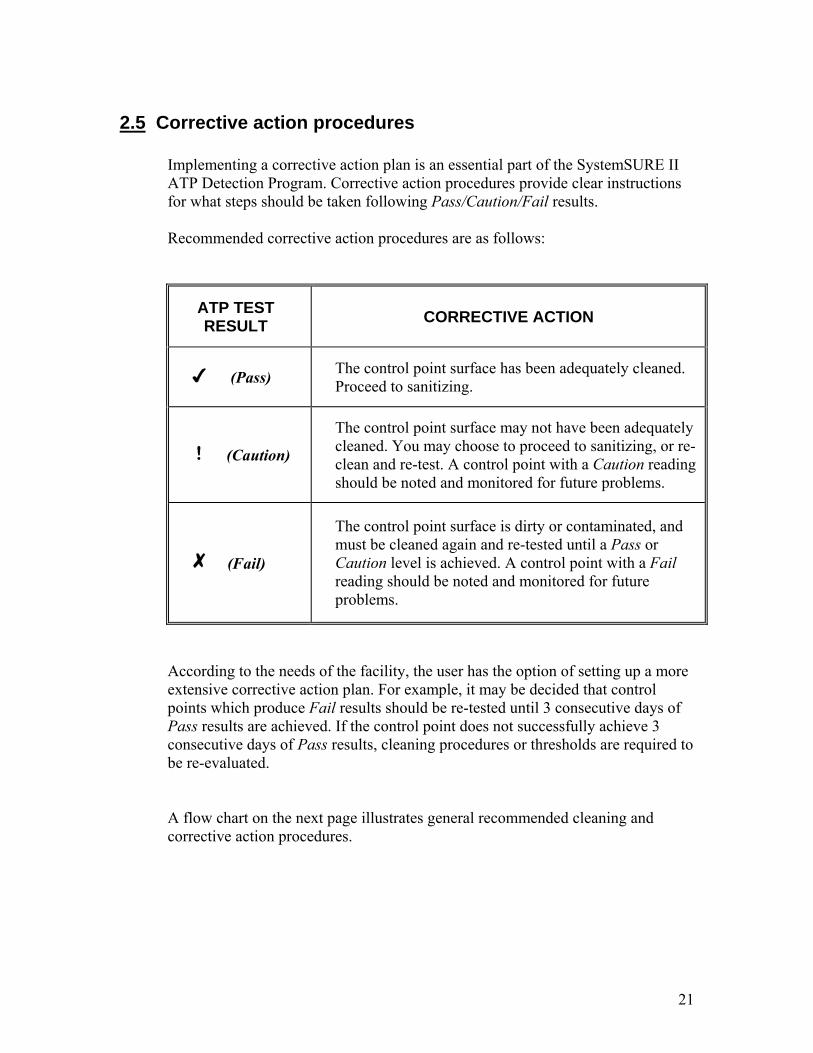
2.5 Corrective action procedures Implementing a corrective action plan is an essential part of the SystemSURE II ATP Detection Program. Corrective action procedures provide clear instructions for what steps should be taken following Pass/Caution/Fail results. Recommended corrective action procedures are as follows:
ATP TEST RESULT CORRECTIVE ACTION
(Pass) The control point surface has been adequately cleaned. Proceed to sanitizing.
(Caution)
The control point surface may not have been adequately cleaned. You may choose to proceed to sanitizing, or re-clean and re-test. A control point with a Caution reading should be noted and monitored for future problems.
(Fail)
The control point surface is dirty or contaminated, and must be cleaned again and re-tested until a Pass or Caution level is achieved. A control point with a Fail reading should be noted and monitored for future problems.
According to the needs of the facility, the user has the option of setting up a more extensive corrective action plan. For example, it may be decided that control points which produce Fail results should be re-tested until 3 consecutive days of Pass results are achieved. If the control point does not successfully achieve 3 consecutive days of Pass results, cleaning procedures or thresholds are required to be re-evaluated. A flow chart on the next page illustrates general recommended cleaning and corrective action procedures.
21

Flow Chart: Suggested Cleaning, Test and Correction Action Procedures
Check detergentconcentration is
within specification
Proceed with cleaning Control Points (CP)
Standardcleaningroutine
Post -cleaning visual examination
SystemSURE II ATP Detection
Test
Visibly soiled
Re-clean work area
Visibly clean
Perform rapid ATP hygiene confirmation Re-clean surface
PASS CAUTION FAIL
Continue on to sanitizing OR
No further action required
Re-clean & re-test CPOR
Continue
Repeat ATP test for confirmation. If CP
fails again, re-clean.
Sanitizing routine
Optional ATP test to confirm cleanliness
22
2.4 Continuous improvement The SystemSURE II ATP Detection Program is designed to aid organizations striving for continuous improvement of standards. Continuous improvement ensures excellence in product quality, while reducing inefficiencies, avoiding recalls, and showing due diligence and compliance to auditors. Analysis of ATP test result trends is key to the evaluation and ongoing improvement of the sanitation system in place. Using the DataSURE II Data Analysis software, you can monitor and assess ATP test results, perform trend analysis, identify trouble zones, correct improper cleaning procedures and eliminate risk. If trends show high numbers of Caution and Fail results in ATP testing, SSOPs should be reviewed by experts for ways to improve protocols. If low numbers of Caution and Fail results are obtained, Pass/Fail thresholds should be reviewed and lowered to maintain high standards and ensure continuous improvement. Pass, Caution and Fail thresholds should also be re-evaluated every year and whenever procedural changes are made. As sanitation procedures become more efficient and effective, thresholds should be adjusted to ensure your facility is operating to its maximum potential.
2.5 Managing and tracking your data with DataSURE II Software
ATP testing results should be regularly uploaded from the SystemSURE II luminometer to a PC and evaluated. Keeping meticulous records of test results makes it possible to identify problem areas, monitor trends and show due diligence to industry auditors and organization management. Hygiena provides two software options for data management with the SystemSURE II ATP Detection System. Both programs are user-friendly.
a) DataSURE II Data Analysis Software DataSURE II is a protected database system with the following functions:
Results are uploaded directly into the database.
The database can contain test results from one or more SystemSURE II luminometers.
Uploaded results cannot be altered, deleted or entered by hand, preventing false reporting.
23
Program (PROG) numbers and Pass/Fail levels can be entered and loaded onto the systemSURE II and stored.
Each program number can be described by location and “group”, allowing sub-categorization of test locations.
Reports can be run through a number of filtering options, allowing you to view results from specific dates, test locations, etc.
Reports can be individually saved as “Analysis Schemes” or deleted. If deleted, the data will still be available in the main database.
Reports can be viewed and printed as charts or colored graphs.
NOTE: Because DataSURE II is a protected program, results cannot be transferred to another computer, emailed or shared on a network. If sharing of files is required, you may prefer to use the SystemSURE II Results Upload Utility.
b) SystemSURE II Results Upload Utility
This is a Microsoft Excel-based program for simple storing of results. It is not protected like DataSURE II.
Results can be stored as individual Excel files each time they are uploaded
from the SystemSURE II luminometer.
Result files can be emailed, shared on a network and deleted.
Provides all the functionality of Excel for graphing and reporting.
24

2.5.1 Setting up Program Data and Location Information
After installing the DataSURE II software on your PC, you are ready to set up your Program Data and Location Information.
To start, click:
DataSURE II Data Analysis Software
Programs SystemSURE II
T
Otab
Windows Start Button
o add a new luminometer unit:
1. Connect the SystemSURE II luminometer to your PC, using the serial interface cable RS232 (refer to the DataSURE II User Manual for further details).
2. Turn on the SystemSURE II unit and select Set Up Program Data
from the UNIT menu.
3. A new window will open and from this window’s UNIT menu select Add New Unit and click the Connect button.
nce the unit has been added, for each Program (PROG) number you can specify
he test Location (ie: Hand Washing Station), the Group it belongs to (ie: Basin), nd Lower and Upper Threshold values by double clicking in the appropriate ox/field. See the spreadsheet below for an example:
Prog # Location Group Lower Upper 0 Calibration Control Point Calibration Control Point 10 30
1 Hand Washing Station Basin 10 30
2 Hand Washing Station On/Off Mechanism 10 30
3 Line A Elevator Belt 10 30
4 Line A Reject Bins 10 30
5 Line A Lower Belt 10 30
6 Line A Top Belt 10 30
7 Line A Up Conveyor 10 30
8 Line A Blades 10 30
9 Line A Flume 10 30
10 Line A Shaker 10 30
25
2.5.2 Writing threshold data to the SystemSURE II luminometer
To write threshold data from the database to the SystemSURE II luminometer:
1. Click on the relevant Unit # tab in the Set-up Program Data window.
2. Connect the luminometer to the PC using the serial interface cable.
3. Switch on the luminometer and select the Write Thresholds to Unit option from the UNIT menu.
The threshold data for PROGS 0 to 99 will then be sent to the SystemSURE II luminometer and stored in its internal memory. WARNING: This option will overwrite all the lower and upper PROG thresholds in the luminometer. Once overwritten, the old values cannot be recovered.
2.5.3 Uploading test results from the SystemSURE II luminometer To upload test results from the SystemSURE II luminometer to the DataSURE II database:
1. Select the Upload Test Results option from the UNIT menu. 2. Choose the correct Serial Port from the drop down list. Generally,
Laptops use COM1, Desktop PCs use COM2 and USB to RS232 adapters use COM3. Make sure the black serial interface cable is connected between the systemSURE II and your PC.
3. Turn on the SystemSURE II and click the Connect button in the
dialog window on your PC. The new test results will be uploaded from the systemSURE II unit and stored in the database.
4. A dialogue box will appear on your screen giving you the option to
erase the uploaded test results from the memory of the SystemSURE II unit. If you choose not to erase the results from the unit, they can be manually erased later.
26
2.5.4 Producing trend analysis graphs and reports with the Data Analysis Tool
The main feature of the DataSURE II software is the powerful Data Analysis Tool. This tool allows you to create and store specific data analysis schemes that filter and analyze the database results to produce user-specific trend and exception reports. Each analysis scheme can be as simple or as complex as necessary to meet the needs of the user; and as there is no limit to the number of schemes that can be stored. You can also easily create new schemes by copying and modifying any existing ones.
As the database maintains a record of all test results uploaded from the SystemSURE II unit over time, the analysis schemes can be re-run at any time to generate up-to date reports or to re-review old data. For more information on setting up analysis schemes, see the DataSure II User Manual.
27
SECTION 3: Further help
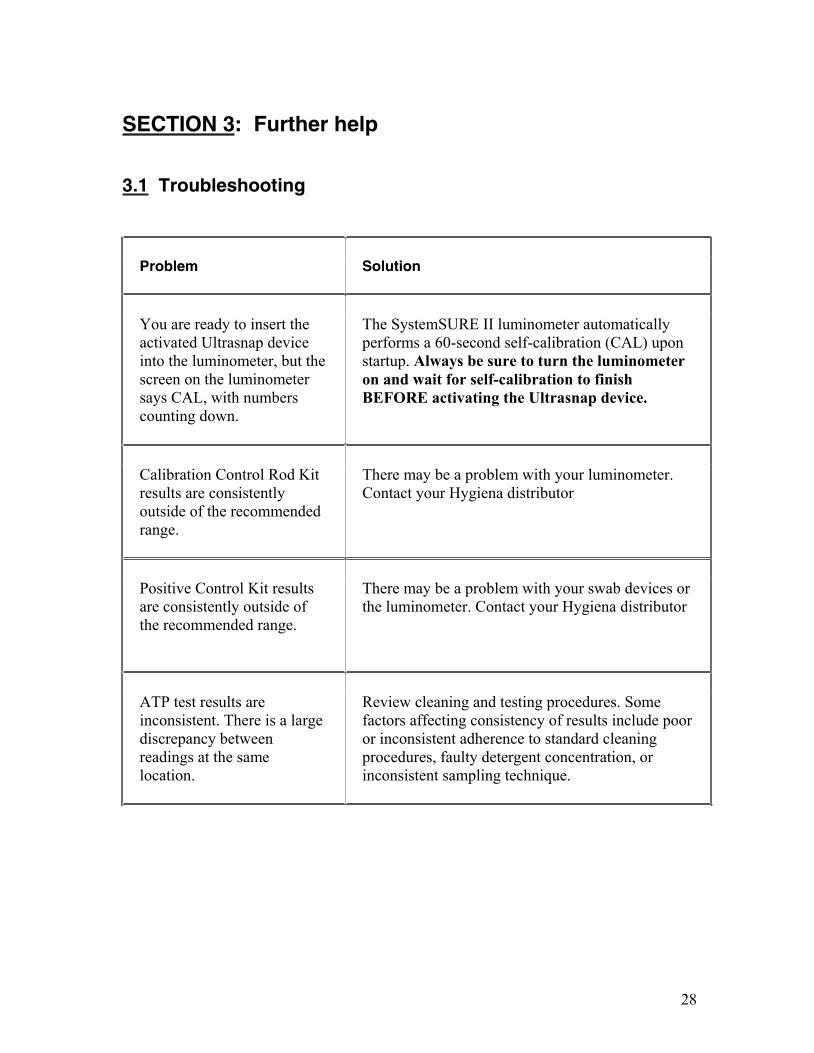
3.1 Troubleshooting
Problem Solution
You are ready to insert the activated Ultrasnap deviceinto the luminometer, but the screen on the luminometersays CAL, with numberscounting down.
The SystemSURE II luminometer automaticallyperforms a 60-second self-calibration (CAL) upon startup. Always be sure to turn the luminometeron and wait for self-calibration to finish BEFORE activating the Ultrasnap device.
Calibration Control Rod Kit results are consistentlyoutside of the recommendedrange.
There may be a problem with your luminometer.Contact your Hygiena distributor
Positive Control Kit resultsare consistently outside of the recommended range.
There may be a problem with your swab devices or the luminometer. Contact your Hygiena distributor
ATP test results areinconsistent. There is a large discrepancy between readings at the samelocation.
Review cleaning and testing procedures. Somefactors affecting consistency of results include poor or inconsistent adherence to standard cleaningprocedures, faulty detergent concentration, or inconsistent sampling technique.
28
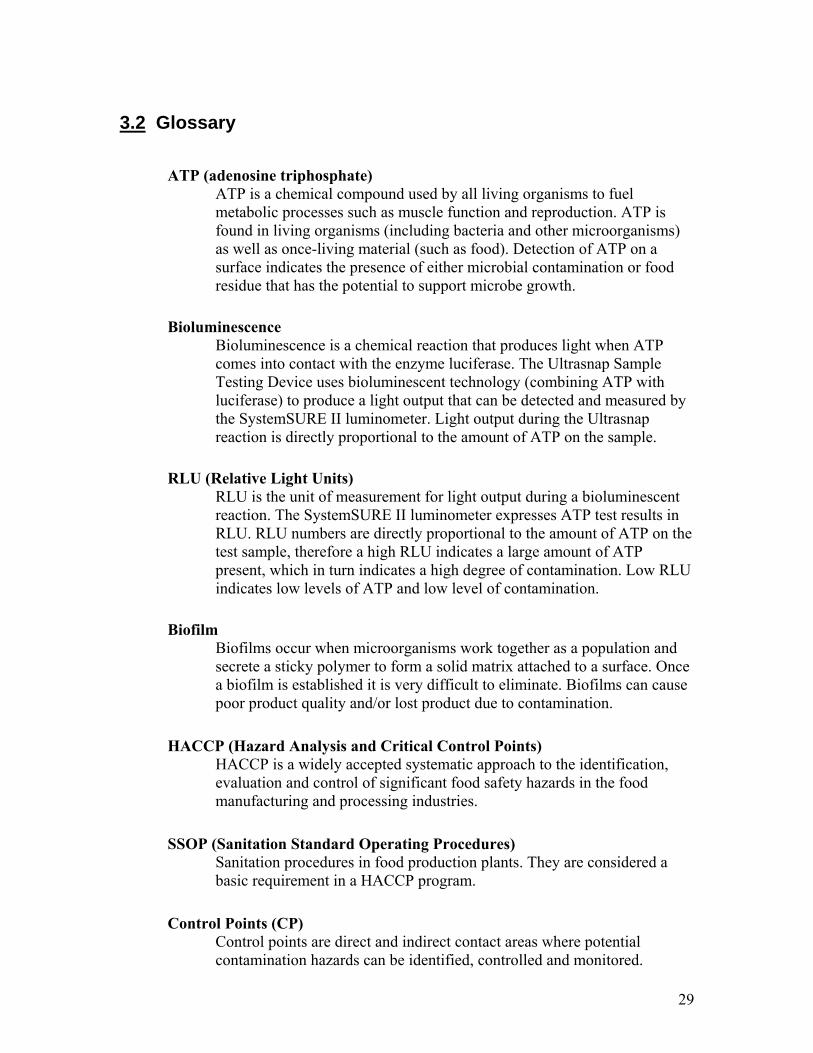
3.2 Glossary
ATP (adenosine triphosphate) ATP is a chemical compound used by all living organisms to fuel metabolic processes such as muscle function and reproduction. ATP is found in living organisms (including bacteria and other microorganisms) as well as once-living material (such as food). Detection of ATP on a surface indicates the presence of either microbial contamination or food residue that has the potential to support microbe growth.
Bioluminescence Bioluminescence is a chemical reaction that produces light when ATP
comes into contact with the enzyme luciferase. The Ultrasnap Sample Testing Device uses bioluminescent technology (combining ATP with luciferase) to produce a light output that can be detected and measured by the SystemSURE II luminometer. Light output during the Ultrasnap reaction is directly proportional to the amount of ATP on the sample.
RLU (Relative Light Units) RLU is the unit of measurement for light output during a bioluminescent
reaction. The SystemSURE II luminometer expresses ATP test results in RLU. RLU numbers are directly proportional to the amount of ATP on the test sample, therefore a high RLU indicates a large amount of ATP present, which in turn indicates a high degree of contamination. Low RLU indicates low levels of ATP and low level of contamination.
Biofilm Biofilms occur when microorganisms work together as a population and secrete a sticky polymer to form a solid matrix attached to a surface. Once a biofilm is established it is very difficult to eliminate. Biofilms can cause poor product quality and/or lost product due to contamination.
HACCP (Hazard Analysis and Critical Control Points) HACCP is a widely accepted systematic approach to the identification, evaluation and control of significant food safety hazards in the food manufacturing and processing industries.
SSOP (Sanitation Standard Operating Procedures) Sanitation procedures in food production plants. They are considered a basic requirement in a HACCP program.
Control Points (CP) Control points are direct and indirect contact areas where potential contamination hazards can be identified, controlled and monitored.
29
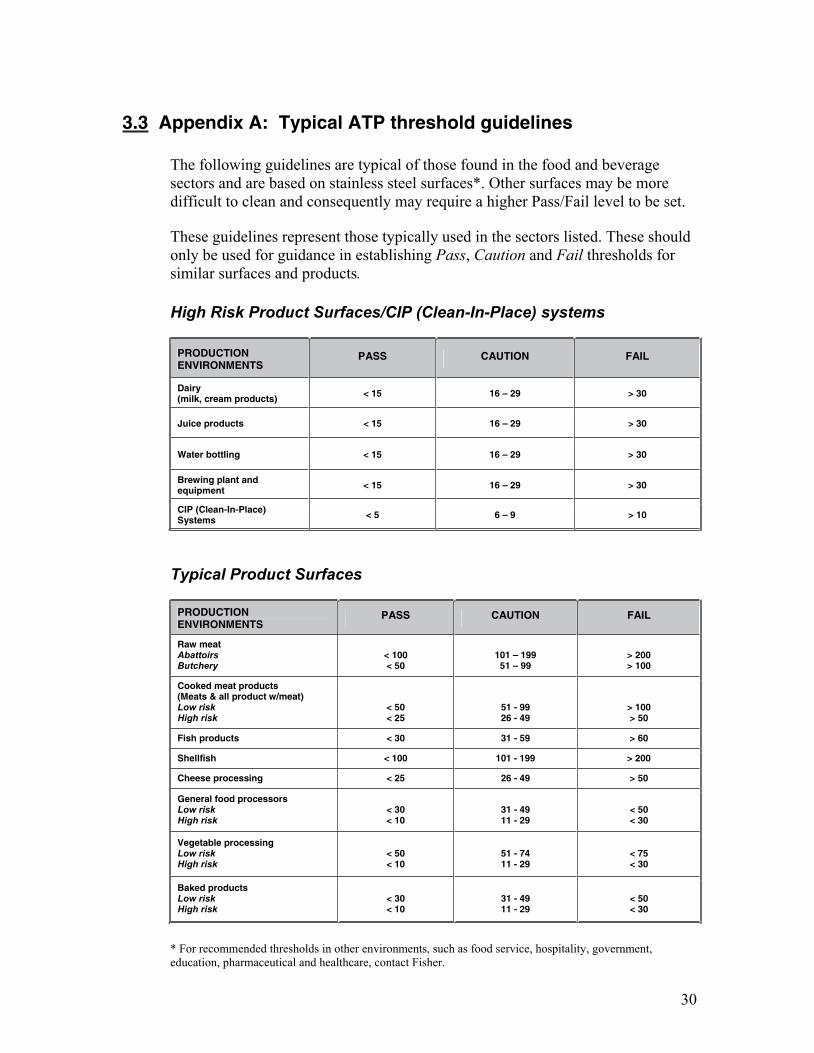
3.3 Appendix A: Typical ATP threshold guidelines
The following guidelines are typical of those found in the food and beverage sectors and are based on stainless steel surfaces*. Other surfaces may be more difficult to clean and consequently may require a higher Pass/Fail level to be set.
These guidelines represent those typically used in the sectors listed. These should only be used for guidance in establishing Pass, Caution and Fail thresholds forsimilar surfaces and products.
High Risk Product Surfaces/CIP (Clean-In-Place) systems
PRODUCTIONENVIRONMENTS
PASS CAUTION FAIL
Dairy(milk, cream products) < 15 16 – 29 > 30
Juice products < 15 16 – 29 > 30
Water bottling < 15 16 – 29 > 30
Brewing plant andequipment < 15 16 – 29 > 30
CIP (Clean-In-Place)Systems < 5 6 – 9 > 10
Typical Product Surfaces
PRODUCTIONENVIRONMENTS
PASS CAUTION FAIL
Raw meat AbattoirsButchery
< 100 < 50
101 – 199 51 – 99
> 200 > 100
Cooked meat products(Meats & all product w/meat)Low riskHigh risk
< 50 < 25
51 - 99 26 - 49
> 100 > 50
Fish products < 30 31 - 59 > 60
Shellfish < 100 101 - 199 > 200
Cheese processing < 25 26 - 49 > 50
General food processorsLow riskHigh risk
< 30 < 10
31 - 49 11 - 29
< 50 < 30
Vegetable processingLow riskHigh risk
< 50 < 10
51 - 74 11 - 29
< 75 < 30
Baked productsLow riskHigh risk
< 30 < 10
31 - 49 11 - 29
< 50 < 30
* For recommended thresholds in other environments, such as food service, hospitality, government,education, pharmaceutical and healthcare, contact Fisher.
30
3.4 Other Hygiena products
SnapShot A universal ATP swab designed for luminometers from other manufacturers. No need to change threshold settings on the luminometer being used. Made with a unique liquid-stable reagent to yield more accurate and consistent results.
Aquasnap A user-friendly, self-contained ATP water sampling device used with the systemSURE II and Pi-102 luminometers.
Pi-102 An affordable multifunctional luminometer using traditional photo-multiplier tube technology. For use with cuvettes or all-in-one reagent devices such as Ultrasnap or Snapshot. Suitable for bioluminescence and chemiluminescence assays.
Biomass Control Kit An easy-to-use system for real-time monitoring of water quality and product contamination. Comes with sample tubes that can be read in the Pi-102.
SpotCheck A surface hygiene swab that detects glucose when food residue is present. Requires no instrumentation. The self-contained reagent turns from clear to green.
SpotCheck Plus SpotCheck Plus detects lactose and glucose residue in under 60 seconds. Presence of either substance is indicated by a color change of a self-contained reagent. Requires no instrumentation.
PRO-Clean PRO-Clean detects protein residues left on a surface after cleaning. PRO-Clean quickly validates the hygiene of a surface, allowing immediate corrective action to be taken if necessary.
Q-Swab Increase productivity and efficiency while reducing lab costs by using Q-swab for your environmental monitoring needs. Q-swab comes with multiple 1ml buffer formulations for optimal recovery of bacteria. No need for broth preparation. QD-Loop All-in-one sterile system for accurate and convenient volumetric dilutions. Designed with patented Snap-Valve technology. Devices are calibrated for 1/10, 1/100 or 1/1000 dilutions.
31

3.5 Contact Information
For any questions about the SystemSURE II ATP Detection Program, or for moreinformation on Hygiena products, please contact your Fisher representative or Fisher marketing department at:
Fisher Scientific Company
Marketing 112 Colonnade RoadOttawa, Ontario K2E 7L6 Tel: (613)-226-8874 Toll-free: 1-800-267-1000Fax: (613) (613)-226-8639
Fisher web site / Hygiena interactive demos
You can find additional information and interactive product demonstrations by searching for Hygiena at www.fishersci.ca.
32