table c overview, 2003 final '03 b · tasas table c potential investigation locations report...
TRANSCRIPT

TABLE C TASK FORCE
SUMMARY REPORT
OF TASK FORCE’S FINDINGS AND RECOMMENDATIONS
September, 2002
Table of Contents Introduction . . . . . . . . . . . . . . . . . . . . . . . . . . . . . . . . . . . . . . . . . . . . . . . . . . . . 2
Background . . . . . . . . . . . . . . . . . . . . . . . . . . . . . . . . . . . . . . . . . . . . . . . . . . . . 2
Committee’s Process . . . . . . . . . . . . . . . . . . . . . . . . . . . . . . . . . . . . . . . . . . . . . . 3
Recommendations . . . . . . . . . . . . . . . . . . . . . . . . . . . . . . . . . . . . . . . . . . . . . . . . 3
Attachment List . . . . . . . . . . . . . . . . . . . . . . . . . . . . . . . . . . . . . . . . . . . . . . . . . . 5
Table C and Wet Table C Overview . . . . . . . . . . . . . . . . . . . . . . . . . . . . . . . . . . 6
Appendix A: “N” Area Diagram . . . . . . . . . . . . . . . . . . . . . . . . . . . . . . 12
Appendix B: Intersection Rate Groups . . . . . . . . . . . . . . . . . . . . . . . . . 13
Appendix C: Ramp Rate Groups . . . . . . . . . . . . . . . . . . . . . . . . . . . . . 14
Appendix D: Highway Rate Groups . . . . . . . . . . . . . . . . . . . . . . . . . . 17
Appendix E: Wet Pavement Factors for Safety Evaluation . . . . . . . . . . 20
Table C Web-Based Survey and Results . . . . . . . . . . . . . . . . . . . . . . . . . . . . . 21
Table C Time and Cost Estimate . . . . . . . . . . . . . . . . . . . . . . . . . . . . . . . . . . . . 32
Preliminary Review of Required Highway Locations . . . . . . . . . . . . . . . . . . . 33
Table C Proposed Improvement Locations . . . . . . . . . . . . . . . . . . . . . . . . . . . . . 37
Table C Combined Adjacent Required Highway Locations . . . . . . . . . . . . . . . 38
TASAS Table C Potential Investigations Locations Report . . . . . . . . . . . . . . . 39
1 Table C Task Force Summary

INTRODUCTION In April, 1999, the Table C Task Force was formed with the purpose of improving the criteria or mechanism used for identifying high collision concentration locations for safety improvements. Table C is a data report table extract from TASAS. Task Force members included representatives from both Headquarters (HQ) and District Traffic Safety Investigations, Multidisciplinary Accident Investigation Team, HQ Traffic Safety Program, and HQ Traffic Accident Surveillance and Analysis System (TASAS). The Task Force studied the current TASAS Table C methodology and considered possible improvements. The results of the study are a number of short-term recommendations to improve the existing Table C. An additional recommendation is that research be done on determining what criteria or mechanism should be used for identifying high collision concentration locations for safety improvements and that the research effort should not be constrained to the Table C methodology but should consider alternate ways of identifying high collision concentrations.
BACKGROUND
There are approximately 170,000 reported collisions on California highways annually. The Department’s goal is to reduce the rate and severity of collisions and minimize property damage. To achieve this goal, high collision concentration locations are investigated to determine probable causes and to recommend safety improvements for each specific location.
All reported collisions are filed by the California Highway Patrol (CHP) on a Traffic Collision Report 555 and entered into the Statewide Integrated Traffic Records System (SWITRS). Collision data for collisions occurring on the State highway system are submitted for TASAS input. Table C is a quarterly report, which uses segmental selection criteria combined with statistical analysis to identify the high collision concentration locations on the State highway system. Table C report is run on TASAS to generate a list of collision concentrations. Traffic investigators receive a Table C report quarterly and review the high collision concentration locations then recommend safety improvements as appropriate. There are 170 traffic safety investigators in Caltrans who process 10,000 locations annually and initiate 700 improvements annually. Traffic investigators also receive an annual Wet Table C that identifies high wet pavement collision concentration locations.
2 Table C Task Force Summary

COMMITTEE’S PROCESS
The Table C Task Force used the basic tools available in a standard Total Quality Management process. The following actions were undertaken by this task force:
• The current Table C screening process was identified and documented including the different factors used in the analysis (see attachment 1).
• The Task Force identified deficiencies of the current Table C process.
• Using the identified deficiencies as a guide, a questionnaire was developed and distributed to the 12 District Traffic Safety units for their input.
• The results from the survey were analyzed, categorized, and prioritized.
• Several brainstorming sessions were held to develop solutions to the survey results.
• The solutions were then categorized into two groups – easy to address, or short term issues, and long term, or more difficult to address, issues.
• The Task Force agreed to adopt the short-term solutions and to move forward on finding long-term solutions through research projects.
• A presentation has been developed to promote the Task Force’s findings and recommendations.
• Research proposals have been submitted by the Task Force.
RECOMMENDATIONS
The Table C Task Force has developed short-term and long-term recommendations to help develop the Department’s methodology to be more effective in identifying the locations with the highest need for investigations and safety improvements. The short-term recommendations are termed as such because there is not any modification needed to the selection of collision locations in the existing Table C program. These short-term recommendations will be implemented by utilizing additional screening processes after the selection of the identified locations. Short-term Table C recommendations: 1. Identify and Eliminate Repeat Locations
Repeat locations are defined as 100% the same postmile limits as any “required” location identified during the previous 3 quarters. Repeat locations will be screened out and will not be included in the list sent to the districts for investigations.
3 Table C Task Force Summary

2. Identify and Eliminate Overlap Locations Overlap locations are defined as an overlapping segment of 51% to 99.99% with any “required” location identified during the previous 3 quarters. Overlap locations will be screened out and not sent to the districts.
3. Combine Adjacent Highway Locations
These locations are defined as highway segments that are adjacent to one another. The adjacent locations will be combined in the report to the districts and will be done in a single investigation. Combined locations will not exceed 1 mile in length.
4. Send out only “Required” Locations Only those locations marked with a “Req” will be sent to the districts.
5. Update Intersection Traffic Volume
Update intersection traffic volume.
Another recommendation is to update the % wet-time table. This table is utilized in the generation of the Wet Table C and was established using an 11-year weather record period from 1957-1967. This has been submitted as a research proposal. Long-term Table C Recommendations:
The team also developed a list of long-term Table C recommendations. These
are defined as long- term because these recommendations will need further research performed to see if Table C is correctly identifying the locations with the greatest need for safety improvements.
Recommendations requiring future research on how to modify the selection criteria to make Table C a more effective tool are listed below; 1. Modify the selection criteria – Minimum number of collisions and statistical
significance threshold could be evaluated. 2. Weigh the severity of collisions: fatal, injury, property damage only – Should
there be a prioritization for investigations by placing a weighted factor on collisions by severity?
3. Analyze the segment by collision or revise length – Should the selection of location be made on the location of collisions and/or collision rate and not constrained by the segment length of 0.2 mile?
4 Table C Task Force Summary
Attachments 1. Table C and Wet Table C Overview Appendix A: “N” Area Diagram
Appendix B: Intersection Rate Groups Appendix C: Ramp Rate Groups Appendix D: Highway Rate Groups Appendix E: Wet Pavement Factors for Safety Evaluation
2. Table C Web-Based Survey and Results 3. Table C Time and Cost Estimate 4. Preliminary Review of Required Highway Locations 5. Table C Proposed Improvement Locations 6. Table C Combined Adjacent Required Locations 7. TASAS Table C Potential Investigation Locations Report
5 Table C Task Force Summary

Attachment #1
TTAABBLLEE CC AANNDD WWEETT TTAABBLLEE CC ((TTAASSAASS LLEEGGAACCYY SSYYSSTTEEMM)) -- OOVVEERRVVIIEEWW
I. Purpose The purpose of this document is to educate the reader on the analytical procedure of Table C and Wet Table C on TASAS database. II. Introduction The purpose of Table C is to identify the ramps, intersections and highway segments with accident rates which are significantly higher than the statewide average in 36, 24, 12, 6, and 3 months period. The purpose and the analysis procedure of Wet Table C is same as Table C but Wet Table C is a separate report which analyze the wet accident data only. Normal business practice is to generate the Table C quarterly and Wet Table C annually, but it can also be generated by special request. III. Analysis Procedure The significance test is performed for intersections, ramps and highway segments. The process begins at the beginning of the route within a district and the first 0.2 miles segment is analyzed. The analysis process continues until the end of the route is reached. See the Flow Chart 1 for Analysis Process of Table C and Wet Table C. The established criteria for Table C and Wet Table C is: • analyzes 0.2 miles segments of highway at a time • 99.5 percent of significance factor Output If the locations have 4 or more accidents and are significant in either the 3, 6, or 12 months period then the locations are labeled “REQ” in the output table. Accident investigators are required to investigate those locations. Intersection Analysis When the intersections are encountered on the roadway, the accident data within the “N” Area (usually 250’), Zone 5 and Zone 6 will be included in the intersection analysis, see the definition of “N” Area, Zone 5 and Zone 6 in Appendix A. The program will determine the appropriate Intersection Rate Group and perform the significance test. If the intersection is found to be significant, it is added to an output table. Currently, there are 30 types of Intersection Rate Groups, see Appendix B. Ramp Analysis When ramps are encountered on the roadway, only ramp accident data will be included in the Ramp Analysis. The program will determine the appropriate Ramp Rate Group and perform the significance test. If the ramp is found to be significant, it is added to an output table. Currently, there are 80 types of Ramp Rate Groups, see Appendix C.
6 Table C Task Force Summary

Highway Analysis The accidents, not included in Intersection Analysis and Ramp Analysis, will be used in Highway Analysis. Same as Ramp and Intersection Analysis, the program will identify the Highway Rate Group and perform the significance test. When the segment is not found to be significant, it moves ahead 0.1 of the 0.2 mile segment length (0.02 miles) and continues the analysis process, see Flow Chart 1 for Analysis Process of Table C. When the segment is found to be significant, it is added to an output table and it moves ahead to the end of that segment and begins a new segment (See Figure III-1).
When the Highway Rate Group (type of highway) changes along the highway, the analysis process will stop and restart at the beginning segment of next Highway Rate Group (See Figure III-2). Currently, there are 67 types of Highway Rate Groups, see Appendix D.
Beginning of Route
Highway Rate Group 2
0.2 mile 0.2 mile
Move 0.02 mile ahead Start a new segment when the Highway Rate Group changes
Highway
Beginning of Route
0.2 mile
Move 0.02 mile ahead
Segment to be found as significant
0.2 mile
Start a new segment
Highway
Figure III-1
Figure III-2
7 Table C Task Force Summary

The accidents, in the “N” area, have already been analyzed in Intersection Analysis and will not be analyzed in the Highway Analysis. When the segment reaches the “N” area of an intersection, the analysis process will stop and restart beyond the “N” area (See Figure III-3).
“N” Area
0.2 mile 0.2 mile
Move 0.02 mile ahead Start a new segment
Beginning of Route
Highway
Figure III-3
Intersection
8 Table C Task Force Summary

Flow Chart 1: Analysis Process of Table C and Wet Table C Start from Beginning of Route with first 0.2 mile
Intersection ?
Ramp?
Significant ?
Move ahead 0.1 of segment length (typical 0.02 mile for 0.2 mile segment)
End of Route ?
Included the “N” area (250’), Zone 5 and Zone 6
Print output
Move to the end of that segment
Yes
Yes
No
No
Yes
No
No
Intersection Analysis
Ramp Analysis
Highway Analysis
Significant ? Print output
Significant ? Print output
No
Yes
No
Yes
Same Rate Group? Move to beginning of next Rate Group
Yes
No
End
Yes
Inside “N” Area? Move beyond “N” Area
No
Yes Yes
9 Table C Task Force Summary

IV. Significance Test & Number of Accidents Required for Significance (High NR) Significance test is to determine if the defined highway segments, ramps or intersections have an accident count which is significantly higher than the Number of Accidents Required for Significance (NR). Number of Accidents Required for Significance (NR) is found for each confidence level to be tested using the following formulae, which were derived from the Poisson’s Distribution One-Tail Test with appropriate correction factor. 99.5% confidence level is used for Table C and Wet Table C. % Confidence Level High NR Comment 90% NE + 1.282(NE)1/2 + 0.705 92.5% NE + 1.440(NE)1/2 + 0.795 95% NE + 1.645(NE)1/2 + 0.838 97.5% NE + 1.960(NE)1/2 + 0.980 99.5% NE + 2.576(NE)1/2 + 1.329 Use for Table C Thus, to be significantly high, an accident count must be equal to or larger than High NR. Calculation for Average Number of Accidents (NE ) NE = ADT x t x L x RE ÷ 106
ADT = Average Daily Traffic, vehicle per day t = time, in days = #quarters x days/quarter (Table C) x days/time period (Table B) L = length, in miles (= l for Ramps and Intersections) RE = Average Accident Rate, in accident/million vehicle(ACCS/MV) or accident/million vehicle
mile (ACCS/MVM) = Base Rate + ADT factor
Based on the type of facility, each type of highway, ramp or intersection is placed in a Rate Group. Each Rate Group has Base Rate and ADT factor that are determined by looking at all accidents in a three year time period. (See Appendix B, C, &D for the Rate Group of Intersection, Ramp, and Highway).
Note, that Average Number of Accidents (NE) is a linear function of several variables, each equally affecting NE. If time and rate are equal, then NE’s are equal if: ADT = 10,000 and L=0.2 And if ADT = 20,000 and L = 0.1
10 Table C Task Force Summary

For Wet Table C The significance test is same as Table C except the RE converts to RE(Wet) to include the wet factor. RE(wet) = Average Wet Accident Rate, in wet accident/million vehicle(ACCS/MV) or wet
accident/million vehicle mile (ACCS/MVM) = 0.3(1-wt%)+3.2(RE) 1+2.2(wt%) wt% = percentage of wet time, in decimal. See Appendix E for % wet time of different county. Then NE and High NR should be calculated by the RE(Wet).
11 Table C Task Force Summary

Appendix A: “N” Area Diagram
12 Table C Task Force Summary
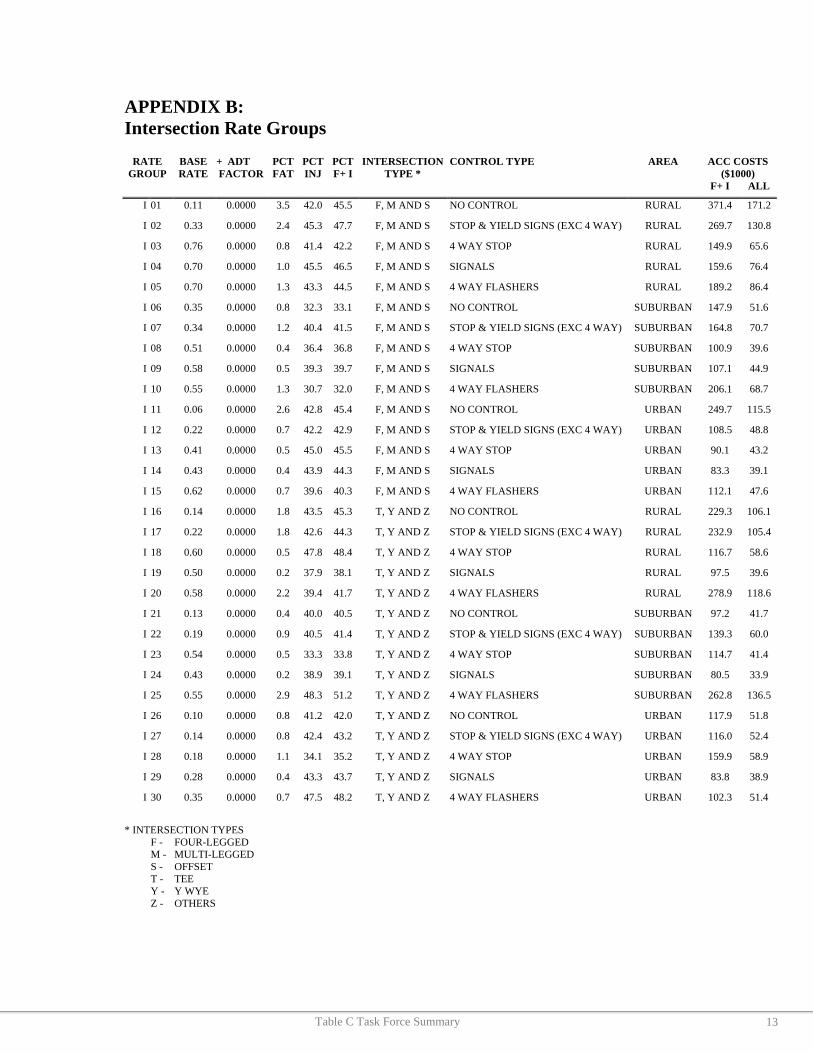
APPENDIX B: Intersection Rate Groups
RATE GROUP
BASE RATE
+ ADT FACTOR
PCT FAT
PCT INJ
PCTF+ I
INTERSECTIONTYPE *
CONTROL TYPE AREA ACC COSTS ($1000)
F+ I ALL
I 01 0.11 0.0000 3.5 42.0 45.5 F, M AND S NO CONTROL RURAL 371.4 171.2
I 02 0.33 0.0000 2.4 45.3 47.7 F, M AND S STOP & YIELD SIGNS (EXC 4 WAY) RURAL 269.7 130.8
I 03 0.76 0.0000 0.8 41.4 42.2 F, M AND S 4 WAY STOP RURAL 149.9 65.6
I 04 0.70 0.0000 1.0 45.5 46.5 F, M AND S SIGNALS RURAL 159.6 76.4
I 05 0.70 0.0000 1.3 43.3 44.5 F, M AND S 4 WAY FLASHERS RURAL 189.2 86.4
I 06 0.35 0.0000 0.8 32.3 33.1 F, M AND S NO CONTROL SUBURBAN 147.9 51.6
I 07 0.34 0.0000 1.2 40.4 41.5 F, M AND S STOP & YIELD SIGNS (EXC 4 WAY) SUBURBAN 164.8 70.7
I 08 0.51 0.0000 0.4 36.4 36.8 F, M AND S 4 WAY STOP SUBURBAN 100.9 39.6
I 09 0.58 0.0000 0.5 39.3 39.7 F, M AND S SIGNALS SUBURBAN 107.1 44.9
I 10 0.55 0.0000 1.3 30.7 32.0 F, M AND S 4 WAY FLASHERS SUBURBAN 206.1 68.7
I 11 0.06 0.0000 2.6 42.8 45.4 F, M AND S NO CONTROL URBAN 249.7 115.5
I 12 0.22 0.0000 0.7 42.2 42.9 F, M AND S STOP & YIELD SIGNS (EXC 4 WAY) URBAN 108.5 48.8
I 13 0.41 0.0000 0.5 45.0 45.5 F, M AND S 4 WAY STOP URBAN 90.1 43.2
I 14 0.43 0.0000 0.4 43.9 44.3 F, M AND S SIGNALS URBAN 83.3 39.1
I 15 0.62 0.0000 0.7 39.6 40.3 F, M AND S 4 WAY FLASHERS URBAN 112.1 47.6
I 16 0.14 0.0000 1.8 43.5 45.3 T, Y AND Z NO CONTROL RURAL 229.3 106.1
I 17 0.22 0.0000 1.8 42.6 44.3 T, Y AND Z STOP & YIELD SIGNS (EXC 4 WAY) RURAL 232.9 105.4
I 18 0.60 0.0000 0.5 47.8 48.4 T, Y AND Z 4 WAY STOP RURAL 116.7 58.6
I 19 0.50 0.0000 0.2 37.9 38.1 T, Y AND Z SIGNALS RURAL 97.5 39.6
I 20 0.58 0.0000 2.2 39.4 41.7 T, Y AND Z 4 WAY FLASHERS RURAL 278.9 118.6
I 21 0.13 0.0000 0.4 40.0 40.5 T, Y AND Z NO CONTROL SUBURBAN 97.2 41.7
I 22 0.19 0.0000 0.9 40.5 41.4 T, Y AND Z STOP & YIELD SIGNS (EXC 4 WAY) SUBURBAN 139.3 60.0
I 23 0.54 0.0000 0.5 33.3 33.8 T, Y AND Z 4 WAY STOP SUBURBAN 114.7 41.4
I 24 0.43 0.0000 0.2 38.9 39.1 T, Y AND Z SIGNALS SUBURBAN 80.5 33.9
I 25 0.55 0.0000 2.9 48.3 51.2 T, Y AND Z 4 WAY FLASHERS SUBURBAN 262.8 136.5
I 26 0.10 0.0000 0.8 41.2 42.0 T, Y AND Z NO CONTROL URBAN 117.9 51.8
I 27 0.14 0.0000 0.8 42.4 43.2 T, Y AND Z STOP & YIELD SIGNS (EXC 4 WAY) URBAN 116.0 52.4
I 28 0.18 0.0000 1.1 34.1 35.2 T, Y AND Z 4 WAY STOP URBAN 159.9 58.9
I 29 0.28 0.0000 0.4 43.3 43.7 T, Y AND Z SIGNALS URBAN 83.8 38.9
I 30 0.35 0.0000 0.7 47.5 48.2 T, Y AND Z 4 WAY FLASHERS URBAN 102.3 51.4
* INTERSECTION TYPES F - FOUR-LEGGED M - MULTI-LEGGED S - OFFSET T - TEE Y - Y WYE Z - OTHERS
13 Table C Task Force Summary

APPENDIX C: Ramp Rate Groups RATE
GROUP BASE RATE
+ ADT FACTOR
PCT FAT
PCT INJ
PCTF+ I
RAMP TYPE RAMP AREAS
ON/ OFF
AREA ACC COSTS ($1000)
F+ I ALL
R 01 0.30 0.0000 1.5 48.5 50.0 FRONTAGE ROAD 1-4 N/A RURAL 192.1 98.0
R 02 1.20 0.0000 0.5 28.6 29.1 FRONTAGE ROAD 1-4 N/A URBAN 111.4 35.3
R 03 0.35 0.0000 1.5 48.5 50.0 COLLECTOR ROAD 1-4 N/A RURAL 192.1 98.0
R 04 0.35 0.0000 0.5 28.6 29.1 COLLECTOR ROAD 1-4 N/A URBAN 111.4 35.3
R 05 0.70 0.0000 1.0 33.7 34.7 DIRECT, SEMI-DIR CONN (LT TRN TRAF) 1-4 OFF RURAL 187.6 67.7
R 06 0.60 0.0000 1.0 33.7 34.7 DIRECT, SEMI-DIR CONN (LT TRN TRAF) 1-4 OFF URBAN 151.6 55.2
R 07 0.35 0.0000 1.0 33.7 34.7 DIRECT, SEMI-DIR CONN (LT TRN TRAF) 1-4 ON RURAL 187.6 67.7
R 08 0.55 0.0000 1.0 33.7 34.7 DIRECT, SEMI-DIR-CONN (LT TRN TRAF) 1-4 ON URBAN 151.6 55.2
R 09 1.15 0.0000 1.2 36.1 37.3 DIAMOND 1-4 OFF RURAL 200.4 77.2
R 10 1.50 0.0000 0.3 40.1 40.4 DIAMOND 1-4 OFF URBAN 77.8 33.8
R 11 0.55 0.0000 1.2 36.1 37.3 DIAMOND 1-4 ON RURAL 200.4 77.2
R 12 0.80 0.0000 0.3 40.1 40.4 DIAMOND 1-4 ON URBAN 77.8 33.8
R 13 0.45 0.0000 1.3 35.0 36.3 SLIP 1-4 OFF RURAL 214.3 80.3
R 14 0.40 0.0000 0.4 38.3 38.7 SLIP 1-4 OFF URBAN 87.8 36.4
R 15 0.35 0.0000 1.3 45.0 46.3 SLIP 1-4 ON RURAL 184.7 87.7
R 16 0.35 0.0000 0.4 38.3 38.7 SLIP 1-4 ON URBAN 87.8 36.4
R 17 0.60 0.0000 1.0 31.2 32.2 DIRECT, SEMI-DIR CONN (RT TRN TRAF) 1-4 OFF RURAL 196.1 65.9
R 18 0.90 0.0000 0.7 35.5 36.2 DIRECT, SEMI-DIR CONN (RT TRN TRAF) 1-4 OFF URBAN 118.9 45.6
R 19 0.45 0.0000 1.1 34.2 35.3 DIRECT, SEMI-DIR CONN (RT TRN TRAF) 1-4 ON RURAL 196.5 72.0
R 20 0.60 0.0000 0.5 35.5 36.0 DIRECT, SEMI-DIR CONN (RT TRN TRAF) 1-4 ON URBAN 100.1 38.6
R 21 1.75 0.0000 0.9 42.2 43.1 LOOP WITH LEFT TURN 1-4 OFF RURAL 157.2 70.0
R 22 1.35 0.0000 0.3 36.9 37.2 LOOP WITH LEFT TURN 1-4 OFF URBAN 80.0 32.3
R 23 0.60 0.0000 0.9 42.2 43.1 LOOP WITH LEFT TURN 1-4 ON RURAL 157.2 70.0
R 24 0.85 0.0000 0.3 36.9 37.2 LOOP WITH LEFT TURN 1-4 ON URBAN 80.0 32.3
R 25 1.90 0.0000 0.7 34.8 35.5 BUTTONHOOK 1-4 OFF RURAL 152.8 56.8
R 26 1.15 0.0000 0.4 33.6 34.0 BUTTONHOOK 1-4 OFF URBAN 92.8 34.2
R 27 0.60 0.0000 0.7 34.8 35.5 BUTTONHOOK 1-4 ON RURAL 152.8 56.8
R 28 0.60 0.0000 0.4 33.6 34.0 BUTTONHOOK 1-4 ON URBAN 92.8 34.2
R 29 1.05 0.0000 1.5 36.2 37.7 SCISSORS 1-4 OFF RURAL 229.5 89.0
R 30 0.90 0.0000 0.3 34.6 34.9 SCISSORS 1-4 OFF URBAN 81.8 31.2
R 31 0.50 0.0000 1.5 36.2 37.7 SCISSORS 1-4 ON RURAL 229.5 89.0
R 32 0.55 0.0000 0.3 34.6 34.9 SCISSORS 1-4 ON URBAN 81.8 31.2
R 33 0.30 0.0000 2.0 64.7 66.7 SPLIT 1-4 OFF RURAL 192.0 129.4
R 34 0.25 0.0000 0.6 31.7 32.3 SPLIT 1-4 OFF URBAN 116.2 40.3
R 35 0.20 0.0000 2.0 48.0 50.0 SPLIT 1-4 ON RURAL 230.3 117.2
R 36 0.25 0.0000 0.6 31.7 32.3 SPLIT 1-4 ON URBAN 116.2 40.3
14 Table C Task Force Summary

APPENDIX C: Ramp Rate Groups (Continuous)
RATE GROUP
BASE RATE
+ ADT FACTOR
PCT FAT
PCT INJ
PCTF+ I
RAMP TYPE RAMP AREAS
ON/ OFF
AREA ACC COSTS ($1000)
F+ I ALL
R 37 1.25 0.0000 2.0 53.6 55.6 LOOP WITHOUT LEFT TURN 1-4 OFF RURAL 214.9 121.3
R 38 1.25 0.0000 0.2 33.7 33.9 LOOP WITHOUT LEFT TURN 1-4 OFF URBAN 72.5 27.2
R 39 0.65 0.0000 1.7 21.4 23.1 LOOP WITHOUT LEFT TURN 1-4 ON RURAL 358.7 85.9
R 40 0.70 0.0000 0.2 33.7 33.9 LOOP WITHOUT LEFT TURN 1-4 ON URBAN 72.5 27.2
R 41 1.20 0.0000 1.0 34.7 35.7 TWO-WAY RAMP SEGMENT 1-4 N/A RURAL 184.5 68.4
R 42 0.70 0.0000 1.0 34.7 35.7 TWO-WAY RAMP SEGMENT 1-4 N/A URBAN 148.8 55.7
R 43 1.25 0.0000 0.9 13.2 14.1 REST AREA, VISTA PT, TRK SCALE 1-4 OFF RURAL 321.4 48.8
R 44 1.15 0.0000 0.9 13.2 14.1 REST AREA, VISTA PT, TRK SCALE 1-4 OFF URBAN 272.3 41.8
R 45 0.35 0.0000 0.9 13.2 14.1 REST AREA, VISTA PT, TRK SCALE 1-4 ON RURAL 321.4 48.8
R 46 0.55 0.0000 0.9 13.2 14.1 REST AREA, VISTA PT, TRK SCALE 1-4 ON URBAN 272.3 41.8
R 47 1.35 0.0000 0.5 49.5 50.0 OTHER 1-4 OFF RURAL 115.6 59.8
R 48 0.80 0.0000 0.5 34.5 35.0 OTHER 1-4 OFF URBAN 101.5 38.1
R 49 0.40 0.0000 0.5 49.5 50.0 OTHER 1-4 ON RURAL 115.6 59.8
R 50 1.05 0.0000 0.5 34.5 35.0 OTHER 1-4 ON URBAN 101.5 38.1
R 51 2.50 0.0000 0.5 61.0 61.5 OTHER 1-4 N/A RURAL 108.5 68.3
R 52 0.95 0.0000 0.5 61.0 61.5 OTHER 1-4 N/A URBAN 80.2 50.9
R 53 0.75 0.0000 0.4 33.6 34.0 DIAMOND 1-3 OFF RURAL 122.4 44.2
R 54 0.90 0.0000 0.7 37.7 38.4 DIAMOND 1-3 OFF URBAN 115.1 46.6
R 55 0.50 0.0000 0.4 33.6 34.0 DIAMOND 1-3 ON RURAL 122.4 44.2
R 56 0.45 0.0000 0.7 37.7 38.4 DIAMOND 1-3 ON URBAN 115.1 46.6
R 57 0.30 0.0000 0.6 30.7 31.3 SLIP 1-3 OFF RURAL 150.7 49.9
R 58 0.20 0.0000 0.6 30.7 31.3 SLIP 1-3 OFF URBAN 118.3 39.8
R 59 0.15 0.0000 0.6 30.7 31.3 SLIP 1-3 ON RURAL 150.7 49.9
R 60 0.20 0.0000 0.6 30.7 31.3 SLIP 1-3 ON URBAN 118.3 39.8
R 61 0.30 0.0000 0.9 43.8 44.7 DIRECT, SEMI-DIR CONN (RT TRN TRAF) 1-3 OFF RURAL 154.4 71.2
R 62 0.45 0.0000 0.9 31.5 32.4 DIRECT, SEMI-DIR CONN (RT TRN TRAF) 1-3 OFF URBAN 148.0 50.6
R 63 0.40 0.0000 0.9 43.8 44.7 DIRECT, SEMI-DIR CONN (RT TRN TRAF) 1-3 ON RURAL 154.4 71.2
R 64 0.40 0.0000 0.9 31.5 32.4 DIRECT, SEMI-DIR CONN (RT TRN TRAF) 1-3 ON URBAN 148.0 50.6
R 65 3.20 0.0000 0.3 28.1 28.4 LOOP WITH LEFT TURN 1-3 OFF RURAL 117.8 36.3
R 66 1.20 0.0000 0.3 28.1 28.4 LOOP WITH LEFT TURN 1-3 OFF URBAN 88.6 28.0
R 67 0.45 0.0000 0.3 28.1 28.4 LOOP WITH LEFT TURN 1-3 ON RURAL 117.8 36.3
R 68 0.90 0.0000 0.3 28.1 28.4 LOOP WITH LEFT TURN 1-3 ON URBAN 88.6 28.0
R 69 1.20 0.0000 1.0 40.2 41.2 LOOP WITHOUT LEFT TURN 1-3 OFF RURAL 170.2 72.5
R 70 0.90 0.0000 0.4 28.3 28.7 LOOP WITHOUT LEFT TURN 1-3 OFF URBAN 100.3 31.6
R 71 0.85 0.0000 1.0 40.2 41.2 LOOP WITHOUT LEFT TURN 1-3 ON RURAL 170.2 72.5
R 72 0.75 0.0000 0.4 28.3 28.7 LOOP WITHOUT LEFT TURN 1-3 ON URBAN 100.3 31.6
R 73 0.50 0.0000 0.4 50.0 50.4 TWO-WAY RAMP SEGMENT 1-3 N/A RURAL 107.7 56.3
15 Table C Task Force Summary

APPENDIX C: Ramp Rate Groups (Continuous)
RATE GROUP
BASE RATE
+ ADT FACTOR
PCT FAT
PCT INJ
PCTF+ I
RAMP TYPE RAMP AREAS
ON/ OFF
AREA ACC COSTS ($1000)
F+ I ALL
R 74 0.70 0.0000 0.4 50.0 50.4 TWO-WAY RAMP SEGMENT 1-3 N/A URBAN 79.6 42.1
R 75 0.50 0.0000 0.3 38.2 38.5 OTHER 1-3 OFF RURAL 107.2 43.7
R 76 0.55 0.0000 0.3 35.0 35.3 OTHER 1-3 OFF URBAN 81.5 31.4
R 77 0.50 0.0000 0.3 38.2 38.5 OTHER 1-3 ON RURAL 107.2 43.7
R 78 0.50 0.0000 0.3 35.0 35.3 OTHER 1-3 ON URBAN 81.5 31.4
R 79 0.55 0.0000 0.3 33.0 33.3 OTHER 1-3 N/A RURAL 111.8 39.9
R 80 0.55 0.0000 0.3 33.0 33.3 OTHER 1-3 N/A URBAN 83.3 30.4
16 Table C Task Force Summary

APPENDIX D: Highway Rate Groups
RATE GROUP
BASE RATE
+ ADT FACTOR
PCT FAT
PCT INJ
PCTF+ I
HIGHWAY TYPE TERRAIN OR ADT
DESIGN SPEED
AREA ACC COSTS ($1000)
F+ I ALL
H 01 1.15 0.3500 / 3.4 45.1 48.5 CONVENTIONAL 2 LANES OR LESS
FLAT <55 RURAL 345.4 169.6
H 02 0.90 0.3500 / 3.8 44.6 48.5 CONVENTIONAL 2 LANES OR LESS
FLAT >55 RURAL 376.7 184.8
H 03 1.30 0.3500 / 2.2 46.0 48.2 CONVENTIONAL 2 LANES OR LESS
ROLL <55 RURAL 251.9 123.5
H 04 0.80 0.3500 / 3.7 46.2 49.9 CONVENTIONAL 2 LANES OR LESS
ROLL >55 RURAL 360.8 182.1
H 05 1.65 0.4000 / 2.1 48.2 50.3 CONVENTIONAL 2 LANES OR LESS
MTN <55 RURAL 237.0 121.2
H 06 1.25 0.4000 / 2.7 44.8 47.5 CONVENTIONAL 2 LANES OR LESS
MTN >55 RURAL 294.7 142.1
H 07 2.95 0.0000 0.4 38.3 38.7 CONVENTIONAL 2 LANES OR LESS
<45 SUBURBAN 99.0 40.8
H 08 1.90 0.0000 1.0 41.4 42.4 CONVENTIONAL 2 LANES OR LESS
45-55 SUBURBAN 145.8 64.1
H 09 1.50 0.0000 1.7 40.8 42.5 CONVENTIONAL 2 LANES OR LESS
>55 SUBURBAN 203.9 89.0
H 10 3.05 0.0000 0.4 40.5 41.0 CONVENTIONAL 2 LANES OR LESS
<45 URBAN 95.6 41.6
H 11 1.75 0.0000 1.3 45.2 46.6 CONVENTIONAL 2 LANES OR LESS
>45 URBAN 158.0 75.8
H 12 1.00 0.0000 3.1 45.0 48.1 CONVENTIONAL 3 LANES RURAL 323.8 157.8
H 13 1.30 0.0000 2.2 42.2 44.4 CONVENTIONAL 3 LANES SUBURBAN 237.7 107.8
H 14 2.05 0.0000 0.9 38.0 38.9 CONVENTIONAL 3 LANES URBAN 132.0 53.8
H 15 0.60 0.0000 6.0 46.6 52.7 EXPRESSWAY 3 LANES OR LESS
FLAT RURAL 512.5 272.0
H 16 0.60 0.0000 3.8 42.9 46.7 EXPRESSWAY 3 LANES OR LESS
ROLL RURAL 388.4 183.5
H 17 1.20 0.0000 1.5 42.5 44.0 EXPRESSWAY 3 LANES OR LESS
MTN RURAL 207.7 93.6
H 18 0.90 0.0000 5.6 52.8 58.3 EXPRESSWAY 3 LANES OR LESS
<55 SUBURBAN 402.3 236.2
H 19 0.90 0.0000 5.6 42.1 47.7 EXPRESSWAY 3 LANES OR LESS
>55 SUBURBAN 477.7 230.0
H 20 1.00 0.0000 1.5 44.9 46.4 EXPRESSWAY 3 LANES OR LESS
URBAN 163.9 78.2
H 21 1.20 0.0000 2.8 49.8 52.6 UNDIVIDED 4 LANES FLAT RURAL 280.9 149.6
H 22 1.65 0.0000 2.2 38.4 40.6 UNDIVIDED 4 LANES ROLL/MTN RURAL 284.5 117.9
H 23 2.55 0.0000 1.1 37.1 38.3 UNDIVIDED 4 LANES <55 SUBURBAN 163.8 65.2
H 24 2.55 0.0000 2.0 41.1 43.1 UNDIVIDED 4 LANES >55 SUBURBAN 226.6 99.9
H 25 4.95 0.0000 0.4 39.4 39.8 UNDIVIDED 4 LANES <45 URBAN 86.9 37.0
H 26 3.35 0.0000 0.6 42.5 43.2 UNDIVIDED 4 LANES >45 URBAN 100.0 45.5
H 27 1.50 0.0000 2.0 37.0 39.0 UNDIVIDED 5-6 LANES FLAT RURAL 273.4 109.1
H 28 2.85 0.0000 1.7 50.0 51.7 UNDIVIDED 5-6 LANES ROLL/MTN RURAL 203.1 106.9
H 29 0.95 0.0000 3.1 46.9 50.0 UNDIVIDED 5-6 LANES <55 SUBURBAN 281.7 142.9
H 30 0.95 0.0000 1.0 32.8 33.8 UNDIVIDED 5-6 LANES >55 SUBURBAN 167.1 59.1
H 31 4.45 0.0000 1.0 26.1 27.1 UNDIVIDED 5-6 LANES <45 URBAN 179.4 51.5
H 32 1.95 0.0000 0.4 45.1 45.6 UNDIVIDED 5-6 LANES >45 URBAN 82.3 39.7
17 Table C Task Force Summary

APPENDIX D: Highway Rate Groups (Continuous)
RATE GROUP
BASE RATE
+ ADT FACTOR
PCT FAT
PCT INJ
PCTF+ I
HIGHWAY TYPE TERRAIN OR ADT
DESIGN SPEED
AREA ACC COSTS ($1000)
F+ I ALL
H 33 0.90 0.0000 2.9 43.9 46.8 DIVIDED 4 LANES FLAT RURAL 314.3 149.2
H 34 1.65 0.0000 1.0 35.5 36.5 DIVIDED 4 LANES ROLL/MTN RURAL 182.1 69.0
H 35 1.85 0.0000 0.7 43.1 43.8 DIVIDED 4 LANES <55 SUBURBAN 118.9 54.3
H 36 1.70 0.0000 1.8 40.4 42.2 DIVIDED 4 LANES >55 SUBURBAN 213.3 92.3
H 37 3.35 0.0000 0.5 42.3 42.8 DIVIDED 4 LANES <45 URBAN 92.5 41.9
H 38 2.10 0.0000 0.7 43.8 44.4 DIVIDED 4 LANES >45 URBAN 106.7 49.6
H 39 1.05 0.0000 2.4 30.0 32.4 DIVIDED 5 LANES OR MORE
FLAT RURAL 360.6 119.5
H 40 1.50 0.0000 1.6 50.0 51.6 DIVIDED 5 LANES OR MORE
ROLL/MTN RURAL 195.9 103.0
H 41 2.75 0.0000 1.2 43.1 44.4 DIVIDED 5 LANES OR MORE
<55 SUBURBAN 157.9 72.3
H 42 2.10 0.0000 0.9 33.3 34.3 DIVIDED 5 LANES OR MORE
>55 SUBURBAN 155.0 55.8
H 43 2.40 0.0000 0.7 56.8 57.5 DIVIDED 5 LANES OR MORE
<45 URBAN 94.2 55.8
H 44 2.40 0.0000 0.7 46.1 46.8 DIVIDED 5 LANES OR MORE
>45 URBAN 103.8 50.7
H 45 0.50 0.0070 2.6 42.6 45.2 DIV. EXPRESSWAY 4 LNS OR MORE
<65 RURAL 297.3 136.6
H 46 0.50 0.0070 3.0 44.7 47.6 DIV. EXPRESSWAY 4 LNS OR MORE
>65 RURAL 318.5 153.7
H 47 0.90 0.0170 1.5 43.2 44.8 DIV. EXPRESSWAY 4 LNS OR MORE
<65 SUBURBAN 180.7 83.2
H 48 0.75 0.0100 0.8 40.8 41.5 DIV. EXPRESSWAY 4 LNS OR MORE
>65 SUBURBAN 130.7 56.6
H 49 1.75 0.0000 0.5 40.7 41.2 DIV. EXPRESSWAY 4 LNS OR MORE
<55 URBAN 94.0 41.1
H 50 1.35 0.0000 1.3 44.5 45.9 DIV. EXPRESSWAY 4 LNS OR MORE
>55 URBAN 149.7 70.9
H 51 0.45 0.5000 / 2.4 40.2 42.6 FREEWAY 4 LANES OR LESS
<15000 <65 RURAL 292.8 127.0
H 52 0.45 0.5500 / 4.0 44.9 48.8 FREEWAY 4 LANES OR LESS
<15000 >65 RURAL 390.9 192.8
H 53 0.45 0.0035 3.4 40.1 43.4 FREEWAY 4 LANES OR LESS
>15000 <65 RURAL 377.0 165.9
H 54 0.40 0.0035 3.1 40.3 43.4 FREEWAY 4 LANES OR LESS
>15000 >65 RURAL 350.4 154.4
H 55 0.25 0.0050 2.2 40.1 42.3 FREEWAY 5-6 LANES RURAL 276.2 119.1
H 56 0.20 0.0035 1.5 36.7 38.2 FREEWAY 7 LANES OR MORE
RURAL 227.5 89.4
H 57 0.50 0.5000 / 3.6 43.6 47.2 FREEWAY 4 LANES OR LESS
<15000 <65 SUBURBAN 332.2 158.9
H 58 0.45 0.5500 / 2.7 39.0 41.7 FREEWAY 4 LANES OR LESS
<15000 >65 SUBURBAN 291.5 123.9
H 59 0.75 0.0050 1.2 36.8 38.0 FREEWAY 4 LANES OR LESS
>15000 <65 SUBURBAN 174.1 68.6
H 60 0.50 0.0035 1.3 35.7 37.0 FREEWAY 4 LANES OR LESS
>15000 >65 SUBURBAN 186.7 71.6
H 61 0.20 0.0060 1.5 33.8 35.3 FREEWAY 5-6 LANES SUBURBAN 212.7 77.7
H 62 0.25 0.0035 0.6 32.2 32.7 FREEWAY 7 LANES OR MORE
SUBURBAN 127.5 44.4
H 63 0.40 0.0100 1.1 35.5 36.6 FREEWAY 4 LANES OR LESS
URBAN 155.8 59.6
H 64 0.40 0.0055 0.6 30.4 31.0 FREEWAY 5-6 LANES URBAN 118.9 39.6
18 Table C Task Force Summary

APPENDIX D: Highway Rate Groups (Continuous)
RATE GROUP
BASE RATE
+ ADT FACTOR
PCT FAT
PCT INJ
PCTF+ I
HIGHWAY TYPE TERRAIN OR ADT
DESIGN SPEED
AREA ACC COSTS ($1000)
F+ I ALL
H 65 0.40 0.0035 0.5 31.0 31.5 FREEWAY 7-8 LANES URBAN 106.9 36.4
H 66 0.35 0.0030 0.5 30.6 31.1 FREEWAY 9-10 LANES URBAN 107.6 36.2
H 67 0.35 0.0025 0.4 29.8 30.2 FREEWAY 11 LANES OR MORE
URBAN 97.9 32.3
BASE RATES: HIGHWAY SEGMENTS ACCIDENTS/MILLION VEHICLE MILES (MVM) INTERSECTIONS ACCIDENTS/MILLION VEHICLE (MV) ENTERING THE INTERSECTION RAMPS ACCIDENTS/MILLION VEHICLE (MV) TRAVERSING THE RAMPS ADT FACTOR: VALUE TO BE ADDED TO THE BASE RATE. "0.60/" MEANS 0.60 DIVIDED BY ADT IN THOUSANDS; I.E., WITH 5,000 ADT, 0.12 WOULD BE ADDED TO THE BASE RATE. "0.017" MEANS 0.017 TIMES ADT IN THOUSANDS; I.E., WITH 20,000 ADT, ADD 0.34 TO THE BASE RATE. ACCIDENT COSTS ($1,000) F I PDO AVG RURAL 3900.0 77.4 4.0 139.4 URBAN 3500.0 52.2 4.0 40.4 SUBURBAN 3600.0 62.4 4.0 58.9 AVERAGE 3700.0 58.7 4.0 60.1
19 Table C Task Force Summary

Appendix E: Wet Pavement Factors for Safety Evaluation Dist County % Wet Time Dist County % Wet Time
1 Del Norte 11 6 Fresno 3 Humbolt 10 Kern 2 Lake 6 Kings 2 Mendocino 8 Madera 4 Tulare 32 Lassen 4 Modoc 5 7 Los Angeles 2 Plumas 6 Ventura 3 Shasta 7 Siskiyou 7 8 Riverside 2 Tehama 6 San Bernardino 2 Trinity 9 9 Inyo 13 Butte 5 Mono 2 Colusa 3 El Dorado 6 10 Alpine 5 Glenn 4 Amador 5 Nevada 8 Calaveras 6 Placer 6 Mariposa 5 Sacramento 4 Merced 3 Sierra 7 San Joaquin 3 Sutter 4 Stanislaus 3 Yolo 4 Tuolumne 5 Yuba 6 11 Imperial 14 Alameda 4 San Diego 3 Contra Costa 4 Marin 6 12 Orange 2 Napa 5 San Francisco 5 San Mateo 5 Santa Clara 4 Solano 4 Sonoma 7 5 Monterey 3 San Benito 3 San Luis Obispo 3 Santa Barbara 2 Santa Cruz 6
The % Wet Time is based on an 11-year weather record (1957-1967). Also, refer to Figure 2, page 9, of Traffic Department booklet entitled "A Method to Determine the Exposure of Vehicles to Wet Pavements", dated January 1972 and Evaluation of Minor Improvements (grooved pavements, Part 8) dated December 1972. Use this value for calculating projected wet travel.
20 Table C Task Force Summary

Attachment #2
TABLE C
SURVEY RESULTS
A TOTAL OF 44 PEOPLE FROM THE TWELVE DISTRICTS
RESPONDED TO THIS SURVEY DATED MARCH 30, 2000. THE
FOLLOWING ARE THE SURVEY QUESTIONS AND THE ANSWERS
FOR EACH QUESTION. THE RESULTS ARE THE NUMBER OF
RESPONDENTS WHO CHOSE THE ANSWER ABOVE IT.
21 Table C Task Force Summary

1. The Table C program does not analyze Highway Segments less than 0.2 miles. Examples include just before intersections, route breaks and district boundaries and at changes in rate group (see diagram).
The Table C program needs to include these segments in the analysis.
Strongly Agree 1 2 3 4 5 Strongly Disagree
RESULTS: 14 16 6 5 3
22 Table C Task Force Summary

2. I frequently investigate "Required" locations that result in ‘No Action’ due to the peak hour congestion related collisions.
Strongly Agree 1 2 3 4 5 Strongly Disagree
RESULTS: 14 9 9 7 5
3. I frequently investigate "Required" locations that result in ‘No Action’ due to increased traffic volume during the seasonal peaks.
Strongly Agree 1 2 3 4 5 Strongly Disagree
RESULTS: 3 10 15 10 6
23 Table C Task Force Summary
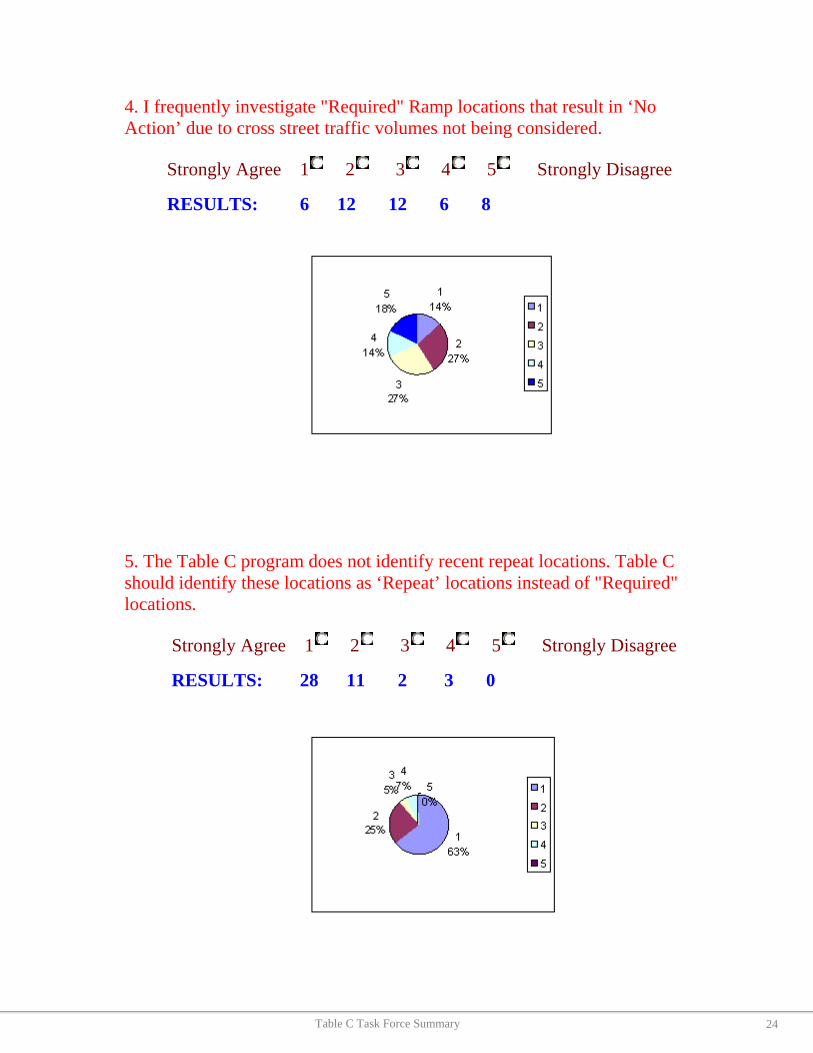
4. I frequently investigate "Required" Ramp locations that result in ‘No Action’ due to cross street traffic volumes not being considered.
Strongly Agree 1 2 3 4 5 Strongly Disagree
RESULTS: 6 12 12 6 8
5. The Table C program does not identify recent repeat locations. Table C should identify these locations as ‘Repeat’ locations instead of "Required" locations.
Strongly Agree 1 2 3 4 5 Strongly Disagree
RESULTS: 28 11 2 3 0
24 Table C Task Force Summary
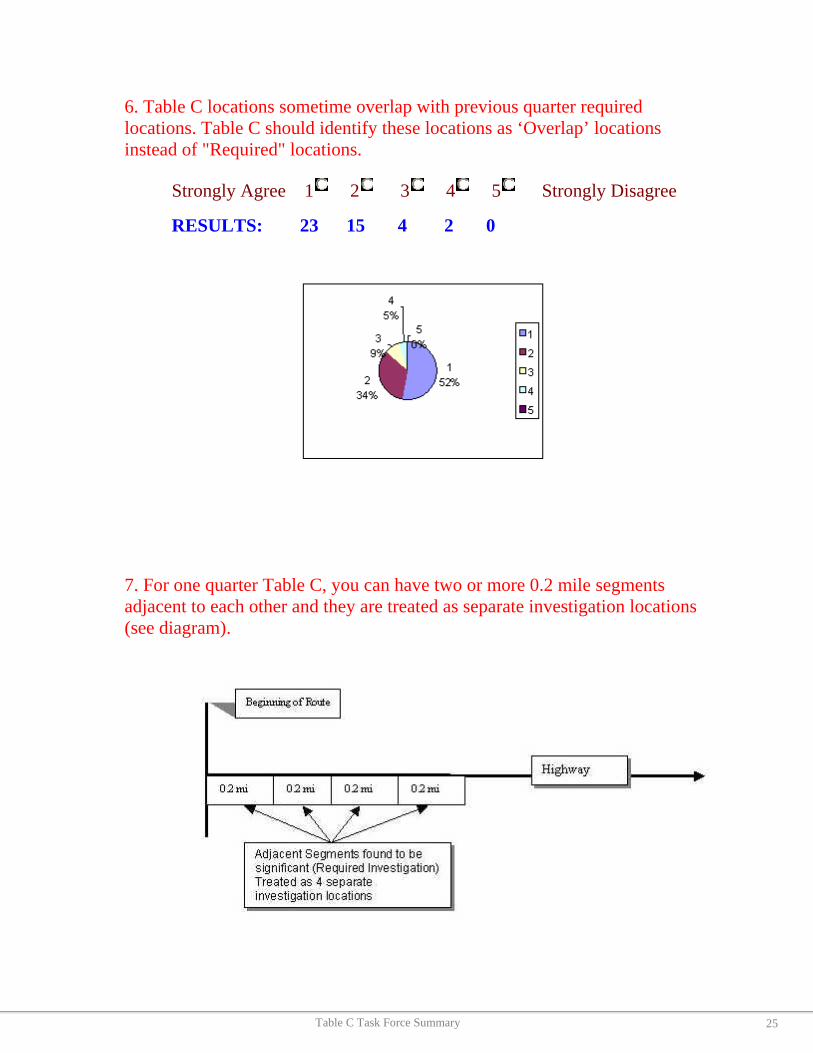
6. Table C locations sometime overlap with previous quarter required locations. Table C should identify these locations as ‘Overlap’ locations instead of "Required" locations.
Strongly Agree 1 2 3 4 5 Strongly Disagree
RESULTS: 23 15 4 2 0
7. For one quarter Table C, you can have two or more 0.2 mile segments adjacent to each other and they are treated as separate investigation locations (see diagram).
25 Table C Task Force Summary
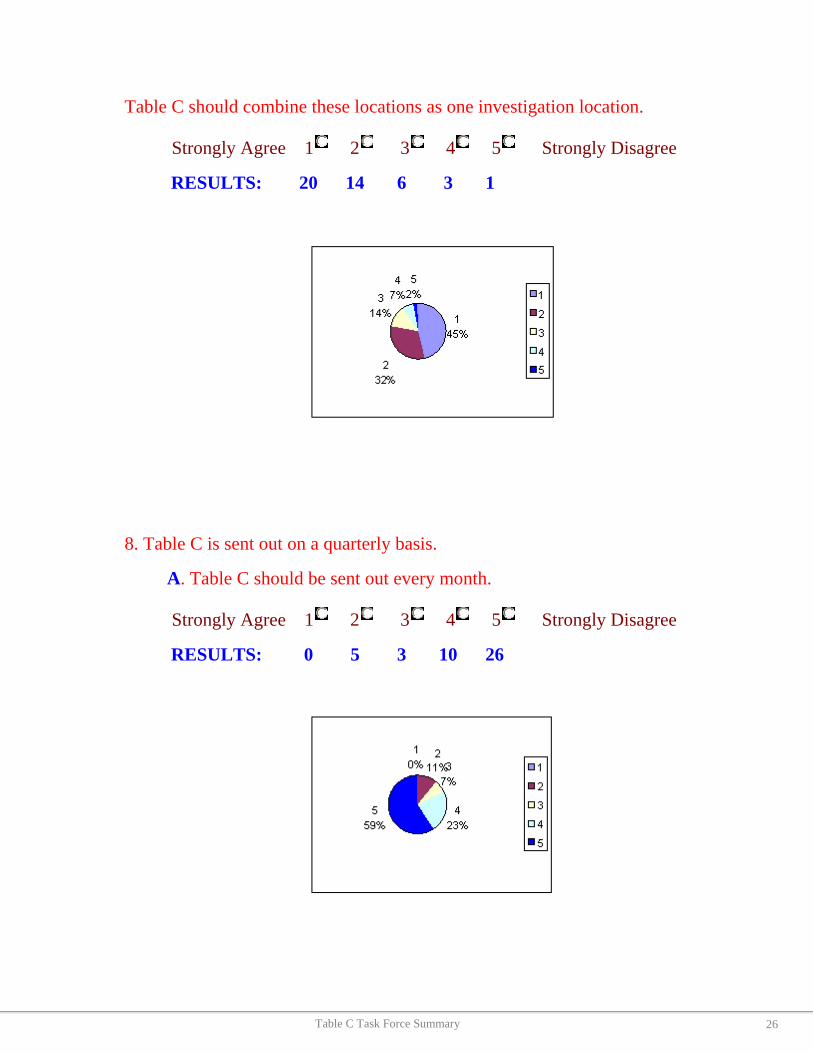
Table C should combine these locations as one investigation location.
Strongly Agree 1 2 3 4 5 Strongly Disagree
RESULTS: 20 14 6 3 1
8. Table C is sent out on a quarterly basis.
A. Table C should be sent out every month.
Strongly Agree 1 2 3 4 5 Strongly Disagree
RESULTS: 0 5 3 10 26
26 Table C Task Force Summary

B. Table C should be sent out twice a year.
Strongly Agree 1 2 3 4 5 Strongly Disagree
RESULTS: 7 6 7 11 13
C. Table C should continue to be sent out quarterly.
Strongly Agree 1 2 3 4 5 Strongly Disagree
RESULTS: 18 9 8 6 3
27 Table C Task Force Summary
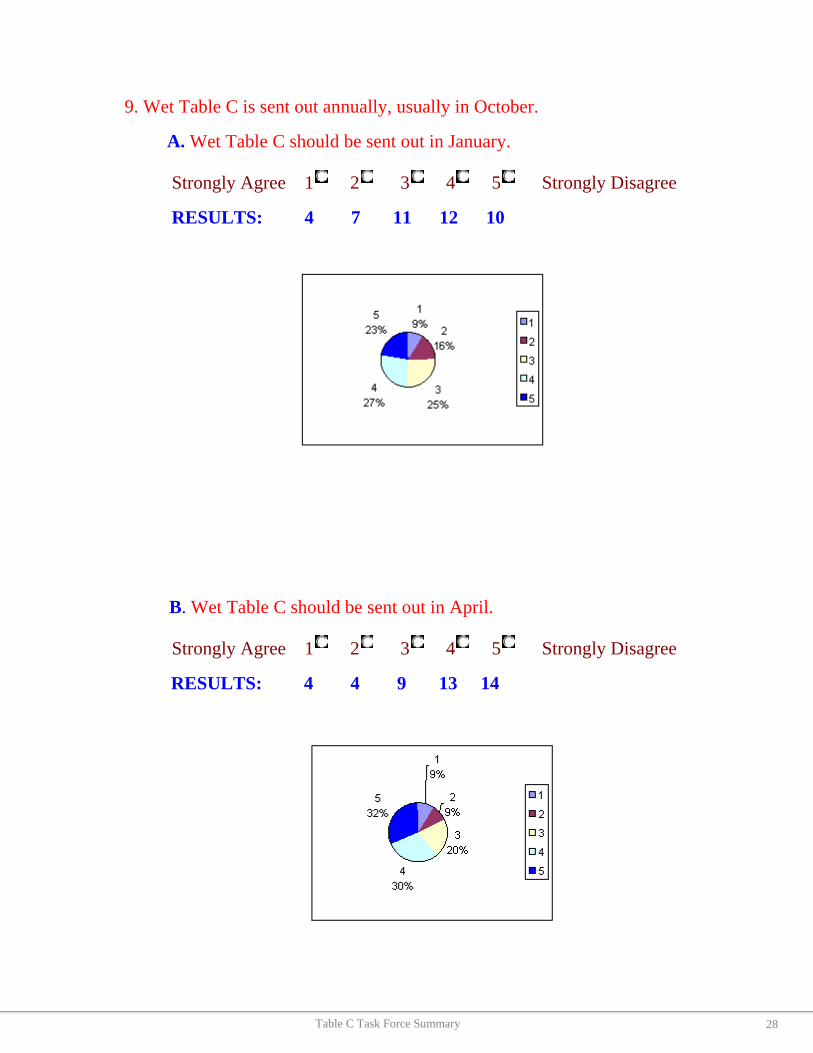
9. Wet Table C is sent out annually, usually in October.
A. Wet Table C should be sent out in January.
Strongly Agree 1 2 3 4 5 Strongly Disagree
RESULTS: 4 7 11 12 10
B. Wet Table C should be sent out in April.
Strongly Agree 1 2 3 4 5 Strongly Disagree
RESULTS: 4 4 9 13 14
28 Table C Task Force Summary

C. Wet Table C should be sent out in July.
Strongly Agree 1 2 3 4 5 Strongly Disagree
RESULTS: 4 6 5 8 21
D. Wet Table C should continue to be sent out in October.
Strongly Agree 1 2 3 4 5 Strongly Disagree
RESULTS: 11 13 13 5 2
29 Table C Task Force Summary
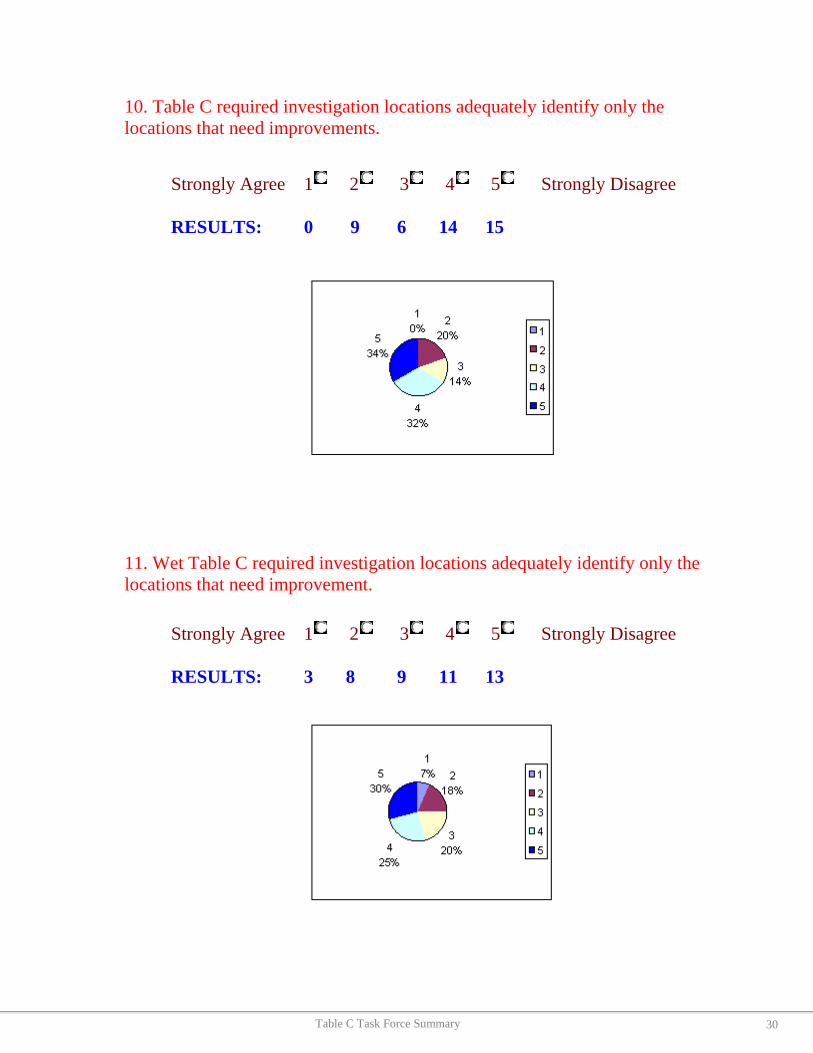
10. Table C required investigation locations adequately identify only the locations that need improvements. Strongly Agree 1 2 3 4 5 Strongly Disagree RESULTS: 0 9 6 14 15
11. Wet Table C required investigation locations adequately identify only the locations that need improvement. Strongly Agree 1 2 3 4 5 Strongly Disagree RESULTS: 3 8 9 11 13
30 Table C Task Force Summary

12. There are 67 Highway, 30 Intersection and 80 Ramp Collision Rate Groups. Criteria should be developed for establishing Collision Rate Groups. Strongly Agree 1 2 3 4 5 Strongly Disagree RESULTS: 11 13 10 7 3
31 Table C Task Force Summary

Attachment #3
Table C Time and Cost Estimate
Background Neither the staff in Traffic Operations nor IT has thoroughly tested TSN Table C process before. The assumption is that the TSN Table C is working properly for IT to come up with the time estimate: the task will be done by one of our current consultants who has knowledge on TSN application. The estimate is based on IT will be able to use/modify the existing process/program to do the enhancements. Tasks - Analyze the existing programs/process 8 weeks - Analyze the existing table structure/data 2 weeks - Analyze the existing form 2 weeks - Modify programs/report 1. Repeat locations 3 weeks Unit test 2 weeks 5 weeks 2. Overlap locations 3 weeks Unit test 2 weeks 5 weeks 3. Combine adjacent locations 4 weeks Unit test 2 weeks 6 weeks - Apply logic to repeat overlap to
Highway only 2 weeks
- Apply logic to required printing to Ramp/Intersection/Highway 2 weeks
- Integrated Test 2 weeks _ _ _ _ _ _ _ _ _ Total Time Estimate 22 weeks Total Cost Estimate 880 hours @$90.00 per hour $79,200.00
32 Table C Task Force Summary

Attachment #4
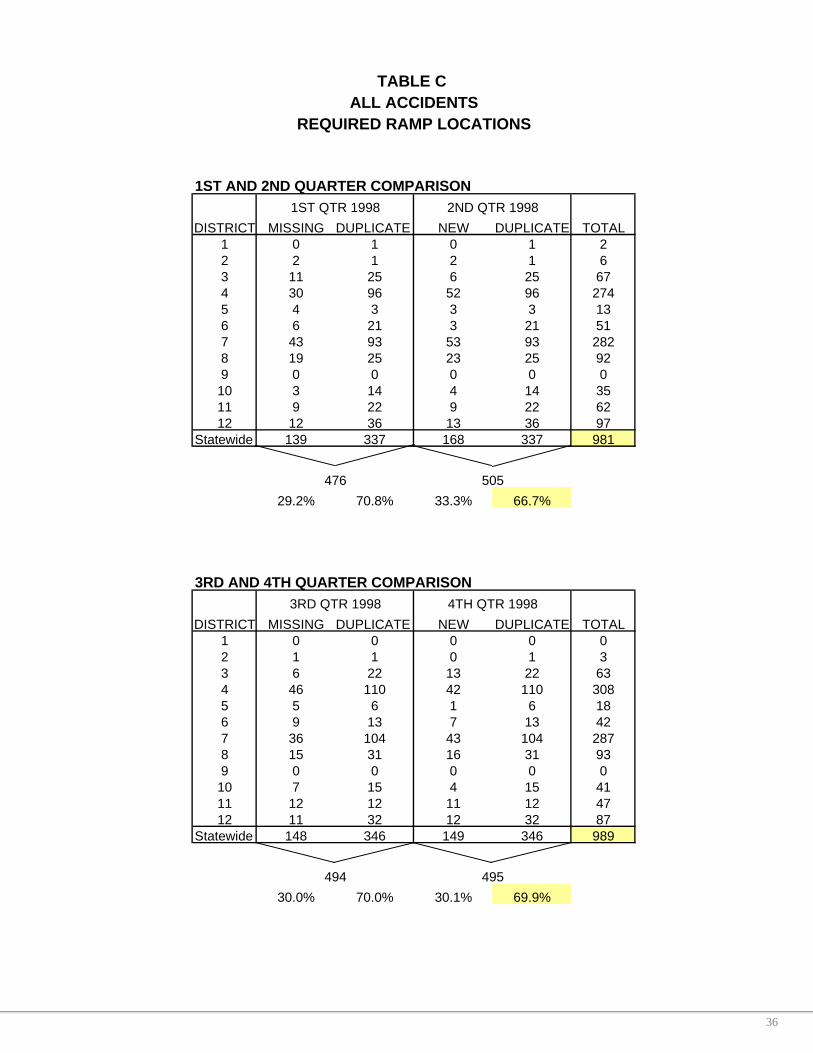
Preliminary Review of Required Highway Locations After preliminary review of the comparison of 1st quarter to 2nd quarter and 3rd
quarter to 4th quarter, it was found that 65% - 70% of the required highway locations were either exact duplicates or overlaps. Similar results were found for Ramp and Intersection required locations.
Note: There was not a comparison between 2nd quarter and 3rd quarter or 1st
quarter and 4th quarter, which would result in a higher percentage of duplicates and overlaps.
33 Table C Task Force Summary

TABLE C
REQUIRED HIGHWAY LOCATIONSALL ACCIDENTS
3RD AND 4TH QUARTER COMPARISON
DISTRICT MISSING DUPLICATE OVERLAP NEW DUPLICATE OVERLAP TOTAL1 14 10 7 26 10 5 722 10 5 1 9 5 0 303 51 45 50 54 45 47 2924 124 137 259 103 137 255 10155 26 27 15 25 27 23 1436 52 36 29 51 36 19 2237 118 159 222 93 159 227 9788 86 75 49 80 75 53 4189 2 1 0 0 1 0 410 43 37 19 36 37 19 19111 36 16 29 23 16 27 14712 46 49 63 55 49 58 320
Statewide 608 597 743 555 597 733 3833
1948 188531.2% 30.6% 38.1% 29.4% 31.7% 38.9%
3RD QTR 1998 4TH QTR 1998
1ST AND 2ND QUARTER COMPARISON
DISTRICT MISSING DUPLICATE OVERLAP NEW DUPLICATE OVERLAP TOTAL1 9 13 4 15 13 5 592 10 4 0 11 4 0 293 45 38 25 45 38 32 2234 141 149 227 131 149 243 10405 29 18 17 29 18 19 1306 51 24 38 50 24 32 2197 145 134 180 155 134 191 9398 80 78 42 89 78 56 4239 0 0 0 2 0 0 210 26 29 21 36 29 14 15511 37 24 26 32 24 17 16012 36 41 60 44 41 53 275
Statewide 609 552 640 639 552 662 3654
1801 185333.8% 30.6% 35.5% 34.5% 29.8% 35.7%
1ST QTR 1998 2ND QTR 1998
34 Table C Task Force Summary

TABLE C
REQUIRED RAMP LOCATIONSALL ACCIDENTS
1ST AND 2ND QUARTER COMPARISON
DISTRICT MISSING DUPLICATE NEW DUPLICATE TOTAL1 0 1 0 1 22 2 1 2 1 63 11 25 6 25 674 30 96 52 96 2745 4 3 3 3 136 6 21 3 21 517 43 93 53 93 2828 19 25 23 25 929 0 0 0 0 0
10 3 14 4 14 3511 9 22 9 22 6212 12 36 13 36 97
Statewide 139 337 168 337 981
29.2% 70.8% 33.3% 66.7%
3RD AND 4TH QUARTER COMPARISON
DISTRICT MISSING DUPLICATE NEW DUPLICATE TOTAL1 0 0 0 0 02 1 1 0 1 33 6 22 13 22 634 46 110 42 110 3085 5 6 1 6 186 9 13 7 13 427 36 104 43 104 2878 15 31 16 31 939 0 0 0 0 0
10 7 15 4 15 4111 12 12 11 12 4712 11 32 12 32 87
Statewide 148 346 149 346 989
30.0% 70.0% 30.1% 69.9%494 495
3RD QTR 1998 4TH QTR 1998
476 505
1ST QTR 1998 2ND QTR 1998
35 Table C Task Force Summary
1ST AND 2ND QUARTER COMPARISON
DISTRICT MISSING DUPLICATE NEW DUPLICATE TOTAL1 0 1 0 1 22 2 1 2 1 63 11 25 6 25 674 30 96 52 96 2745 4 3 3 3 136 6 21 3 21 517 43 93 53 93 2828 19 25 23 25 929 0 0 0 0 010 3 14 4 14 3511 9 22 9 22 6212 12 36 13 36 97
Statewide 139 337 168 337 981
29.2% 70.8% 33.3% 66.7%
3RD AND 4TH QUARTER COMPARISON
DISTRICT MISSING DUPLICATE NEW DUPLICATE TOTAL1 0 0 0 0 02 1 1 0 1 33 6 22 13 22 634 46 110 42 110 3085 5 6 1 6 186 9 13 7 13 427 36 104 43 104 2878 15 31 16 31 939 0 0 0 0 010 7 15 4 15 4111 12 12 11 12 4712 11 32 12 32 87
Statewide 148 346 149 346 989
30.0% 70.0% 30.1% 69.9%494 495
3RD QTR 1998 4TH QTR 1998
476 505
TABLE C
REQUIRED RAMP LOCATIONSALL ACCIDENTS
1ST QTR 1998 2ND QTR 1998
36

Table C PROPOSED IMPROVEMENT LOCATIONS
1/1/98 – 6/13/01
District Table C's 1 2 3 4 5 6 7 8 9 10 11 12
All 245 124 411 2783 456 1368 2690 1131 23 397 366 1064All IMPROVEMENT RECOMMENDED 116 44 85 68 128 36 252 74 5 129 123 198
WET 43 16 122 1382 144 37 1207 255 0 40 45 158WET IMPROVEMENT RECOMMENDED 19 8 48 36 42 0 70 14 0 16 13 42
PERCENTAGES OF IMPROVEMENTS
ALL - IMPROVEMENTS RECOMMENDED 47.35% 35.48% 20.68% 2.44% 28.07% 2.63% 9.37% 6.54% 21.74% 32.49% 33.61% 18.61%
WET- IMPROVEMENTS RECOMMENDED 44.19% 50.00% 39.34% 2.60% 29.17% 0.00% 5.80% 5.49% 0.00% 40.00% 28.89% 26.58%
Statewide Totals
All 11058All Improvement Recommended 1258
Wet 3449Wet Improvement Recommended 308
Statewide Percentage of Improvements
All - Improvements Recommended 11.38%
Wet - Improvements Recommended 8.93%
Attachm
ent #5
37 Table C
Task Force Summ
ary

Attachm
ent #6
Required Number Remaining Number Remaining Reduction due TotalLocations of Repeat Locations of Overlap Locations to Combining Locationson Table C Locations after Step 1 Locations after Step 2 Adjacent Loc. after Step 3
1st Qtr. 14 -10 = 4 -1 = 3 - 0 = 3
2nd Qtr. 15 -4 = 11 -1 = 10 - 0 = 10
3rd Qtr. 16 -6 = 10 -4 = 6 - 0 = 6
4th Qtr. 14 -5 = 9 -1 = 8 - 0 = 8
Required Number Remaining Number Remaining Reduction due TotalLocations of Repeat Locations of Overlap Locations to Combining Locationson Table C Locations after Step 1 Locations after Step 2 Adjacent Loc. after Step 3
1st Qtr. 517 -209 = 308 -185 = 123 -8 = 115
2nd Qtr. 523 -222 = 301 -198 = 103 -2 = 101
3rd Qtr. 520 -249 = 271 -183 = 88 -2 = 86
4th Qtr. 494 -209 = 285 -183 = 102 -8 = 94
Step # 1 = Total "Required Locations" remaining after subtracting "Repeat Locations".Step # 2 = Total "Required Locations" remaining after subtracting "Repeat" & "Overlap Locations".Step # 3 = Total "Required Locations" remaining after subtracting "Repeat Locations", "Overlap Locations"and combining "Adjacent Locations".
District 4 Required Highway Locations
Combined Adjacent Required Highway Locations
District 2 Required Highway Locations
Table C
38 Table C
Task Force Summ
ary

* * * S A M P L E * * *
TASAS TABLE C POTENTIAL INVESTIGATION LOCATIONS .2 MILEAXR254-A 04-08-97 DISTRICT 04 DATA FOR 94-01-01 THRU 96-12-31 PAGE 10 ALL ACCIDENTS CONFIDENCE LEVEL 99.5 PERCENT
SCL R RATE*------TOTAL ACCIDENTS------* *---AVE ADT-* *--12 MOS RATE ACCS/MV-MVM-* L0CATION DESCRIPTION RMP U GRP 36 MO 24 MO 12 MO 6 MO 3 MO 1000 VEH ACTUAL AVERAGE INV LNS S ACCS ACCS ACCS ACCS ACCS MAIN X-ST F+I TOT F+I TOT REQ
037 SOL 8.445 SACRAMENTO ST XXX S I24 29 Y 19 Y 8 N 4 N 0 N 27.9 4.0 0.00 0.69 0.18 0.39 +
037 SOL 9.287 TO 9.487 EAST 02D U H14 17 Y 11 Y 5 N 3 N 1 N 14.6 - 0.94 4.68 0.78 2.00
037 SOL 9.844 BROADWAY XXX U I14 64 Y 41 Y 22 Y 16 Y 10 Y 45.0 8.9 0.36 1.12 0.20 0.45 + REQ
037 SOL R 11.147 TO R 11.347 EAST 03D U H64 15 Y 12 Y 4 N 2 N 1 N 37.0 - 0.37 1.48 0.28 0.81
037 SOL R 11.497 EB OFF TO COLUMBUS PKWY F F U R18 18 Y 12 Y 6 Y 3 N 2 N 3.8 - 0.00 4.33 0.36 0.90 + REQ
037 SON 2.109 TO 2.309 WEST 02D R H45 11 Y 7 Y 2 N 1 N 1 N 15.0 - 1.82 1.82 0.34 0.71
037 SON R 6.109 TO R 0.064 02U R H02 11 N 10 Y 1 N 1 N 1 N 24.9 - 0.55 0.55 0.48 0.91
061 ALA 19.070 HIGH ST RT B'VIEW DR LT X-X U I14 29 Y 19 Y 10 N 7 N 5 N 21.2 7.9 0.28 0.94 0.20 0.45 +
061 ALA 19.440 OTIS DR & BROADWAY X-X U I14 25 Y 18 Y 9 N 4 N 1 N 9.8 17.1 0.41 0.92 0.20 0.45 +
061 ALA 20.080 PARK ST. X-X U I14 27 Y 20 Y 9 N 3 N 1 N 10.3 17.5 0.30 0.89 0.20 0.45 +
061 ALA 20.150 OAK ST. X-X U I14 15 Y 12 Y 4 N 3 N 2 N 10.2 2.6 0.43 0.85 0.20 0.45 +
080 ALA 0.000 TO 0.200 EAST 05R U H66 36 Y 27 Y 16 Y 6 N 1 N 137.0 - 0.20 1.60 0.21 0.63 REQ
080 ALA 0.340 TO 0.540 EAST 05R U H66 28 N 24 Y 11 N 9 N 6 N 137.0 - 0.10 1.10 0.21 0.63
080 ALA 0.538 TO 0.738 WEST 05L U H66 31 Y 22 N 6 N 3 N 0 N 137.0 - 0.10 0.60 0.21 0.63
080 ALA 0.900 TO 1.100 EAST 05R U H66 53 Y 38 Y 23 Y 16 Y 7 Y 137.0 - 0.80 2.30 0.21 0.63 REQ
080 ALA 1.078 TO 1.278 WEST 05L U H66 39 Y 25 Y 17 Y 10 Y 5 N 142.5 - 0.40 1.70 0.22 0.65 REQ
080 ALA 1.310 TO 1.510 EAST 05D U H66 35 N 27 N 19 N 13 Y 6 N 137.0 - 0.80 1.90 0.35 1.04 REQ
080 ALA 1.338 TO 1.538 WEST 05D U H66 55 Y 43 Y 25 Y 16 Y 5 N 137.0 - 0.40 2.50 0.35 1.04 REQ
080 ALA 1.778 TO 1.978 WEST 11D U H67 128 Y 92 Y 50 Y 30 Y 18 Y 137.0 - 1.30 5.00 0.26 0.84 REQ
080 ALA 1.978 TO 2.178 WEST 18D U H67 203 Y 151 Y 79 Y 40 Y 20 Y 137.0 - 1.70 7.90 0.26 0.84 REQ
080 ALA 2.090 TO 2.290 EAST 06D U H67 31 N 25 N 16 N 12 Y 9 Y 137.0 - 0.70 1.60 0.26 0.84 REQ
080 ALA 2.170 WB ON FR GRAND AVE O C U R08 27 Y 11 Y 1 N 0 N 0 N 8.4 - 0.33 0.33 0.16 0.50 +
080 ALA 2.258 TO 2.458 WEST 07D U H67 65 Y 47 Y 29 Y 15 Y 8 Y 135.1 - 0.81 2.94 0.26 0.83 REQ
080 ALA 2.290 EB OFF TO GRAND-MARITME F F U R62 4 N 4 N 4 N 4 Y 2 N 6.9 - 0.40 1.59 0.16 0.40 + REQ
REQ=INVESTIGATION REQUIRED (4 OR MORE ACCS. & SIGNIFICANT IN 12,6 OR 3 MONTHS) + DENOTES MV USED IN RATES
Attachm
ent #7
39 Table C
Task Force Summ
ary