table 1c page: 2007 pregnancy nutrition surveillance run date: … · 2007 pregnancy nutrition...
TRANSCRIPT

Table 1C
Summary of Demographic Indicators
Page:
Run Date:(1)
1 / 10 / 09
Total Records
Complete Records
Prenatal Records
Number %
Total
Excluded Unknown:
Number %Race/Ethnic Distribution
Total
Excluded Unknown:
Age Distribution Number %
Total
Source of Data
Postpartum Records
Total Records Accepted
Excluded Unknown:
Number %Education Distribution
Total
Excluded Unknown:
(2)
2007 Pregnancy Nutrition SurveillanceConnecticut
9,815
4721,820
12,107
Maternal Health 0 0.0
Other 0 0.0
100.0
Black, Not Hispanic
Hispanic
American Indian/Alaskan Native
Asian/Pacific Islander
2,654
5,300
70
273
21.9
43.8
0.6
2.3
100.0
1 0.0
15 - 17 Years18 - 19 Years
20 - 29 Years
30 - 39 Years
>= 40 Years
7461,424
7,019
2,664
218
6.211.8
58.0
22.0
1.8
0 0.0
100.0
High School
> High School
0
0
*
*
100.0
12,107 100.0
% Poverty Level Number % Program Participation (3) Number % Migrant Status Number %
Reporting period is January 1 through December 31.(1)
Excludes records with unknown data or errors.(2)
Prenatal program participation.(3)
Percentages are not calculated if <100 records are available for analysis after exclusions.*
WIC 12,107 100.0
White, Not Hispanic 3,757 31.0
All Other 0 0.0
< 15 Years 36 0.3 < High School 0 *
0 0.0
0 - 50
51 - 100
101 - 130
131 - 150
151 - 185
186 - 200
> 200
Adjunctive Eligibility
Total 7,594 100.0
Excluded Unknown: 4,513 37.3
12,107
12,106
12,107
0
2,264
2,417
1,319
533
697
34
69
261
29.8
31.8
17.4
7.0
9.2
0.4
0.9
3.4
10,287
0
0
0
WIC
Food Stamps
Medicaid
TANF
100.0
*
*
*
Excluded Unknown:
WIC:
Food Stamps:
Medicaid:
TANF:
0.0
100.0
100.0
100.0
Yes
No
11,884
5 0.0
11,879 100.0
100.0
Excluded Unknown: 1.8
0
10,287
10,287
10,287 223
81.1
3.915.0
Number %
1
Total
Multiple Races 52 0.4

Page:
Run Date:(1) 1 / 10 / 09
Prepregnancy BMI (3)
Underweight Normal Weight Overweight
Maternal Weight Gain (4)
Less Than IdealIdeal
Greater Than Ideal
Anemia (Low Hb/Hct) (5)
1 Trimester2 Trimester3 TrimesterPostpartum
Parity (6)
01
2> 3
Interpregnancy Interval
< 6 Months6 - <18 Months>18 Months
_
_
st
nd
rd
Obese
Gestational Diabetes
Hypertension During Pregnancy
Summary of Health Indicators
Table 2C
Summary of Health Indicators (2)
Number %
11,968 10.011,968 46.211,968 14.8
11,121 68.911,121 17.6
11,121 13.5
3,389 5.16.0
31.03,882 51.7
7,723 0.07,723 42.1
7,723 26.77,723 31.1
7,109 11.97,109 22.97,109 65.2
11,968 28.9
3,1021,446
ConnecticutPrevalence
11,635 0.0
11,635 0.3
Connecticut2007 Pregnancy Nutrition Surveillance
2
NationalPrevalence(Prior Year)
Number %
1,081,5501,081,5501,081,5501,081,550
872,976872,976
872,976
349,143314,271161,665359,221
879,923879,923
879,923879,923
527,136527,136527,136
11.245.115.028.6
24.832.0
43.1
6.710.832.229.2
46.125.5
15.113.3
13.126.760.3
150,176 3.6
164,043 3.0
(1) Reporting period is January 1 through December 31.
(2) Excludes records with unknown data or errors.
(3) Based on 1990 IOM report, "Nutrition During Pregnancy": underweight (BMI < 19.8), normal weight (BMI 19.9 to 26.0), overweight (BMI >26.0 to 29.0), obese (BMI >29.0).
(4) Based on 1990 IOM report, "Nutrition During Pregnancy": underweight prepregnancy (ideal weight gain = 28 to 40 lbs), normal weight prepregnancy (ideal weight gain = 25
to 35 lbs), overweight prepregnancy (ideal weight gain = 15 to 25 lbs), obese prepregnancy (ideal weight gain = 15 to 25 lbs).
(5) Based on 1990 CDC MMWR, "Recommendations to Prevent and Control Iron Deficiency in the United States"; adjusted for altitude and smoking.
(6) Number of times a woman has given birth to an infant 20 or more weeks gestation.
* Percentages are not calculated if <100 records are available for analysis after exclusions.

Page:
Run Date:(1) 1 / 10 / 09
Medical Care
1 Trimester No Care
WIC Enrollment1 Trimester2 Trimester3 Trimester
st
Postpartum (3)
st
nd
rd
Smoking
3 Months Prior to Pregnancy During Pregnancy Last 3 Months of Pregnancy
Postpartum
Smoking Changes (6)
Quit Smoking by First Prenatal Visit
Quit Smoking by First Prenatal Visit and Stayed Off Cigarettes
Smoking in HouseholdDuring Pregnancy
Postpartum
Drinking
3 Months Prior to PregnancyLast 3 Months of Pregnancy
Prepregnancy Multivitamin Consumption (4)
Multivitamin Consumption During Pregnancy (5)
Summary of Health Indicators
Table 2C
Summary of Health Indicators (2)
Number %
11,584 0.311,108 8.1
11,635 9.1
10,287 16.1
2,484 53.7
2,616 55.1
11,634 14.0
11,635 3.410,273 11.712,066 25.4
11,975 15.011,975 21.5
11,975 41.211,975 22.3
11,616 3.611,616 84.7
ConnecticutPrevalence
0 * 0 *
2007 Pregnancy Nutrition SurveillanceConnecticut
3
NationalPrevalence(Prior Year)
Number %
579,816579,816
944,971944,971
944,971944,971
847,411761,344692,984
686,323
203,249
156,923
514,582
443,951
785,765753,112
78.55.6
31.234.9
18.015.9
27.216.216.8
17.6
42.2
35.0
22.5
24.1
7.40.4
38,592 15.7206,967 74.1
(1) Reporting period is January 1 through December 31.
(2) Excludes records with unknown data or errors.
(3) Women who initially enrolled in WIC during the postpartum period.
(4) Women who reported taking a multivitamin four times a week or more in the month before pregnancy; proxy for folic acid consumption.
(5) Pregnant women who reported taking a multivitamin in the past month; proxy for prenatal iron consumption.
(6) Among women who smoked 3 months prior to pregnancy.
* Percentages are not calculated if <100 records are available for analysis after exclusions.

Page:
Run Date:(1) 1 / 10 / 09
Birthweight (3)
Very LowLow
NormalHigh
Preterm (4) Full term Low Birth Weight (5)
Multiple Births
Breastfeeding
Ever Breastfed
Summary of Health Indicators
Table 2C
Summary of Health Indicators (2)
Number %
11,618 65.7
11,635 0.610,653 3.511,530 7.6
11,613 7.011,613 86.0
11,613 6.211,613 0.8
ConnecticutPrevalence
2007 Pregnancy Nutrition SurveillanceConnecticut
4
NationalPrevalence(Prior Year)
Number %
972,241972,241
972,241972,241
873,261802,123935,557
897,379
1.17.2
85.06.8
12.13.71.5
64.2
(1) Reporting period is January 1 through December 31.
(2) Excludes records with unknown data or errors.
(3) Very low birth weight (<1500 g), low birth weight (1500 - <2500 g), normal birth weight (2500 - <4000 g), high birth weight (>4000 g).
(4) <37 weeks gestation.
(5) 37 or more weeks gestation and <2500 g.

(1)
(2)
NumberIncluded in
Analysis % % % % %
Table 3C
Comparison of Racial and Ethnic Distribution
Black, Not Hispanic HispanicAmerican
Indian/Alaskan Native
Asian/Pacific Islander
Connecticut2007 Pregnancy Nutrition Surveillance
Comparison of Racial and Ethnic Distribution by Contributor to Nation
White, Not Hispanic
%
All Other/Unknown
Page: 5
Run Date: 1 / 10 / 09
Multiple Races
%
Connecticut 12,107 21.9 43.8 0.6 2.331.0 0.00.4
1,153,475 22.7 28.7 1.1 3.1Nation (Prior Year) 41.5 2.00.9
(1) Reporting period is January 1 through December 31.
(2) Excludes data with errors.
* Percentages are not calculated if <100 records are available for analysis after exclusions.

Page:
Run Date: 1 / 10 / 09(1)
(2)
NumberIncluded in
Analysis
Table 4C
Comparison of Age Distribution
Connecticut
15 - 17 Years 18 - 19 Years 20 - 29 Years 30 - 39 Years >= 40 Years
2007 Pregnancy Nutrition Surveillance
Comparison of Age Distribution by Contributor to Nation
< 15 Years
%
6
% % % % %%
Unknown
Connecticut 12,107 6.2 11.8 58.0 22.0 1.80.3 0.0
1,153,475 6.5 12.6 60.0 19.0 1.40.4Nation (Prior Year) 0.1
(1) Reporting period is January 1 through December 31.
(2) Excludes data with errors.
* Percentages are not calculated if <100 records are available for analysis after exclusions.

Page:
Run Date: 1 / 10 / 09(1)
(2)
Prepregnancy BMI
Table 5C
Comparison of Maternal Health Indicators
Connecticut
Weight Gain Anemia(Low Hb/Hct)
Number % % %%Number Number Number% %
Under-weight
Over-weight
< Ideal > Ideal 3rd Trimester Postpartum
2007 Pregnancy Nutrition Surveillance
Comparison of Maternal Health Indicators by Contributor to Nation
(3) (4)
(5)
7
Gestational DiabetesDuring
Pregnancy
Number %
HypertensionDuring
Pregnancy
Number %
Connecticut 11,968 10.0 11,121 68.9 13.5 1,446 31.0 3,882 51.743.8 11,635 0.0 11,635 0.3
Nation (Prior Year) 1,081,550 11.2 872,976 24.8 43.1 161,665 32.2 359,221 29.243.7 150,176 3.6 164,043 3.0
Reporting period is January 1 through December 31.(1)Excludes records with unknown data or errors.(2)Based on 1990 IOM report, "Nutrition During Pregnancy": underweight (BMI <19.8), overweight (BMI >26.0; includes overweight and obese women).(3)Based on 1990 IOM report, "Nutrition During Pregnancy": underweight prepregnancy (ideal weight gain = 28 to 40 lbs), normal weight prepregnancy (ideal weight gain = 25(4)to 35 lbs), overweight prepregnancy (ideal weight gain = 15 to 25 lbs), obese prepregnancy (ideal weight gain = 15 to 25 lbs).Based on 1990 MMWR, "Recommendations to Prevent and Control Iron Deficiency in the United States"; adjusted for altitude and smoking.(5)Percentages are not calculated if <100 records are available for analysis after exclusions.*

Page:
Run Date: 1 / 10 / 09(1)
(2)
Medical Care
Table 6C
Comparison of Maternal Behavioral Indicators
Connecticut
WIC Enrollment
Number % % %Number
1st Trimester No Care 1st Trimester
2007 Pregnancy Nutrition Surveillance
Comparison of Maternal Behavioral Indicators by Contributor to Nation
8
Multivitamin Consumption
Prepregnancy During Preganancy
(3) (4)
Number % Number %
Connecticut 11,616 84.7 3.6 11,975 22.3 0 * 0 *
Nation (Prior Year) 579,816 78.5 5.6 944,971 31.2 206,967 74.138,592 15.7
(1) Reporting period is January 1 through December 31.(2) Excludes records with unknown data or errors.(3) Women who reported taking a multivitamin four times a week or more in the month before pregnancy; proxy for folic acid consumption.* Percentages are not calculated if <100 records are available for analysis after exclusions.

Page:
Run Date: 1 / 10 / 09(1)
(2)
Smoking
Table 7C
Comparison of Smoking Indicators
Connecticut
Number % %Number
3 MonthsPrior to Pregnancy
Last 3 Monthsof Pregnancy
Quit SmokingBy First Prenatal
Visit and Stayed OffCigarettes
Number %
Smoking in Household
Prenatal Postpartum
Number % Number %
2007 Pregnancy Nutrition Surveillance
Comparison of Smoking Indicators by Contributor to Nation
9
(3)
Connecticut 11,635 3.4 2,484 53.7 10,287 16.1 11,635 9.112,066 25.4
Nation (Prior Year) 692,984 16.8 156,923 35.0 514,582 22.5 443,951 24.1847,411 27.2
(1) Reporting period is January 1 through December 31.
(2) Excludes records with unknown data or errors.
(3) Among women who smoked 3 months prior to pregnancy.
* Percentages are not calculated if <100 records are available for analysis after exclusions.
Page:
Run Date: 1 / 10 / 09(1)
(2)
Birthweight
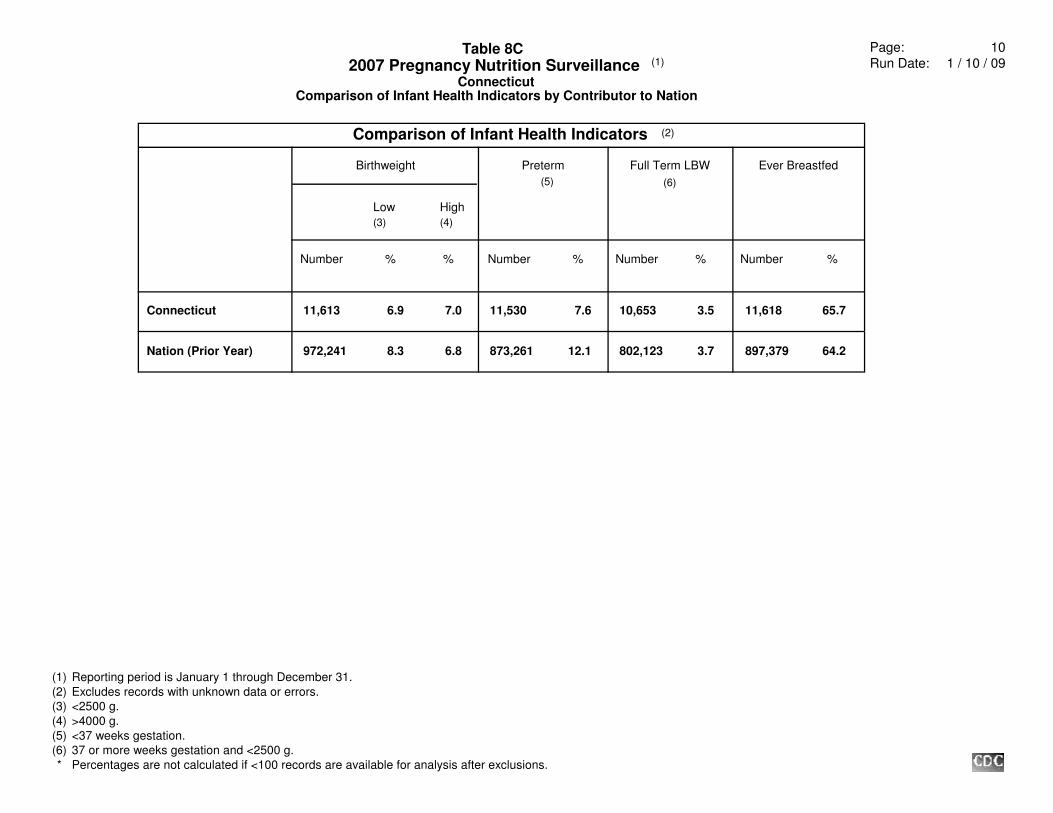
Table 8C
Comparison of Infant Health Indicators
Connecticut
Preterm Full Term LBW
Number % % %Number Number Number% %
Low High
Ever Breastfed
2007 Pregnancy Nutrition Surveillance
Comparison of Infant Health Indicators by Contributor to Nation
10
(3) (4)
(5) (6)
Connecticut 11,613 7.0 11,530 7.6 10,653 3.5 11,618 65.76.9
Nation (Prior Year) 972,241 6.8 873,261 12.1 802,123 3.7 897,379 64.28.3
(1) Reporting period is January 1 through December 31.
(2) Excludes records with unknown data or errors.
(3) <2500 g.
(4) >4000 g.
(5) <37 weeks gestation.
(6) 37 or more weeks gestation and <2500 g.
* Percentages are not calculated if <100 records are available for analysis after exclusions.

Page:Run Date: 1 / 10 / 09(1)
(2)
Prepregnancy BMI(3)
Table 9C
Maternal Health Indicators by Race/Ethnicity, Age, or Education
Weight Gain(4)
Anemia(Low Hb/Hct)
(5)
Number % % %%Number Number Number% %
Under-weight
Over-weight
< Ideal > Ideal 3rd Trimester Postpartum
2007 Pregnancy Nutrition SurveillanceConnecticut
Maternal Health Indicators by Race/Ethnicity, Age, or Education
11
Number % Number %
GestationalDiabetes
HypertensionDuring
Pregnancy
Race/Ethnicity
3,688 11.6 3,494 17.7 511 25.0 979 44.4White, Not Hispanic 62.943.3 3,657 0.0 3,657 0.2
2,637 8.1 2,415 13.2 379 42.7 1,023 58.3Black, Not Hispanic 70.052.6 2,512 0.0 2,512 0.5
5,259 8.9 4,851 10.9 497 28.2 1,771 52.5Hispanic 72.740.9 5,081 0.0 5,081 0.2
68 * 64 * 16 * 19 * American Indian/Alaskan Native * * 70 * 70 *
264 24.2 251 8.0 39 * 81 * Asian/Pacific Islander 72.519.7 267 0.0 267 0.4
51 * 46 * 4 * 9 * Multiple Races * * 48 * 48 *
1 * 0 * 0 * 0 * All Other/Unknown * * 0 * 0 *
Total 11,968 10.0 43.8 11,121 68.9 13.5 1,446 31.0 3,882 51.7 11,635 00.0 11,635 00.3
Age
< 15 Years 35 * 34 * * 3 * 13 * * 36 * 36 *
15 - 17 Years 744 17.1 686 69.0 13.7 69 * 243 57.625.0 705 0.0 705 0.1
18 - 19 Years 1,415 14.7 1,292 68.3 15.6 136 24.3 437 53.132.9 1,343 0.0 1,343 0.0
20 - 29 Years 6,934 10.0 6,466 67.0 14.3 876 30.3 2,168 52.244.2 6,763 0.0 6,763 0.2
30 - 39 Years 2,625 5.6 2,442 73.6 10.5 339 33.0 952 49.353.1 2,573 0.0 2,573 0.6
>= 40 Years 215 4.7 201 76.6 11.9 23 * 69 * 55.8 215 0.0 215 1.9
Unknown 0 * 0 * * 0 * 0 * * 0 * 0 *
Total 11,968 10.0 43.8 11,121 68.9 13.5 1,446 31.0 3,882 51.7 11,635 00.0 11,635 00.3
Education
< High School 0 * 0 * * 0 * 0 * * 0 * 0 *
High School 0 * 0 * * 0 * 0 * * 0 * 0 *
> High School 0 * 0 * * 0 * 0 * * 0 * 0 *
Unknown 11,968 10.0 11,121 68.9 13.5 1,446 31.0 3,882 51.743.8 11,635 0.0 11,635 0.3
Total 11,968 10.0 43.8 11,121 68.9 13.5 1,446 31.0 3,882 51.7 11,635 00.0 11,635 00.3
(1) Reporting period is January 1 through December 31.
(2) Excludes records with unknown data for health indicators, and data with errors for health and demographic indicators.
(3) Based on 1990 IOM report, "Nutrition During Pregnancy": underweight (BMI <19.8), overweight (BMI >26.0; includes overweight and obese women).
(4) Based on 1990 IOM report, "Nutrition During Pregnancy": underweight prepregnancy (ideal weight gain = 28 to 40 lbs), normal weight prepregnancy (ideal weight gain = 25
to 35 lbs), overweight prepregnancy (ideal weight gain = 15 to 25 lbs), obese prepregnancy (ideal weight gain = 15 to 25 lbs).
(5) Based on 1990 MMWR, "Recommendations to Prevent and Control Iron Deficiency in the United States"; adjusted for altitude and smoking.
* Percentages are not calculated if <100 records are available for analysis after exclusions.

Page:
Run Date: 1 / 10 / 09(1)
(2)
Medical Care
Table 10C
Maternal Behavioral Indicators by Race/Ethnicity, Age, or Education
WIC Enrollment
Number % % %Number
1st Trimester No Care
2007 Pregnancy Nutrition SurveillanceConnecticut
1st Trimester
Maternal Behavioral Indicators by Race/Ethnicity, Age, or Education
12
Multivitamin Consumption
Prepregnancy During Pregnancy
(3) (4)
Number Number% %
Race/Ethnicity
White, Not Hispanic 3,649 86.0 4.4 3,715 21.8 0 * 0 *
Black, Not Hispanic 2,508 84.2 3.1 2,628 18.9 0 * 0 *
Hispanic 5,076 84.2 3.2 5,239 24.6 0 * 0 *
American Indian/Alaskan Native 69 * * 70 * 0 * 0 *
Asian/Pacific Islander 267 82.8 5.2 270 17.4 0 * 0 *
Multiple Races 47 * * 52 * 0 * 0 *
All Other/Unknown 0 * * 1 * 0 * 0 *
Total 11,616 84.7 3.6 11,975 22.3 0 * 0 *
Age
< 15 Years 36 * * 36 * 0 * 0 *
15 - 17 Years 703 77.8 3.4 735 26.0 0 * 0 *
18 - 19 Years 1,340 82.9 4.0 1,406 27.7 0 * 0 *
20 - 29 Years 6,751 86.3 3.6 6,934 21.6 0 * 0 *
30 - 39 Years 2,571 84.4 3.7 2,646 20.1 0 * 0 *
>= 40 Years 215 78.6 2.8 218 19.7 0 * 0 *
Unknown 0 * * 0 * 0 * 0 *
Total 11,616 84.7 3.6 11,975 22.3 00 * *
Education
< High School 0 * * 0 * 0 0 * *
High School 0 * * 0 * 0 0 * *
> High School 0 * * 0 * 0 0 * *
Unknown 11,616 84.7 3.6 11,975 22.3 0 0 * *
Total 11,616 84.7 3.6 11,975 22.3 0 * 0 *
(1) Reporting period is January 1 through December 31.
(2) Excludes records with unknown data for behavioral indicators, and data with errors for behavioral and demographic indicators.
* Percentages are not calculated if <100 records are available for analysis after exclusions.

Page:
Run Date: 1 / 10 / 09(1)
(2)
Smoking
Table 11C
Smoking Indicators by Race/Ethnicity, Age, or Education
Number %
3 MonthsPrior to Pregnancy
2007 Pregnancy Nutrition Surveillance
Quit SmokingBy First Prenatal
Visit and Stayed OffCigarettes (3)
Smoking in Household
Last 3 Monthsof Pregnancy
Prenatal Postpartum
Number % Number Number Number% % %
Smoking Indicators by Race/Ethnicity, Age, or EducationConnecticut
13
Race/Ethnicity
White, Not Hispanic 3,747 44.8 3,657 8.2 1,308 47.4 2,939 27.2 3,657 15.6
Black, Not Hispanic 2,635 20.8 2,512 1.3 463 58.7 2,312 15.3 2,512 7.1
Hispanic 5,288 15.0 5,081 1.0 677 63.5 4,738 9.8 5,081 5.5
American Indian/Alaskan Native 70 * 70 * 16 * 53 * 70 *
Asian/Pacific Islander 273 4.4 267 0.4 9 * 207 9.2 267 5.6
Multiple Races 52 * 48 * 11 * 37 * 48 *
All Other/Unknown 1 * 0 * 0 * 1 * 0 *
Total 12,066 25.4 11,635 3.4 2,484 53.7 10,287 16.1 11,635 9.1
Age
< 15 Years * * * * * 36 36 2 32 36
15 - 17 Years 18.7 1.4 63.9 26.7 14.5742 705 122 682 705
18 - 19 Years 29.4 2.2 62.1 25.6 12.81,415 1,343 356 1,286 1,343
20 - 29 Years 28.0 3.5 54.1 15.7 8.86,994 6,763 1,576 5,912 6,763
30 - 39 Years 19.5 4.3 42.3 8.9 6.62,661 2,573 402 2,193 2,573
>= 40 Years 17.0 4.2 * 7.7 6.0218 215 26 182 215
Unknown * * * * * 0 0 0 0 0
Total 12,066 25.4 11,635 3.4 2,484 53.7 10,287 16.1 11,635 9.1
Education
< High School 0 * 0 * 0 * 0 * 0 *
High School 0 * 0 * 0 * 0 * 0 *
> High School 0 * 0 * 0 * 0 * 0 *
Unknown 12,066 25.4 11,635 3.4 2,484 53.7 10,287 16.1 11,635 9.1
Total 12,066 25.4 11,635 3.4 2,484 53.7 10,287 16.1 11,635 9.1
(1) Reporting period is January 1 through December 31.
(2) Excludes records with unknown data for smoking indicators, and data with errors for smoking and demographic indicators.
(3) Among women who smoked 3 months prior to pregnancy.
* Percentages are not calculated if <100 records are available for analysis after exclusions.

Page:
Run Date: 1 / 10 / 09(1)
(2)
Birthweight
Table 12C
Infant Health Indicators by Race/Ethnicity, Age, or Education
Number %
Low(3)
2007 Pregnancy Nutrition Surveillance
Preterm(5)
High(4)
Full Term LBW(6)
Ever Breastfed
% Number Number Number% % %
Infant Health Indicators by Race/Ethnicity, Age, or EducationConnecticut
14
Race/Ethnicity
White, Not Hispanic 3,651 7.8 3,622 7.2 3,360 3.1 3,652 60.36.4
Black, Not Hispanic 2,505 5.7 2,492 8.5 2,277 5.1 2,507 60.79.0
Hispanic 5,075 7.2 5,036 7.3 4,668 3.1 5,077 71.96.3
American Indian/Alaskan Native 70 * 70 * 62 * 70 * *
Asian/Pacific Islander 264 5.3 262 8.8 239 3.8 264 72.08.0
Multiple Races 48 * 48 * 47 * 48 * *
All Other/Unknown 0 * 0 * 0 * 0 * *
Total 11,613 6.9 7.0 11,530 7.6 10,653 3.5 11,618 65.7
Age
< 15 Years 36 * 36 * 31 * 36 * *
15 - 17 Years 701 3.6 692 6.2 648 5.2 702 59.38.0
18 - 19 Years 1,343 5.1 1,331 5.6 1,256 4.3 1,343 61.16.1
20 - 29 Years 6,752 7.3 6,698 7.3 6,207 3.2 6,753 66.25.9
30 - 39 Years 2,566 8.4 2,558 9.2 2,320 3.3 2,569 68.16.2
>= 40 Years 215 5.1 215 11.2 191 6.8 215 72.67.9
Unknown 0 * 0 * 0 * 0 * *
Total 11,613 6.9 7.0 11,530 7.6 10,653 3.5 11,618 65.7
Education
< High School 0 * 0 * 0 * 0 * *
High School 0 * 0 * 0 * 0 * *
> High School 0 * 0 * 0 * 0 * *
Unknown 11,613 7.0 11,530 7.6 10,653 3.5 11,618 65.76.2
Total 11,613 6.9 7.0 11,530 7.6 10,653 3.5 11,618 65.7
(1) Reporting period is January 1 through December 31.
(2) Excludes records with unknown data for health indicators, and data with errors for health and demographic indicators.
(3) <2500 g.
(4) >4000 g.
(5) <37 weeks gestation.
(6) 37 or more weeks gestation and <2500 g.
* Percentages are not calculated if <100 records are available for analysis after exclusions.

Page:
Run Date: 1 / 10 / 09(1)
(2)
Birthweight
Table 13C
Maternal Weight Gain and Birth Outcomes by Select Health Indicators
Number %
Low(4)
2007 Pregnancy Nutrition Surveillance
Preterm(6)High
(5)
Full Term LBW(7)
% Number Number Number% % %
Maternal Weight Gain and Birth Outcomes by Select Health IndicatorsConnecticut
%
Birth OutcomesWeight Gain (3)
< Ideal > Ideal
15
Prepregnancy BMI
Underweight 1,101 79.7 6.3 1,139 2.2 1,137 7.6 1,050 5.710.0
Normal Weight 5,152 74.6 10.3 5,307 6.1 5,281 7.5 4,882 3.77.2
Overweight 1,657 53.8 22.8 1,709 8.8 1,699 7.2 1,576 3.36.5
Obese 3,200 63.9 16.4 3,323 9.1 3,282 7.8 3,026 2.55.6
Weight Gain
< Ideal 7,648 6.1 7,587 8.1 6,969 3.9- 7.6- -
Ideal 1,952 7.9 1,942 6.0 1,825 3.1- 5.4- -
> Ideal 1,503 10.3 1,498 6.9 1,394 2.2- 5.3- -
Smoking During Pregnancy
Smokers 1,109 63.7 18.7 1,142 3.7 1,132 7.9 1,043 6.29.6
Non-Smokers 8,336 70.6 12.3 8,652 7.4 8,597 6.9 8,003 2.95.8
(1) Reporting period is January 1 through December 31.
(2) Excludes records with unknown data or errors.
(3) Based on 1990 IOM report, "Nutrition During Pregnancy": underweight prepregnancy (ideal weight gain = 28 to 40 lbs), normal weight prepregnancy (ideal weight gain = 25
to 35 lbs), overweight prepregnancy (ideal weight gain = 15 to 25 lbs), obese prepregnancy (ideal weight gain = 15 to 25 lbs).
(4) <2500 g.
(5) >4000 g.
(6) <37 weeks gestation.
(7) 37 or more weeks gestation and <2500 g.
* Percentages are not calculated if <100 records are available for analysis after exclusions.

Page:
Run Date: 1 / 10 / 09(1)
(2)
NumberIncluded in
Analysis % % %% %
Table 14C
Summary of Trends in Racial and Ethnic Distribution
Black, Not Hispanic Hispanic American Indian/Alaskan
Native
Asian/Pacific Islander
2007 Pregnancy Nutrition Surveillance
Summary of Trends in Racial and Ethnic Distribution
White, Not Hispanic
%
16
Connecticut
All Other/UnknownYear Multiple Races
%
12,107 21.9 43.8 0.6 2.32007 31.0 0.00.4
11,258 22.0 42.8 0.5 2.12006 32.0 0.00.5
10,623 21.8 42.0 0.4 2.12005 33.0 0.30.3
10,212 23.1 38.5 0.2 1.82004 33.1 3.20.0
14,142 24.3 38.5 0.2 1.52003 31.5 4.00.0
0 * * * * 2002 * * *
10,360 23.8 35.9 0.3 1.62001 34.4 4.10.0
0 * * * * 2000 * * *
0 * * * * 1999 * * *
0 * * * * 1998 * * *
0 * * * * 1997 * * *
0 * * * * 1996 * * *
0 * * * * 1995 * * *
0 * * * * 1994 * * *
0 * * * * 1993 * * *
0 * * * * 1992 * * *
0 * * * * 1991 * * *
0 * * * * 1990 * * *
409 32.0 19.1 0.5 0.01989 48.4 0.00.0
812 30.4 22.0 0.5 0.41988 46.7 0.00.0
555 31.5 18.9 0.2 0.21987 49.2 0.00.0
(1) Reporting period is January 1 through December 31.
(2) Excludes records with unknown data or errors.
* Percentages are not calculated if <100 records are available for analysis after exclusions.

Page:
Run Date: 1 / 10 / 09(1)
(2)
NumberIncluded in
Analysis % % %% %
Table 14C
Summary of Trends in Racial and Ethnic Distribution
Black, Not Hispanic Hispanic American Indian/Alaskan
Native
Asian/Pacific Islander
2007 Pregnancy Nutrition Surveillance
Summary of Trends in Racial and Ethnic Distribution
White, Not Hispanic
%
17
Connecticut
All Other/UnknownYear Multiple Races
%
331 29.0 12.7 0.3 0.01986 58.0 0.00.0
545 31.0 16.5 1.3 0.21985 51.0 0.00.0
534 29.0 11.8 0.9 0.21984 58.1 0.00.0
430 26.7 13.7 0.7 0.01983 58.8 0.00.0
(1) Reporting period is January 1 through December 31.
(2) Excludes records with unknown data or errors.
* Percentages are not calculated if <100 records are available for analysis after exclusions.

Page:
Run Date: 1 / 10 / 09(1)
(2)
NumberIncluded in
Analysis % % % % %
Table 15C
Summary of Trends in Age Distribution
15 - 17 Years 18 - 19 Years 20 - 29 Years 30 - 39 Years >= 40 Years
2007 Pregnancy Nutrition SurveillanceConnecticut
Summary of Trends in Age Distribution
Year < 15 Years
%
18
Unknown
%
12,107 6.2 11.8 58.0 22.0 1.82007 0.3 0.0
11,258 6.5 11.3 59.0 21.1 1.82006 0.3 0.0
10,623 6.5 11.4 57.6 22.3 1.92005 0.3 0.0
10,212 7.1 12.0 57.0 21.6 1.82004 0.4 0.0
14,142 6.7 12.5 57.4 21.3 1.62003 0.5 0.0
0 * * * * * 2002 * *
10,360 7.2 12.1 54.9 23.4 1.92001 0.5 0.0
0 * * * * * 2000 * *
0 * * * * * 1999 * *
0 * * * * * 1998 * *
0 * * * * * 1997 * *
0 * * * * * 1996 * *
0 * * * * * 1995 * *
0 * * * * * 1994 * *
0 * * * * * 1993 * *
0 * * * * * 1992 * *
0 * * * * * 1991 * *
0 * * * * * 1990 * *
409 10.0 14.4 57.7 17.1 0.21989 0.5 0.0
812 12.3 14.0 56.7 15.5 1.11988 0.4 0.0
(1) Reporting period is January 1 through December 31.
(2) Excludes records with unknown data or errors.
* Percentages are not calculated if <100 records are available for analysis after exclusions.

Page:
Run Date: 1 / 10 / 09(1)
(2)
NumberIncluded in
Analysis % % % % %
Table 15C
Summary of Trends in Age Distribution
15 - 17 Years 18 - 19 Years 20 - 29 Years 30 - 39 Years >= 40 Years
2007 Pregnancy Nutrition SurveillanceConnecticut
Summary of Trends in Age Distribution
Year < 15 Years
%
19
Unknown
%
555 8.1 12.6 60.0 17.8 0.71987 0.7 0.0
331 12.1 16.3 58.3 12.1 0.31986 0.9 0.0
545 12.8 17.6 51.6 15.6 0.91985 1.5 0.0
534 12.0 17.6 56.4 12.4 1.11984 0.6 0.0
430 12.8 16.3 59.3 10.9 0.21983 0.5 0.0
(1) Reporting period is January 1 through December 31.
(2) Excludes records with unknown data or errors.
* Percentages are not calculated if <100 records are available for analysis after exclusions.

Page:
Run Date: 1 / 10 / 09(1)
Prepregnancy BMI
Table 16C
Summary of Trends in Maternal Health Indicators
Weight Gain Anemia(Low Hb/Hct)
Number % % %%Number Number Number% %
Under-weight
Over-weight
< Ideal > Ideal 3rd Trimester Postpartum
2007 Pregnancy Nutrition Surveillance
(2)
(3) (4)
(5)
Connecticut
Summary of Trends in Maternal Health Indicators
Year
20
11,968 10.0 11,121 68.9 13.5 1,446 31.0 3,882 51.743.82007
11,158 10.0 10,404 67.3 14.3 1,335 28.4 3,820 50.942.92006
10,534 9.5 9,730 68.7 13.4 1,255 28.0 3,801 48.044.32005
10,130 11.2 9,429 68.0 14.5 1,271 30.7 3,631 47.842.62004
13,788 11.7 10,795 24.8 46.0 2,919 26.6 8,059 57.640.92003
0 * 0 * * 0 * 0 * * 2002
10,215 11.8 10,171 26.7 43.3 1,987 29.9 7,737 57.941.02001
0 * 0 * * 0 * 0 * * 2000
0 * 0 * * 0 * 0 * * 1999
0 * 0 * * 0 * 0 * * 1998
0 * 0 * * 0 * 0 * * 1997
0 * 0 * * 0 * 0 * * 1996
0 * 0 * * 0 * 0 * * 1995
0 * 0 * * 0 * 0 * * 1994
0 * 0 * * 0 * 0 * * 1993
Reporting period is January 1 through December 31.(1)
Excludes records with unknown data or errors.(2)
Based on 1990 IOM report, "Nutrition During Pregnancy": underweight (BMI <19.8), overweight (BMI >26.0; includes overweight and obese women).(3)
Based on 1990 IOM report, "Nutrition During Pregnancy": underweight prepregnancy (ideal weight gain = 28 to 40 lbs), normal weight prepregnancy (ideal weight gain = 25(4)
to 35 lbs), overweight prepregnancy (ideal weight gain = 15 to 25 lbs), obese prepregnancy (ideal weight gain = 15 to 25 lbs).
Based on 1990 CDC MMWR, "Recommendations to Prevent and Control Iron Deficiency in the United States"; adjusted for altitude and smoking.(5)
Percentages are not calculated if <100 records are available for analysis after exclusions.*

Page:
Run Date: 1 / 10 / 09(1)
Prepregnancy BMI
Table 16C
Summary of Trends in Maternal Health Indicators
Weight Gain Anemia(Low Hb/Hct)
Number % % %%Number Number Number% %
Under-weight
Over-weight
< Ideal > Ideal 3rd Trimester Postpartum
2007 Pregnancy Nutrition Surveillance
(2)
(3) (4)
(5)
Connecticut
Summary of Trends in Maternal Health Indicators
Year
21
0 * 0 * * 0 * 0 * * 1992
0 * 0 * * 0 * 0 * * 1991
0 * 0 * * 0 * 0 * * 1990
408 20.1 0 * * 99 * 136 34.623.51989
789 18.0 0 * * 132 22.7 152 39.528.31988
549 19.7 0 * * 134 34.3 126 24.626.81987
325 19.4 0 * * 67 * 107 23.424.91986
541 22.0 0 * * 118 19.5 214 20.122.41985
533 22.7 0 * * 126 25.4 255 21.218.41984
426 20.7 0 * * 96 * 217 26.321.41983
Reporting period is January 1 through December 31.(1)
Excludes records with unknown data or errors.(2)
Based on 1990 IOM report, "Nutrition During Pregnancy": underweight (BMI <19.8), overweight (BMI >26.0; includes overweight and obese women).(3)
Based on 1990 IOM report, "Nutrition During Pregnancy": underweight prepregnancy (ideal weight gain = 28 to 40 lbs), normal weight prepregnancy (ideal weight gain = 25(4)
to 35 lbs), overweight prepregnancy (ideal weight gain = 15 to 25 lbs), obese prepregnancy (ideal weight gain = 15 to 25 lbs).
Based on 1990 CDC MMWR, "Recommendations to Prevent and Control Iron Deficiency in the United States"; adjusted for altitude and smoking.(5)
Percentages are not calculated if <100 records are available for analysis after exclusions.*

Page:
Run Date: 1 / 10 / 09(1)
(2)
Medical Care
Table 17C
Summary of Trends in Maternal Behavioral Indicators
WIC Enrollment
Number % % %Number
1st Trimester No Care 1st Trimester
2007 Pregnancy Nutrition SurveillanceConnecticut
Summary of Trends in Maternal Behavioral Indicators
Year
22
11,616 84.7 3.6 11,975 22.32007
10,799 84.7 3.1 11,148 21.52006
10,134 86.6 2.8 10,239 21.92005
9,762 84.7 3.7 9,686 20.42004
11,377 84.9 4.4 13,888 17.82003
0 * * 0 * 2002
10,331 81.8 6.8 10,160 17.92001
0 * * 0 * 2000
0 * * 0 * 1999
0 * * 0 * 1998
0 * * 0 * 1997
0 * * 0 * 1996
0 * * 0 * 1995
0 * * 0 * 1994
0 * * 0 * 1993
0 * * 0 * 1992
0 * * 0 * 1991
(1) Reporting period is January 1 through December 31.
(2) Excludes records with unknown data or errors.
* Percentages are not calculated if <100 records are available for analysis after exclusions.

Page:
Run Date: 1 / 10 / 09(1)
(2)
Medical Care
Table 17C
Summary of Trends in Maternal Behavioral Indicators
WIC Enrollment
Number % % %Number
1st Trimester No Care 1st Trimester
2007 Pregnancy Nutrition SurveillanceConnecticut
Summary of Trends in Maternal Behavioral Indicators
Year
23
0 * * 0 * 1990
0 * * 0 * 1989
0 * * 0 * 1988
0 * * 0 * 1987
0 * * 0 * 1986
0 * * 0 * 1985
0 * * 0 * 1984
0 * * 0 * 1983
(1) Reporting period is January 1 through December 31.
(2) Excludes records with unknown data or errors.
* Percentages are not calculated if <100 records are available for analysis after exclusions.

Page:
Run Date: 1 / 10 / 09(1)
(2)
Smoking
Table 18C
Summary of Trends in Smoking Indicators
Number % %Number
3 MonthsPrior to Pregnancy
Last 3 Monthsof Pregnancy
Quit SmokingBy First Prenatal
Visit and Stayed OffCigarettes (3)
Number %
Smoking in Household
Prenatal Postpartum
Number % Number %
2007 Pregnancy Nutrition SurveillanceConnecticut
Summary of Trends in Smoking Indicators
Year
24
11,635 3.4 2,484 53.7 10,287 16.1 11,635 9.112,066 25.42007
10,808 3.6 2,408 54.3 9,544 15.9 10,808 9.111,230 26.62006
10,141 3.7 2,358 53.7 9,092 16.9 10,141 9.610,604 27.32005
9,771 4.5 2,301 51.1 8,701 18.5 9,771 10.92,803 100.02004
11,385 15.6 2,255 42.0 11,431 20.8 10,929 11.814,099 26.02003
0 * 0 * 0 * 0 * 0 * 2002
10,346 15.3 2,308 37.9 8,079 24.5 10,271 14.810,320 27.12001
0 * 0 * 0 * 0 * 0 * 2000
0 * 0 * 0 * 0 * 0 * 1999
0 * 0 * 0 * 0 * 0 * 1998
0 * 0 * 0 * 0 * 0 * 1997
0 * 0 * 0 * 0 * 0 * 1996
0 * 0 * 0 * 0 * 0 * 1995
0 * 0 * 0 * 0 * 0 * 1994
0 * 0 * 0 * 0 * 0 * 1993
0 * 0 * 0 * 0 * 0 * 1992
0 * 0 * 0 * 0 * 0 * 1991
(1) Reporting period is January 1 through December 31.
(2) Excludes records with unknown data or errors.
(3) Among women who smoked 3 months prior to pregnancy.
* Percentages are not calculated if <100 records are available for analysis after exclusions.

Page:
Run Date: 1 / 10 / 09(1)
(2)
Smoking
Table 18C
Summary of Trends in Smoking Indicators
Number % %Number
3 MonthsPrior to Pregnancy
Last 3 Monthsof Pregnancy
Quit SmokingBy First Prenatal
Visit and Stayed OffCigarettes (3)
Number %
Smoking in Household
Prenatal Postpartum
Number % Number %
2007 Pregnancy Nutrition SurveillanceConnecticut
Summary of Trends in Smoking Indicators
Year
25
0 * 0 * 0 * 0 * 0 * 1990
0 * 0 * 0 * 0 * 0 * 1989
0 * 0 * 0 * 0 * 0 * 1988
0 * 0 * 0 * 0 * 0 * 1987
0 * 0 * 0 * 0 * 0 * 1986
0 * 0 * 0 * 0 * 0 * 1985
0 * 0 * 0 * 0 * 0 * 1984
0 * 0 * 0 * 0 * 0 * 1983
(1) Reporting period is January 1 through December 31.
(2) Excludes records with unknown data or errors.
(3) Among women who smoked 3 months prior to pregnancy.
* Percentages are not calculated if <100 records are available for analysis after exclusions.

Page:
Run Date: 1 / 10 / 09(1)
(2)
Birthweight
Table 19C
Summary of Trends in Infant Health Indicators
Preterm(5)
Full Term LBW(6)
Number % % %Number Number Number% %
Low(3)
High(4)
Ever Breastfed
2007 Pregnancy Nutrition SurveillanceConnecticut
Summary of Trends in Infant Health Indicators
Year
26
11,613 7.0 11,530 7.6 10,653 3.5 11,618 65.76.92007
10,779 7.2 10,718 7.9 9,853 3.5 10,800 63.47.42006
10,125 7.6 9,787 8.8 8,913 3.5 10,136 61.97.72005
9,757 7.4 9,285 7.8 8,558 3.4 9,763 59.77.22004
9,747 7.6 10,668 9.0 8,767 3.7 10,791 42.17.42003
0 * 0 * 0 * 0 * * 2002
9,016 8.6 9,985 8.8 8,113 3.5 10,093 40.07.12001
0 * 0 * 0 * 0 * * 2000
0 * 0 * 0 * 0 * * 1999
0 * 0 * 0 * 0 * * 1998
0 * 0 * 0 * 0 * * 1997
0 * 0 * 0 * 0 * * 1996
0 * 0 * 0 * 0 * * 1995
0 * 0 * 0 * 0 * * 1994
(1) Reporting period is January 1 through December 31.
(2) Excludes records with unknown data or errors.
(3) <2500 g.
(4) >4000 g.
(5) <37 weeks gestation.
(6) 37 or more weeks gestation and <2500 g.
* Percentages are not calculated if <100 records are available for analysis after exclusions.

Page:
Run Date: 1 / 10 / 09(1)
(2)
Birthweight
Table 19C
Summary of Trends in Infant Health Indicators
Preterm(5)
Full Term LBW(6)
Number % % %Number Number Number% %
Low(3)
High(4)
Ever Breastfed
2007 Pregnancy Nutrition SurveillanceConnecticut
Summary of Trends in Infant Health Indicators
Year
27
0 * 0 * 0 * 0 * * 1993
0 * 0 * 0 * 0 * * 1992
0 * 0 * 0 * 0 * * 1991
0 * 0 * 0 * 0 * * 1990
409 7.1 400 0.5 398 7.5 100 100.07.61989
411 11.4 409 0.7 406 5.7 95 * 5.81988
354 9.6 350 0.9 347 6.1 63 * 6.21987
324 11.1 322 1.6 317 7.3 65 * 7.41986
525 9.3 522 0.8 518 6.0 99 * 6.11985
500 9.4 495 2.4 483 8.9 149 100.09.21984
424 6.4 422 4.0 405 6.7 123 100.07.31983
(1) Reporting period is January 1 through December 31.
(2) Excludes records with unknown data or errors.
(3) <2500 g.
(4) >4000 g.
(5) <37 weeks gestation.
(6) 37 or more weeks gestation and <2500 g.
* Percentages are not calculated if <100 records are available for analysis after exclusions.

Page:
Run Date: 1 / 10 / 09(1)
Prepregnancy BMI
Table 20C
Summary of Trends in Maternal Health Indicators by Race/Ethnicity
Weight Gain Anemia(Low Hb/Hct)
Number % % %%Number Number Number% %
Under-weight
Over-weight
< Ideal > Ideal 3rd Trimester Postpartum
2007 Pregnancy Nutrition Surveillance
(2)
(3) (4)
(5)
Connecticut
Summary of Trends in Maternal Health Indicators by Race/Ethnicity
Race/Ethnicity and Year
28
3,688 11.6 3,494 62.9 17.7 511 25.0 979 44.443.32007White, Not Hispanic3,569 12.1 3,376 59.5 20.4 455 22.6 958 44.943.120063,466 11.1 3,255 61.8 19.4 438 21.0 1,041 42.744.120053,350 13.3 3,171 60.5 19.7 432 25.5 1,059 42.542.120044,361 13.4 3,585 20.5 52.5 908 21.5 2,336 54.041.220030 * 0 * * 0 * 0 * * 20023,527 14.1 3,510 23.0 47.2 673 24.8 2,373 55.041.120010 * 0 * * 0 * 0 * * 20000 * 0 * * 0 * 0 * * 19990 * 0 * * 0 * 0 * * 1998
2,637 8.1 2,415 70.0 13.2 379 42.7 1,023 58.352.62007Black, Not Hispanic2,461 8.0 2,262 66.6 14.0 387 41.3 996 58.149.820062,305 7.4 2,092 69.9 12.5 313 39.3 962 52.051.520052,335 9.1 2,155 67.6 14.5 366 38.3 966 55.151.920043,377 9.4 2,490 26.5 45.7 855 34.4 2,041 63.447.920030 * 0 * * 0 * 0 * * 20022,430 8.7 2,413 28.9 43.3 565 38.2 2,019 63.650.720010 * 0 * * 0 * 0 * * 20000 * 0 * * 0 * 0 * * 19990 * 0 * * 0 * 0 * * 1998
Reporting period is January 1 through December 31.(1)
Excludes data with errors.(2)
Based on 1990 IOM report, "Nutrition During Pregnancy": underweight (BMI <19.8), overweight (BMI >26.0; includes overweight and obese women).(3)
Based on 1990 IOM report, "Nutrition During Pregnancy": underweight prepregnancy (ideal weight gain = 28 to 40 lbs), normal weight prepregnancy (ideal weight gain = 25(4)
to 35 lbs), overweight prepregnancy (ideal weight gain = 15 to 25 lbs), obese prepregnancy (ideal weight gain = 15 to 25 lbs).
Based on 1990 MMWR, "Recommendations to Prevent and Control Iron Deficiency in the United States"; adjusted for altitude and smoking.(5)
Percentages are not calculated if <100 records are available for analysis after exclusions.*

Page:
Run Date: 1 / 10 / 09(1)
Prepregnancy BMI
Table 20C
Summary of Trends in Maternal Health Indicators by Race/Ethnicity
Weight Gain Anemia(Low Hb/Hct)
Number % % %%Number Number Number% %
Under-weight
Over-weight
< Ideal > Ideal 3rd Trimester Postpartum
2007 Pregnancy Nutrition Surveillance
(2)
(3) (4)
(5)
Connecticut
Summary of Trends in Maternal Health Indicators by Race/Ethnicity
Race/Ethnicity and Year
29
5,259 8.9 4,851 72.7 10.9 497 28.2 1,771 52.540.92007Hispanic4,784 8.9 4,442 72.8 10.3 448 22.8 1,753 50.740.420064,440 8.8 4,081 73.4 9.2 466 27.3 1,694 49.041.820053,925 9.5 3,614 74.2 10.5 379 29.3 1,417 48.139.320045,315 10.9 4,091 26.5 42.1 994 25.7 3,210 57.138.020030 * 0 * * 0 * 0 * * 20023,673 10.5 3,663 27.7 40.9 638 29.3 2,900 57.437.220010 * 0 * * 0 * 0 * * 20000 * 0 * * 0 * 0 * * 19990 * 0 * * 0 * 0 * * 1998
68 * 64 * * 16 * 19 * * 2007American Indian/Alaskan Native51 * 48 * * 7 * 18 * * 200645 * 38 * * 4 * 12 * * 200522 * 20 * * 3 * 8 * * 200421 * 15 * * 5 * 10 * * 20030 * 0 * * 0 * 0 * * 200226 * 26 * * 7 * 21 * * 20010 * 0 * * 0 * 0 * * 20000 * 0 * * 0 * 0 * * 19990 * 0 * * 0 * 0 * * 1998
Reporting period is January 1 through December 31.(1)
Excludes data with errors.(2)
Based on 1990 IOM report, "Nutrition During Pregnancy": underweight (BMI <19.8), overweight (BMI >26.0; includes overweight and obese women).(3)
Based on 1990 IOM report, "Nutrition During Pregnancy": underweight prepregnancy (ideal weight gain = 28 to 40 lbs), normal weight prepregnancy (ideal weight gain = 25(4)
to 35 lbs), overweight prepregnancy (ideal weight gain = 15 to 25 lbs), obese prepregnancy (ideal weight gain = 15 to 25 lbs).
Based on 1990 MMWR, "Recommendations to Prevent and Control Iron Deficiency in the United States"; adjusted for altitude and smoking.(5)
Percentages are not calculated if <100 records are available for analysis after exclusions.*

Page:
Run Date: 1 / 10 / 09(1)
Prepregnancy BMI
Table 20C
Summary of Trends in Maternal Health Indicators by Race/Ethnicity
Weight Gain Anemia(Low Hb/Hct)
Number % % %%Number Number Number% %
Under-weight
Over-weight
< Ideal > Ideal 3rd Trimester Postpartum
2007 Pregnancy Nutrition Surveillance
(2)
(3) (4)
(5)
Connecticut
Summary of Trends in Maternal Health Indicators by Race/Ethnicity
Race/Ethnicity and Year
30
264 24.2 251 72.5 8.0 39 * 81 * 19.72007Asian/Pacific Islander233 25.3 220 81.4 5.9 30 * 78 * 21.02006223 18.8 208 78.4 7.7 29 * 73 * 25.62005178 30.3 173 78.0 6.9 35 * 59 * 15.72004214 31.8 186 37.1 26.3 56 * 127 52.815.920030 * 0 * * 0 * 0 * * 2002166 28.9 166 30.7 34.3 31 * 119 55.515.120010 * 0 * * 0 * 0 * * 20000 * 0 * * 0 * 0 * * 19990 * 0 * * 0 * 0 * * 1998
51 * 46 * * 4 * 9 * * 2007Multiple Races57 * 53 * * 8 * 17 * * 200627 * 28 * * 2 * 10 * * 20052 * 0 * * 0 * 0 * * 20040 * 0 * * 0 * 0 * * 20030 * 0 * * 0 * 0 * * 20020 * 0 * * 0 * 0 * * 20010 * 0 * * 0 * 0 * * 20000 * 0 * * 0 * 0 * * 19990 * 0 * * 0 * 0 * * 1998
Reporting period is January 1 through December 31.(1)
Excludes data with errors.(2)
Based on 1990 IOM report, "Nutrition During Pregnancy": underweight (BMI <19.8), overweight (BMI >26.0; includes overweight and obese women).(3)
Based on 1990 IOM report, "Nutrition During Pregnancy": underweight prepregnancy (ideal weight gain = 28 to 40 lbs), normal weight prepregnancy (ideal weight gain = 25(4)
to 35 lbs), overweight prepregnancy (ideal weight gain = 15 to 25 lbs), obese prepregnancy (ideal weight gain = 15 to 25 lbs).
Based on 1990 MMWR, "Recommendations to Prevent and Control Iron Deficiency in the United States"; adjusted for altitude and smoking.(5)
Percentages are not calculated if <100 records are available for analysis after exclusions.*

Page:
Run Date: 1 / 10 / 09(1)
Prepregnancy BMI
Table 20C
Summary of Trends in Maternal Health Indicators by Race/Ethnicity
Weight Gain Anemia(Low Hb/Hct)
Number % % %%Number Number Number% %
Under-weight
Over-weight
< Ideal > Ideal 3rd Trimester Postpartum
2007 Pregnancy Nutrition Surveillance
(2)
(3) (4)
(5)
Connecticut
Summary of Trends in Maternal Health Indicators by Race/Ethnicity
Race/Ethnicity and Year
31
1 * 0 * * 0 * 0 * * 2007All Other/Unknown3 * 3 * * 0 * 0 * * 200628 * 28 * * 3 * 9 * * 2005318 14.5 296 68.9 13.5 56 * 122 40.236.22004500 13.0 428 28.5 40.2 101 22.8 335 53.131.820030 * 0 * * 0 * 0 * * 2002393 15.3 393 34.4 36.6 73 * 305 49.527.220010 * 0 * * 0 * 0 * * 20000 * 0 * * 0 * 0 * * 19990 * 0 * * 0 * 0 * * 1998
11,968 10.0 11,121 68.9 13.5 1,446 31.0 3,882 51.743.82007Total All Race/Ethnic Groups11,158 10.0 10,404 67.3 14.3 1,335 28.4 3,820 50.942.9200610,534 9.5 9,730 68.7 13.4 1,255 28.0 3,801 48.044.3200510,130 11.2 9,429 68.0 14.5 1,271 30.7 3,631 47.842.6200413,788 11.7 10,795 24.8 46.0 2,919 26.6 8,059 57.640.920030 * 0 * * 0 * 0 * * 200210,215 11.8 10,171 26.7 43.3 1,987 29.9 7,737 57.941.020010 * 0 * * 0 * 0 * * 20000 * 0 * * 0 * 0 * * 19990 * 0 * * 0 * 0 * * 1998
Reporting period is January 1 through December 31.(1)
Excludes data with errors.(2)
Based on 1990 IOM report, "Nutrition During Pregnancy": underweight (BMI <19.8), overweight (BMI >26.0; includes overweight and obese women).(3)
Based on 1990 IOM report, "Nutrition During Pregnancy": underweight prepregnancy (ideal weight gain = 28 to 40 lbs), normal weight prepregnancy (ideal weight gain = 25(4)
to 35 lbs), overweight prepregnancy (ideal weight gain = 15 to 25 lbs), obese prepregnancy (ideal weight gain = 15 to 25 lbs).
Based on 1990 MMWR, "Recommendations to Prevent and Control Iron Deficiency in the United States"; adjusted for altitude and smoking.(5)
Percentages are not calculated if <100 records are available for analysis after exclusions.*

Page:
Run Date: 1 / 10 / 09(1)
(2)
Medical Care
Table 21C
Summary of Trends in Maternal Behavioral Indicators by Race/Ethnicity
WIC Enrollment
Number % % %Number
1st Trimester No Care 1st Trimester
2007 Pregnancy Nutrition SurveillanceConnecticut
Summary of Trends in Maternal Behavioral Indicators by Race/Ethnicity
Race/Ethnicity and Year
32
3,649 86.0 4.4 3,715 21.82007White, Not Hispanic3,496 87.7 3.3 3,559 22.020063,385 88.5 3.4 3,368 23.120053,281 87.1 4.0 3,219 20.520043,732 87.6 4.6 4,373 17.920030 * * 0 * 20023,551 86.3 5.7 3,488 18.120010 * * 0 * 20000 * * 0 * 19990 * * 0 * 1998
2,508 84.2 3.1 2,628 18.92007Black, Not Hispanic2,342 83.1 3.1 2,463 18.820062,180 84.4 2.5 2,256 19.520052,218 83.0 3.4 2,245 20.820042,604 82.6 4.2 3,376 15.820030 * * 0 * 20022,456 79.2 7.0 2,415 16.620010 * * 0 * 20000 * * 0 * 19990 * * 0 * 1998
(1) Reporting period is January 1 through December 31.
(2) Excludes data with errors.
* Percentages are not calculated if <100 records are available for analysis after exclusions.

Page:
Run Date: 1 / 10 / 09(1)
(2)
Medical Care
Table 21C
Summary of Trends in Maternal Behavioral Indicators by Race/Ethnicity
WIC Enrollment
Number % % %Number
1st Trimester No Care 1st Trimester
2007 Pregnancy Nutrition SurveillanceConnecticut
Summary of Trends in Maternal Behavioral Indicators by Race/Ethnicity
Race/Ethnicity and Year
33
5,076 84.2 3.2 5,239 24.62007Hispanic4,622 83.3 3.0 4,776 22.820064,249 86.8 2.3 4,307 22.820053,742 84.7 3.0 3,703 21.220044,336 84.7 3.7 5,359 19.720030 * * 0 * 20023,708 80.3 7.0 3,652 19.620010 * * 0 * 20000 * * 0 * 19990 * * 0 * 1998
69 * * 70 * 2007American Indian/Alaskan Native50 * * 51 * 200641 * * 41 * 200520 * * 21 * 200416 * * 21 * 20030 * * 0 * 200226 * * 26 * 20010 * * 0 * 20000 * * 0 * 19990 * * 0 * 1998
(1) Reporting period is January 1 through December 31.
(2) Excludes data with errors.
* Percentages are not calculated if <100 records are available for analysis after exclusions.

Page:
Run Date: 1 / 10 / 09(1)
(2)
Medical Care
Table 21C
Summary of Trends in Maternal Behavioral Indicators by Race/Ethnicity
WIC Enrollment
Number % % %Number
1st Trimester No Care 1st Trimester
2007 Pregnancy Nutrition SurveillanceConnecticut
Summary of Trends in Maternal Behavioral Indicators by Race/Ethnicity
Race/Ethnicity and Year
34
267 82.8 5.2 270 17.42007Asian/Pacific Islander231 84.0 3.0 238 17.22006223 78.5 6.3 212 14.22005181 78.5 6.1 171 14.02004192 80.2 5.7 214 8.920030 * * 0 * 2002168 78.0 10.7 165 11.520010 * * 0 * 20000 * * 0 * 19990 * * 0 * 1998
47 * * 52 * 2007Multiple Races55 * * 58 * 200628 * * 27 * 20050 * * 2 * 20040 * * 0 * 20030 * * 0 * 20020 * * 0 * 20010 * * 0 * 20000 * * 0 * 19990 * * 0 * 1998
(1) Reporting period is January 1 through December 31.
(2) Excludes data with errors.
* Percentages are not calculated if <100 records are available for analysis after exclusions.

Page:
Run Date: 1 / 10 / 09(1)
(2)
Medical Care
Table 21C
Summary of Trends in Maternal Behavioral Indicators by Race/Ethnicity
WIC Enrollment
Number % % %Number
1st Trimester No Care 1st Trimester
2007 Pregnancy Nutrition SurveillanceConnecticut
Summary of Trends in Maternal Behavioral Indicators by Race/Ethnicity
Race/Ethnicity and Year
35
0 * * 1 * 2007All Other/Unknown3 * * 3 * 200628 * * 28 * 2005320 75.9 8.4 325 11.42004497 80.1 8.7 545 13.920030 * * 0 * 2002422 74.4 12.3 414 11.620010 * * 0 * 20000 * * 0 * 19990 * * 0 * 1998
11,616 84.7 3.6 11,975 22.32007Total All Race/Ethnic Groups10,799 84.7 3.1 11,148 21.5200610,134 86.6 2.8 10,239 21.920059,762 84.7 3.7 9,686 20.4200411,377 84.9 4.4 13,888 17.820030 * * 0 * 200210,331 81.8 6.8 10,160 17.920010 * * 0 * 20000 * * 0 * 19990 * * 0 * 1998
(1) Reporting period is January 1 through December 31.
(2) Excludes data with errors.
* Percentages are not calculated if <100 records are available for analysis after exclusions.

Page:
Run Date: 1 / 10 / 09(1)
(2)
Smoking
Table 22C
Summary of Trends in Smoking Indicators by Race/Ethnicity
Number % %Number
3 MonthsPrior to Pregnancy
Last 3 Monthsof Pregnancy
Quit SmokingBy First Prenatal
Visit and Stayed OffCigarettes (3)
Number %
Smoking in Household
Prenatal Postpartum
Number % Number %
2007 Pregnancy Nutrition SurveillanceConnecticut
Summary of Trends in Smoking Indicators by Race/Ethnicity
Race/Ethnicity and Year
36
3,657 8.2 1,308 47.4 2,939 27.2 3,657 15.63,747 44.8White, Not Hispanic 20073,500 8.3 1,240 47.9 2,770 26.5 3,500 15.23,599 45.520063,390 8.3 1,240 47.3 2,739 26.5 3,390 15.83,508 45.320053,285 9.9 1,250 44.6 2,625 30.5 3,285 17.41,601 100.020043,734 25.9 1,243 37.7 3,352 32.7 3,637 19.14,447 45.220030 * 0 * 0 * 0 * 0 * 20023,556 28.3 1,306 34.3 2,569 38.3 3,540 23.23,550 46.820010 * 0 * 0 * 0 * 0 * 20000 * 0 * 0 * 0 * 0 * 19990 * 0 * 0 * 0 * 0 * 1998
2,512 1.3 463 58.7 2,312 15.3 2,512 7.12,635 20.8Black, Not Hispanic 20072,342 1.8 477 57.0 2,201 13.8 2,342 7.72,466 22.320062,181 2.0 473 55.2 2,104 16.5 2,181 7.92,309 23.520052,222 2.4 449 53.9 2,117 16.1 2,222 8.0520 100.020042,606 13.0 430 40.9 2,894 19.5 2,517 9.23,406 20.820030 * 0 * 0 * 0 * 0 * 20022,462 12.1 481 37.4 2,005 20.5 2,450 11.62,447 21.820010 * 0 * 0 * 0 * 0 * 20000 * 0 * 0 * 0 * 0 * 19990 * 0 * 0 * 0 * 0 * 1998
(1) Reporting period is January 1 through December 31.
(2) Excludes data with errors.
(3) Among women who smoked 3 months prior to pregnancy.
* Percentages are not calculated if <100 records are available for analysis after exclusions.

Page:
Run Date: 1 / 10 / 09(1)
(2)
Smoking
Table 22C
Summary of Trends in Smoking Indicators by Race/Ethnicity
Number % %Number
3 MonthsPrior to Pregnancy
Last 3 Monthsof Pregnancy
Quit SmokingBy First Prenatal
Visit and Stayed OffCigarettes (3)
Number %
Smoking in Household
Prenatal Postpartum
Number % Number %
2007 Pregnancy Nutrition SurveillanceConnecticut
Summary of Trends in Smoking Indicators by Race/Ethnicity
Race/Ethnicity and Year
37
5,081 1.0 677 63.5 4,738 9.8 5,081 5.55,288 15.0Hispanic 20074,625 1.2 658 65.3 4,308 10.3 4,625 5.24,813 15.620064,250 1.1 614 65.3 4,001 10.6 4,250 5.64,459 16.120053,743 1.4 553 62.0 3,570 11.6 3,743 7.1614 100.020044,339 9.6 547 50.8 4,680 13.7 4,127 7.65,441 16.120030 * 0 * 0 * 0 * 0 * 20023,712 6.8 486 47.3 3,108 16.7 3,688 9.53,708 14.720010 * 0 * 0 * 0 * 0 * 20000 * 0 * 0 * 0 * 0 * 19990 * 0 * 0 * 0 * 0 * 1998
70 * 16 * 53 * 70 * 70 * American Indian/Alaskan Native 200750 * 6 * 40 * 50 * 52 * 200641 * 8 * 34 * 41 * 45 * 200520 * 3 * 19 * 20 * 5 * 200416 * 0 * 15 * 15 * 22 * 20030 * 0 * 0 * 0 * 0 * 200226 * 2 * 20 * 26 * 26 * 20010 * 0 * 0 * 0 * 0 * 20000 * 0 * 0 * 0 * 0 * 19990 * 0 * 0 * 0 * 0 * 1998
(1) Reporting period is January 1 through December 31.
(2) Excludes data with errors.
(3) Among women who smoked 3 months prior to pregnancy.
* Percentages are not calculated if <100 records are available for analysis after exclusions.

Page:
Run Date: 1 / 10 / 09(1)
(2)
Smoking
Table 22C
Summary of Trends in Smoking Indicators by Race/Ethnicity
Number % %Number
3 MonthsPrior to Pregnancy
Last 3 Monthsof Pregnancy
Quit SmokingBy First Prenatal
Visit and Stayed OffCigarettes (3)
Number %
Smoking in Household
Prenatal Postpartum
Number % Number %
2007 Pregnancy Nutrition SurveillanceConnecticut
Summary of Trends in Smoking Indicators by Race/Ethnicity
Race/Ethnicity and Year
38
267 0.4 9 * 207 9.2 267 5.6273 4.4Asian/Pacific Islander 2007233 0.0 9 * 176 12.5 233 8.6239 6.72006223 0.4 11 * 173 12.1 223 9.9227 5.32005181 0.0 13 * 140 12.1 181 6.617 * 2004193 2.6 12 * 150 18.0 190 4.7219 7.320030 * 0 * 0 * 0 * 0 * 2002168 2.4 9 * 109 17.4 168 12.5168 6.520010 * 0 * 0 * 0 * 0 * 20000 * 0 * 0 * 0 * 0 * 19990 * 0 * 0 * 0 * 0 * 1998
48 * 11 * 37 * 48 * 52 * Multiple Races 200755 * 18 * 48 * 55 * 58 * 200628 * 8 * 19 * 28 * 28 * 20050 * 0 * 2 * 0 * 1 * 20040 * 0 * 0 * 0 * 0 * 20030 * 0 * 0 * 0 * 0 * 20020 * 0 * 0 * 0 * 0 * 20010 * 0 * 0 * 0 * 0 * 20000 * 0 * 0 * 0 * 0 * 19990 * 0 * 0 * 0 * 0 * 1998
(1) Reporting period is January 1 through December 31.
(2) Excludes data with errors.
(3) Among women who smoked 3 months prior to pregnancy.
* Percentages are not calculated if <100 records are available for analysis after exclusions.

Page:
Run Date: 1 / 10 / 09(1)
(2)
Smoking
Table 22C
Summary of Trends in Smoking Indicators by Race/Ethnicity
Number % %Number
3 MonthsPrior to Pregnancy
Last 3 Monthsof Pregnancy
Quit SmokingBy First Prenatal
Visit and Stayed OffCigarettes (3)
Number %
Smoking in Household
Prenatal Postpartum
Number % Number %
2007 Pregnancy Nutrition SurveillanceConnecticut
Summary of Trends in Smoking Indicators by Race/Ethnicity
Race/Ethnicity and Year
39
0 * 0 * 1 * 0 * 1 * All Other/Unknown 20073 * 0 * 1 * 3 * 3 * 200628 * 4 * 22 * 28 * 28 * 2005320 2.2 33 * 228 15.8 320 10.345 * 2004497 8.9 23 * 340 14.4 443 8.1564 10.520030 * 0 * 0 * 0 * 0 * 2002422 6.4 24 * 268 15.7 399 8.5421 10.020010 * 0 * 0 * 0 * 0 * 20000 * 0 * 0 * 0 * 0 * 19990 * 0 * 0 * 0 * 0 * 1998
11,635 3.4 2,484 53.7 10,287 16.1 11,635 9.112,066 25.4Total All Race/Ethnic Groups 200710,808 3.6 2,408 54.3 9,544 15.9 10,808 9.111,230 26.6200610,141 3.7 2,358 53.7 9,092 16.9 10,141 9.610,604 27.320059,771 4.5 2,301 51.1 8,701 18.5 9,771 10.92,803 100.0200411,385 15.6 2,255 42.0 11,431 20.8 10,929 11.814,099 26.020030 * 0 * 0 * 0 * 0 * 200210,346 15.3 2,308 37.9 8,079 24.5 10,271 14.810,320 27.120010 * 0 * 0 * 0 * 0 * 20000 * 0 * 0 * 0 * 0 * 19990 * 0 * 0 * 0 * 0 * 1998
(1) Reporting period is January 1 through December 31.
(2) Excludes data with errors.
(3) Among women who smoked 3 months prior to pregnancy.
* Percentages are not calculated if <100 records are available for analysis after exclusions.

Page:
Run Date: 1 / 10 / 09(1)
(2)
Birthweight
Table 23C
Summary of Trends in Infant Health Indicators by Race/Ethnicity
Preterm(5)
Full Term LBW(6)
Number % % %Number Number Number% %
Low(3)
High(4)
Ever Breastfed
2007 Pregnancy Nutrition SurveillanceConnecticut
Summary of Trends in Infant Health Indicators by Race/Ethnicity
Race/Ethnicity and Year
40
3,651 7.8 3,622 7.2 3,360 3.1 3,652 60.36.4White, Not Hispanic 20073,492 9.1 3,464 8.0 3,181 2.7 3,499 56.56.520063,385 9.1 3,255 9.0 2,960 3.1 3,387 56.37.120053,280 8.8 3,128 7.9 2,878 2.6 3,282 53.36.220043,236 9.5 3,507 9.1 2,899 2.9 3,574 32.86.220030 * 0 * 0 * 0 * * 20023,150 10.2 3,419 8.2 2,845 2.8 3,470 31.56.020010 * 0 * 0 * 0 * * 20000 * 0 * 0 * 0 * * 19990 * 0 * 0 * 0 * * 1998
2,505 5.7 2,492 8.5 2,277 5.1 2,507 60.79.0Black, Not Hispanic 20072,334 6.0 2,327 8.1 2,134 5.0 2,340 57.49.420062,175 6.1 2,127 10.5 1,899 4.7 2,180 54.310.920052,218 5.5 2,118 8.7 1,930 5.4 2,221 53.29.720042,177 6.0 2,435 10.3 1,931 4.8 2,465 40.29.920030 * 0 * 0 * 0 * * 20022,103 6.3 2,365 9.7 1,867 5.2 2,387 35.79.920010 * 0 * 0 * 0 * * 20000 * 0 * 0 * 0 * * 19990 * 0 * 0 * 0 * * 1998
(1) Reporting period is January 1 through December 31.
(2) Excludes data with errors.
(3) <2500 g.
(4) >4000 g.
(5) <37 weeks gestation.
(6) 37 or more weeks gestation and <2500 g.
* Percentages are not calculated if <100 records are available for analysis after exclusions.

Page:
Run Date: 1 / 10 / 09(1)
(2)
Birthweight
Table 23C
Summary of Trends in Infant Health Indicators by Race/Ethnicity
Preterm(5)
Full Term LBW(6)
Number % % %Number Number Number% %
Low(3)
High(4)
Ever Breastfed
2007 Pregnancy Nutrition SurveillanceConnecticut
Summary of Trends in Infant Health Indicators by Race/Ethnicity
Race/Ethnicity and Year
41
5,075 7.2 5,036 7.3 4,668 3.1 5,077 71.96.3Hispanic 20074,613 6.5 4,589 7.7 4,226 3.2 4,621 71.06.920064,245 7.5 4,102 7.9 3,773 2.9 4,249 69.56.520053,739 7.1 3,532 7.0 3,284 3.0 3,740 67.66.420043,776 7.2 4,080 8.6 3,426 3.8 4,097 48.97.020030 * 0 * 0 * 0 * * 20023,251 8.9 3,603 8.9 2,941 3.1 3,634 48.06.220010 * 0 * 0 * 0 * * 20000 * 0 * 0 * 0 * * 19990 * 0 * 0 * 0 * * 1998
70 * 70 * 62 * 70 * * American Indian/Alaskan Native200750 * 49 * 45 * 50 * * 200641 * 37 * 34 * 41 * * 200520 * 19 * 17 * 20 * * 200411 * 12 * 9 * 12 * * 20030 * 0 * 0 * 0 * * 200222 * 26 * 18 * 25 * * 20010 * 0 * 0 * 0 * * 20000 * 0 * 0 * 0 * * 19990 * 0 * 0 * 0 * * 1998
(1) Reporting period is January 1 through December 31.
(2) Excludes data with errors.
(3) <2500 g.
(4) >4000 g.
(5) <37 weeks gestation.
(6) 37 or more weeks gestation and <2500 g.
* Percentages are not calculated if <100 records are available for analysis after exclusions.

Page:
Run Date: 1 / 10 / 09(1)
(2)
Birthweight
Table 23C
Summary of Trends in Infant Health Indicators by Race/Ethnicity
Preterm(5)
Full Term LBW(6)
Number % % %Number Number Number% %
Low(3)
High(4)
Ever Breastfed
2007 Pregnancy Nutrition SurveillanceConnecticut
Summary of Trends in Infant Health Indicators by Race/Ethnicity
Race/Ethnicity and Year
42
264 5.3 262 8.8 239 3.8 264 72.08.0Asian/Pacific Islander 2007232 4.7 231 7.8 213 7.0 232 73.711.22006223 4.5 211 7.6 195 6.2 223 73.59.02005180 6.1 168 8.9 153 2.6 180 67.810.02004170 0.6 183 7.7 155 3.9 188 47.99.420030 * 0 * 0 * 0 * * 2002140 5.7 163 9.2 125 2.4 164 42.77.120010 * 0 * 0 * 0 * * 20000 * 0 * 0 * 0 * * 19990 * 0 * 0 * 0 * * 1998
48 * 48 * 47 * 48 * * Multiple Races 200755 * 55 * 52 * 55 * * 200628 * 27 * 25 * 28 * * 20050 * 0 * 0 * 0 * * 20040 * 0 * 0 * 0 * * 20030 * 0 * 0 * 0 * * 20020 * 0 * 0 * 0 * * 20010 * 0 * 0 * 0 * * 20000 * 0 * 0 * 0 * * 19990 * 0 * 0 * 0 * * 1998
(1) Reporting period is January 1 through December 31.
(2) Excludes data with errors.
(3) <2500 g.
(4) >4000 g.
(5) <37 weeks gestation.
(6) 37 or more weeks gestation and <2500 g.
* Percentages are not calculated if <100 records are available for analysis after exclusions.

Page:
Run Date: 1 / 10 / 09(1)
(2)
Birthweight
Table 23C
Summary of Trends in Infant Health Indicators by Race/Ethnicity
Preterm(5)
Full Term LBW(6)
Number % % %Number Number Number% %
Low(3)
High(4)
Ever Breastfed
2007 Pregnancy Nutrition SurveillanceConnecticut
Summary of Trends in Infant Health Indicators by Race/Ethnicity
Race/Ethnicity and Year
43
0 * 0 * 0 * 0 * * All Other/Unknown 20073 * 3 * 2 * 3 * * 200628 * 28 * 27 * 28 * * 2005320 9.7 320 7.5 296 3.4 320 72.87.52004377 8.2 451 7.1 347 2.6 455 62.05.320030 * 0 * 0 * 0 * * 2002350 7.4 409 8.1 317 3.2 413 62.27.120010 * 0 * 0 * 0 * * 20000 * 0 * 0 * 0 * * 19990 * 0 * 0 * 0 * * 1998
11,613 7.0 11,530 7.6 10,653 3.5 11,618 65.76.9Total All Race/Ethnic Groups 200710,779 7.2 10,718 7.9 9,853 3.5 10,800 63.47.4200610,125 7.6 9,787 8.8 8,913 3.5 10,136 61.97.720059,757 7.4 9,285 7.8 8,558 3.4 9,763 59.77.220049,747 7.6 10,668 9.0 8,767 3.7 10,791 42.17.420030 * 0 * 0 * 0 * * 20029,016 8.6 9,985 8.8 8,113 3.5 10,093 40.07.120010 * 0 * 0 * 0 * * 20000 * 0 * 0 * 0 * * 19990 * 0 * 0 * 0 * * 1998
(1) Reporting period is January 1 through December 31.
(2) Excludes data with errors.
(3) <2500 g.
(4) >4000 g.
(5) <37 weeks gestation.
(6) 37 or more weeks gestation and <2500 g.
* Percentages are not calculated if <100 records are available for analysis after exclusions.