pregnancy nutrition surveillance 2010 reportstacks.cdc.gov/view/cdc/21456/cdc_21456_ds1.pdf2010 pnss...
TRANSCRIPT
Pregnancy Nutrition Surveillance
2010 Report
National Center for Chronic Disease Prevention and Health Promotion Division of Nutrition, Physical Activity, and Obesity
Suggested CitationDalenius K, Brindley P, Smith B, Reinold C, Grummer-Strawn L. Pregnancy Nutrition Surveillance 2010 Report. Atlanta: U.S. Department of Health and Human Services, Centers for Disease Control and Prevention; 2012.
AcknowledgementsWe gratefully acknowledge and thank all contributors to the national Pregnancy Nutrition Surveillance System. The efforts of state, territorial, and Indian Tribal Organization surveillance coordinators; informatics staff; and local clinic staff to collect data and use nutrition surveillance systems make the Pregnancy Nutrition Surveillance System possible.
This report is available online at www.cdc.gov/pednss/pdfs/PNSS_2010.pdf.
For more information, contactDivision of Nutrition, Physical Activity, and Obesity National Center for Chronic Disease Prevention and Health Promotion Centers for Disease Control and Prevention 4770 Buford Highway NE, Mail Stop K-25 Atlanta, GA 30341-3717 800-CDC-INFO (232-4636)TTY: 888-232-6348
This report summarizes selected data on maternal health and nutrition indicators received from states, U.S. territories, and Indian Tribal Organizations that contributed to the Centers for Disease Control and Prevention’s (CDC's) Pregnancy Nutrition Surveillance System.
This report was developed by CDC’s Division of Nutrition, Physical Activity, and Obesity in the National Center for Chronic Disease Prevention and Health Promotion.
2010 PNSS Report 1
The Pregnancy Nutrition Surveillance System (PNSS) is a public health surveillance system that monitors the prevalence of nutrition problems, behavioral risk factors, and birth outcomes among low-income women who are enrolled in public health programs in states, U.S. territories, or Indian Tribal Organizations (ITOs).
The goal of the PNSS is to collect, analyze, and disseminate surveillance data to guide public health policy and action. The collected data are used to set public health priorities and to plan, implement, and evaluate nutrition programs for pregnant women. This report summarizes PNSS data from 2010 and highlights data trends from 2001 through 2010.
The PNSS collects demographic data about maternal age, race and ethnicity, education level, household income, migrant status, and participation in food and medical assistance programs. Information about a mother’s height; weight before, during, and after pregnancy; hemoglobin and hematocrit levels; parity; medical care during pregnancy; and enrollment in the Special Supplemental Nutrition Program for Women, Infants, and Children (WIC) also is collected.
In addition, the PNSS collects information about patterns of maternal smoking and alcohol consumption 3 months before and during pregnancy. Data collected about infants include date of birth, birthweight, and breastfeeding status.
Data are collected at the clinic level, aggregated at the state level, and then submitted to the Centers for Disease Control and Prevention (CDC) for analysis. The PNSS generates surveillance reports for each contributor and for the nation, using results from participating contributors. A contributor is defined as a state, U.S. territory, or ITO.
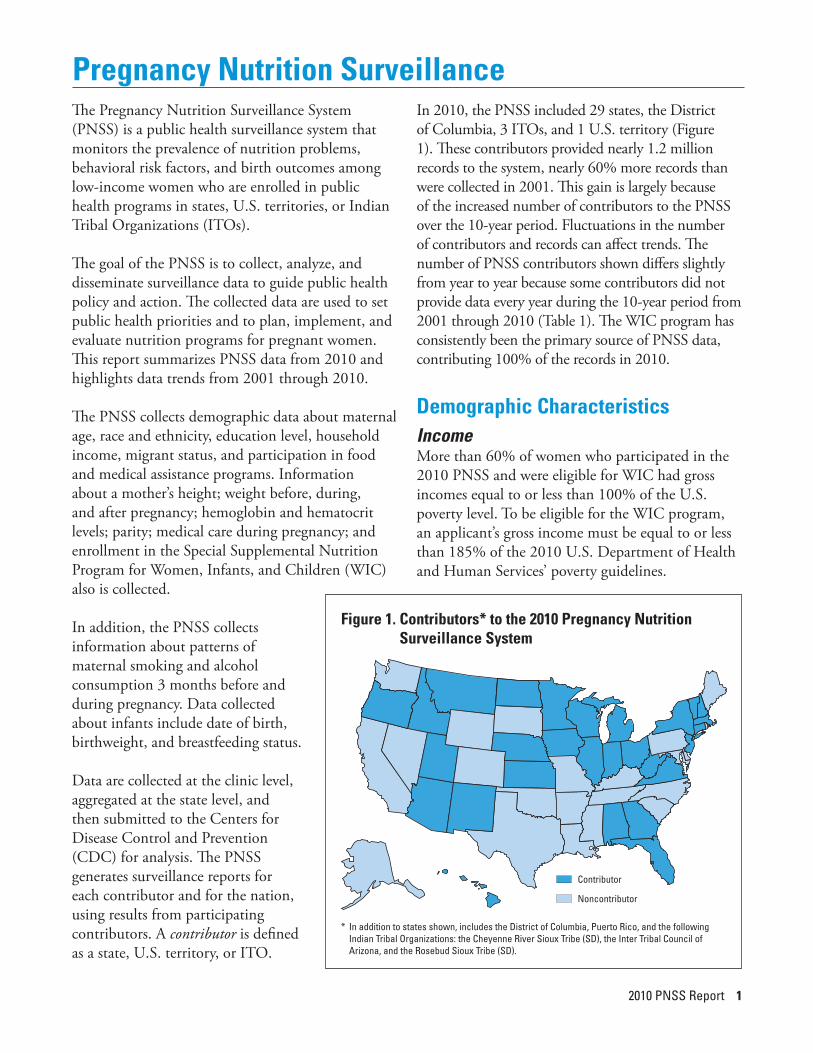
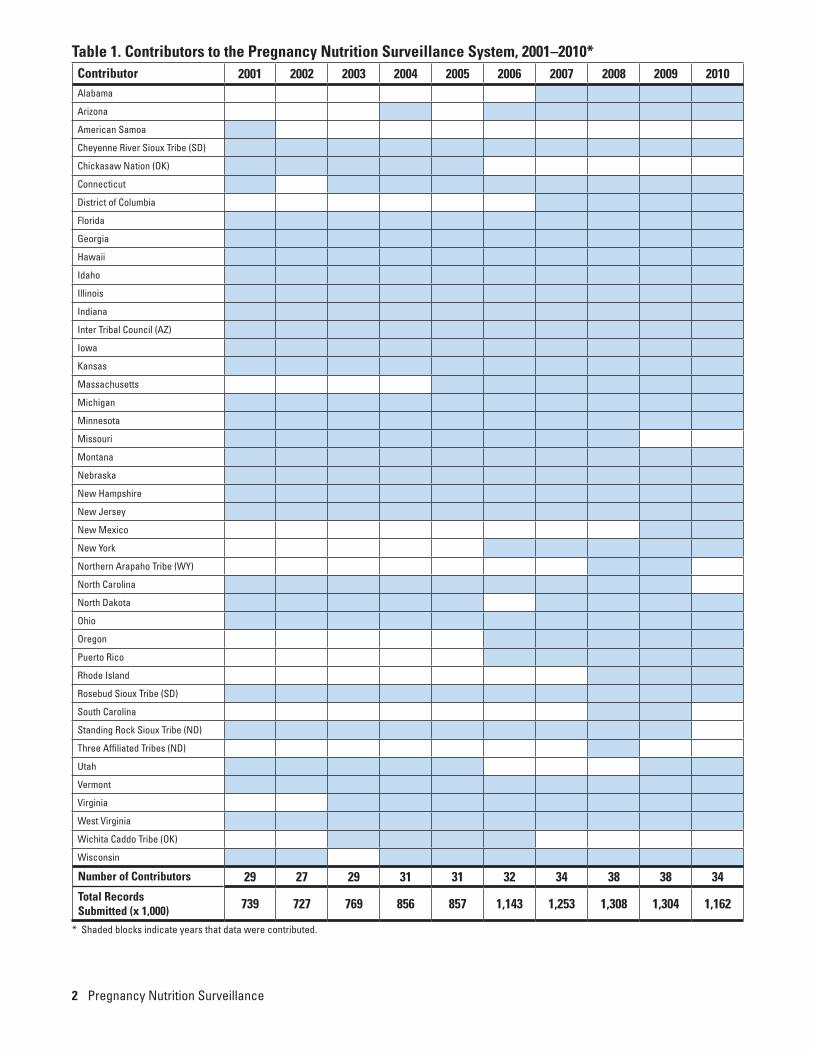
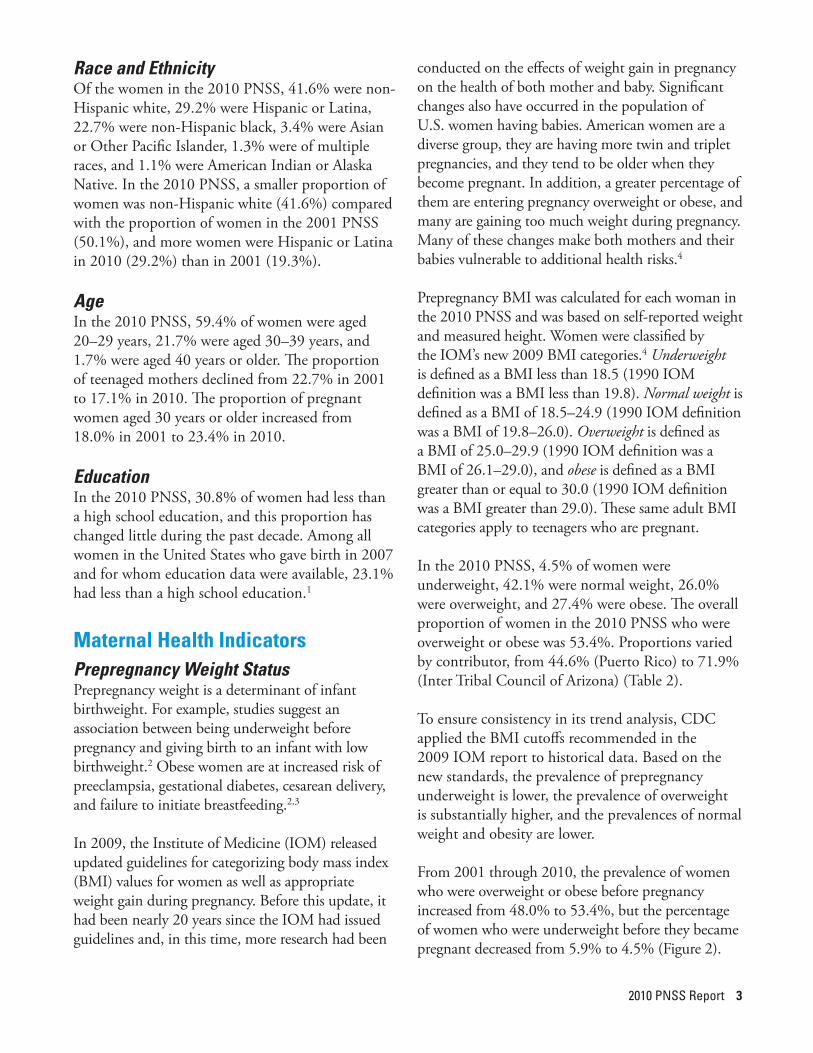
In 2010, the PNSS included 29 states, the District of Columbia, 3 ITOs, and 1 U.S. territory (Figure 1). These contributors provided nearly 1.2 million records to the system, nearly 60% more records than were collected in 2001. This gain is largely because of the increased number of contributors to the PNSS over the 10-year period. Fluctuations in the number of contributors and records can affect trends. The number of PNSS contributors shown differs slightly from year to year because some contributors did not provide data every year during the 10-year period from 2001 through 2010 (Table 1). The WIC program has consistently been the primary source of PNSS data, contributing 100% of the records in 2010.
Demographic CharacteristicsIncomeMore than 60% of women who participated in the 2010 PNSS and were eligible for WIC had gross incomes equal to or less than 100% of the U.S. poverty level. To be eligible for the WIC program, an applicant’s gross income must be equal to or less than 185% of the 2010 U.S. Department of Health and Human Services’ poverty guidelines.
Contributor
Noncontributor
Pregnancy Nutrition Surveillance
* In addition to states shown, includes the District of Columbia, Puerto Rico, and the following Indian Tribal Organizations: the Cheyenne River Sioux Tribe (SD), the Inter Tribal Council of Arizona, and the Rosebud Sioux Tribe (SD).
Figure 1. Contributors* to the 2010 Pregnancy Nutrition Surveillance System
2 Pregnancy Nutrition Surveillance
Table 1. Contributors to the Pregnancy Nutrition Surveillance System, 2001–2010*Contributor 2001 2002 2003 2004 2005 2006 2007 2008 2009 2010Alabama
Arizona
American Samoa
Cheyenne River Sioux Tribe (SD)
Chickasaw Nation (OK)
Connecticut
District of Columbia
Florida
Georgia
Hawaii
Idaho
Illinois
Indiana
Inter Tribal Council (AZ)
Iowa
Kansas
Massachusetts
Michigan
Minnesota
Missouri
Montana
Nebraska
New Hampshire
New Jersey
New Mexico
New York
Northern Arapaho Tribe (WY)
North Carolina
North Dakota
Ohio
Oregon
Puerto Rico
Rhode Island
Rosebud Sioux Tribe (SD)
South Carolina
Standing Rock Sioux Tribe (ND)
Three Affiliated Tribes (ND)
Utah
Vermont
Virginia
West Virginia
Wichita Caddo Tribe (OK)
Wisconsin
Number of Contributors 29 27 29 31 31 32 34 38 38 34Total Records Submitted (x 1,000) 739 727 769 856 857 1,143 1,253 1,308 1,304 1,162
* Shaded blocks indicate years that data were contributed.
2010 PNSS Report 3
Race and EthnicityOf the women in the 2010 PNSS, 41.6% were non-Hispanic white, 29.2% were Hispanic or Latina, 22.7% were non-Hispanic black, 3.4% were Asian or Other Pacific Islander, 1.3% were of multiple races, and 1.1% were American Indian or Alaska Native. In the 2010 PNSS, a smaller proportion of women was non-Hispanic white (41.6%) compared with the proportion of women in the 2001 PNSS (50.1%), and more women were Hispanic or Latina in 2010 (29.2%) than in 2001 (19.3%).
AgeIn the 2010 PNSS, 59.4% of women were aged 20–29 years, 21.7% were aged 30–39 years, and 1.7% were aged 40 years or older. The proportion of teenaged mothers declined from 22.7% in 2001 to 17.1% in 2010. The proportion of pregnant women aged 30 years or older increased from 18.0% in 2001 to 23.4% in 2010.
EducationIn the 2010 PNSS, 30.8% of women had less than a high school education, and this proportion has changed little during the past decade. Among all women in the United States who gave birth in 2007 and for whom education data were available, 23.1% had less than a high school education.1
Maternal Health IndicatorsPrepregnancy Weight StatusPrepregnancy weight is a determinant of infant birthweight. For example, studies suggest an association between being underweight before pregnancy and giving birth to an infant with low birthweight.2 Obese women are at increased risk of preeclampsia, gestational diabetes, cesarean delivery, and failure to initiate breastfeeding.2,3
In 2009, the Institute of Medicine (IOM) released updated guidelines for categorizing body mass index (BMI) values for women as well as appropriate weight gain during pregnancy. Before this update, it had been nearly 20 years since the IOM had issued guidelines and, in this time, more research had been
conducted on the effects of weight gain in pregnancy on the health of both mother and baby. Significant changes also have occurred in the population of U.S. women having babies. American women are a diverse group, they are having more twin and triplet pregnancies, and they tend to be older when they become pregnant. In addition, a greater percentage of them are entering pregnancy overweight or obese, and many are gaining too much weight during pregnancy. Many of these changes make both mothers and their babies vulnerable to additional health risks.4
Prepregnancy BMI was calculated for each woman in the 2010 PNSS and was based on self-reported weight and measured height. Women were classified by the IOM’s new 2009 BMI categories.4 Underweight is defined as a BMI less than 18.5 (1990 IOM definition was a BMI less than 19.8). Normal weight is defined as a BMI of 18.5–24.9 (1990 IOM definition was a BMI of 19.8–26.0). Overweight is defined as a BMI of 25.0–29.9 (1990 IOM definition was a BMI of 26.1–29.0), and obese is defined as a BMI greater than or equal to 30.0 (1990 IOM definition was a BMI greater than 29.0). These same adult BMI categories apply to teenagers who are pregnant.
In the 2010 PNSS, 4.5% of women were underweight, 42.1% were normal weight, 26.0% were overweight, and 27.4% were obese. The overall proportion of women in the 2010 PNSS who were overweight or obese was 53.4%. Proportions varied by contributor, from 44.6% (Puerto Rico) to 71.9% (Inter Tribal Council of Arizona) (Table 2).
To ensure consistency in its trend analysis, CDC applied the BMI cutoffs recommended in the 2009 IOM report to historical data. Based on the new standards, the prevalence of prepregnancy underweight is lower, the prevalence of overweight is substantially higher, and the prevalences of normal weight and obesity are lower.
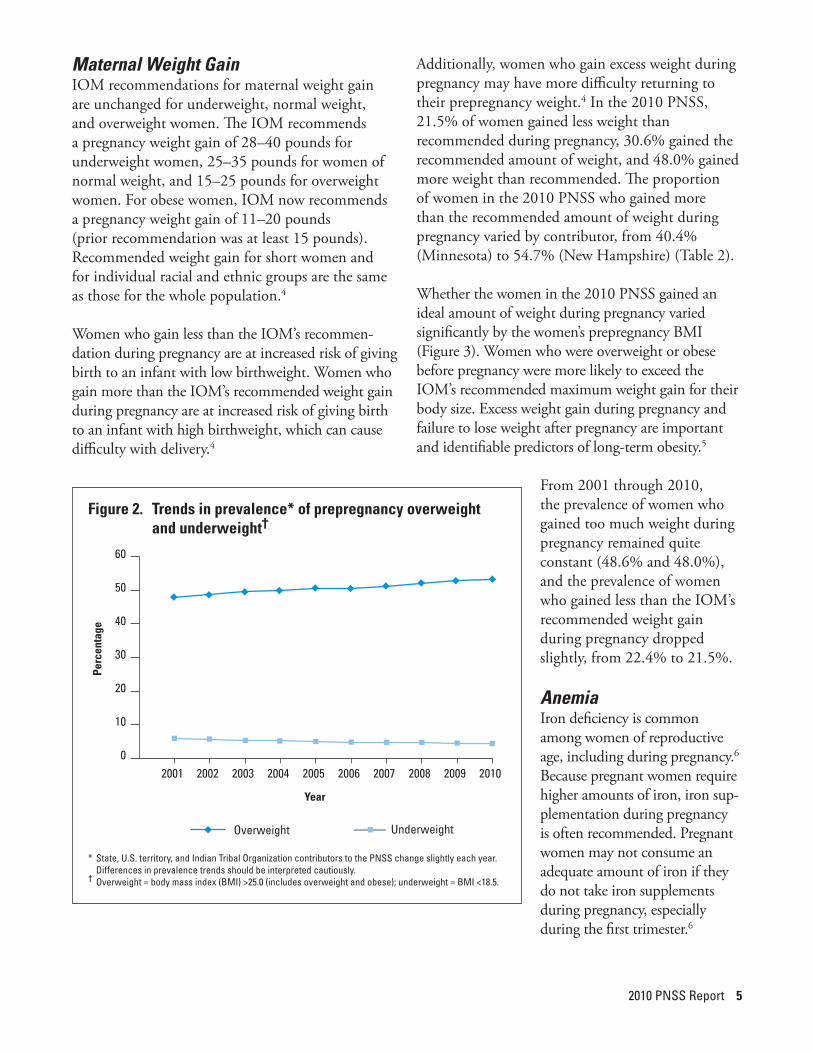
From 2001 through 2010, the prevalence of women who were overweight or obese before pregnancy increased from 48.0% to 53.4%, but the percentage of women who were underweight before they became pregnant decreased from 5.9% to 4.5% (Figure 2).

4 Pregnancy Nutrition Surveillance
Smok
ing
Cont
ribu
tors
Und
er-
wei
ght†
Ove
r-
wei
ght†
< Id
eal
wt g
ain‡
> Id
eal
wt g
ain‡
3rd
trim
an
emia
§Po
st p
an
emia
1st t
rim
m
edN
o
med
1st t
rim
W
IC3
mos
b/
f pre
g3r
d
trim
Hou
se
pren
atal
Hou
se
post
pLB
W¶
HB
W**
Pre-
te
rm††
Ever
B
F‡‡
Alab
ama
5.4
57.0
**
41.1
36.7
**
44.8
**
**
9.9
4.8
14.4
*Ar
izona
4.5
53.2
20.4
51.2
24.3
21.1
**
37.8
6.9
3.1
5.4
5.5
7.1
6.4
10.5
66.5
Chey
enne
Riv
er S
ioux
Trib
e (S
D)3.
566
.0*
**
**
*25
.751
.05.
732
.827
.34.
38.
78.
440
.0Co
nnec
ticut
3.6
54.2
**
33.9
48.3
84.4
7.1
26.2
24.2
2.6
8.0
*7.
07.
47.
769
.7Di
stric
t of C
olum
bia
4.0
55.5
27.3
42.8
49.1
40.1
64.6
2.7
24.2
6.5
3.6
12.9
10.0
9.6
5.6
14.4
51.2
Flor
ida
4.7
51.5
22.2
49.1
40.5
35.9
**
37.6
**
**
8.8
5.9
12.4
74.0
Geor
gia
3.9
55.7
22.7
48.5
36.4
26.5
82.4
3.7
40.6
15.4
7.2
13.3
9.0
**
9.7
56.3
Haw
aii
5.3
48.4
18.9
53.1
25.7
21.0
77.3
5.0
23.2
**
**
7.5
6.5
5.2
86.8
Idah
o4.
053
.917
.450
.221
.517
.4*
*38
.225
.112
.214
.911
.56.
46.
89.
384
.5Ill
inoi
s3.
955
.524
.047
.333
.333
.7*
*39
.218
.610
.215
.812
.06.
17.
47.
467
.9In
dian
a4.
954
.618
.953
.337
.526
.9*
*41
.828
.920
.237
.631
.28.
26.
414
.166
.6In
ter T
ribal
Cou
ncil
(AZ)
1.9
71.9
20.2
53.9
29.7
28.3
76.2
5.0
31.5
10.7
1.5
10.5
9.1
6.5
8.9
8.8
65.8
Iow
a2.
559
.017
.750
.828
.321
.2*
*46
.838
.522
.516
.96.
97.
87.
611
.3*
Kans
as4.
155
.021
.150
.729
.023
.775
.16.
136
.130
.717
.516
.513
.37.
66.
68.
472
.2M
assa
chus
etts
4.2
50.5
20.5
50.2
34.5
35.0
74.0
9.8
36.7
20.8
10.0
15.3
10.5
7.2
7.6
8.4
*M
ichi
gan
4.3
54.7
18.1
50.9
35.9
28.0
80.9
8.9
37.5
32.9
17.3
17.9
6.1
8.5
7.2
12.0
59.8
Min
neso
ta3.
455
.230
.440
.427
.018
.6*
*38
.427
.911
.2*
*6.
69.
59.
375
.3M
onta
na3.
653
.516
.150
.121
.020
.7*
**
39.4
24.5
16.5
12.9
7.4
6.8
10.6
78.7
Neb
rask
a3.
855
.920
.247
.227
.122
.987
.73.
328
.931
.415
.5*
*7.
87.
410
.973
.5N
ew H
amps
hire
5.3
51.3
18.1
54.7
26.3
22.8
89.8
2.4
37.1
41.1
25.0
22.2
16.1
7.7
9.3
6.9
73.9
New
Jer
sey
4.7
51.6
20.9
43.6
37.4
47.6
**
23.7
6.8
3.6
6.4
6.3
7.3
6.2
11.9
63.2
New
Mex
ico
4.6
53.1
20.1
45.0
24.4
21.1
**
37.2
21.3
5.0
8.0
9.7
8.3
4.5
10.5
73.1
New
Yor
k4.
451
.022
.142
.037
.832
.586
.81.
629
.615
.97.
77.
2*
8.0
6.6
10.2
75.2
Nor
th D
akot
a2.
956
.117
.250
.128
.521
.7*
*45
.144
.424
.315
.66.
78.
57.
811
.7*
Ohio
4.9
54.5
21.6
5130
.024
.6*
*33
.236
.720
.736
.632
.88.
96.
110
.750
.9Or
egon
3.4
56.4
16.8
50.5
26.4
20.4
**
41.8
**
**
6.1
9.4
8.3
92.1
Puer
to R
ico
8.1
44.6
**
42.1
31.0
**
**
*16
.717
.2*
*15
.5*
Rhod
e Is
land
4.5
50.8
18.8
51.7
31.9
31.9
86.5
4.2
45.9
19.9
10.1
16.0
15.1
7.3
7.4
12.9
61.1
Rose
bud
Siou
x Tr
ibe
(SD)
1.9
58.9
26.9
52.0
*41
.9*
*30
.442
.314
.727
.121
.45.
06.
012
.666
.3Ut
ah3.
950
.519
.748
.419
.012
.784
.77.
119
.93.
01.
34.
62.
77.
26.
011
.392
.2Ve
rmon
t 4.
852
.718
.649
.724
.823
.378
.30.
235
.841
.329
.1*
*6.
69.
58.
878
.0Vi
rgin
ia4.
554
.118
.648
.736
.026
.076
.82.
533
.827
.610
.020
.742
.58.
96.
910
.762
.6W
est V
irgin
ia6.
652
.420
.549
.127
.823
.786
.16.
050
.550
.634
.128
.420
.99.
26.
011
.744
.2W
isco
nsin
3.5
56.6
22.8
49.2
32.1
23.9
87.2
2.5
35.8
34.5
18.4
17.4
5.3
7.9
7.1
9.9
70.4
Nat
iona
l PN
SS4.
553
.421
.548
.033
.928
.183
.14.
136
.023
.012
.116
.315
.68.
06.
710
.768
.2
Abbr
evia
tions
: Wt =
wei
ght;
Trim
= tr
imes
ter;
Post
p =
pos
tpar
tum
; Med
= e
ntry
to m
edic
al c
are;
WIC
= S
peci
al S
uppl
emen
tal N
utrit
ion
Prog
ram
for W
omen
, Inf
ants
, and
Chi
ldre
n; M
os =
mon
ths;
b/f
pre
g =
befo
re p
regn
ant;
Hous
e =
hous
ehol
d; L
BW =
low
birt
hwei
ght;
HBW
= h
igh
birth
wei
ght;
Ever
BF
= ev
er b
reas
tfed.
* Pe
rcen
tage
s ar
e no
t cal
cula
ted
if <1
00 re
cord
s w
ere
avai
labl
e fo
r ana
lysi
s af
ter e
xclu
sion
of m
issi
ng o
r mis
code
d da
ta.
† Pr
epre
gnan
cy w
eigh
t sta
tus:
Und
erw
eigh
t = b
ody
mas
s in
dex
(BM
I) <1
8.5;
Ove
rwei
ght =
BM
I ≥25
.0 (i
nclu
des
over
wei
ght a
nd o
bese
). So
urce
: Wei
ght G
ain
Durin
g Pr
egna
ncy:
Ree
xam
inin
g th
e Gu
idel
ines
. Nat
iona
l Aca
dem
ies
Pres
s; 2
009.
‡ Re
com
men
ded
preg
nanc
y w
eigh
t gai
n =
28–4
0 lb
if u
nder
wei
ght,
25–3
5 lb
if n
orm
al w
eigh
t, 15
–25
lb if
ove
rwei
ght,
and
11–2
0 lb
if o
bese
. Sou
rce:
Wei
ght G
ain
Durin
g Pr
egna
ncy:
Ree
xam
inin
g th
e Gu
idel
ines
. Nat
iona
l Aca
dem
ies
Pres
s; 2
009.
§ Ad
just
ed fo
r alti
tude
and
sm
okin
g. S
ourc
e: M
MW
R 19
98;4
7(RR
-3):1
–36.
¶ De
fined
as
birth
wei
ght <
2,50
0 gr
ams.
** D
efine
d as
birt
hwei
ght >
4,00
0 gr
ams.
†† D
efine
d as
ges
tatio
nal p
erio
d <3
7 w
eeks
.‡‡
Am
ong
infa
nts
born
dur
ing
the
repo
rting
per
iod.
Hea
lthy
Peop
le 2
010
obje
ctiv
e 16
-19:
Incr
ease
the
prop
ortio
n of
mot
hers
who
bre
astfe
ed th
eir b
abie
s du
ring
the
early
pos
tpar
tum
per
iod
to 7
5%. S
ourc
e: H
ealth
y Pe
ople
201
0. V
olum
e II.
U.S
. Go
vern
men
t Prin
ting
Offic
e; 2
000.
Tabl
e 2.
Sta
te-s
peci
fic p
reva
lenc
e of
sel
ecte
d in
dica
tors
of m
ater
nal h
ealth
, 201
0 Pr
egna
ncy
Nut
ritio
n Su
rvei
llanc
e Sy
stem
*
2010 PNSS Report 5
Maternal Weight GainIOM recommendations for maternal weight gain are unchanged for underweight, normal weight, and overweight women. The IOM recommends a pregnancy weight gain of 28–40 pounds for underweight women, 25–35 pounds for women of normal weight, and 15–25 pounds for overweight women. For obese women, IOM now recommends a pregnancy weight gain of 11–20 pounds (prior recommendation was at least 15 pounds). Recommended weight gain for short women and for individual racial and ethnic groups are the same as those for the whole population.4
Women who gain less than the IOM’s recommen-dation during pregnancy are at increased risk of giving birth to an infant with low birthweight. Women who gain more than the IOM’s recommended weight gain during pregnancy are at increased risk of giving birth to an infant with high birthweight, which can cause difficulty with delivery.4
Additionally, women who gain excess weight during pregnancy may have more difficulty returning to their prepregnancy weight.4 In the 2010 PNSS, 21.5% of women gained less weight than recommended during pregnancy, 30.6% gained the recommended amount of weight, and 48.0% gained more weight than recommended. The proportion of women in the 2010 PNSS who gained more than the recommended amount of weight during pregnancy varied by contributor, from 40.4% (Minnesota) to 54.7% (New Hampshire) (Table 2).
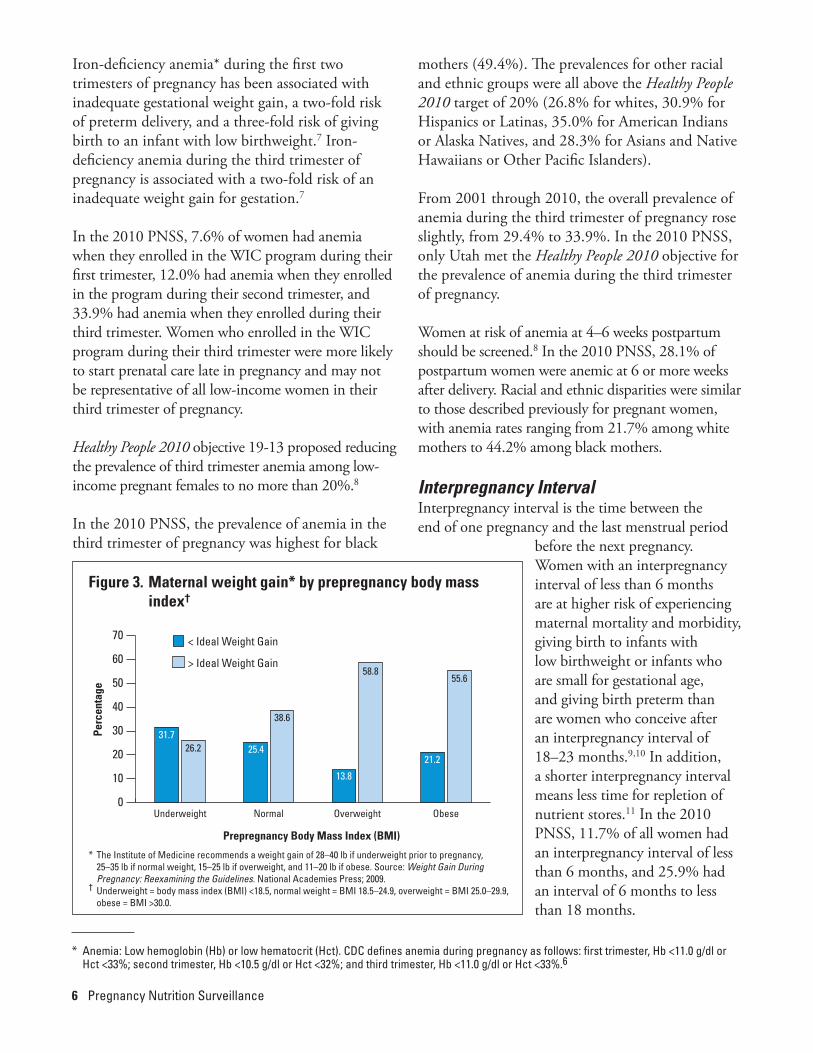
Whether the women in the 2010 PNSS gained an ideal amount of weight during pregnancy varied significantly by the women’s prepregnancy BMI (Figure 3). Women who were overweight or obese before pregnancy were more likely to exceed the IOM’s recommended maximum weight gain for their body size. Excess weight gain during pregnancy and failure to lose weight after pregnancy are important and identifiable predictors of long-term obesity.5
From 2001 through 2010, the prevalence of women who gained too much weight during pregnancy remained quite constant (48.6% and 48.0%), and the prevalence of women who gained less than the IOM’s recommended weight gain during pregnancy dropped slightly, from 22.4% to 21.5%.
AnemiaIron deficiency is common among women of reproductive age, including during pregnancy.6 Because pregnant women require higher amounts of iron, iron sup-plementation during pregnancy is often recommended. Pregnant women may not consume an adequate amount of iron if they do not take iron supplements during pregnancy, especially during the first trimester.6
Perc
enta
ge
Year
Overweight Underweight
0
10
20
30
40
50
60
2010200920082007200620052004200320022001
* State, U.S. territory, and Indian Tribal Organization contributors to the PNSS change slightly each year. Differences in prevalence trends should be interpreted cautiously.† Overweight = body mass index (BMI) >25.0 (includes overweight and obese); underweight = BMI <18.5.
Figure 2. Trends in prevalence* of prepregnancy overweight and underweight†
6 Pregnancy Nutrition Surveillance
Iron-deficiency anemia* during the first two trimesters of pregnancy has been associated with inadequate gestational weight gain, a two-fold risk of preterm delivery, and a three-fold risk of giving birth to an infant with low birthweight.7 Iron-deficiency anemia during the third trimester of pregnancy is associated with a two-fold risk of an inadequate weight gain for gestation.7
In the 2010 PNSS, 7.6% of women had anemia when they enrolled in the WIC program during their first trimester, 12.0% had anemia when they enrolled in the program during their second trimester, and 33.9% had anemia when they enrolled during their third trimester. Women who enrolled in the WIC program during their third trimester were more likely to start prenatal care late in pregnancy and may not be representative of all low-income women in their third trimester of pregnancy.
Healthy People 2010 objective 19-13 proposed reducing the prevalence of third trimester anemia among low-income pregnant females to no more than 20%.8
In the 2010 PNSS, the prevalence of anemia in the third trimester of pregnancy was highest for black
mothers (49.4%). The prevalences for other racial and ethnic groups were all above the Healthy People 2010 target of 20% (26.8% for whites, 30.9% for Hispanics or Latinas, 35.0% for American Indians or Alaska Natives, and 28.3% for Asians and Native Hawaiians or Other Pacific Islanders).
From 2001 through 2010, the overall prevalence of anemia during the third trimester of pregnancy rose slightly, from 29.4% to 33.9%. In the 2010 PNSS, only Utah met the Healthy People 2010 objective for the prevalence of anemia during the third trimester of pregnancy.
Women at risk of anemia at 4–6 weeks postpartum should be screened.8 In the 2010 PNSS, 28.1% of postpartum women were anemic at 6 or more weeks after delivery. Racial and ethnic disparities were similar to those described previously for pregnant women, with anemia rates ranging from 21.7% among white mothers to 44.2% among black mothers.
Interpregnancy IntervalInterpregnancy interval is the time between the end of one pregnancy and the last menstrual period
before the next pregnancy. Women with an interpregnancy interval of less than 6 months are at higher risk of experiencing maternal mortality and morbidity, giving birth to infants with low birthweight or infants who are small for gestational age, and giving birth preterm than are women who conceive after an interpregnancy interval of 18–23 months.9,10 In addition, a shorter interpregnancy interval means less time for repletion of nutrient stores.11 In the 2010 PNSS, 11.7% of all women had an interpregnancy interval of less than 6 months, and 25.9% had an interval of 6 months to less than 18 months.
* Anemia: Low hemoglobin (Hb) or low hematocrit (Hct). CDC defines anemia during pregnancy as follows: first trimester, Hb <11.0 g/dl or Hct <33%; second trimester, Hb <10.5 g/dl or Hct <32%; and third trimester, Hb <11.0 g/dl or Hct <33%.6
Perc
enta
ge
< Ideal Weight Gain
> Ideal Weight Gain
Prepregnancy Body Mass Index (BMI)
0
10
20
30
40
50
60
70
ObeseOverweightNormalUnderweight
26.2
38.6
58.855.6
31.725.4
13.8
21.2
* The Institute of Medicine recommends a weight gain of 28–40 lb if underweight prior to pregnancy, 25–35 lb if normal weight, 15–25 lb if overweight, and 11–20 lb if obese. Source: Weight Gain During Pregnancy: Reexamining the Guidelines. National Academies Press; 2009.† Underweight = body mass index (BMI) <18.5, normal weight = BMI 18.5–24.9, overweight = BMI 25.0–29.9, obese = BMI >30.0.
Figure 3. Maternal weight gain* by prepregnancy body mass index†
2010 PNSS Report 7
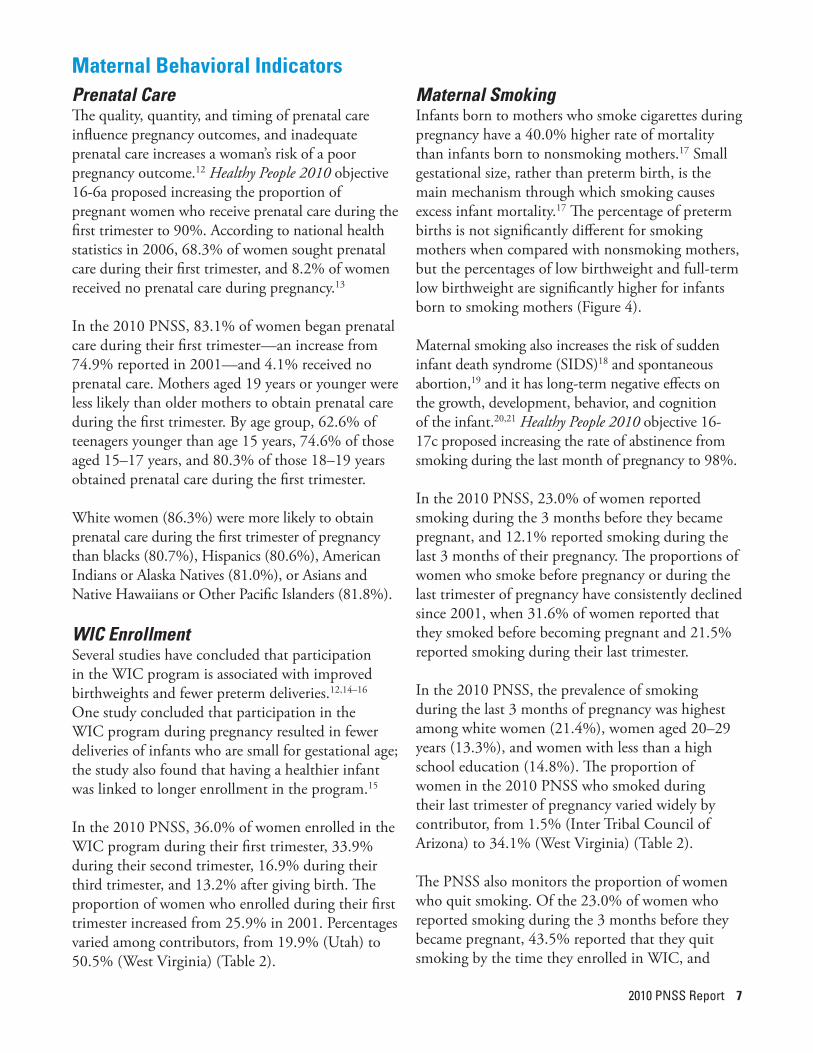
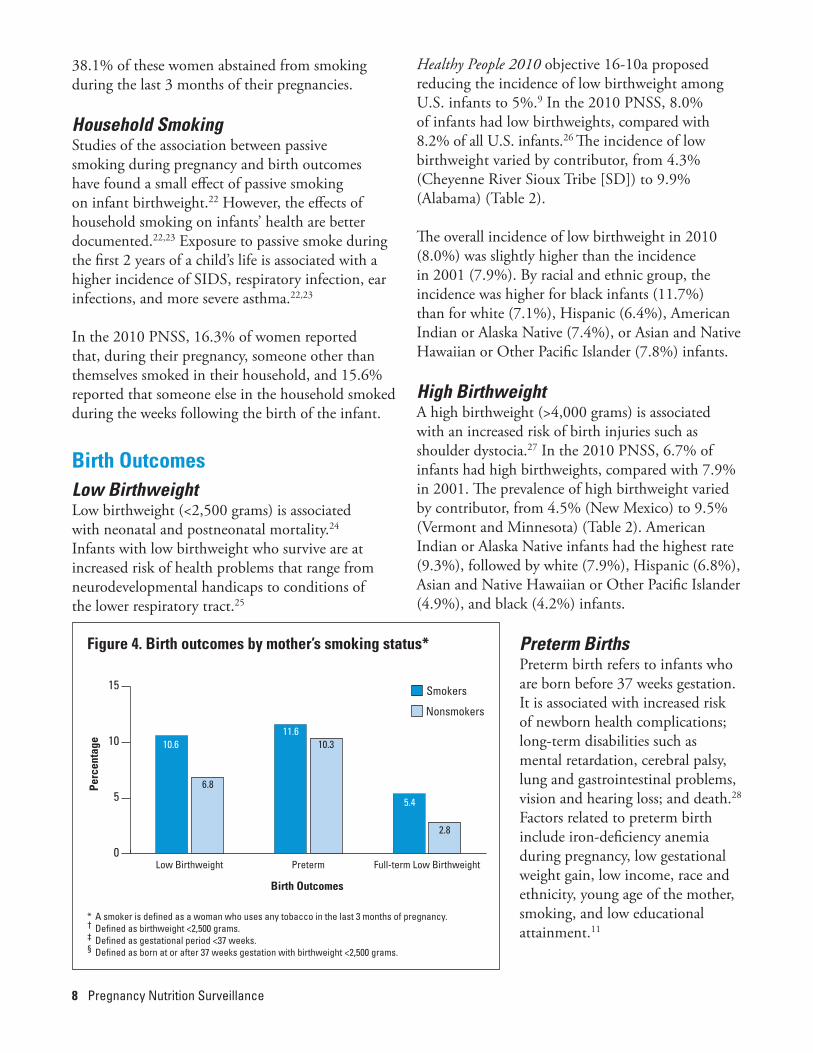
Maternal SmokingInfants born to mothers who smoke cigarettes during pregnancy have a 40.0% higher rate of mortality than infants born to nonsmoking mothers.17 Small gestational size, rather than preterm birth, is the main mechanism through which smoking causes excess infant mortality.17 The percentage of preterm births is not significantly different for smoking mothers when compared with nonsmoking mothers, but the percentages of low birthweight and full-term low birthweight are significantly higher for infants born to smoking mothers (Figure 4).
Maternal smoking also increases the risk of sudden infant death syndrome (SIDS)18 and spontaneous abortion,19 and it has long-term negative effects on the growth, development, behavior, and cognition of the infant.20,21 Healthy People 2010 objective 16-17c proposed increasing the rate of abstinence from smoking during the last month of pregnancy to 98%.
In the 2010 PNSS, 23.0% of women reported smoking during the 3 months before they became pregnant, and 12.1% reported smoking during the last 3 months of their pregnancy. The proportions of women who smoke before pregnancy or during the last trimester of pregnancy have consistently declined since 2001, when 31.6% of women reported that they smoked before becoming pregnant and 21.5% reported smoking during their last trimester.
In the 2010 PNSS, the prevalence of smoking during the last 3 months of pregnancy was highest among white women (21.4%), women aged 20–29 years (13.3%), and women with less than a high school education (14.8%). The proportion of women in the 2010 PNSS who smoked during their last trimester of pregnancy varied widely by contributor, from 1.5% (Inter Tribal Council of Arizona) to 34.1% (West Virginia) (Table 2).
The PNSS also monitors the proportion of women who quit smoking. Of the 23.0% of women who reported smoking during the 3 months before they became pregnant, 43.5% reported that they quit smoking by the time they enrolled in WIC, and
Maternal Behavioral IndicatorsPrenatal CareThe quality, quantity, and timing of prenatal care influence pregnancy outcomes, and inadequate prenatal care increases a woman’s risk of a poor pregnancy outcome.12 Healthy People 2010 objective 16-6a proposed increasing the proportion of pregnant women who receive prenatal care during the first trimester to 90%. According to national health statistics in 2006, 68.3% of women sought prenatal care during their first trimester, and 8.2% of women received no prenatal care during pregnancy.13
In the 2010 PNSS, 83.1% of women began prenatal care during their first trimester—an increase from 74.9% reported in 2001—and 4.1% received no prenatal care. Mothers aged 19 years or younger were less likely than older mothers to obtain prenatal care during the first trimester. By age group, 62.6% of teenagers younger than age 15 years, 74.6% of those aged 15–17 years, and 80.3% of those 18–19 years obtained prenatal care during the first trimester.
White women (86.3%) were more likely to obtain prenatal care during the first trimester of pregnancy than blacks (80.7%), Hispanics (80.6%), American Indians or Alaska Natives (81.0%), or Asians and Native Hawaiians or Other Pacific Islanders (81.8%).
WIC EnrollmentSeveral studies have concluded that participation in the WIC program is associated with improved birthweights and fewer preterm deliveries.12,14–16 One study concluded that participation in the WIC program during pregnancy resulted in fewer deliveries of infants who are small for gestational age; the study also found that having a healthier infant was linked to longer enrollment in the program.15
In the 2010 PNSS, 36.0% of women enrolled in the WIC program during their first trimester, 33.9% during their second trimester, 16.9% during their third trimester, and 13.2% after giving birth. The proportion of women who enrolled during their first trimester increased from 25.9% in 2001. Percentages varied among contributors, from 19.9% (Utah) to 50.5% (West Virginia) (Table 2).
8 Pregnancy Nutrition Surveillance
38.1% of these women abstained from smoking during the last 3 months of their pregnancies.
Household Smoking Studies of the association between passive smoking during pregnancy and birth outcomes have found a small effect of passive smoking on infant birthweight.22 However, the effects of household smoking on infants’ health are better documented.22,23 Exposure to passive smoke during the first 2 years of a child’s life is associated with a higher incidence of SIDS, respiratory infection, ear infections, and more severe asthma.22,23
In the 2010 PNSS, 16.3% of women reported that, during their pregnancy, someone other than themselves smoked in their household, and 15.6% reported that someone else in the household smoked during the weeks following the birth of the infant.
Birth OutcomesLow BirthweightLow birthweight (<2,500 grams) is associated with neonatal and postneonatal mortality.24 Infants with low birthweight who survive are at increased risk of health problems that range from neurodevelopmental handicaps to conditions of the lower respiratory tract.25
Healthy People 2010 objective 16-10a proposed reducing the incidence of low birthweight among U.S. infants to 5%.9 In the 2010 PNSS, 8.0% of infants had low birthweights, compared with 8.2% of all U.S. infants.26 The incidence of low birthweight varied by contributor, from 4.3% (Cheyenne River Sioux Tribe [SD]) to 9.9% (Alabama) (Table 2).
The overall incidence of low birthweight in 2010 (8.0%) was slightly higher than the incidence in 2001 (7.9%). By racial and ethnic group, the incidence was higher for black infants (11.7%) than for white (7.1%), Hispanic (6.4%), American Indian or Alaska Native (7.4%), or Asian and Native Hawaiian or Other Pacific Islander (7.8%) infants.
High BirthweightA high birthweight (>4,000 grams) is associated with an increased risk of birth injuries such as shoulder dystocia.27 In the 2010 PNSS, 6.7% of infants had high birthweights, compared with 7.9% in 2001. The prevalence of high birthweight varied by contributor, from 4.5% (New Mexico) to 9.5% (Vermont and Minnesota) (Table 2). American Indian or Alaska Native infants had the highest rate (9.3%), followed by white (7.9%), Hispanic (6.8%), Asian and Native Hawaiian or Other Pacific Islander (4.9%), and black (4.2%) infants.
Preterm BirthsPreterm birth refers to infants who are born before 37 weeks gestation. It is associated with increased risk of newborn health complications; long-term disabilities such as mental retardation, cerebral palsy, lung and gastrointestinal problems, vision and hearing loss; and death.28 Factors related to preterm birth include iron-deficiency anemia during pregnancy, low gestational weight gain, low income, race and ethnicity, young age of the mother, smoking, and low educational attainment.11
Smokers
Nonsmokers
Perc
enta
ge
Birth Outcomes
0
5
10
15
Full-term Low BirthweightPretermLow Birthweight
6.8
10.6
2.8
5.4
10.311.6
* A smoker is defined as a woman who uses any tobacco in the last 3 months of pregnancy.† Defined as birthweight <2,500 grams.‡ Defined as gestational period <37 weeks.§ Defined as born at or after 37 weeks gestation with birthweight <2,500 grams.
Figure 4. Birth outcomes by mother’s smoking status*
2010 PNSS Report 9
Healthy People 2010 objective 16-11a proposed reducing preterm births to 7.6%. In the 2010 PNSS, 10.7% of infants were born prematurely, up very slightly from 11.4% in 2001. The prevalence of preterm births differed by race, with black infants having a higher prevalence (13.0%) than Hispanic (10.8%), American Indian or Alaska Native (10.5%), white (9.7%), or Asian and Native Hawaiian or Other Pacific Islander (9.0%) infants.
Full-Term Low BirthweightThe PNSS monitors the proportion of full-term, low-birthweight infants and uses this information as an indicator to diagnose intrauterine growth retardation or fetal growth restriction.12 An infant is considered to be full term with low birthweight if the infant is born at or after 37 weeks gestation but weighs less than 2,500 grams. Poor nutrition during pregnancy is cited as one of the causes of full-term, low-birthweight infants.11 An infant’s size at birth is important because fetal growth restriction contributes to the risk of respiratory distress, hypoglycemia, and other health problems in infants.11
In the 2010 PNSS, 3.4% of infants who were born at full term had low birthweight, which is slightly lower than the 4.0% reported in 2001. Black infants (5.1%) had a higher prevalence of being full term with low birthweight than infants from other racial or ethnic groups.
Infant Feeding Practices Breastmilk, which is nutritionally superior to any other milk supply for infants, provides many benefits, including a reduction in acute otitis media, nonspecific gastroenteritis, severe lower respiratory tract infection, asthma, obesity, type 1 and type 2 diabetes, childhood leukemia, SIDS, and necrotizing enterocolitis.29
The proportion of breastfed infants in the PNSS has steadily increased in recent years. In 2010, 68.2% of infants were breastfed, compared with 53.9% in 2001. Healthy People 2010 objective 16-19 proposed increasing the proportion of infants ever breastfed to 75%.10 Only eight states in the 2010 PNSS met this objective: Hawaii, Idaho, Minnesota, Montana, New
York, Oregon, Utah, and Vermont. The percentage of infants ever breastfed varied widely among contributors, from 40.0% (Cheyenne River Sioux Tribe [SD]) to 92.2% (Utah) (Table 2).
The number of women that initiated breastfeeding varied by race and ethnicity. In the 2010 PNSS, initiation rates ranged from 58.5% among black mothers and 66.4% among white mothers to 78.2% among Hispanic mothers. Among all mothers who gave birth in the United States in 2007, 59.7% of black women and 77.7% of white women initiated breastfeeding, while 80.6% of Hispanic women reported initiation.30
Maternal Health Progress ReviewAlthough the 2010 PNSS data provide an opportunity to evaluate whether states are achieving the Healthy People 2010 objectives for pregnant women and their newborn infants, this evaluation must take into account that these data represent a diverse, disadvantaged, and low-income population of children.8 • No 2010 PNSS contributor achieved the
Healthy People 2010 objective to increase the proportion of women who receive prenatal care during the first trimester to 90%. However, 35.3% of contributors with good data quality achieved rates from 85.0% to 89.9%. The 2010 national PNSS rate was 83.1%.
• Only 7.0% of contributors with good data quality achieved the Healthy People 2010 objective to increase abstinence from smoking during the last 3 months of pregnancy to 98%.
• No 2010 state PNSS contributor achieved the Healthy People 2010 objective to reduce the prevalence of low birthweight to 5%. The 2010 national PNSS rate was 8.0%.
• Only 9.0% of contributors achieved the Healthy People 2010 objective to reduce preterm births to 7.6%.
• Approximately 27% of 2010 PNSS con-tributors with good data quality achieved the Healthy People 2010 objective to increase the proportion of infants ever breastfed to 75%, and about 20% of contributors achieved rates from 70.0% to 74.9%.
10 Pregnancy Nutrition Surveillance
Few PNSS contributors met the Healthy People 2010 maternal and infant health objectives. Renewed efforts are needed to achieve the new Healthy People 2020 targets related to beginning prenatal care in the first trimester (77.9% of women who deliver a live infant), abstinence from smoking during pregnancy (98.6%), low birthweight (7.8% of live births), preterm births (11.4% of live births), and infants ever breastfed (81.9%).31
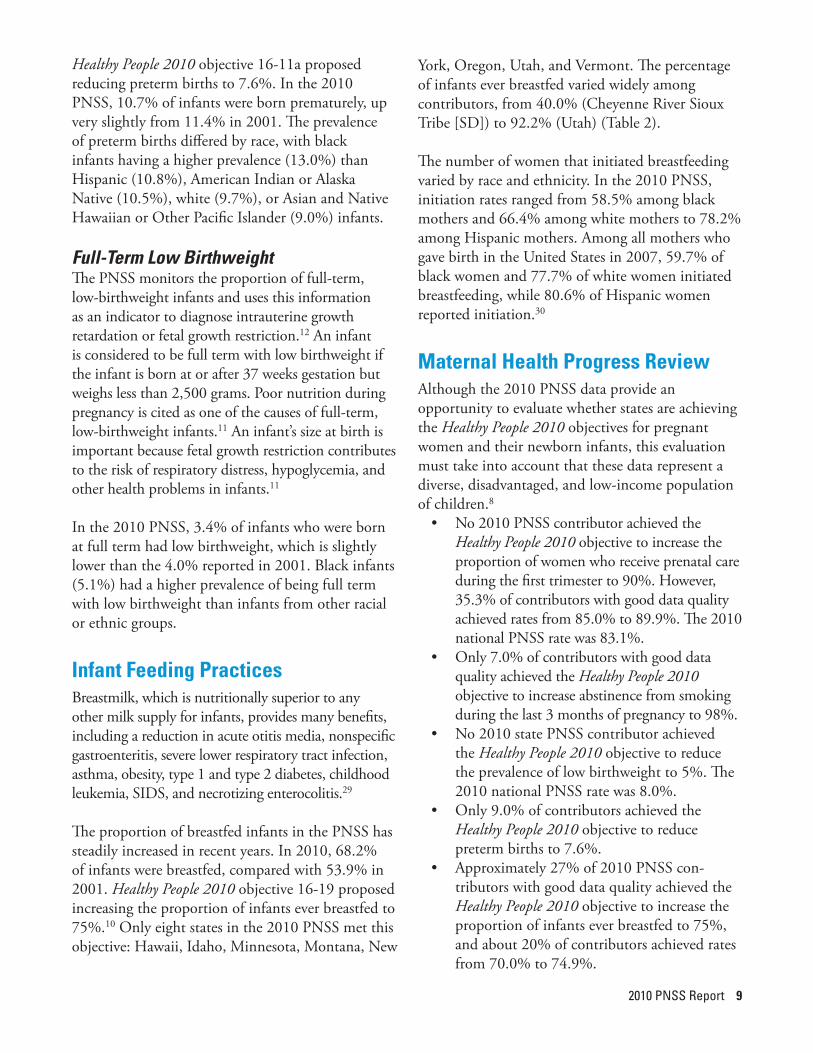
Nonetheless, advances in several health indicators were observed in the PNSS population from 2001 through 2010 (Figure 5).† The prevalence of initiation of breastfeeding increased from 53.9% in 2001 to 68.2% in 2010, a relative increase of 27%. The 2010 rate was the highest ever reported. In addition, since 2001, the relative proportion of women who enrolled in the WIC program during their first trimester increased 39%, and the proportion of women who gained inadequate weight during pregnancy decreased slightly.
Percentage Change 2001–2010
BetterWorseHealth Indicators
Overweight prepregnancy‡
Low birthweight
Infants born preterm
Smoked during last trimester
Entered WIC† first trimester
Inadequate weight gain
Excessive weight gain
Ever breastfed 26.5
4.0
39.0
43.7
6.1
1.3
0
1.2
11.3
* State, U.S. territory, and Indian Tribal Organization contributors to the PNSS change slightly each year. Differences in prevalence trends should be interpreted cautiously.† WIC = Special Supplemental Nutrition Program for Women, Infants, and Children.‡ Prepregnancy overweight and obesity = body mass index >25.0. Source: Weight Gain During Pregnancy: Reexamining the Guidelines. National Academies Press; 2009.
Figure 5. Changes* in maternal and infant health status, 2001–2010
The prevalence of women who smoked during the last trimester of pregnancy dropped from 21.5% in 2001 to 12.1% in 2010, a relative decrease of nearly 44%. The prevalence of women who smoked during the last trimester of pregnancy was the lowest prevalence ever reported in the PNSS.
The 2010 PNSS report also indicated areas of concern, such as the high iron-deficiency anemia prevalence during pregnancy.
Overweight is a major public health problem that has steadily increased in the United States, and this problem is mirrored in the PNSS population. The relative proportion of women who are overweight or obese before pregnancy has increased 13% since 2001, and nearly half of women now gain excess weight during pregnancy.
† For trend data comparing 2001 with 2010 in Figure 5 and throughout this publication, state, U.S. territory, and ITO PNSS contributors change slightly each year. Thus, the differences in prevalence must be interpreted cautiously.
2010 PNSS Report 11
RecommendationsThe PNSS data indicate that national and state public health programs are needed to support the following activities:• Implement strategies to continue to reduce
the prevalence of tobacco use among pregnant women and women of reproductive age.
• Promote and support breastfeeding through effective programs, medical care systems, work sites, and communities.
• Prevent preterm delivery and low birthweight by providing preconception nutrition, including iron supplementation.
• Conduct outreach activities to promote early awareness of pregnancy status and encourage early entry into comprehensive prenatal care, including the WIC program.
• Provide information to prenatal participants, especially women who are overweight or obese before pregnancy, about the importance of appropriate weight gain during pregnancy and the health risks of excess weight gain and postpartum weight retention.
References1. Martin JA, Hamilton BE, Sutton PD, Ventura
SJ, Mathews MS, Kirmeyer S, et al. Births: final data for 2007. National Vital Statistics Reports 2010;58(24):1–86. Available at www.cdc.gov/nchs/data/nvsr/nvsr58/nvsr58_24.pdf.
2. Doherty DA, Magaan EF, Francis J, Morrison JC, Newnham JP. Pre-pregnancy body mass index and pregnancy outcomes. International Journal of Gynecology & Obstetrics 2006;95(3):242–247.
3. Li R, Jewells S, Grummer-Strawn L. Maternal obesity and breast-feeding practices. American Journal of Clinical Nutrition 2003;77(4):931–936.
4. Rasmussen KM, Yaktine AL, eds.; Committee to Reexamine IOM Pregnancy Weight Guidelines; Institute of Medicine; National Research Council. Weight Gain During Pregnancy: Reexamining the Guidelines. Washington, DC: National Academies Press; 2009.
5. Rooney BL, Schauberger CW. Excess pregnancy weight gain and long-term obesity: one decade later. Obstetrics & Gynecology 2002;100(2):245–252.
6. Centers for Disease Control and Prevention. Recommendations to prevent and control iron deficiency in the United States. MMWR 1998;47(RR-3):1–36.
7. Scholl TO. Iron status during pregnancy: setting the stage for mother and infant. American Journal of Clinical Nutrition 2005;81(5):1218S–1222S.
8. U.S. Department of Health and Human Services. Healthy People 2010. Volume II. Washington, DC: U.S. Government Printing Office; 2000. Available at www.healthypeople.gov.
9. Zhu BP, Rolfs RT, Nangle BE, Horan JM. Effect of the interval between pregnancies on perinatal outcomes. New England Journal of Medicine 1999;340(8):589–594.
10. Conde-Agudelo A, Beliza´n JM. Maternal morbidity and mortality associated with interpregnancy interval: cross sectional study. BMJ 2000;321(7271):1255–1259.
11. Institute of Medicine. WIC Nutrition Risk Criteria: A Scientific Assessment. Washington, DC: National Academies Press; 1996.
12. Devaney B, Bilheimer L, Schore J. Medicaid costs and birth outcomes: the effects of prenatal WIC participation and the use of prenatal care. Journal of Policy Analysis and Management 1992;11(4):573–592.
13. Centers for Disease Control and Prevention. Health, United States, 2009: With Special Feature on Medical Technology. Hyattsville, MD: U.S. Department of Health and Human Services; 2010.
14. Abrams B. Preventing low birthweight: does WIC work? A review of evaluations of the Special Supplemental Food Program for Women, Infants, and Children. Annals of the New York Academy of Sciences 1993;678:306–315.
15. Ahluwalia I, Hogan VK, Grummer-Strawn L, Colville WR, Peterson A. The effect of WIC participation on small-for-gestational-age births: Michigan, 1992. American Journal of Public Health 1998;88(9):1374–1377.
16. Bitler MP, Currie J. Does WIC work? The effects of WIC on pregnancy and birth outcomes. Journal of Policy Analysis and Management 2005;24(1):73–91.

12 Pregnancy Nutrition Surveillance
17. Salihu HM, Aliyu MH, Pierre-Louis BJ, Alexander GR. Levels of excess infant deaths attributable to maternal smoking during pregnancy in the United States. Maternal and Child Health Journal 2003;7(4):219–227.
18. Anderson ME, Johnson DC, Batal HA. Sudden infant death syndrome and prenatal maternal smoking: rising attributed risk in the Back to Sleep era. BMC Medicine 2005;3:4.
19. U.S. Department of Health and Human Services. Women and Smoking: A Report of the Surgeon General. Atlanta: U.S. Department of Health and Human Services, Centers for Disease Control and Prevention; 2001.
20. Samet JM, Yoon SY, editors. Women and the Tobacco Epidemic: Challenges for the 21st Century. Geneva: World Health Organization; 2001.
21. U.S. Department of Health and Human Services. The Health Consequences of Smoking: A Report of the Surgeon General. Washington, DC: U.S. Department of Health and Human Services; 2004.
22. U.S. Department of Health and Human Services. The Health Consequences of Involuntary Exposure to Tobacco Smoke: A Report of the Surgeon General. Atlanta: U.S. Department of Health and Human Services, Centers for Disease Control and Prevention; 2006.
23. Hofhuis W, de Jongste JC, Merkus PJ. Adverse health effects of prenatal and postnatal tobacco smoke exposure on children. Archives of Disease in Childhood 2003;88(12):1086–1090.
24. Mathews TJ, MacDorman MF. Infant mortality statistics from the 2005 period linked birth/infant death set. National Vital Statistics Reports 2008;57(2):1–32.
25. Goldenberg RL, Culhane JF. Low birth weight in the United States. American Journal of Clinical Nutrition 2007;85(2):584S–590S.
26. Hamilton BE, Martin JA, Ventura SJ. Births: preliminary data for 2009. National Vital Statistics Reports 2010;59(3):1–19. Available at www.cdc.gov/nchs/data/nvsr/nvsr59/nvsr59_03.pdf.
27. Jolly MC, Sebire NJ, Harris JP, Regan L, Robinson S. Risk factors for macrosomia and its clinical consequences: a study of 350,311 pregnancies. European Journal of Obstetrics & Gynecology and Reproductive Biology 2003;11:9–14.
28. March of Dimes. Your Premature Baby. Available at www.marchofdimes.com/professionals/14332_1157.asp.
29. Ip S, Chung M, Raman G, Chew P, Magula N, DeVine D, et al. Breastfeeding and Maternal and Infant Health Outcomes in Developed Countries. Rockville, MD: Agency for Healthcare Research and Quality; 2007. Evidence Report/Technology Assessment No. 153. Available at www.ncbi.nlm.nih.gov/books/NBK38337.
30. Centers for Disease Control and Prevention. Breastfeeding Among U.S. Children Born 2000–2008, CDC National Immunization Survey. Available at www.cdc.gov/breastfeeding/data/NIS_data.
31. U.S. Department of Health and Human Services. Healthy People 2020. Washington DC: U.S. Government Printing Office; 2010.


CS232688July 2012