t h e w o r l d b a n k global development...
TRANSCRIPT

50
150
250
350
450Monthly Prices($/metric ton)
Jan-10Jan-08Jan-06Jan-04Jan-02Jan-00
50
150
250
350
450 Constant 2000Current
202020152010200520001995199019851980
0
1
2
3
4COCOA ICCO ($/kg)
Jan-10Jan-08Jan-06Jan-04Jan-02Jan-00
0
1
2
3
4Constant 2000Current
202020152010200520001995199019851980
0.75
1.00
1.25
1.50
1.75
2.00Monthly Prices($/metric ton)
Jan-10Jan-08Jan-06Jan-04Jan-02Jan-00
0.75
1.25
1.75
2.25
2.75 Constant 2000Current
202020152010200520001995199019851980
1200
1700
2200
2700
3200COCOA ICCO ($/kg)
Jan-10Jan-08Jan-06Jan-04Jan-02Jan-00
300
975
1650
2325
3000Constant 2000Current
202020152010200520001995199019851980
Wheat Cocoa
Source: World Bank
Source: World Bank
Source: World Bank
Source: World Bank
Cotton Aluminum
Constant 2000
Current
Constant 2000
Current
Source: World Bank
Source: World Bank
Source: World Bank
Source: World Bank
Constant 2000
Current
Constant 2000
Current
Forecast
Forecast
Forecast Forecast
50
150
250
350
450Monthly Prices($/metric ton)
Jan-10Jan-08Jan-06Jan-04Jan-02Jan-00
50
150
250
350
450 Constant 2000Current
202020152010200520001995199019851980
0
1
2
3
4COCOA ICCO ($/kg)
Jan-10Jan-08Jan-06Jan-04Jan-02Jan-00
0
1
2
3
4Constant 2000Current
202020152010200520001995199019851980
0.75
1.00
1.25
1.50
1.75
2.00Monthly Prices($/metric ton)
Jan-10Jan-08Jan-06Jan-04Jan-02Jan-00
0.75
1.25
1.75
2.25
2.75 Constant 2000Current
202020152010200520001995199019851980
1200
1700
2200
2700
3200COCOA ICCO ($/kg)
Jan-10Jan-08Jan-06Jan-04Jan-02Jan-00
300
975
1650
2325
3000Constant 2000Current
202020152010200520001995199019851980
Wheat Cocoa
Source: World Bank
Source: World Bank
Source: World Bank
Source: World Bank
Cotton Aluminum
Constant 2000
Current
Constant 2000
Current
Source: World Bank
Source: World Bank
Source: World Bank
Source: World Bank
Constant 2000
Current
Constant 2000
Current
Forecast
Forecast
Forecast Forecast
Annual Prices ($/metric ton)Monthly Prices ($/metric ton)
Global Commodity Markets World Bank
T H E W O R L D B A N K
Review and price forecast
GlobalCommodity Markets
Glo
bal C
om
mo
dity M
arkets T
HE
W
OR
LD
B
AN
K
T H E W O R L D B A N K
GlobalDevelopmentFinanceCharting a Global Recovery
GlobalDevelopmentFinanceI: R
eview, A
nalysis, and Outlook
Global D
evelopment Finance
2009
Over the past two years, the world has seen turmoil in a relatively small segment of the U.S. credit markets morph
into a severe global economic and financial crisis. Although aggressive monetary policy, fiscal stimulus, and guarantee programs to shore up the banking industry have begun to stabilize financial markets and slow the pace of economic contraction, policy makers face an extended battle to revive the global economy.
Bleak indicators abound. The global economy will contract by 3.1 percent in 2009. Global trade will plunge by 10 percent. Developing countries are expected to register economic growth of just 1.3 percent, down from about 8 percent in 2007. When China and India are excluded, developing economies as a whole are projected to shrink by 1.5 percent in 2009. Meanwhile, private investment flows to developing countries plummeted more than 40 percent in 2008 as access to international debt markets dried up and portfolio equity inflows dropped off significantly.
Low-income developing countries, initially cushioned from the direct impact of the financial crisis, are now feeling effects that have spread through other channels. Net private capital flows will be insufficient to meet the external financing needs of many low-income countries, and the prospects for large increases in other sources of financing are poor as well. The bulk of new commitments by international financial institutions will go to middle-income countries in 2009, and remittance flows to low-income countries are projected to decline by 5 percent. Absent substantial increases in official finance, many low-income countries may have to resort to more contractionary adjustment policies, with serious implications for long-term development and poverty reduction.
Underlying the current crisis is an interconnected world economy that is in the midst of a tough transition from an extended period of abundant credit and economic overheating to a new era whose hallmarks will be a resurgence in the role of government in global financial affairs, quantitative easing by major central banks, continued consolidation of the financial sector, large excess capacity in many industrial sectors, and, compared to the first half of the decade, slower global
growth once recovery takes hold. Going forward, national and international policy makers must support emerging signs of recovery with persistent, robust efforts to restore confidence in the financial system and transform the adverse feedback loop between the financial sector and the real economy into a positive one.
Global Development Finance 2009, I: Review, Analysis, and Outlook is the World Bank’s annual review of recent trends in and prospects for financial flows to developing countries. Global Development Finance 2009, II: Summary and Country Tables includes a comprehensive set of tables with statistical data for 128 countries that report debt under the World Bank Debtor Reporting System, as well as summary data for regions and income groups. It contains data on total external debt stocks and flows, aggregates, and key debt ratios, and provides a detailed, country-by-country picture of debt. Debt data are also available in an electronic format: GDF Online (a subscription database) and the GDF CD-ROM. Each of these databases provides access to more than 200 time series indicators from 1970 to 2007 and country group estimates for 2008.
“Prospects for the Global Economy” is an online companion to Global Development Finance. It provides information on the global economic outlook, detailed regional forecasts, and additional features such as interactive graphs, analytical tools, and access to underlying data. It is available in English, French, and Spanish at www.worldbank.org/globaloutlook.
The Little Book on External Debt is a publication that provides a quick reference to key debt data in aggregate and for individual countries.
With analysis and data extending from short-term bank lending to long-term bond issuance in both local and foreign currency, Global Development Finance 2009 is unique in its breadth of coverage of the trends and issues of fundamental importance to the financing of the developing world, including coverage of capital originating from developing countries themselves. The report is an indispensable resource for governments, economists, investors, financial consultants, academics, bankers, and the entire development community.
For more information on the analysis, please seewww.worldbank.org/prospects; further details aboutthe Summary and Country Tables can be found atwww.worldbank.org/data. For general and orderinginformation, please visit the World Bank’s publications Website at www.worldbank.org/publications, or call 703-661-1580; within the United States, please call 1-800-645-7274.
THE WORLD BANK1818 H Street, NWWashington, DC 20433 USATelephone: 202 477-1234Facsimile: 202 477-6391Internet: www.worldbank.orgE-mail: [email protected]
ISBN 978-0-8213-7840-3
SKU 17840
2009I : R E V I E W, A N A L Y S I S , A N D O U T L O O KA Companion to Global Economic Prospects 2010

Global Commodity Markets World Bank
Review and price forecast
GlobalCommodityMarketsA Companion to Global Economic Prospects 2010

4
Global Commodity Markets World Bank
Copyright 2010 The International Bank for Reconstruction and Development/The World Bank1818 H Street N.W., Washington, D.C. 20433, USATelephone: 202-473-1000Internet: www.worldbank.orgAll rights reserved.Manufactured in the United States of America.
1234 12 11 1009
This volume is a product of the staff of the International Bank for Reconstruction and Development/ The World Bank. The findings, interpretations, and conclusions ex-pressed in this volume do not necessarily reflect the views of the Executive Directors of The World Bank or the governments they represent.
The World Bank does not guarantee the accuracy of the data and forecast included in this work.
Rights and Permissions
The material in this publication is copyrighted. Copying and/or transmitting portions or all of this work without permission may be a violation of applicable law. The Inter-national Bank for Reconstruction and Development/ The World Bank encourages dis-semination of its work and will normally grant permission to reproduce portions of the work promptly.
For permission to photocopy or reprint any part of this work, please send a request withcomplete information to the Copyright Clearance Center Inc., 222 Rosewood Drive, Danvers, MA 01923, USA; telephone: 978-750-8400; fax: 978-750-4470; Internet: www.copyright.com.
All other queries on rights and licenses, including subsidiary rights, should be addressed to the Office of the Publisher, The World Bank, 1818 H Street NW, Washington, DC 20433, USA; fax: 202-522-2422; e-mail: [email protected].

5
Global Commodity Markets World Bank
Table of Contents
Global Commodity Outlook ...................................................................................................... 6
Key Commodities Aluminium ................................................................................................................... 10 Cocoa ........................................................................................................................... 11 Coffee ........................................................................................................................... 12 Copper ......................................................................................................................... 13
Cotton .......................................................................................................................... 14 Gold ............................................................................................................................. 15
Maize ............................................................................................................................ 16 Nickel ......................................................................................................................... 17 Palm Oil ....................................................................................................................... 18
Petroleum .................................................................................................................... 19 Rice .............................................................................................................................. 20 Rubber ......................................................................................................................... 21 Soybeans ...................................................................................................................... 22
Sugar ............................................................................................................................ 23 Tea ............................................................................................................................... 24
Wheat ........................................................................................................................... 25
AppendicesAppendix A: Prices and Forecasts Table A1: Commodity Price Data ............................................................................... 26
Table A2: Commodity Prices and Price Projections in Current Dollars ................... 28 Table A3: Commodity Prices and Price Projections in Constant 2000 Dollars ........ 29
Table A4: Weighted Indices of Commodity Prices and Inflation, 2000=100 ............ 30Appendix B: Description of Price Series ........................................................................ 31Appendix C: Definitions and Explanations ..................................................................... 33Appendix D: Acronyms and Abbreviations .................................................................... 34
This report was prepared by Staff of the World Bank’s Development Prospects Group. The core team consisted of John Baffes, Shane Streifel, and Betty Dow. Henock Kebede provided desktop editing and Rachel Weaving provided editing services. Questions or comments should be e-mailed
to [email protected] or or visit us on the web at http://www.worldbank.org/prospects

6
Global Commodity Markets World Bank
Global Commodity OutlookMost commodity prices reached historical highs in mid-2008, giving rise to the longest and broadest commodity boom of the post-WWII period. Apart from strong and sustained economic growth, the boom was fueled by numerous factors including years of low prices and low investment; a weak dollar; and investment fund activity. Rapid eco-nomic growth caused global stocks of many com-modities to fall to levels not seen since the early 1970s, in turn accelerating the price increases that peaked in 2008. Further exacerbating the demand and supply mismatch were the diversion of some food commodities to the production of biofuels, adverse weather conditions, and government poli-cies such as export bans and prohibitive taxes.
The financial crisis that erupted in September 2008 and the subsequent global economic down-turn relieved most of the demand-side pressures and induced sharp price declines across most com-modity sectors. The largest declines occurred in industrial commodities such as metals (which had also registered the greatest gains in the early 2000s). Between July 2008 and February 2009, prices of energy declined by two-thirds while those of met-als dropped by more than half. Prices of agricultur-al goods retreated by more than 30 percent, with prices of edible oils dropping by 42 percent. The troughs in energy and non-energy indices broadly coincided with troughs in global economic activity (particularly in China and East Asia).
Prices of energy and metals commodities be-gan to recover in March 2009 (figure 1), in part responding to recovery in industrial production and other factors including strong import demand from China, large-scale production restraint in the extractive commodities, tight scrap markets, and strike-related disruptions in the case of metals.
Prices of some agricultural commodities also start-ed to rebound in 2009:Q2, in response to demand increases and, in some cases (for example, sugar and rice), the effects of adverse weather. Dollar price increases also reflected the depreciation of the dollar against major currencies. Yet, expressed in trade-weighted local currency indices, prices rose by much less.
EnergyWorld crude oil demand, which had grown by 1.7 percent a year on average during 2000–07, declined by nearly 3 percent during 2008:Q4 and 2009:Q1—as a result of reduced economic activity and of in-duced conservation and substitution toward other energy sources in response to the high oil prices. Oil demand in OECD countries has been falling since 2005:Q4 (when oil prices surged above $50 a barrel), and little or no growth is expected in 2010. Oil demand outside the OECD countries declined in 2009:Q1 but has since risen and is projected to resume its trend growth rate of nearly 4 percent in 2010. Overall, global demand growth should re-main muted at 1.5 percent a year.
OPEC responded to the fall in global demand by reducing its production by nearly 4 million barrels a day in an effort to maintain prices at around $75 a barrel. As a result, OPEC’s spare capacity has in-creased to around 6.5 million barrels a day, roughly the same level as in 2003 when oil prices were $20 a barrel (figure 2). Moreover, inventories of crude oil and oil products remain high with some 150 mil-lion barrels currently being stored on ships at sea.
While current crude oil supply is ample, longer-term prospects are more clouded. Over recent de-cades non-OPEC supply has been fairly stagnant (except from the former Soviet Union, whose out-
0
100
200
300
400Constant 2000 DollarsCurrent Dollars
20202015201020052000199519901985198019751970
0
100
200
300
400
500Metals and MineralsAgricultureEnergy
Jan-10Jan-06Jan-02Jan-98Jan-94Jan-90
0
100
200
300
400Constant 2000 DollarsCurrent Dollars
20202015201020052000199519901985198019751970
0
2
4
6
8
Jan-10Jan-09Jan-08Jan-07Jan-06Jan-05Jan-04Jan-03Jan-02Jan-01
0
2500
5000
7500
10000
Copper price [left axis]
Jan-10Jan-09Jan-08Jan-07Jan-06Jan-05Jan-04Jan-03
0
100
200
300
400Constant 2000 DollarsCurrent Dollars
20202015201020052000199519901985198019751970
0.10
0.15
0.20
0.25
0.30
0.35
0.40
Grains Stocks
201020052000199519901985198019751970
0
100
200
300
400Constant 2000 DollarsCurrent Dollars
20202015201020052000199519901985198019751970
0
50
100
150
200Constant Current DollarsCurrent Dollars
20202015201020052000199519901985198019751970
0
150
300
450
600Constant 2000 DollarsCurrent Dollars
20202015201020052000199519901985198019751970
0
250
500
750
1000
Stocks [right axis]
Figure 3. Energy Price Indices (2000=100)Figure 4. Copper Prices and LME Stocks
Figure 1. Commodity Price Indices (Nominal, 2000=100)
Source: World Bank
Figure 5. Metals and Minerals Price Indices (2000=100)
Source: World Bank
Source: World Bank
Figure 2. OPEC Spare Capacity (mb/d)
Source: International Energy Agency
Source: LME and Datastreem
Figure 6. Precious Metals Price Indices (US$, 2000=100)
Source: World Bank
Figure 7. Global Grains Stocks-to-Use Ratio
Source: US Department of Agriculture
Figure 8. Food Price Indices (US$, 2000=100)
Source: World Bank
Figure 9. Raw Materials Price Indices (US$, 2000=100)
Source: World Bank
Figure 10. Fertilizer Price Indices (US$, 2000=100)
Source: World Bank
Agriculture
Forecast
Forecast
Forecast
Forecast
ForecastForecast
$/ton 000 tons
Figure 1. Commodity Price Indices (Nominal, 2000=100)
0
100
200
300
400Constant 2000 DollarsCurrent Dollars
20202015201020052000199519901985198019751970
0
100
200
300
400
500Metals and MineralsAgricultureEnergy
Jan-10Jan-06Jan-02Jan-98Jan-94Jan-90
0
100
200
300
400Constant 2000 DollarsCurrent Dollars
20202015201020052000199519901985198019751970
0
2
4
6
8
Jan-10Jan-09Jan-08Jan-07Jan-06Jan-05Jan-04Jan-03Jan-02Jan-01
0
2500
5000
7500
10000
Copper price [left axis]
Jan-10Jan-09Jan-08Jan-07Jan-06Jan-05Jan-04Jan-03
0
100
200
300
400Constant 2000 DollarsCurrent Dollars
20202015201020052000199519901985198019751970
0.10
0.15
0.20
0.25
0.30
0.35
0.40
Grains Stocks
201020052000199519901985198019751970
0
100
200
300
400Constant 2000 DollarsCurrent Dollars
20202015201020052000199519901985198019751970
0
50
100
150
200Constant Current DollarsCurrent Dollars
20202015201020052000199519901985198019751970
0
150
300
450
600Constant 2000 DollarsCurrent Dollars
20202015201020052000199519901985198019751970
0
250
500
750
1000
Stocks [right axis]
Figure 3. Energy Price Indices (2000=100)Figure 4. Copper Prices and LME Stocks
Figure 1. Commodity Price Indices (Nominal, 2000=100)
Source: World Bank
Figure 5. Metals and Minerals Price Indices (2000=100)
Source: World Bank
Source: World Bank
Figure 2. OPEC Spare Capacity (mb/d)
Source: International Energy Agency
Source: LME and Datastreem
Figure 6. Precious Metals Price Indices (US$, 2000=100)
Source: World Bank
Figure 7. Global Grains Stocks-to-Use Ratio
Source: US Department of Agriculture
Figure 8. Food Price Indices (US$, 2000=100)
Source: World Bank
Figure 9. Raw Materials Price Indices (US$, 2000=100)
Source: World Bank
Figure 10. Fertilizer Price Indices (US$, 2000=100)
Source: World Bank
Agriculture
Forecast
Forecast
Forecast
Forecast
ForecastForecast
$/ton 000 tons
Figure 2. OPEC Spare Capacity (mb/d)
7
Global Commodity Markets World Bank
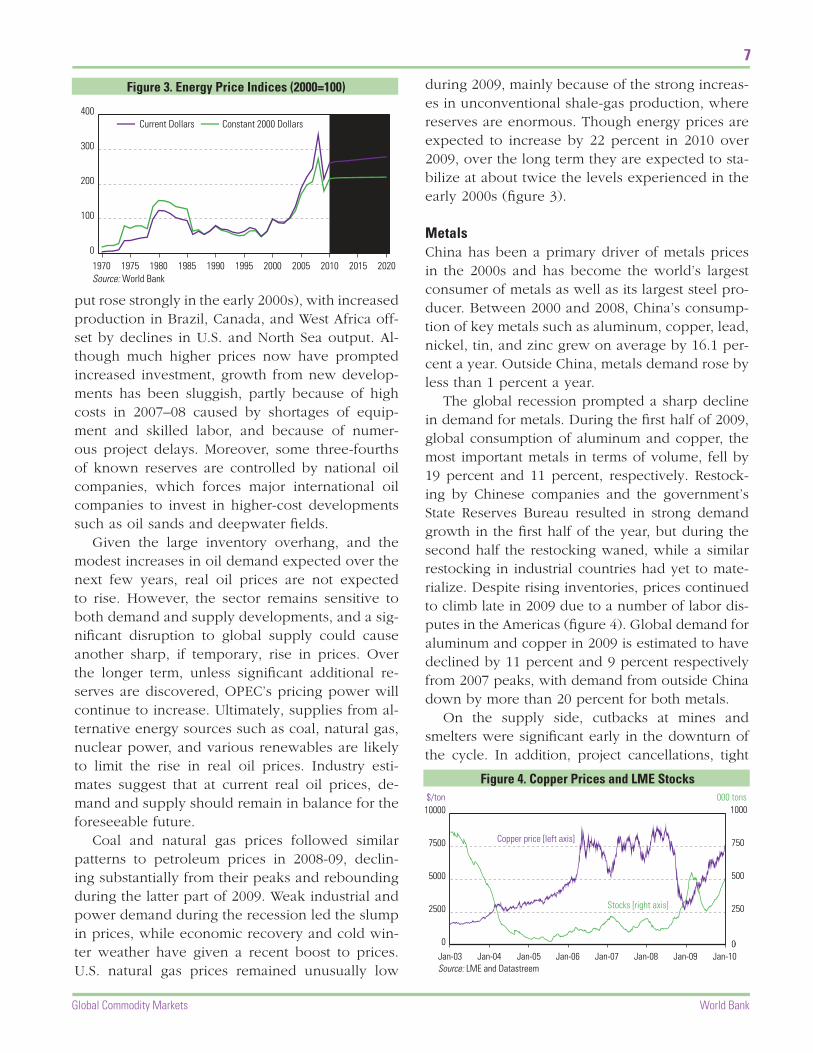
put rose strongly in the early 2000s), with increased production in Brazil, Canada, and West Africa off-set by declines in U.S. and North Sea output. Al-though much higher prices now have prompted increased investment, growth from new develop-ments has been sluggish, partly because of high costs in 2007–08 caused by shortages of equip-ment and skilled labor, and because of numer-ous project delays. Moreover, some three-fourths of known reserves are controlled by national oil companies, which forces major international oil companies to invest in higher-cost developments such as oil sands and deepwater fields.
Given the large inventory overhang, and the modest increases in oil demand expected over the next few years, real oil prices are not expected to rise. However, the sector remains sensitive to both demand and supply developments, and a sig-nificant disruption to global supply could cause another sharp, if temporary, rise in prices. Over the longer term, unless significant additional re-serves are discovered, OPEC’s pricing power will continue to increase. Ultimately, supplies from al-ternative energy sources such as coal, natural gas, nuclear power, and various renewables are likely to limit the rise in real oil prices. Industry esti-mates suggest that at current real oil prices, de-mand and supply should remain in balance for the foreseeable future.
Coal and natural gas prices followed similar patterns to petroleum prices in 2008-09, declin-ing substantially from their peaks and rebounding during the latter part of 2009. Weak industrial and power demand during the recession led the slump in prices, while economic recovery and cold win-ter weather have given a recent boost to prices. U.S. natural gas prices remained unusually low
during 2009, mainly because of the strong increas-es in unconventional shale-gas production, where reserves are enormous. Though energy prices are expected to increase by 22 percent in 2010 over 2009, over the long term they are expected to sta-bilize at about twice the levels experienced in the early 2000s (figure 3).
MetalsChina has been a primary driver of metals prices in the 2000s and has become the world’s largest consumer of metals as well as its largest steel pro-ducer. Between 2000 and 2008, China’s consump-tion of key metals such as aluminum, copper, lead, nickel, tin, and zinc grew on average by 16.1 per-cent a year. Outside China, metals demand rose by less than 1 percent a year.
The global recession prompted a sharp decline in demand for metals. During the first half of 2009, global consumption of aluminum and copper, the most important metals in terms of volume, fell by 19 percent and 11 percent, respectively. Restock-ing by Chinese companies and the government’s State Reserves Bureau resulted in strong demand growth in the first half of the year, but during the second half the restocking waned, while a similar restocking in industrial countries had yet to mate-rialize. Despite rising inventories, prices continued to climb late in 2009 due to a number of labor dis-putes in the Americas (figure 4). Global demand for aluminum and copper in 2009 is estimated to have declined by 11 percent and 9 percent respectively from 2007 peaks, with demand from outside China down by more than 20 percent for both metals.
On the supply side, cutbacks at mines and smelters were significant early in the downturn of the cycle. In addition, project cancellations, tight
0
100
200
300
400Constant 2000 DollarsCurrent Dollars
20202015201020052000199519901985198019751970
0
100
200
300
400
500Metals and MineralsAgricultureEnergy
Jan-10Jan-06Jan-02Jan-98Jan-94Jan-90
0
100
200
300
400Constant 2000 DollarsCurrent Dollars
20202015201020052000199519901985198019751970
0
2
4
6
8
Jan-10Jan-09Jan-08Jan-07Jan-06Jan-05Jan-04Jan-03Jan-02Jan-01
0
2500
5000
7500
10000
Copper price [left axis]
Jan-10Jan-09Jan-08Jan-07Jan-06Jan-05Jan-04Jan-03
0
100
200
300
400Constant 2000 DollarsCurrent Dollars
20202015201020052000199519901985198019751970
0.10
0.15
0.20
0.25
0.30
0.35
0.40
Grains Stocks
201020052000199519901985198019751970
0
100
200
300
400Constant 2000 DollarsCurrent Dollars
20202015201020052000199519901985198019751970
0
50
100
150
200Constant Current DollarsCurrent Dollars
20202015201020052000199519901985198019751970
0
150
300
450
600Constant 2000 DollarsCurrent Dollars
20202015201020052000199519901985198019751970
0
250
500
750
1000
Stocks [right axis]
Figure 3. Energy Price Indices (2000=100)Figure 4. Copper Prices and LME Stocks
Figure 1. Commodity Price Indices (Nominal, 2000=100)
Source: World Bank
Figure 5. Metals and Minerals Price Indices (2000=100)
Source: World Bank
Source: World Bank
Figure 2. OPEC Spare Capacity (mb/d)
Source: International Energy Agency
Source: LME and Datastreem
Figure 6. Precious Metals Price Indices (US$, 2000=100)
Source: World Bank
Figure 7. Global Grains Stocks-to-Use Ratio
Source: US Department of Agriculture
Figure 8. Food Price Indices (US$, 2000=100)
Source: World Bank
Figure 9. Raw Materials Price Indices (US$, 2000=100)
Source: World Bank
Figure 10. Fertilizer Price Indices (US$, 2000=100)
Source: World Bank
Agriculture
Forecast
Forecast
Forecast
Forecast
ForecastForecast
$/ton 000 tonsFigure 3. Energy Price Indices (2000=100)
0
100
200
300
400Constant 2000 DollarsCurrent Dollars
20202015201020052000199519901985198019751970
0
100
200
300
400
500Metals and MineralsAgricultureEnergy
Jan-10Jan-06Jan-02Jan-98Jan-94Jan-90
0
100
200
300
400Constant 2000 DollarsCurrent Dollars
20202015201020052000199519901985198019751970
0
2
4
6
8
Jan-10Jan-09Jan-08Jan-07Jan-06Jan-05Jan-04Jan-03Jan-02Jan-01
0
2500
5000
7500
10000
Copper price [left axis]
Jan-10Jan-09Jan-08Jan-07Jan-06Jan-05Jan-04Jan-03
0
100
200
300
400Constant 2000 DollarsCurrent Dollars
20202015201020052000199519901985198019751970
0.10
0.15
0.20
0.25
0.30
0.35
0.40
Grains Stocks
201020052000199519901985198019751970
0
100
200
300
400Constant 2000 DollarsCurrent Dollars
20202015201020052000199519901985198019751970
0
50
100
150
200Constant Current DollarsCurrent Dollars
20202015201020052000199519901985198019751970
0
150
300
450
600Constant 2000 DollarsCurrent Dollars
20202015201020052000199519901985198019751970
0
250
500
750
1000
Stocks [right axis]
Figure 3. Energy Price Indices (2000=100)Figure 4. Copper Prices and LME Stocks
Figure 1. Commodity Price Indices (Nominal, 2000=100)
Source: World Bank
Figure 5. Metals and Minerals Price Indices (2000=100)
Source: World Bank
Source: World Bank
Figure 2. OPEC Spare Capacity (mb/d)
Source: International Energy Agency
Source: LME and Datastreem
Figure 6. Precious Metals Price Indices (US$, 2000=100)
Source: World Bank
Figure 7. Global Grains Stocks-to-Use Ratio
Source: US Department of Agriculture
Figure 8. Food Price Indices (US$, 2000=100)
Source: World Bank
Figure 9. Raw Materials Price Indices (US$, 2000=100)
Source: World Bank
Figure 10. Fertilizer Price Indices (US$, 2000=100)
Source: World Bank
Agriculture
Forecast
Forecast
Forecast
Forecast
ForecastForecast
$/ton 000 tons
Figure 4. Copper Prices and LME Stocks

8
Global Commodity Markets World Bank
Global Commodity Outlook
scrap markets, and numerous strikes (in Canada and South America, for example) have helped tight-en markets. Over the next two years, metals prices are expected to continue to rise moderately as the global recovery progresses and demand expands (figure 5). The rise is expected to be moderate part-ly because of the large price appreciation to date, but mainly because of the substantial idle capacity in many sectors that can be profitably brought back into production at today’s prices. Once demand growth returns to trend and idle capacity is elimi-nated, the industry will again be challenged to add capacity in the face of strong demand growth in de-veloping countries—partly because new mines will be more expensive (underground versus open pit, for example) and often in geopolitically difficult re-gions. The industry will also need to contend with declining ore grades, obligations for environmental and land rehabilitation, and pressures on water, en-ergy, and labor supplies. Nonetheless, metals prices are not expected to regain the peaks attained ear-lier this decade.
Precious metals prices fell in the wake of the financial crisis and dollar appreciation. They then
climbed on renewed weakness of the dollar and surged to nominal highs during December 2009. Precious metals prices have climbed for eight con-secutive years, up 3.5 fold over the period. An im-portant investment driver has been the growth in physically backed exchange-traded funds (ETFs); gold and silver ETF inflows in 2009 represented 23 and 18 percent, respectively, of global mine production. Precious metals prices are projected to remain strong in 2010 but to decline over the forecast period, as high prices discourage demand and encourage new supply (figure 6).
AgricultureAlthough dollar agricultural prices have declined 22 percent since their June 2008 peak, they are still almost twice as high as the lows they reached in the early 2000s. The recent fall in agricultural prices reflects both lower oil prices—a key cost component—and larger stockpiles of key agri-cultural commodities, including rice, maize, and wheat (figure 7), resulting from favorable harvests and area expansion. For example, the November 2009 US Department of Agriculture data indicate that stocks of key grains will increase 3 percent in 2009/10, on top of the 23 percent gain they expe-rienced in the previous season.
Barring unforeseen production problems—such as the drought in South America that affected soy-bean production or the drought in India that af-fected sugar and rice production—agricultural markets are likely to remain well supplied. As a result, prices of food and raw material commodi-ties are projected to decline by 6 percent in 2010 and to remain relatively stable over the medium term, with up- and downside risks more or less
0
100
200
300
400Constant 2000 DollarsCurrent Dollars
20202015201020052000199519901985198019751970
0
100
200
300
400
500Metals and MineralsAgricultureEnergy
Jan-10Jan-06Jan-02Jan-98Jan-94Jan-90
0
100
200
300
400Constant 2000 DollarsCurrent Dollars
20202015201020052000199519901985198019751970
0
2
4
6
8
Jan-10Jan-09Jan-08Jan-07Jan-06Jan-05Jan-04Jan-03Jan-02Jan-01
0
2500
5000
7500
10000
Copper price [left axis]
Jan-10Jan-09Jan-08Jan-07Jan-06Jan-05Jan-04Jan-03
0
100
200
300
400Constant 2000 DollarsCurrent Dollars
20202015201020052000199519901985198019751970
0.10
0.15
0.20
0.25
0.30
0.35
0.40
Grains Stocks
201020052000199519901985198019751970
0
100
200
300
400Constant 2000 DollarsCurrent Dollars
20202015201020052000199519901985198019751970
0
50
100
150
200Constant Current DollarsCurrent Dollars
20202015201020052000199519901985198019751970
0
150
300
450
600Constant 2000 DollarsCurrent Dollars
20202015201020052000199519901985198019751970
0
250
500
750
1000
Stocks [right axis]
Figure 3. Energy Price Indices (2000=100)Figure 4. Copper Prices and LME Stocks
Figure 1. Commodity Price Indices (Nominal, 2000=100)
Source: World Bank
Figure 5. Metals and Minerals Price Indices (2000=100)
Source: World Bank
Source: World Bank
Figure 2. OPEC Spare Capacity (mb/d)
Source: International Energy Agency
Source: LME and Datastreem
Figure 6. Precious Metals Price Indices (US$, 2000=100)
Source: World Bank
Figure 7. Global Grains Stocks-to-Use Ratio
Source: US Department of Agriculture
Figure 8. Food Price Indices (US$, 2000=100)
Source: World Bank
Figure 9. Raw Materials Price Indices (US$, 2000=100)
Source: World Bank
Figure 10. Fertilizer Price Indices (US$, 2000=100)
Source: World Bank
Agriculture
Forecast
Forecast
Forecast
Forecast
ForecastForecast
$/ton 000 tons
Figure 7. Global Grains Stocks-to-Use Ratio
0
100
200
300
400Constant 2000 DollarsCurrent Dollars
20202015201020052000199519901985198019751970
0
100
200
300
400
500Metals and MineralsAgricultureEnergy
Jan-10Jan-06Jan-02Jan-98Jan-94Jan-90
0
100
200
300
400Constant 2000 DollarsCurrent Dollars
20202015201020052000199519901985198019751970
0
2
4
6
8
Jan-10Jan-09Jan-08Jan-07Jan-06Jan-05Jan-04Jan-03Jan-02Jan-01
0
2500
5000
7500
10000
Copper price [left axis]
Jan-10Jan-09Jan-08Jan-07Jan-06Jan-05Jan-04Jan-03
0
100
200
300
400Constant 2000 DollarsCurrent Dollars
20202015201020052000199519901985198019751970
0.10
0.15
0.20
0.25
0.30
0.35
0.40
Grains Stocks
201020052000199519901985198019751970
0
100
200
300
400Constant 2000 DollarsCurrent Dollars
20202015201020052000199519901985198019751970
0
50
100
150
200Constant Current DollarsCurrent Dollars
20202015201020052000199519901985198019751970
0
150
300
450
600Constant 2000 DollarsCurrent Dollars
20202015201020052000199519901985198019751970
0
250
500
750
1000
Stocks [right axis]
Figure 3. Energy Price Indices (2000=100)Figure 4. Copper Prices and LME Stocks
Figure 1. Commodity Price Indices (Nominal, 2000=100)
Source: World Bank
Figure 5. Metals and Minerals Price Indices (2000=100)
Source: World Bank
Source: World Bank
Figure 2. OPEC Spare Capacity (mb/d)
Source: International Energy Agency
Source: LME and Datastreem
Figure 6. Precious Metals Price Indices (US$, 2000=100)
Source: World Bank
Figure 7. Global Grains Stocks-to-Use Ratio
Source: US Department of Agriculture
Figure 8. Food Price Indices (US$, 2000=100)
Source: World Bank
Figure 9. Raw Materials Price Indices (US$, 2000=100)
Source: World Bank
Figure 10. Fertilizer Price Indices (US$, 2000=100)
Source: World Bank
Agriculture
Forecast
Forecast
Forecast
Forecast
ForecastForecast
$/ton 000 tons
Figure 5. Metals and Minerals Price Indices (2000=100)
0
100
200
300
400Constant 2000 DollarsCurrent Dollars
20202015201020052000199519901985198019751970
0
100
200
300
400
500Metals and MineralsAgricultureEnergy
Jan-10Jan-06Jan-02Jan-98Jan-94Jan-90
0
100
200
300
400Constant 2000 DollarsCurrent Dollars
20202015201020052000199519901985198019751970
0
2
4
6
8
Jan-10Jan-09Jan-08Jan-07Jan-06Jan-05Jan-04Jan-03Jan-02Jan-01
0
2500
5000
7500
10000
Copper price [left axis]
Jan-10Jan-09Jan-08Jan-07Jan-06Jan-05Jan-04Jan-03
0
100
200
300
400Constant 2000 DollarsCurrent Dollars
20202015201020052000199519901985198019751970
0.10
0.15
0.20
0.25
0.30
0.35
0.40
Grains Stocks
201020052000199519901985198019751970
0
100
200
300
400Constant 2000 DollarsCurrent Dollars
20202015201020052000199519901985198019751970
0
50
100
150
200Constant Current DollarsCurrent Dollars
20202015201020052000199519901985198019751970
0
150
300
450
600Constant 2000 DollarsCurrent Dollars
20202015201020052000199519901985198019751970
0
250
500
750
1000
Stocks [right axis]
Figure 3. Energy Price Indices (2000=100)Figure 4. Copper Prices and LME Stocks
Figure 1. Commodity Price Indices (Nominal, 2000=100)
Source: World Bank
Figure 5. Metals and Minerals Price Indices (2000=100)
Source: World Bank
Source: World Bank
Figure 2. OPEC Spare Capacity (mb/d)
Source: International Energy Agency
Source: LME and Datastreem
Figure 6. Precious Metals Price Indices (US$, 2000=100)
Source: World Bank
Figure 7. Global Grains Stocks-to-Use Ratio
Source: US Department of Agriculture
Figure 8. Food Price Indices (US$, 2000=100)
Source: World Bank
Figure 9. Raw Materials Price Indices (US$, 2000=100)
Source: World Bank
Figure 10. Fertilizer Price Indices (US$, 2000=100)
Source: World Bank
Agriculture
Forecast
Forecast
Forecast
Forecast
ForecastForecast
$/ton 000 tons
Figure 6. Precious Metals Price Indices (US$, 2000=100)

9
Global Commodity Markets World Bank
in balance (figures 8 and 9). On the one hand, a stronger link between energy and agricultural prices (higher costs of production plus demand for biofuel) will exert upward pressure on prices; on the other hand, continued gains in total factor productivity (which tend to be stronger in agricul-ture than in manufacturing) should constrain the costs of production. Volatility in commodity prices, however, could become a problem if financial in-vestors increase their influence in commodity mar-kets. Similarly, the use of food commodities for biofuel production, largely depending on national biofuel mandates, may influence prices as well.
Food security concerns have subsided, and countries have reduced or eliminated most of
the export bans and other export restrictions that were introduced during the commodity price spike of 2008. Moreover, productivity gains at the global level should ensure long-term food sup-ply. However, there is a risk that several poor countries will come to rely increasingly on im-ported food to meet basic needs unless they can improve their agricultural productivity growth. Growth in per capita agricultural GDP between 1980 and 2004 varied across countries, exceeding 3 percent a year in East Asia (the best-perform-ing region) but falling short of 1 percent a year in Sub-Saharan Africa. Most of this variance re-flected productivity differences, in turn stemming from the full adoption of the green revolution in Asia.
Agricultural production and prices will be af-fected by the prices of fertilizer, a key input to the production of most crops. Fertilizer prices in-creased five-fold between 2002 and 2008. Though they declined considerably during 2009, their long-term real average is expected to be 80 per-cent higher than their early 2000s levels (figure 10), raising the cost of producing most agricultural commodities. Fertilizer prices are closely linked to energy prices, providing another dimension to the energy/non-energy price link.
0
100
200
300
400Constant 2000 DollarsCurrent Dollars
20202015201020052000199519901985198019751970
0
100
200
300
400
500Metals and MineralsAgricultureEnergy
Jan-10Jan-06Jan-02Jan-98Jan-94Jan-90
0
100
200
300
400Constant 2000 DollarsCurrent Dollars
20202015201020052000199519901985198019751970
0
2
4
6
8
Jan-10Jan-09Jan-08Jan-07Jan-06Jan-05Jan-04Jan-03Jan-02Jan-01
0
2500
5000
7500
10000
Copper price [left axis]
Jan-10Jan-09Jan-08Jan-07Jan-06Jan-05Jan-04Jan-03
0
100
200
300
400Constant 2000 DollarsCurrent Dollars
20202015201020052000199519901985198019751970
0.10
0.15
0.20
0.25
0.30
0.35
0.40
Grains Stocks
201020052000199519901985198019751970
0
100
200
300
400Constant 2000 DollarsCurrent Dollars
20202015201020052000199519901985198019751970
0
50
100
150
200Constant Current DollarsCurrent Dollars
20202015201020052000199519901985198019751970
0
150
300
450
600Constant 2000 DollarsCurrent Dollars
20202015201020052000199519901985198019751970
0
250
500
750
1000
Stocks [right axis]
Figure 3. Energy Price Indices (2000=100)Figure 4. Copper Prices and LME Stocks
Figure 1. Commodity Price Indices (Nominal, 2000=100)
Source: World Bank
Figure 5. Metals and Minerals Price Indices (2000=100)
Source: World Bank
Source: World Bank
Figure 2. OPEC Spare Capacity (mb/d)
Source: International Energy Agency
Source: LME and Datastreem
Figure 6. Precious Metals Price Indices (US$, 2000=100)
Source: World Bank
Figure 7. Global Grains Stocks-to-Use Ratio
Source: US Department of Agriculture
Figure 8. Food Price Indices (US$, 2000=100)
Source: World Bank
Figure 9. Raw Materials Price Indices (US$, 2000=100)
Source: World Bank
Figure 10. Fertilizer Price Indices (US$, 2000=100)
Source: World Bank
Agriculture
Forecast
Forecast
Forecast
Forecast
ForecastForecast
$/ton 000 tons
Figure 8. Food Price Indices (US$, 2000=100)
0
100
200
300
400Constant 2000 DollarsCurrent Dollars
20202015201020052000199519901985198019751970
0
100
200
300
400
500Metals and MineralsAgricultureEnergy
Jan-10Jan-06Jan-02Jan-98Jan-94Jan-90
0
100
200
300
400Constant 2000 DollarsCurrent Dollars
20202015201020052000199519901985198019751970
0
2
4
6
8
Jan-10Jan-09Jan-08Jan-07Jan-06Jan-05Jan-04Jan-03Jan-02Jan-01
0
2500
5000
7500
10000
Copper price [left axis]
Jan-10Jan-09Jan-08Jan-07Jan-06Jan-05Jan-04Jan-03
0
100
200
300
400Constant 2000 DollarsCurrent Dollars
20202015201020052000199519901985198019751970
0.10
0.15
0.20
0.25
0.30
0.35
0.40
Grains Stocks
201020052000199519901985198019751970
0
100
200
300
400Constant 2000 DollarsCurrent Dollars
20202015201020052000199519901985198019751970
0
50
100
150
200Constant Current DollarsCurrent Dollars
20202015201020052000199519901985198019751970
0
150
300
450
600Constant 2000 DollarsCurrent Dollars
20202015201020052000199519901985198019751970
0
250
500
750
1000
Stocks [right axis]
Figure 3. Energy Price Indices (2000=100)Figure 4. Copper Prices and LME Stocks
Figure 1. Commodity Price Indices (Nominal, 2000=100)
Source: World Bank
Figure 5. Metals and Minerals Price Indices (2000=100)
Source: World Bank
Source: World Bank
Figure 2. OPEC Spare Capacity (mb/d)
Source: International Energy Agency
Source: LME and Datastreem
Figure 6. Precious Metals Price Indices (US$, 2000=100)
Source: World Bank
Figure 7. Global Grains Stocks-to-Use Ratio
Source: US Department of Agriculture
Figure 8. Food Price Indices (US$, 2000=100)
Source: World Bank
Figure 9. Raw Materials Price Indices (US$, 2000=100)
Source: World Bank
Figure 10. Fertilizer Price Indices (US$, 2000=100)
Source: World Bank
Agriculture
Forecast
Forecast
Forecast
Forecast
ForecastForecast
$/ton 000 tons
Figure 9. Raw Materials Price Indices (US$, 2000=100)
0
100
200
300
400Constant 2000 DollarsCurrent Dollars
20202015201020052000199519901985198019751970
0
100
200
300
400
500Metals and MineralsAgricultureEnergy
Jan-10Jan-06Jan-02Jan-98Jan-94Jan-90
0
100
200
300
400Constant 2000 DollarsCurrent Dollars
20202015201020052000199519901985198019751970
0
2
4
6
8
Jan-10Jan-09Jan-08Jan-07Jan-06Jan-05Jan-04Jan-03Jan-02Jan-01
0
2500
5000
7500
10000
Copper price [left axis]
Jan-10Jan-09Jan-08Jan-07Jan-06Jan-05Jan-04Jan-03
0
100
200
300
400Constant 2000 DollarsCurrent Dollars
20202015201020052000199519901985198019751970
0.10
0.15
0.20
0.25
0.30
0.35
0.40
Grains Stocks
201020052000199519901985198019751970
0
100
200
300
400Constant 2000 DollarsCurrent Dollars
20202015201020052000199519901985198019751970
0
50
100
150
200Constant Current DollarsCurrent Dollars
20202015201020052000199519901985198019751970
0
150
300
450
600Constant 2000 DollarsCurrent Dollars
20202015201020052000199519901985198019751970
0
250
500
750
1000
Stocks [right axis]
Figure 3. Energy Price Indices (2000=100)Figure 4. Copper Prices and LME Stocks
Figure 1. Commodity Price Indices (Nominal, 2000=100)
Source: World Bank
Figure 5. Metals and Minerals Price Indices (2000=100)
Source: World Bank
Source: World Bank
Figure 2. OPEC Spare Capacity (mb/d)
Source: International Energy Agency
Source: LME and Datastreem
Figure 6. Precious Metals Price Indices (US$, 2000=100)
Source: World Bank
Figure 7. Global Grains Stocks-to-Use Ratio
Source: US Department of Agriculture
Figure 8. Food Price Indices (US$, 2000=100)
Source: World Bank
Figure 9. Raw Materials Price Indices (US$, 2000=100)
Source: World Bank
Figure 10. Fertilizer Price Indices (US$, 2000=100)
Source: World Bank
Agriculture
Forecast
Forecast
Forecast
Forecast
ForecastForecast
$/ton 000 tons
Figure 10. Fertilizer Price Indices (US$, 2000=100)
KEy NOMINAL COMMODITy PRICE INDICES (ACTUAL AND FORECAST, 2000=100), 2004-11Actual Forecast
2004 2005 2006 2007 2008 2009 2010 2011Energy 136 188 221 245 342 214 261 265Non-Energy 133 149 192 225 272 213 224 226Agriculture 130 133 150 180 229 198 186 183Food 136 134 147 185 247 205 193 193Beverages 120 137 145 170 210 220 213 184Raw Materials 120 131 160 175 196 169 156 158Metals & Minerals 139 179 280 314 326 236 301 317Fertilizers 137 163 169 240 567 293 239 205

50
150
250
350
450Monthly Prices($/metric ton)
Jan-10Jan-08Jan-06Jan-04Jan-02Jan-00
50
150
250
350
450 Constant 2000Current
202020152010200520001995199019851980
0
1
2
3
4COCOA ICCO ($/kg)
Jan-10Jan-08Jan-06Jan-04Jan-02Jan-00
0
1
2
3
4Constant 2000Current
202020152010200520001995199019851980
0.75
1.00
1.25
1.50
1.75
2.00Monthly Prices($/metric ton)
Jan-10Jan-08Jan-06Jan-04Jan-02Jan-00
0.75
1.25
1.75
2.25
2.75 Constant 2000Current
202020152010200520001995199019851980
1200
1700
2200
2700
3200COCOA ICCO ($/kg)
Jan-10Jan-08Jan-06Jan-04Jan-02Jan-00
300
975
1650
2325
3000Constant 2000Current
202020152010200520001995199019851980
Wheat Cocoa
Source: World Bank
Source: World Bank
Source: World Bank
Source: World Bank
Cotton Aluminum
Constant 2000
Current
Constant 2000
Current
Source: World Bank
Source: World Bank
Source: World Bank
Source: World Bank
Constant 2000
Current
Constant 2000
Current
Forecast
Forecast
Forecast Forecast
50
150
250
350
450Monthly Prices($/metric ton)
Jan-10Jan-08Jan-06Jan-04Jan-02Jan-00
50
150
250
350
450 Constant 2000Current
202020152010200520001995199019851980
0
1
2
3
4COCOA ICCO ($/kg)
Jan-10Jan-08Jan-06Jan-04Jan-02Jan-00
0
1
2
3
4Constant 2000Current
202020152010200520001995199019851980
0.75
1.00
1.25
1.50
1.75
2.00Monthly Prices($/metric ton)
Jan-10Jan-08Jan-06Jan-04Jan-02Jan-00
0.75
1.25
1.75
2.25
2.75 Constant 2000Current
202020152010200520001995199019851980
1200
1700
2200
2700
3200COCOA ICCO ($/kg)
Jan-10Jan-08Jan-06Jan-04Jan-02Jan-00
300
975
1650
2325
3000Constant 2000Current
202020152010200520001995199019851980
Wheat Cocoa
Source: World Bank
Source: World Bank
Source: World Bank
Source: World Bank
Cotton Aluminum
Constant 2000
Current
Constant 2000
Current
Source: World Bank
Source: World Bank
Source: World Bank
Source: World Bank
Constant 2000
Current
Constant 2000
Current
Forecast
Forecast
Forecast Forecast
10
Global Commodity Markets World Bank
Annual Prices ($/metric ton)Monthly Prices ($/metric ton)
GLOBAL MARKET DATA
2005 2006 2007 2008 2005 2006 2007 2008PRODUCTION (000 metric tons) EXPORTS (000 metric tons)
China 7,806 9,358 12,559 13,177 Russian Fed. 2,740 3,164 3,949 4,818Russian Fed. 3,647 3,718 3,955 4,187 Canada 2,240 2,360 2,501 2,532Canada 2,894 3,051 3,083 3,119 Australia 1,588 1,624 1,659 1,683US 2,480 2,281 2,560 2,659 Norway 1,513 1,539 1,610 1,591Australia 1,903 1,929 1,959 1,974 China 1,324 1,213 546 841Brazil 1,498 1,605 1,655 1,661 Iceland 284 303 446 761Norway 1,376 1,427 1,357 1,359 Brazil 753 842 823 748India 942 1,105 1,222 1,308 South Africa 671 601 625 598South Africa 851 887 898 1,084 Netherlands 482 609 795 483UAE 850 789 890 892 Germany 392 432 423 435World 31,995 33,969 38,087 39,425 World 17,023 17,706 18,906 19,308
CONSUMPTION (000 metric tons) IMPORTS (000 metric tons)China 7,119 8,648 12,347 12,413 Japan 2,977 3,036 2,986 3,064US 6,114 6,150 5,580 5,615 US 3,691 3,461 2,951 2,932Japan 2,276 2,323 2,197 2,250 Germany 1,770 2,073 2,231 2,063Germany 1,758 1,823 2,008 1,950 Korea, Rep. 1,231 1,204 1,190 1,086India 958 1,079 1,207 1,305 Italy 890 986 1,079 882Russian Fed. 1,020 1,047 1,020 1,020 Turkey 383 414 572 598Korea, Rep. 1,201 1,153 1,081 965 Belgium 763 738 754 558Italy 977 1,021 1,087 951 Netherlands 656 971 1,043 554Brazil 759 773 854 932 France 517 593 587 509Canada 801 846 718 714 Taiwan, China 523 540 504 504World 31,720 34,026 37,578 37,796 World 18,318 19,254 19,334 17,894Source: World Metal Statistics
AluminiumAluminum prices averaged $1,665/ton in 2009, down 35 percent from $2,573/ton in 2008. Beginning in Q2, prices rebounded from their February lows, reflecting restock-ing, strong import demand in China during the first half of the year, slowly improving demand elsewhere, and rising costs. A significant portion of LME inventories has been tied up in financing deals. High forward prices and cheap warehousing costs have made it profitable for investors to buy on spot markets, hold stocks in storage, and sell on forward markets, locking in profits but effectively reduc-ing short-term supply.
In 2010-11, record inventories and substantial over-capacity are expected to keep the aluminum market in surplus, but over the medium term prices are expected to rise moderately, pushed by strong end-use demand, diminishing surpluses, and rising energy costs. Prices are expected to continue to lag those of other metals, notably copper.
Global demand contracted in 2008 and 2009 but is expected to grow quite strongly in 2010 as global de-mand recovers; aluminum has a broad range of end-uses in transport, construction, packaging, and electri-cal and consumer durables. More than half the global growth is expected to be in China, reflecting continued urbanization and industrialization and the fact that the country has become the world’s largest automobile market.
In the near term, prices will partly depend on the pace of reactivation of idle capacity, most of which lies outside China. In the medium- to long term, the indus-try will face rising power prices from higher energy costs, reduced subsidies, and deregulated markets. Fu-ture supply growth is expected from regions that have low-cost power sources, for example Iceland, the Mid-dle East, Russia, and India (which also has abundant bauxite resources).

50
150
250
350
450Monthly Prices($/metric ton)
Jan-10Jan-08Jan-06Jan-04Jan-02Jan-00
50
150
250
350
450 Constant 2000Current
202020152010200520001995199019851980
0
1
2
3
4COCOA ICCO ($/kg)
Jan-10Jan-08Jan-06Jan-04Jan-02Jan-00
0
1
2
3
4Constant 2000Current
202020152010200520001995199019851980
0.75
1.00
1.25
1.50
1.75
2.00Monthly Prices($/metric ton)
Jan-10Jan-08Jan-06Jan-04Jan-02Jan-00
0.75
1.25
1.75
2.25
2.75 Constant 2000Current
202020152010200520001995199019851980
1200
1700
2200
2700
3200COCOA ICCO ($/kg)
Jan-10Jan-08Jan-06Jan-04Jan-02Jan-00
300
975
1650
2325
3000Constant 2000Current
202020152010200520001995199019851980
Wheat Cocoa
Source: World Bank
Source: World Bank
Source: World Bank
Source: World Bank
Cotton Aluminum
Constant 2000
Current
Constant 2000
Current
Source: World Bank
Source: World Bank
Source: World Bank
Source: World Bank
Constant 2000
Current
Constant 2000
Current
Forecast
Forecast
Forecast Forecast
50
150
250
350
450Monthly Prices($/metric ton)
Jan-10Jan-08Jan-06Jan-04Jan-02Jan-00
50
150
250
350
450 Constant 2000Current
202020152010200520001995199019851980
0
1
2
3
4COCOA ICCO ($/kg)
Jan-10Jan-08Jan-06Jan-04Jan-02Jan-00
0
1
2
3
4Constant 2000Current
202020152010200520001995199019851980
0.75
1.00
1.25
1.50
1.75
2.00Monthly Prices($/metric ton)
Jan-10Jan-08Jan-06Jan-04Jan-02Jan-00
0.75
1.25
1.75
2.25
2.75 Constant 2000Current
202020152010200520001995199019851980
1200
1700
2200
2700
3200COCOA ICCO ($/kg)
Jan-10Jan-08Jan-06Jan-04Jan-02Jan-00
300
975
1650
2325
3000Constant 2000Current
202020152010200520001995199019851980
Wheat Cocoa
Source: World Bank
Source: World Bank
Source: World Bank
Source: World Bank
Cotton Aluminum
Constant 2000
Current
Constant 2000
Current
Source: World Bank
Source: World Bank
Source: World Bank
Source: World Bank
Constant 2000
Current
Constant 2000
Current
Forecast
Forecast
Forecast Forecast
11
Global Commodity Markets World Bank
Annual Prices ($/kg)
GLOBAL MARKET DATA
2005/06 2006/07 2007/08 2008/09 2004/05 2005/06 2006/07 2007/08PRODUCTION (000 metric tons) EXPORTS (000 metric tons)
Côte d'Ivoire 1,408 1,229 1,382 1,222 Côte d'Ivoire 950 1,006 851 862Ghana 741 615 729 662 Ghana 548 570 620 562Indonesia 560 545 485 475 Indonesia 361 493 416 356Nigeria 210 215 220 240 Nigeria 186 190 186 212Cameroon 171 169 185 210 Cameroon 165 146 140 159Brazil 162 126 171 157 Togo 53 73 78 111Ecuador 118 124 111 112 Ecuador 81 89 99 97Togo 73 78 111 95 PNG 47 51 47 52PNG 51 49 52 52 World 2,495 2,740 2,579 2,535Dominican Rep. 46 42 41 45 IMPORTS (000 metric tons)Colombia 37 30 38 45 Netherlands 608 549 639 653Peru 31 32 33 34 Malaysia 233 300 337 346World 3,786 3,434 3,731 3,515 US 514 505 380 335
GRINDINGS (000 metric tons) Germany 236 287 347 333Netherlands 465 480 490 440 Belgium 182 190 195 176Côte d'Ivoire 336 360 374 420 France 153 157 165 164US 432 418 391 359 UK 129 139 129 128Germany 307 357 385 342 Spain 72 76 83 98Malaysia 265 302 331 278 Singapore 64 70 89 89Brazil 223 226 232 216 Russian Fed. 68 70 64 67France 155 162 160 157 Canada 65 77 48 64Ghana 85 121 123 140 Turkey 57 56 64 64World 3,536 3,661 3,755 3,508 World 2,891 2,997 3,080 3,049Note: Latest trade data available are for 2007/08.Source: International Cocoa Organization, LMC International and World Bank estimates.
CocoaCocoa prices averaged $2.89/kg in 2009, 12 percent higher than in 2008. Reflecting persistent supply prob-lems they reached an all-time nominal high during 2009:Q4. Preliminary estimates for the 2009/10 (Octo-ber to September) season show global output of 3.54 million tons, up only slightly from the previous sea-son’s 3.52 million tons.
The key reason behind the lack of supply response seems to have been the deterioration of infrastructure in Côte d’Ivoire, the world’s largest producer, where it has become very expensive to transport inputs to farmers and cocoa beans to the port. Several reports also indicate that other key cocoa suppliers includ-ing Indonesia and Ecuador are encountering problems from El Niño-related adverse weather patterns. Grind-ings, a measure of cocoa demand, are projected to ex-ceed production for a fourth season in a row, keeping the stocks-to-use ratio at historically low levels.
Grindings are expected to reach 3.56 million tons in 2009/10, marginally higher than last season’s. Among key processors, only Côte d’Ivoire increased its grind-ings last season (from 374 to 420 thousand tons) in an attempt to capture an increasing share of value-added activities in the production chain. Most other cocoa processors, including the Netherlands, US, Germany, Malaysia, and Brazil, saw moderate declines in their grindings.
In the expected tight market for cocoa, prices are likely to stay high by historical standards, averaging $3.00/kg in 2010. A decline to $2.40/kg is expected in 2011, with a further decline over the longer term, as supplies in other key producing countries catch up with Côte d’Ivoire’s reduced production and eventu-ally offset the market shortfall. This forecast depends heavily on political developments, as well as infra-structure investments, in Côte d’Ivoire.
Monthly Prices ($/kg)

0
1
2
3
4Robusta (¢/kg)Arabica (¢/kg)
Jan-10Jan-08Jan-06Jan-04Jan-02Jan-00
0.0
1.5
3.0
4.5
6.0 Constant 2000Current
202020152010200520001995199019851980
1000
3000
5000
7000
9000Copper LME
Jan-10Jan-08Jan-06Jan-04Jan-02Jan-00
1000
3000
5000
7000
9000Constant 2000Current
202020152010200520001995199019851980
200
450
700
950
1200Gold Price, US $ per troy ounce
Jan-10Jan-08Jan-06Jan-04Jan-02Jan-00
200
400
600
800
1000 Constant 2000Current
202020152010200520001995199019851980
50
100
150
200
250
300Monthly Prices ($/ton)
Jan-10Jan-08Jan-06Jan-04Jan-02Jan-00
50
100
150
200
250
300Constant 2000Current
202020152010200520001995199019851980
Co�ee Copper
Source: World Bank
Source: World Bank
Source: World Bank
Source: World Bank
Gold Maize
Constant 2000
Current
Constant 2000
Current
Source: World Bank
Source: World Bank
Source: World Bank
Source: World Bank
Robusta
Arabica
Robusta
Arabica
Constant 2000
Current
Forecast
Forecast
Forecast Forecast
12
Global Commodity Markets World Bank
Annual Constant 2000 Prices ($/kg)Monthly Prices ($/kg)
GLOBAL MARKET DATA
2005/06 2006/07 2007/08 2008/09 2005 2006 2007 2008PRODUCTION (000 bags) CONSUMPTION (000 bags)
Brazil 32,944 42,512 36,070 45,992 US 20,998 20,667 21,033 21,652Vietnam 13,542 19,340 16,467 18,500 Brazil 15,390 16,133 16,927 17,526Indonesia 9,159 7,483 7,777 9,350 Germany 8,665 9,151 8,627 9,554Colombia 12,329 12,541 12,504 8,664 Japan 7,128 7,268 7,282 7,065Mexico 4,225 4,200 4,150 4,650 Italy 5,552 5,593 5,821 5,937India 4,396 5,159 4,460 4,372 France 4,787 5,278 5,628 5,155Ethiopia 4,003 4,636 4,906 4,350 Russian, Fed. 3,212 3,263 4,055 3,716Peru 2,489 4,319 3,063 3,872 Spain 3,007 3,017 3,198 3,485Guatemala 3,676 3,950 4,100 3,730 Indonesia 2,375 2,750 3,208 3,333Uganda 2,159 2,700 3,250 3,100 Canada 2,794 3,098 3,245 3,214Honduras 3,204 3,461 3,842 2,978 UK 2,680 3,059 2,824 3,067Côte d'Ivoire 1,962 2,847 2,150 2,500 Mexico 1,556 1,794 2,050 2,200Nicaragua 1,718 1,300 1,700 1,600 Algeria 1,892 1,836 1,968 2,118Costa Rica 1,778 1,580 1,791 1,580 Ethiopia 1,833 1,833 1,833 1,833El Salvador 1,502 1,371 1,621 1,420 Ukraine 1,025 968 1,057 1,733Tanzania 804 822 810 1,186 Korea, Rep. 1,394 1,437 1,425 1,665PNG 1,268 807 968 1,028 Venezuela 1,412 1,472 1,534 1,599Kenya 660 826 652 883 India 1,272 1,375 1,438 1,518Venezuela 760 813 899 880 Colombia 1,272 1,337 1,360 1,400World 110,181 129,139 118,949 128,073 Netherlands 1,927 2,129 2,292 1,324 Arabica 67,853 80,674 73,017 78,599 Sweden 1,170 1,315 1,244 1,272 Robusta 42,328 48,465 45,932 49,474 World 119,714 123,329 127,977 130,004Source: International Coffee Organizarion
CoffeeCoffee prices during 2009 averaged $3.17/kg (ara-bica) and $1.64/kg (robusta), 30 percent higher and 12 percent lower than their respective 2008 averag-es. While arabica prices were boosted by a weather-induced shortfall in Colombia, robusta prices were pushed downward by the arrival on the market of the new, larger, Vietnamese robusta crop. Recent prelimi-nary estimates for the 2009/10 season by the Interna-tional Coffee Organization show a 3.7 percent decline in global coffee production (from 128 to 124 million bags). Most of this decline will be in the arabica market (4.9 percent down) rather than the robusta market (1.6 percent down). Brazil’s 2009/10 crop is expected to be 39 million bags, down from 46 million in 2008/09. Colombia, whose 2008/09 production was its lowest since 1973/74, is not expected to recover its normal production level soon (Colombia’s shortfall caused the divergence between arabica and robusta prices).
Global coffee consumption reached 130 million bags during 2008, up from 128 million in 2007. Histori-cally, total coffee consumption has grown by about 2 percent a year, closely in line with world population growth, and this trend is likely to continue. Moreover, because coffee consumption varies little with respect to income, especially in high-income countries, the re-cent global economic downturn had no discernable impact on global demand. Reported reductions in cof-fee consumption in some Eastern European countries had a minimal effect on the market.
The estimates of a reduced 2009/10 coffee crop do not seem to have brought stocks in exporting coun-tries alarmingly low. Thus, barring an unfavorable weather event, arabica prices are expected to average $2.70/kg in 2010 with a further (albeit small) decline in 2011. Robusta prices are expected to average $1.78/kg in 2010 with no appreciable change in 2011.

0
1
2
3
4Robusta (¢/kg)Arabica (¢/kg)
Jan-10Jan-08Jan-06Jan-04Jan-02Jan-00
0.0
1.5
3.0
4.5
6.0 Constant 2000Current
202020152010200520001995199019851980
1000
3000
5000
7000
9000Copper LME
Jan-10Jan-08Jan-06Jan-04Jan-02Jan-00
1000
3000
5000
7000
9000Constant 2000Current
202020152010200520001995199019851980
200
450
700
950
1200Gold Price, US $ per troy ounce
Jan-10Jan-08Jan-06Jan-04Jan-02Jan-00
200
400
600
800
1000 Constant 2000Current
202020152010200520001995199019851980
50
100
150
200
250
300Monthly Prices ($/ton)
Jan-10Jan-08Jan-06Jan-04Jan-02Jan-00
50
100
150
200
250
300Constant 2000Current
202020152010200520001995199019851980
Co�ee Copper
Source: World Bank
Source: World Bank
Source: World Bank
Source: World Bank
Gold Maize
Constant 2000
Current
Constant 2000
Current
Source: World Bank
Source: World Bank
Source: World Bank
Source: World Bank
Robusta
Arabica
Robusta
Arabica
Constant 2000
Current
Forecast
Forecast
Forecast Forecast
13
Annual Prices ($/metric ton)Monthly Prices ($/metric ton)
Global Commodity Markets World Bank
GLOBAL MARKET DATA
2005 2006 2007 2008 2005 2006 2007 2008PRODUCTION (000 metric tons) EXPORTS (000 metric tons)
China 2,600 3,003 3,499 3,779 Chile 2,799 2,606 2,910 3,004Chile 2,824 2,811 2,937 3,060 Zambia 423 476 491 585Japan 1,395 1,532 1,577 1,540 Japan 248 320 428 423US 1,260 1,250 1,310 1,275 Peru 514 449 365 419Russian, Fed. 968 959 923 926 Australia 315 287 295 357Germany 638 662 666 690 Kazakhstan 401 357 349 344India 518 627 719 669 Poland 290 288 240 297Zambia 446 497 522 605 Canada 297 280 298 290Korea, Rep. 527 575 585 573 Belgium 241 237 201 260Poland 560 557 533 527 Russian, Fed. 301 262 275 207World 16,610 17,343 17,980 18,475 World 7,454 7,477 7,618 7,838
CONSUMPTION (000 metric tons) IMPORTS (000 metric tons)China 3,656 3,614 4,863 5,134 China 1,222 827 1,496 1,458US 2,257 2,096 2,140 1,933 Germany 625 881 844 833Germany 1,115 1,398 1,392 1,398 US 977 1,076 832 721Japan 1,229 1,282 1,252 1,184 Italy 652 774 746 617Korea, Rep. 868 828 858 852 Taiwan, China 640 647 615 585Russian, Fed. 667 693 688 731 France 517 507 432 434Italy 680 801 764 635 Korea, Rep. 428 380 420 406Taiwan, China 638 643 603 582 Turkey 224 150 288 288India 397 407 516 511 Thailand 235 268 245 265France 472 460 337 379 Brazil 168 175 218 252World 16,639 16,974 18,098 18,032 World 6,994 7,051 7,129 6,766Source: World Metal Statistics.
Copper prices averaged $5,150/ton 2009, down 26 per-cent from $6,956/ton in 2008. Their steady rise in 2009 from the lows reached in December 2008 was driven mainly by strong import demand in China, but also by an extremely tight scrap market (a reflection of the severe global industrial downturn) and a number of labor-related supply shutdowns in the Americas. Cop-per suffered fewer production cutbacks than did other metals following the contraction in global demand.
Copper prices are expected to remain elevated in 2010 and 2011, with demand growing relatively strongly amid longer-term supply concerns. In the me-dium term, capacity expansion will bring prices down somewhat, with the expected development of a few large mines and several small-to-medium operations. Prices are expected to remain well above historical levels because the industry faces several challenges in adding new capacity.
World copper demand, which grew 2.6 percent in 2000-07, fell in 2008 and 2009 despite strong growth in China. Although China’s demand growth is expected to slow, global demand is expected to rise at around 6.5 percent in 2010 and 2011, pushed by economic recovery and restocking elsewhere. Demand will then resume its trend growth of less than 5 percent, with some potential losses to substitution because of much higher prices for copper than other metals, particu-larly aluminum.
Copper mine capacity is set to grow moderately in future but the industry faces a number of hurdles, notably declining ore grades, rising costs, and energy and water availability. Much of the growth is projected to come from Latin America and Africa’s copper belt. Production in the latter region poses challenges with respect to labor, power, and flooding, as well political risks regarding licensing and contracts.
Copper

50
150
250
350
450Monthly Prices($/metric ton)
Jan-10Jan-08Jan-06Jan-04Jan-02Jan-00
50
150
250
350
450 Constant 2000Current
202020152010200520001995199019851980
0
1
2
3
4COCOA ICCO ($/kg)
Jan-10Jan-08Jan-06Jan-04Jan-02Jan-00
0
1
2
3
4Constant 2000Current
202020152010200520001995199019851980
0.75
1.00
1.25
1.50
1.75
2.00Monthly Prices($/metric ton)
Jan-10Jan-08Jan-06Jan-04Jan-02Jan-00
0.75
1.25
1.75
2.25
2.75 Constant 2000Current
202020152010200520001995199019851980
1200
1700
2200
2700
3200COCOA ICCO ($/kg)
Jan-10Jan-08Jan-06Jan-04Jan-02Jan-00
300
975
1650
2325
3000Constant 2000Current
202020152010200520001995199019851980
Wheat Cocoa
Source: World Bank
Source: World Bank
Source: World Bank
Source: World Bank
Cotton Aluminum
Constant 2000
Current
Constant 2000
Current
Source: World Bank
Source: World Bank
Source: World Bank
Source: World Bank
Constant 2000
Current
Constant 2000
Current
Forecast
Forecast
Forecast Forecast
50
150
250
350
450Monthly Prices($/metric ton)
Jan-10Jan-08Jan-06Jan-04Jan-02Jan-00
50
150
250
350
450 Constant 2000Current
202020152010200520001995199019851980
0
1
2
3
4COCOA ICCO ($/kg)
Jan-10Jan-08Jan-06Jan-04Jan-02Jan-00
0
1
2
3
4Constant 2000Current
202020152010200520001995199019851980
0.75
1.00
1.25
1.50
1.75
2.00Monthly Prices($/metric ton)
Jan-10Jan-08Jan-06Jan-04Jan-02Jan-00
0.75
1.25
1.75
2.25
2.75 Constant 2000Current
202020152010200520001995199019851980
1200
1700
2200
2700
3200COCOA ICCO ($/kg)
Jan-10Jan-08Jan-06Jan-04Jan-02Jan-00
300
975
1650
2325
3000Constant 2000Current
202020152010200520001995199019851980
Wheat Cocoa
Source: World Bank
Source: World Bank
Source: World Bank
Source: World Bank
Cotton Aluminum
Constant 2000
Current
Constant 2000
Current
Source: World Bank
Source: World Bank
Source: World Bank
Source: World Bank
Constant 2000
Current
Constant 2000
Current
Forecast
Forecast
Forecast Forecast
14
Global Commodity Markets World Bank
Annual Prices ($/kg)Monthly Prices ($/kg)
GLOBAL MARKET DATA
2007/08 2008/09 2009/10 2010/11 2007/08 2008/09 2009/10 2010/11PRODUCTION (000 metric tons) EXPORTS (000 metric tons)
China 8,078 8,025 6,750 7,748 US 2,973 2,555 2,286 2,319India 5,355 4,930 5,185 5,260 Uzbekistan 887 550 788 822US 4,182 2,838 2,721 2,994 Australia 270 230 336 363Pakistan 1,845 1,920 2,113 2,265 Brazil 486 480 349 351Brazil 1,603 1,402 1,170 1,270 Burkina Faso 194 156 184 204Uzbekistan 1,206 1,060 950 1,007 Turkmenistan 185 120 177 197Turkey 675 450 380 447 Greece 234 161 175 183Australia 126 315 375 396 Pakistan 62 62 130 130Turkmenistan 280 297 252 266 Zimbabwe 91 81 86 94Syria 250 220 200 211 World 8,358 6,176 7,025 6,823Greece 285 240 200 200 IMPORTS (000 metric tons)Burkina Faso 150 182 188 207 China 2,511 1,500 1,756 1,751Argentina 152 130 176 187 Bangladesh 600 551 767 806Egypt 212 118 104 115 Turkey 700 470 713 615World 26,280 23,698 22,165 24,005 Pakistan 786 450 546 514
STOCKS (000 metric tons) Indonesia 495 435 449 455China 3,328 3,226 3,067 3,101 Thailand 420 410 377 366India 1,541 2,223 1,788 1,744 Vietnam 240 239 317 335US 2,155 1,654 1,074 1,030 Mexico 333 266 303 243Pakistan 601 689 718 740 Korea, Rep. 212 190 206 191Brazil 1,224 949 604 593 Russian Fed. 233 200 196 175Uzbekistan 384 655 498 433 Taiwan, China 215 185 174 165World 12,202 12,583 10,677 10,520 World 8,289 6,176 7,025 6,823Source: International Cotton Advisory Committee
CottonCotton prices (Cotlook A index) averaged $1.38/kg during 2009, 12 percent lower than in 2008, most-ly because of weak demand. Price increases during 2008 were less pronounced for cotton than for other agricultural commodities, because of yield and out-put increases associated with the increased use of biotech cotton varieties.
The world average cotton yield increased from 566 kg/hectare in 1998/99, when these varieties were in-troduced to the Southern Hemisphere, to 792 kg/ha in 2007/08. By 2009/10, biotech varieties accounted for 53 percent of the global area allocated to cotton. Australia, South Africa, and the US have fully adopted the technology. The other two key beneficiaries have been China and India, which have 70 and 75 percent, respectively, of their cotton area planted to biotech varieties and together account for 70 percent of the global biotech cotton area.
In the 2009/10 (Aug-Jul) season, global cotton production totaled 22.2 million tons, down 6 percent from 2008/09. Early estimates for 2010/11, based on planting intentions, point to a sharp rise in produc-tion. Consumption during 2009/10 totaled 23.8 mil-lion tons, reducing the stock-to-use ratio to 45 per-cent from last season’s 53 percent but well above the historical average of 40 percent.
Given the expected sharp increase in global pro-duction, the Cotlook A Index is expected to aver-age $1.37/kg during 2010, similar to the 2009 average but much lower than the $1.57/kg average of 2008. Moderate price increases are expected in the medium term, as demand picks up from its recent weakness. However, if further expansion of biotech varieties takes place in key cotton producers such as Brazil, Pakistan, and Turkey, prices are likely to come under further downward pressure.
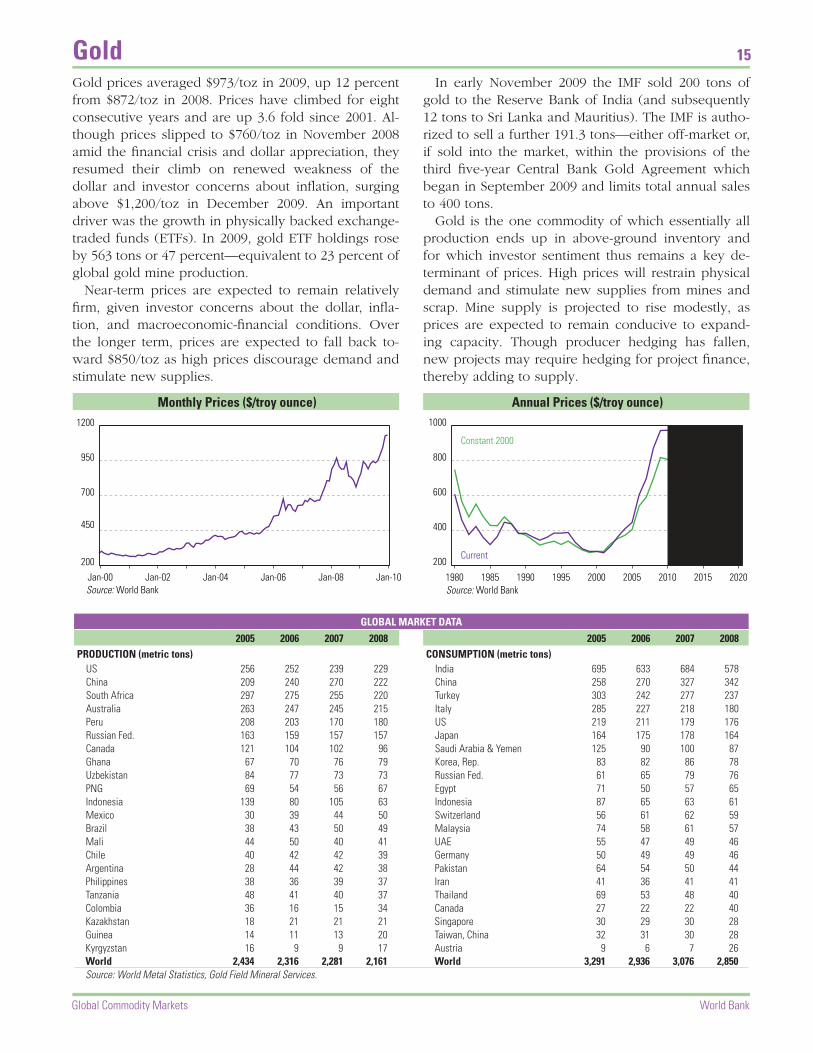
0
1
2
3
4Robusta (¢/kg)Arabica (¢/kg)
Jan-10Jan-08Jan-06Jan-04Jan-02Jan-00
0.0
1.5
3.0
4.5
6.0 Constant 2000Current
202020152010200520001995199019851980
1000
3000
5000
7000
9000Copper LME
Jan-10Jan-08Jan-06Jan-04Jan-02Jan-00
1000
3000
5000
7000
9000Constant 2000Current
202020152010200520001995199019851980
200
450
700
950
1200Gold Price, US $ per troy ounce
Jan-10Jan-08Jan-06Jan-04Jan-02Jan-00
200
400
600
800
1000 Constant 2000Current
202020152010200520001995199019851980
50
100
150
200
250
300Monthly Prices ($/ton)
Jan-10Jan-08Jan-06Jan-04Jan-02Jan-00
50
100
150
200
250
300Constant 2000Current
202020152010200520001995199019851980
Co�ee Copper
Source: World Bank
Source: World Bank
Source: World Bank
Source: World Bank
Gold Maize
Constant 2000
Current
Constant 2000
Current
Source: World Bank
Source: World Bank
Source: World Bank
Source: World Bank
Robusta
Arabica
Robusta
Arabica
Constant 2000
Current
Forecast
Forecast
Forecast Forecast
15
Global Commodity Markets World Bank
Annual Prices ($/troy ounce)Monthly Prices ($/troy ounce)
GLOBAL MARKET DATA
2005 2006 2007 2008 2005 2006 2007 2008PRODUCTION (metric tons) CONSUMPTION (metric tons)
US 256 252 239 229 India 695 633 684 578China 209 240 270 222 China 258 270 327 342South Africa 297 275 255 220 Turkey 303 242 277 237Australia 263 247 245 215 Italy 285 227 218 180Peru 208 203 170 180 US 219 211 179 176Russian Fed. 163 159 157 157 Japan 164 175 178 164Canada 121 104 102 96 Saudi Arabia & Yemen 125 90 100 87Ghana 67 70 76 79 Korea, Rep. 83 82 86 78Uzbekistan 84 77 73 73 Russian Fed. 61 65 79 76PNG 69 54 56 67 Egypt 71 50 57 65Indonesia 139 80 105 63 Indonesia 87 65 63 61Mexico 30 39 44 50 Switzerland 56 61 62 59Brazil 38 43 50 49 Malaysia 74 58 61 57Mali 44 50 40 41 UAE 55 47 49 46Chile 40 42 42 39 Germany 50 49 49 46Argentina 28 44 42 38 Pakistan 64 54 50 44Philippines 38 36 39 37 Iran 41 36 41 41Tanzania 48 41 40 37 Thailand 69 53 48 40Colombia 36 16 15 34 Canada 27 22 22 40Kazakhstan 18 21 21 21 Singapore 30 29 30 28Guinea 14 11 13 20 Taiwan, China 32 31 30 28Kyrgyzstan 16 9 9 17 Austria 9 6 7 26World 2,434 2,316 2,281 2,161 World 3,291 2,936 3,076 2,850Source: World Metal Statistics, Gold Field Mineral Services.
GoldGold prices averaged $973/toz in 2009, up 12 percent from $872/toz in 2008. Prices have climbed for eight consecutive years and are up 3.6 fold since 2001. Al-though prices slipped to $760/toz in November 2008 amid the financial crisis and dollar appreciation, they resumed their climb on renewed weakness of the dollar and investor concerns about inflation, surging above $1,200/toz in December 2009. An important driver was the growth in physically backed exchange-traded funds (ETFs). In 2009, gold ETF holdings rose by 563 tons or 47 percent—equivalent to 23 percent of global gold mine production.
Near-term prices are expected to remain relatively firm, given investor concerns about the dollar, infla-tion, and macroeconomic-financial conditions. Over the longer term, prices are expected to fall back to-ward $850/toz as high prices discourage demand and stimulate new supplies.
In early November 2009 the IMF sold 200 tons of gold to the Reserve Bank of India (and subsequently 12 tons to Sri Lanka and Mauritius). The IMF is autho-rized to sell a further 191.3 tons—either off-market or, if sold into the market, within the provisions of the third five-year Central Bank Gold Agreement which began in September 2009 and limits total annual sales to 400 tons.
Gold is the one commodity of which essentially all production ends up in above-ground inventory and for which investor sentiment thus remains a key de-terminant of prices. High prices will restrain physical demand and stimulate new supplies from mines and scrap. Mine supply is projected to rise modestly, as prices are expected to remain conducive to expand-ing capacity. Though producer hedging has fallen, new projects may require hedging for project finance, thereby adding to supply.

0
1
2
3
4Robusta (¢/kg)Arabica (¢/kg)
Jan-10Jan-08Jan-06Jan-04Jan-02Jan-00
0.0
1.5
3.0
4.5
6.0 Constant 2000Current
202020152010200520001995199019851980
1000
3000
5000
7000
9000Copper LME
Jan-10Jan-08Jan-06Jan-04Jan-02Jan-00
1000
3000
5000
7000
9000Constant 2000Current
202020152010200520001995199019851980
200
450
700
950
1200Gold Price, US $ per troy ounce
Jan-10Jan-08Jan-06Jan-04Jan-02Jan-00
200
400
600
800
1000 Constant 2000Current
202020152010200520001995199019851980
50
100
150
200
250
300Monthly Prices ($/ton)
Jan-10Jan-08Jan-06Jan-04Jan-02Jan-00
50
100
150
200
250
300Constant 2000Current
202020152010200520001995199019851980
Co�ee Copper
Source: World Bank
Source: World Bank
Source: World Bank
Source: World Bank
Gold Maize
Constant 2000
Current
Constant 2000
Current
Source: World Bank
Source: World Bank
Source: World Bank
Source: World Bank
Robusta
Arabica
Robusta
Arabica
Constant 2000
Current
Forecast
Forecast
Forecast Forecast
16
Global Commodity Markets World Bank
Annual Prices ($/metric ton)Monthly Prices ($/metric ton)
GLOBAL MARKET DATA
2006/07 2007/08 2008/09 2009/10 2006/07 2007/08 2008/09 2009/10PRODUCTION (000 metric tons) EXPORTS (000 metric tons)
US 267,503 331,177 307,386 328,207 US 53,987 61,913 47,184 52,072China 151,600 152,300 165,900 155,000 Brazil 10,836 7,791 7,500 9,000EU-27 53,829 47,555 62,701 56,126 Argentina 15,309 14,798 7,500 8,000Brazil 51,000 58,600 51,000 51,000 Ukraine 1,027 2,074 5,497 5,000Mexico 22,350 23,600 25,000 22,500 EU-27 664 591 1,750 1,500India 15,100 18,960 18,480 18,500 South Africa 468 2,162 2,500 1,500Argentina 22,500 22,000 12,600 14,000 World 93,960 98,609 80,843 83,957South Africa 7,300 13,164 12,567 11,500 IMPORTS (000 metric tons)Ukraine 6,400 7,400 11,400 10,500 Japan 16,713 16,614 16,533 16,300Canada 8,990 11,649 10,592 9,560 Mexico 8,944 9,556 7,700 9,000Indonesia 7,850 8,500 8,700 9,000 Korea, Rep. 8,731 9,311 7,194 7,500Nigeria 7,800 6,500 7,900 8,300 Taiwan, China 4,283 4,527 4,400 4,600Philippines 6,231 7,277 6,846 6,850 Egypt 4,826 4,151 5,000 4,200Serbia 6,415 4,054 5,900 6,400 Colombia 3,386 3,267 3,200 3,300World 712,380 791,871 791,627 790,175 Iran, Islamic Rep. 3,300 2,900 3,600 2,900
STOCKS (000 metric tons) Malaysia 2,363 3,181 2,000 2,600China 36,602 39,394 53,169 48,719 EU-27 7,056 14,016 2,500 2,500US 33,114 41,255 42,523 42,547 Algeria 2,406 1,963 1,900 2,100Brazil 3,592 12,579 12,579 9,579 Canada 2,102 3,182 1,843 2,000South Africa 1,661 3,090 3,182 3,007 Syria 1,516 1,691 1,800 1,900EU-27 7,382 4,362 5,813 2,939 Saudi Arabia 1,577 1,961 1,700 1,800Mexico 3,084 4,131 3,831 2,581 Morocco 1,558 1,883 1,500 1,600World 108,864 129,306 145,439 132,342 World 90,287 98,348 80,837 81,899Source: US Department of Agriculture
Maize prices averaged $166/ton in 2009, 26 percent down from 2008 but similar to their 2007 average. The sharp price decline reflected a reduction in biofuel de-mand and, to a lesser extent, weaker global demand for feed grains, due to a contraction in livestock pro-duction. During 2009 maize prices were remarkably stable. Declining crude oil prices, and overcapacity in the US ethanol industry, have reduced the profitabil-ity of ethanol production, causing a number of plants to be closed or reduce their capacity. In the US, the world’s largest maize-based ethanol producer, the En-ergy Independence and Security Act of 2007 mandated 11 billion gallons of ethanol use in 2009, to increase gradually 15 billion gallons—equivalent to about 5 percent of US crude oil consumption—by 2015. If this standard is binding, a considerable amount of maize will be diverted to ethanol production, keeping prices elevated by historical standards.
Global maize production is expected to remain virtually unchanged in 2009/10 at 790 million tons, according to the US Department of Agriculture (No-vember 2009). Production shortfalls in China, the EU, and Mexico will be balanced by a significant produc-tion increase in the US. Global exports will increase by more than three million tons, coming wholly from the US. Global stocks are expected to decline to 132 mil-lion tons in 2009/10 from 145 million tons in 2008/09, slightly reducing the stock-to-use ratio from 18 to 17 percent. In line with higher energy prices and biofuel mandates, maize prices are expected to average $166/ton during 2010, with only modest increases taking place in the following few years. Real maize prices are expected to average about 40 percent higher than in the first half of the current decade, before ethanol production had become a significant component of maize use.
Maize

0
15000
30000
45000
60000Monthly Prices ($/metric ton)
Jan-10Jan-08Jan-06Jan-04Jan-02Jan-00
0
10000
20000
30000
40000 Constant 2000Current
202020152010200520001995199019851980
200
500
800
1100
1400COCOA ICCO ($/kg)
Jan-10Jan-08Jan-06Jan-04Jan-02Jan-00
200
400
600
800
1000Constant 2000Current
202020152010200520001995199019851980
0
35
70
105
140Monthly Prices($/metric ton)
Jan-10Jan-08Jan-06Jan-04Jan-02Jan-00
0
30
60
90
120 Constant 2000Current
202020152010200520001995199019851980
150
350
550
750
950Monthly Prices ($/ton)
Jan-10Jan-08Jan-06Jan-04Jan-02Jan-00
100
200
300
400
500
600
700Constant 2000Current
202020152010200520001995199019851980
Nickel Palmoil
Source: World Bank
Source: World Bank
Source: World Bank
Source: World Bank
Petroleum Rice
Constant 2000
Current
Constant 2000
Current
Source: World Bank
Source: World Bank
Source: World Bank
Source: World Bank
Constant 2000
Current
Constant 2000
Current
Forecast Forecast
Forecast Forecast
0
15000
30000
45000
60000Monthly Prices ($/metric ton)
Jan-10Jan-08Jan-06Jan-04Jan-02Jan-00
0
10000
20000
30000
40000 Constant 2000Current
202020152010200520001995199019851980
200
500
800
1100
1400COCOA ICCO ($/kg)
Jan-10Jan-08Jan-06Jan-04Jan-02Jan-00
200
400
600
800
1000Constant 2000Current
202020152010200520001995199019851980
0
35
70
105
140Monthly Prices($/metric ton)
Jan-10Jan-08Jan-06Jan-04Jan-02Jan-00
0
30
60
90
120 Constant 2000Current
202020152010200520001995199019851980
150
350
550
750
950Monthly Prices ($/ton)
Jan-10Jan-08Jan-06Jan-04Jan-02Jan-00
100
200
300
400
500
600
700Constant 2000Current
202020152010200520001995199019851980
Nickel Palmoil
Source: World Bank
Source: World Bank
Source: World Bank
Source: World Bank
Petroleum Rice
Constant 2000
Current
Constant 2000
Current
Source: World Bank
Source: World Bank
Source: World Bank
Source: World Bank
Constant 2000
Current
Constant 2000
Current
Forecast Forecast
Forecast Forecast
17
Annual Prices ($/metric ton)Monthly Prices ($/metric ton)
Global Commodity Markets World Bank
GLOBAL MARKET DATA
2005 2006 2007 2008 2005 2006 2007 2008PRODUCTION (000 metric tons) CONSUMPTION (000 metric tons)
Russian Fed. 268 274 267 264 China 195 234 328 305Canada 140 154 163 176 Japan 180 181 196 185China 95 132 220 171 US 135 144 118 121Japan 164 152 161 156 Germany 116 106 110 90Australia 122 116 114 108 Korea, Rep. 118 93 71 73Norway 85 82 88 89 Taiwan, China 84 107 76 69Finland 39 47 55 51 Italy 60 68 64 68Cuba 44 42 44 44 Belgium 49 58 55 47Colombia 53 51 49 42 South Africa 47 54 44 44UK 38 37 34 39 Finland 49 51 40 41New Caledonia 47 49 45 37 Spain 48 53 41 41South Africa 42 42 38 32 UK 32 32 32 32Brazil 30 31 32 31 Sweden 35 36 34 31Ukraine 13 16 21 25 France 32 32 31 28Dominican Rep. 29 30 29 20 Russian Fed. 26 26 26 26Indonesia 7 14 19 18 Brazil 26 25 22 25Greece 19 18 19 17 India 16 18 19 21Macedonia 8 11 15 15 Canada 5 5 5 5France 13 14 15 13 Singapore 4 4 4 4Zimbabwe 16 13 14 11 Turkey 3 1 1 4Venezuela 17 17 16 11 Austria 7 8 3 3
Poland 1 2 2 3World 1,288 1,341 1,456 1,368 World 1,296 1,366 1,353 1,295Source: World Metal Statistics
Nickel prices averaged $14,655/ton in 2009, down 31 percent from $21,111/ton in 2008. They rebounded strongly beginning in March, reflecting a surge in stain-less steel production, massive cuts in nickel production in the immediate wake of the financial crisis, relatively tight availability of scrap, and strikes at Vale’s Canadian operations. Later in 2009, prices weakened as stainless steel production outpaced demand, and LME nickel in-ventories climbed to 15-year highs. In December 2009, prices were one third of their peak of May 2007, owing to a surplus of some 20 percent of global capacity.
Nickel prices are expected to rise only moderately in 2010, because substantial idle capacity and new sup-ply additions are expected to comfortably satisfy rising demand. However, they are likely to remain volatile due to the large stocking/destocking cycles that typi-fy the stainless steel sector, which accounts for about two-thirds of nickel demand.
World nickel demand has fallen for three consecu-tive years, after an extraordinary price peak of more than $50,000/ton provoked substitution to low-grade nickel products. Stainless steel production is expected to rebound strongly in 2010, led by China, but also increasingly in other major producing centers. Thus nickel demand should increase by 10 percent in 2010, with growth slowing only slightly in 2011-12 before returning to trend.
Despite robust consumption, projected nickel sup-plies appear more than adequate, in view of large idle capacity and a stream of new projects due to start pro-duction this year and the next few years. Nickel price gains may also be limited by a fall in costs of nickel pig-iron production in China (from low-grade ores im-ported from the Philippines, Indonesia, and New Cale-donia), to some $14,000-$15,000/ton, although these costs are sensitive to costs of coke and freight.
Nickel

0
15000
30000
45000
60000Monthly Prices ($/metric ton)
Jan-10Jan-08Jan-06Jan-04Jan-02Jan-00
0
10000
20000
30000
40000 Constant 2000Current
202020152010200520001995199019851980
200
500
800
1100
1400COCOA ICCO ($/kg)
Jan-10Jan-08Jan-06Jan-04Jan-02Jan-00
200
400
600
800
1000Constant 2000Current
202020152010200520001995199019851980
0
35
70
105
140Monthly Prices($/metric ton)
Jan-10Jan-08Jan-06Jan-04Jan-02Jan-00
0
30
60
90
120 Constant 2000Current
202020152010200520001995199019851980
150
350
550
750
950Monthly Prices ($/ton)
Jan-10Jan-08Jan-06Jan-04Jan-02Jan-00
100
200
300
400
500
600
700Constant 2000Current
202020152010200520001995199019851980
Nickel Palmoil
Source: World Bank
Source: World Bank
Source: World Bank
Source: World Bank
Petroleum Rice
Constant 2000
Current
Constant 2000
Current
Source: World Bank
Source: World Bank
Source: World Bank
Source: World Bank
Constant 2000
Current
Constant 2000
Current
Forecast Forecast
Forecast Forecast
0
15000
30000
45000
60000Monthly Prices ($/metric ton)
Jan-10Jan-08Jan-06Jan-04Jan-02Jan-00
0
10000
20000
30000
40000 Constant 2000Current
202020152010200520001995199019851980
200
500
800
1100
1400COCOA ICCO ($/kg)
Jan-10Jan-08Jan-06Jan-04Jan-02Jan-00
200
400
600
800
1000Constant 2000Current
202020152010200520001995199019851980
0
35
70
105
140Monthly Prices($/metric ton)
Jan-10Jan-08Jan-06Jan-04Jan-02Jan-00
0
30
60
90
120 Constant 2000Current
202020152010200520001995199019851980
150
350
550
750
950Monthly Prices ($/ton)
Jan-10Jan-08Jan-06Jan-04Jan-02Jan-00
100
200
300
400
500
600
700Constant 2000Current
202020152010200520001995199019851980
Nickel Palmoil
Source: World Bank
Source: World Bank
Source: World Bank
Source: World Bank
Petroleum Rice
Constant 2000
Current
Constant 2000
Current
Source: World Bank
Source: World Bank
Source: World Bank
Source: World Bank
Constant 2000
Current
Constant 2000
Current
Forecast Forecast
Forecast Forecast
18
Global Commodity Markets World Bank
Annual Prices ($/ton)Monthly Prices ($/ton)
GLOBAL MARKET DATA
2006/07 2007/08 2008/09 2009/10 2006/07 2007/08 2008/09 2009/10PRODUCTION (000 metric tons) EXPORTS (000 metric tons)
Indonesia 16,730 18,880 20,450 22,090 Indonesia 12,465 14,100 16,110 16,840Malaysia 15,294 17,567 17,259 18,200 Malaysia 13,768 15,041 15,990 16,180Thailand 989 1,273 1,310 1,420 PNG 406 385 451 422Nigeria 752 812 853 880 Ecuador 180 178 173 189Colombia 830 779 758 773 Thailand 327 399 123 160Ecuador 409 417 431 466 World 29,638 32,850 35,480 36,350World 37,591 42,666 44,262 47,154 IMPORTS (000 metric tons)
CONSUMPTION (000 metric tons) China 5,543 5,559 6,297 6,200India 3,698 4,882 6,565 6,800 India 3,664 5,019 6,875 6,550China 5,461 5,660 5,917 6,348 EU-27 4,634 5,012 5,790 6,150EU-27 4,478 4,806 5,592 6,000 Pakistan 1,743 1,769 1,800 1,840Indonesia 3,920 4,362 4,846 5,230 US 692 955 1,036 985Malaysia 2,132 2,449 2,474 2,540 Bangladesh 871 855 832 850Pakistan 1,638 1,734 1,792 1,800 Egypt 716 508 770 660Nigeria 1,042 1,219 1,265 1,301 Iran, Islamic Rep. 419 589 571 610Thailand 700 941 1,161 1,280 Japan 516 551 531 550US 635 935 917 936 World 29,366 32,730 35,773 36,280Colombia 467 457 580 748 STOCKS (000 metric tons)Egypt 598 486 550 569 Indonesia 1,780 2,230 1,760 1,820Japan 509 550 536 545 Malaysia 1,461 1,951 1,579 1,750Russian Fed. 527 690 485 520 India 350 540 920 740Turkey 401 443 388 440 China 472 370 750 600World 37,256 41,325 44,700 47,260 World 5,812 7,060 6,876 6,700Source: Oil World, Hamburg, Germany and US Department of Agriculture
Palm oil prices averaged $683/ton in 2009, 28 percent lower than their $1,170/ton average of 2008. Prices of almost all edible oils rose dramatically during the first half of 2008, to levels not seen since 1973. However, they declined sharply during the second half of 2008 to levels more in line with fundamentals. Though strong import demand—especially by China and India—and increased use of competing oils for biofuel use played key roles during the rally, the sharp downward correc-tion during the first half of 2008 suggests the rally had an element of overshooting. During 2009:Q4 prices picked up again in response to strong import demand, weak supplies of substitute oils (especially soybean oil), and rising crude oil prices. Global production of soybean oil is estimated at 37.6 million tons during 2009/10, up from 36.0 million tons in 2008/09 but very similar to the 2007/08 level.
Oil World expects global palm oil output to reach 47.2 million tons during the 2009/10 (Oct to Sep) sea-son, 6.5 percent higher than the year before. Palm oil import demand is expected to rise by about 2 percent during 2009/10 (far less than last season’s 9 percent in-crease) because the two key importers, China and India, will experience limited consumption growth. The pro-jected stock-to-use ratio during 2009/10, at 14 percent, is about 2 percentage points below historical levels.
Given the projected recovery of soybean produc-tion from last year’s weather-induced shortfall, and restraint in biofuel mandates in several countries, in-cluding in the EU (the world’s largest biodiesel pro-ducer), palm oil prices are expected to average $660/ton in 2010 and to be marginally higher in 2011. In real terms, however, the 2010-12 average is expected to be two thirds higher than in the early 2000s.
Palm Oil

0
15000
30000
45000
60000Monthly Prices ($/metric ton)
Jan-10Jan-08Jan-06Jan-04Jan-02Jan-00
0
10000
20000
30000
40000 Constant 2000Current
202020152010200520001995199019851980
200
500
800
1100
1400COCOA ICCO ($/kg)
Jan-10Jan-08Jan-06Jan-04Jan-02Jan-00
200
400
600
800
1000Constant 2000Current
202020152010200520001995199019851980
0
35
70
105
140Monthly Prices($/metric ton)
Jan-10Jan-08Jan-06Jan-04Jan-02Jan-00
0
30
60
90
120 Constant 2000Current
202020152010200520001995199019851980
150
350
550
750
950Monthly Prices ($/ton)
Jan-10Jan-08Jan-06Jan-04Jan-02Jan-00
100
200
300
400
500
600
700Constant 2000Current
202020152010200520001995199019851980
Nickel Palmoil
Source: World Bank
Source: World Bank
Source: World Bank
Source: World Bank
Petroleum Rice
Constant 2000
Current
Constant 2000
Current
Source: World Bank
Source: World Bank
Source: World Bank
Source: World Bank
Constant 2000
Current
Constant 2000
Current
Forecast Forecast
Forecast Forecast
0
15000
30000
45000
60000Monthly Prices ($/metric ton)
Jan-10Jan-08Jan-06Jan-04Jan-02Jan-00
0
10000
20000
30000
40000 Constant 2000Current
202020152010200520001995199019851980
200
500
800
1100
1400COCOA ICCO ($/kg)
Jan-10Jan-08Jan-06Jan-04Jan-02Jan-00
200
400
600
800
1000Constant 2000Current
202020152010200520001995199019851980
0
35
70
105
140Monthly Prices($/metric ton)
Jan-10Jan-08Jan-06Jan-04Jan-02Jan-00
0
30
60
90
120 Constant 2000Current
202020152010200520001995199019851980
150
350
550
750
950Monthly Prices ($/ton)
Jan-10Jan-08Jan-06Jan-04Jan-02Jan-00
100
200
300
400
500
600
700Constant 2000Current
202020152010200520001995199019851980
Nickel Palmoil
Source: World Bank
Source: World Bank
Source: World Bank
Source: World Bank
Petroleum Rice
Constant 2000
Current
Constant 2000
Current
Source: World Bank
Source: World Bank
Source: World Bank
Source: World Bank
Constant 2000
Current
Constant 2000
Current
Forecast Forecast
Forecast Forecast
19
Global Commodity Markets World Bank
Annual Prices ($/barrel)Monthly Prices ($/barrel)
GLOBAL MARKET DATA
2006 2007 2008 2009 2006 2007 2008 2009PRODUCTION (000 b/d) CONSUMPTION (000 b/d)
Russian Fed. 9,843 10,078 10,005 10,197 US 20,687 20,680 19,419 18,642Saudi Arabia 10,476 9,988 10,406 9,322 China 7,382 7,742 7,999 8,576US 7,375 7,482 7,523 8,064 Japan 5,213 5,039 4,845 4,409Iran, Islamic Rep. 4,302 4,403 4,344 4,337 India 2,580 2,748 2,882 3,038China 3,674 3,729 3,793 3,821 Russian Fed. 2,709 2,706 2,797 2,604Canada 3,192 3,315 3,224 3,103 Germany 2,624 2,393 2,505 2,397Mexico 3,682 3,477 3,164 2,968 Brazil 2,102 2,274 2,397 2,436UAE 3,147 3,055 3,113 2,822 Canada 2,246 2,323 2,295 2,212Brazil 2,114 2,221 2,371 2,499 Korea, Rep. 2,317 2,389 2,291 2,333Iraq 1,922 2,113 2,409 2,477 Saudi Arabia 1,841 2,054 2,224 2,398Norway 2,778 2,556 2,461 2,383 Mexico 1,970 2,027 2,039 1,982Venezuela 2,835 2,614 2,582 2,374 France 1,956 1,921 1,930 1,841Kuwait 2,335 2,293 2,476 2,196 Iran, Islamic Rep. 1,693 1,693 1,730 1,628Nigeria 2,408 2,294 2,106 2,097 UK 1,785 1,714 1,704 1,639Algeria 2,021 2,030 2,058 1,938 Italy 1,813 1,759 1,691 1,603Angola 1,410 1,708 1,893 1,817 Spain 1,602 1,617 1,574 n/aLibya 1,838 1,853 1,866 1,687 Indonesia 1,173 1,201 1,217 n/aKazakhstan 1,361 1,418 1,442 1,574 Taiwan, China 1,097 1,123 1,074 n/aQatar 1,294 1,322 1,457 1,489 Netherlands 1,043 962 982 n/aUK 1,662 1,663 1,564 1,457 Singapore 853 916 958 n/aWorld 85,532 85,607 86,470 84,878 World 83,797 84,878 84,455 83,117 OPEC 35,105 34,736 35,787 33,566 OECD 49,274 48,830 47,303 45,221 Non-OPEC 50,428 50,871 50,683 51,312 Non-OECD 34,523 36,048 37,153 37,896Source: International Energy Agency (production), and BP Statistical Review of World Energy (consumption), World Bank (est 2009 consumption).
Crude oil prices averaged $61.8/bbl in 2009, down 36.4 percent from 2008. Prices reached a low of $42/bbl in February 2009, but recovered to near $75/bbl in December. They were influenced by OPEC’s removal of 4 mb/d from the market in an effort to keep prices up, but by the second half of 2009 compliance with the agreed 4.2 mb/d production cuts had fallen to 60 percent. US crude oil stocks fell in the second half of 2009 on lower imports, but a large overhang of distil-late remains. Some 145 million barrels of oil are stored at sea, including 45 million barrels of crude and the remainder mainly distillate.
Real prices of crude oil are projected to average $75/bbl (in 2009 dollars) over the forecast period, with nominal prices rising from $62/bbl in 2009 to $80/bbl in 2020. The forecast reflects the level of prices required to develop high-cost oil sands in Canada, and assumes continued production restraint by major oil producers.
World oil demand fell slightly in 2008—the first decline in 25 years—and by 1.3 mb/d in 2009, with OECD demand down by 2 mb/d or more than 4 per-cent. Demand grew very strongly in China following a slump in 2009:Q1, and modestly in all other non-OECD regions except for the FSU, where it fell sharply. De-mand is projected to rise by 1.4 mb/d in 2010, with all of the net growth outside OECD countries. Future oil demand growth is expected to be moderate, tempered by environmental concerns and efficiency gains.
Non-OPEC supplies are expected to edge higher in the medium term, as high prices support the develop-ment of higher-cost deepwater and non-conventional resources. Much of the growth is expected to continue to come from Brazil, Canada, the Caspian, Russia, and West Africa. OPEC producers are all expected to add new capacity, despite a current surplus of 6.5 mb/d, with much of the incremental output destined for Asia.
Petroleum

0
15000
30000
45000
60000Monthly Prices ($/metric ton)
Jan-10Jan-08Jan-06Jan-04Jan-02Jan-00
0
10000
20000
30000
40000 Constant 2000Current
202020152010200520001995199019851980
200
500
800
1100
1400COCOA ICCO ($/kg)
Jan-10Jan-08Jan-06Jan-04Jan-02Jan-00
200
400
600
800
1000Constant 2000Current
202020152010200520001995199019851980
0
35
70
105
140Monthly Prices($/metric ton)
Jan-10Jan-08Jan-06Jan-04Jan-02Jan-00
0
30
60
90
120 Constant 2000Current
202020152010200520001995199019851980
150
350
550
750
950Monthly Prices ($/ton)
Jan-10Jan-08Jan-06Jan-04Jan-02Jan-00
100
200
300
400
500
600
700Constant 2000Current
202020152010200520001995199019851980
Nickel Palmoil
Source: World Bank
Source: World Bank
Source: World Bank
Source: World Bank
Petroleum Rice
Constant 2000
Current
Constant 2000
Current
Source: World Bank
Source: World Bank
Source: World Bank
Source: World Bank
Constant 2000
Current
Constant 2000
Current
Forecast Forecast
Forecast Forecast
0
15000
30000
45000
60000Monthly Prices ($/metric ton)
Jan-10Jan-08Jan-06Jan-04Jan-02Jan-00
0
10000
20000
30000
40000 Constant 2000Current
202020152010200520001995199019851980
200
500
800
1100
1400COCOA ICCO ($/kg)
Jan-10Jan-08Jan-06Jan-04Jan-02Jan-00
200
400
600
800
1000Constant 2000Current
202020152010200520001995199019851980
0
35
70
105
140Monthly Prices($/metric ton)
Jan-10Jan-08Jan-06Jan-04Jan-02Jan-00
0
30
60
90
120 Constant 2000Current
202020152010200520001995199019851980
150
350
550
750
950Monthly Prices ($/ton)
Jan-10Jan-08Jan-06Jan-04Jan-02Jan-00
100
200
300
400
500
600
700Constant 2000Current
202020152010200520001995199019851980
Nickel Palmoil
Source: World Bank
Source: World Bank
Source: World Bank
Source: World Bank
Petroleum Rice
Constant 2000
Current
Constant 2000
Current
Source: World Bank
Source: World Bank
Source: World Bank
Source: World Bank
Constant 2000
Current
Constant 2000
Current
Forecast Forecast
Forecast Forecast
20
Global Commodity Markets World Bank
Annual Prices ($/ton)Monthly Prices ($/ton)
GLOBAL MARKET DATA
2006/07 2007/08 2008/09 2009/10 2006/07 2007/08 2008/09 2009/10PRODUCTION (000 metric tons) EXPORTS (000 metric tons)
China 127,200 130,224 135,100 134,400 Thailand 9,557 10,011 9,000 8,500India 93,350 96,690 98,900 99,500 Vietnam 4,522 4,649 5,200 5,000Indonesia 35,300 37,000 37,300 37,600 India 5,740 4,654 2,500 4,000Bangladesh 29,000 28,800 31,000 31,000 Pakistan 2,839 3,000 4,000 3,300Vietnam 22,922 24,375 23,693 23,760 US 2,923 3,370 2,974 3,102Thailand 18,250 19,300 19,400 20,000 China 1,340 969 1,300 1,300Myanmar 10,600 10,730 10,150 10,730 Egypt 1,203 750 300 900Philippines 9,775 10,479 10,593 10,710 World 31,459 31,120 28,672 29,694Brazil 7,695 8,199 8,500 8,500 IMPORTS (000 metric tons)Japan 7,786 7,930 8,029 7,710 Philippines 1,800 2,700 2,000 1,750US 6,267 6,344 6,515 7,163 Iran, Islamic Rep. 1,500 1,500 1,700 1,700Pakistan 5,450 5,700 6,300 6,200 Nigeria 1,500 1,800 1,400 1,600World 420,668 433,817 443,650 448,143 Saudi Arabia 958 961 1,360 1,370
STOCKS (000 metric tons) EU-27 1,338 1,566 1,050 1,300China 35,915 38,015 42,845 44,445 Iraq 613 975 1,000 1,000India 11,430 13,000 17,000 19,500 Malaysia 886 799 1,020 830Indonesia 4,607 5,607 6,307 6,807 Côte d'Ivoire 920 845 800 800Thailand 2,510 2,207 3,115 4,223 South Africa 795 1,025 580 750Philippines 4,868 4,548 3,991 3,002 Japan 675 597 700 700Japan 2,406 2,556 2,715 2,725 Senegal 675 820 740 700Vietnam 1,392 2,018 1,761 1,771 Mexico 594 583 630 675US 1,266 942 741 1,253 US 653 759 572 667World 75,103 80,637 89,798 94,729 World 28,173 29,311 26,256 26,272Source: US Department of Agriculture
Rice prices averaged $555/ton during 2009—16 per-cent lower than the 2008 average ($650/ton) though more than three times higher than in 2000/01. The global rice market is very thin, with only 7 percent of global production traded internationally, and a key factor behind the price spike of 2008 was the policy measures with which key rice suppliers and importers sought to promote food security.
As of November 2009, the US Department of Agri-culture projected global rice production for 2009/10 at 433.9 million tons, reflecting weather-related production shortfalls in India and the Philippines. Plans announced by the Philippines, following the harvest shortfall, to buy an estimated 1.6 million tons of Thai rice, triggered discussions of a repeat of the April/May 2008 rally when rice prices exceeded $900/ton. However, the market responded with only moderate price increases—from $543/ton in November and $591/ton in December.
Because of export restrictions motivated by food security concerns, global rice exports declined 9 per-cent in 2008/09. Because of improved supply condi-tions and relatively stable prices, most countries have either eliminated or moderated such trade interven-tions. But the rice export restrictions are likely to have a lasting impact because they have shaken confidence in the world market, encouraging countries to build larger inventories than usual for national food security reasons.
Despite the weather-related production shortfall this season, the global rice market appears well sup-plied. End-of-season stocks of the past and the current season averaged 90.5 million tons, 17 percent higher than in 2003-07. Thus rice prices are projected to fall to $460/ton during 2010 and a little higher during 2011. Even so, at that level real prices will average 70 per-cent higher in 2010-12 than in 2000-07.
Rice

0
1
2
3
4Monthly Prices($/metric ton)
Jan-10Jan-08Jan-06Jan-04Jan-02Jan-00
0.5
1.0
1.5
2.0
2.5
3.0 Constant 2000Current
202020152010200520001995199019851980
150
275
400
525
650Monthly Prices ($/ton)
Jan-10Jan-08Jan-06Jan-04Jan-02Jan-00
100
225
350
475
600Constant 2000Current
202020152010200520001995199019851980
0
25
50
75
100 Constant 2000Current
202020152010200520001995199019851980
0
15
30
45
60Monthly Prices($/metric ton)
Jan-10Jan-08Jan-06Jan-04Jan-02Jan-00
100
175
250
325
400Constant 2000Current
202020152010200520001995199019851980
125
175
225
275
325COCOA ICCO ($/kg)
Jan-10Jan-08Jan-06Jan-04Jan-02Jan-00
Rubber Soybeans
Source: World Bank
Source: World Bank
Source: World Bank
Source: World Bank
Sugar Tea
Constant 2000
Current
Constant 2000
Current
Source: World Bank
Source: World Bank
Source: World Bank
Source: World Bank
Constant 2000
Current
Constant 2000
Current
ForecastForecast
Forecast Forecast
0
1
2
3
4Monthly Prices($/metric ton)
Jan-10Jan-08Jan-06Jan-04Jan-02Jan-00
0.5
1.0
1.5
2.0
2.5
3.0 Constant 2000Current
202020152010200520001995199019851980
150
275
400
525
650Monthly Prices ($/ton)
Jan-10Jan-08Jan-06Jan-04Jan-02Jan-00
100
225
350
475
600Constant 2000Current
202020152010200520001995199019851980
0
25
50
75
100 Constant 2000Current
202020152010200520001995199019851980
0
15
30
45
60Monthly Prices($/metric ton)
Jan-10Jan-08Jan-06Jan-04Jan-02Jan-00
100
175
250
325
400Constant 2000Current
202020152010200520001995199019851980
125
175
225
275
325COCOA ICCO ($/kg)
Jan-10Jan-08Jan-06Jan-04Jan-02Jan-00
Rubber Soybeans
Source: World Bank
Source: World Bank
Source: World Bank
Source: World Bank
Sugar Tea
Constant 2000
Current
Constant 2000
Current
Source: World Bank
Source: World Bank
Source: World Bank
Source: World Bank
Constant 2000
Current
Constant 2000
Current
ForecastForecast
Forecast Forecast
21
Global Commodity Markets World Bank
Annual Prices ($/kg)Monthly Prices ($/kg)
GLOBAL MARKET DATANATURAL RUBBER SyNTHETIC RUBBER
2005 2006 2007 2008 2005 2006 2007 2008PRODUCTION (000 metric tons) PRODUCTION (000 metric tons)
Thailand 2,937 3,137 3,056 3,090 China 1,632 1,813 2,215 2,325Indonesia 2,271 2,637 2,755 2,751 US 2,366 2,606 2,697 2,314Malaysia 1,126 1,284 1,200 1,072 Japan 1,627 1,607 1,655 1,651India 772 853 811 881 Russian Fed. 1,146 1,219 1,210 1,139Vietnam 469 554 602 663 Korea, Rep. 770 848 1,010 970China 510 533 590 560 Germany 855 865 803 742Côte d'Ivoire 165 178 183 195 France 655 664 655 645World 8,904 9,791 9,796 10,026 World 12,136 12,690 13,430 12,789
CONSUMPTION (000 metric tons) CONSUMPTION (000 metric tons)China 2,266 2,780 2,892 2,934 China 2,467 3,064 587 3,479US 1,159 1,003 1,018 1,041 US 2,002 2,001 1,929 1,734India 789 815 851 881 Japan 1,156 1,171 1,162 1,138Japan 857 874 887 878 Germany 635 635 599 530Malaysia 387 383 450 469 Brazil 405 425 477 533Thailand 335 321 374 398 Russian Fed. 568 572 597 500World 9,069 9,329 9,884 9,550 World 11,880 12,692 13,278 12,568
EXPORTS (000 metric tons) GROSS EXPORTS (000 metric tons)Thailand 2,633 2,772 2,704 2,561 US 1,105 1,250 1,316 1,157Indonesia 2,025 2,287 2,407 2,408 Korea Rep. 556 620 797 782Malaysia 1,128 1,131 1,018 916 Germany 747 749 775 726Vietnam 538 678 682 619 Russian Fed. 637 708 673 699World 6,502 6,830 7,229 7,016 World 7,243 7,609 7,626 7,239Source: International Rubber Study Group
Natural rubber prices averaged $1.92/kg during 2009, 26 percent lower than in 2008 but almost three times higher than in the early 2000s. Prices declined initially in 2009, but rebounded toward the end of that year, reflecting the effects of fluctuating crude oil prices on the cost of producing synthetic rubber. Natural rubber consumption totaled 9.6 million tons in 2008, down from 9.9 million tons the year before. Estimates for the first nine months of 2009 indicate an unprecedented 9.3 percent reduction in demand. A key reason was the collapse in demand for tire production, associated with the collapse of automobile sales, especially in high-income countries. Global consumption of natu-ral rubber is dominated by China, which accounts for more than 30 percent. More than two thirds of natural rubber production comes from the traditional suppli-ers Thailand, Indonesia, and Malaysia, but Vietnam is emerging as an important player.
World consumption of synthetic rubber declined by 11.5 percent in the first nine months of 2009, largely reflecting the reduction in global demand. Production of synthetic rubber totaled 12.8 million tons in 2008, down 5 percent from 2007, while estimates for the first nine months of 2009 show a further 10.5 percent de-cline.
Prices of natural rubber are expected to average $1.60/kg in 2010 and to increase to $1.70/kg in 2011 as demand picks up. This is in line with the projected crude oil price of $75/barrel in 2010 and $76/barrel in 2011 as well as a reversal of the economic downturn in 2010. If crude oil prices rise more than projected or the economic recovery is quicker than now anticipated, natural rubber prices may rise more sharply. Because the majority of rubber output goes for tire manufac-turing, rubber prices are closely linked to global eco-nomic conditions.
Rubber

0
1
2
3
4Monthly Prices($/metric ton)
Jan-10Jan-08Jan-06Jan-04Jan-02Jan-00
0.5
1.0
1.5
2.0
2.5
3.0 Constant 2000Current
202020152010200520001995199019851980
150
275
400
525
650Monthly Prices ($/ton)
Jan-10Jan-08Jan-06Jan-04Jan-02Jan-00
100
225
350
475
600Constant 2000Current
202020152010200520001995199019851980
0
25
50
75
100 Constant 2000Current
202020152010200520001995199019851980
0
15
30
45
60Monthly Prices($/metric ton)
Jan-10Jan-08Jan-06Jan-04Jan-02Jan-00
100
175
250
325
400Constant 2000Current
202020152010200520001995199019851980
125
175
225
275
325COCOA ICCO ($/kg)
Jan-10Jan-08Jan-06Jan-04Jan-02Jan-00
Rubber Soybeans
Source: World Bank
Source: World Bank
Source: World Bank
Source: World Bank
Sugar Tea
Constant 2000
Current
Constant 2000
Current
Source: World Bank
Source: World Bank
Source: World Bank
Source: World Bank
Constant 2000
Current
Constant 2000
Current
ForecastForecast
Forecast Forecast
0
1
2
3
4Monthly Prices($/metric ton)
Jan-10Jan-08Jan-06Jan-04Jan-02Jan-00
0.5
1.0
1.5
2.0
2.5
3.0 Constant 2000Current
202020152010200520001995199019851980
150
275
400
525
650Monthly Prices ($/ton)
Jan-10Jan-08Jan-06Jan-04Jan-02Jan-00
100
225
350
475
600Constant 2000Current
202020152010200520001995199019851980
0
25
50
75
100 Constant 2000Current
202020152010200520001995199019851980
0
15
30
45
60Monthly Prices($/metric ton)
Jan-10Jan-08Jan-06Jan-04Jan-02Jan-00
100
175
250
325
400Constant 2000Current
202020152010200520001995199019851980
125
175
225
275
325COCOA ICCO ($/kg)
Jan-10Jan-08Jan-06Jan-04Jan-02Jan-00
Rubber Soybeans
Source: World Bank
Source: World Bank
Source: World Bank
Source: World Bank
Sugar Tea
Constant 2000
Current
Constant 2000
Current
Source: World Bank
Source: World Bank
Source: World Bank
Source: World Bank
Constant 2000
Current
Constant 2000
Current
ForecastForecast
Forecast Forecast
22
Global Commodity Markets World Bank
Monthly Prices ($/metric ton) Annual Prices ($/metric ton)
GLOBAL MARKET DATA
2006/07 2007/08 2008/09 2009/10 2006/07 2007/08 2008/09 2009/10PRODUCTION (000 metric tons) EXPORTS (000 metric tons)
US 87,001 72,859 80,749 90,336 US 30,386 31,538 34,925 36,469Brazil 59,000 61,000 57,000 63,000 Brazil 23,485 25,364 29,986 23,750Argentina 48,800 46,200 32,000 53,000 Argentina 9,559 13,837 5,746 10,150China 15,967 14,000 15,500 14,500 Paraguay 4,361 5,400 2,400 4,900India 7,690 9,470 9,100 8,800 Canada 1,683 1,753 2,017 2,000Paraguay 5,856 6,900 3,900 6,700 World 71,310 79,519 76,891 79,609Canada 3,466 2,696 3,336 3,500 IMPORTS (000 metric tons)World 237,117 221,129 210,870 250,254 China 28,726 37,816 41,098 41,000
CRUSHINGS (000 metric tons) EU-27 15,291 15,123 13,000 12,700US 49,198 49,081 45,232 46,130 Japan 4,094 4,014 3,396 3,950China 35,970 39,518 41,035 44,480 Mexico 3,844 3,614 3,100 3,535Argentina 33,586 34,607 31,911 35,000 Taiwan 2,436 2,149 2,120 2,250Brazil 31,109 32,114 31,400 31,840 Thailand 1,532 1,753 1,510 1,705EU-27 14,670 14,870 12,830 12,300 Indonesia 1,309 1,147 1,200 1,600India 6,615 8,170 7,500 7,900 Turkey 1,268 1,277 1,030 1,280Mexico 3,900 3,675 3,215 3,615 World 69,062 78,162 75,966 77,790Japan 2,925 2,890 2,496 2,750 STOCKS (000 metric tons)Taiwan 2,161 1,965 1,850 1,970 Argentina 22,606 21,760 16,028 22,550Russia 805 1,051 1,497 1,810 Brazil 18,190 18,902 11,666 16,276Bolivia 1,670 1,160 1,400 1,700 China 2,700 4,245 9,008 8,998Paraguay 1,355 1,400 1,500 1,550 US 15,617 5,580 3,761 6,946World 195,659 201,929 192,634 202,951 World 62,885 52,908 42,407 57,093Source: US Department of Agriculture
Soybean prices in 2009 averaged $437/ton, 16 percent down from 2008. The 2008 price peak was a response to strong demand for competing crops that are used as biofuel feedstock (mainly maize for ethanol in the US and rapeseed for biodiesel in the EU) and a poor soybean crop in South America’s key suppliers. The global soybean balance has now improved consider-ably. According to the US Department of Agriculture (November 2009), production in 2009/10 is projected to exceed 250 million tons, almost 20 percent higher than last season. Production increases are projected for all three key suppliers: the US (up 12 percent), Brazil (up 11 percent), and Argentina (up 66 percent). The better supply prospects will not only satisfy rising import demand but also raise stocks by an impressive 35 percent, restoring the stock-to-use ratio to historical levels.
Part of the soybean price increase was fueled by the use of competing vegetable oils in biodiesel pro-duction, which accounts for an estimated 9 percent of global vegetable oil use. Yet biodiesel production from vegetable oils has proven to be unprofitable even with oil prices at the $75 level. As a result, the share of vegetable oil used for biofuel production stagnated in 2009 and future growth prospects for biodiesel pro-duction are limited. Consequently, soybean prices are expected to average $410/ton in 2010, followed by a further decline in 2010 to $385/ton. These forecasts are subject to both downside and upside risks, linked to the possibility that biodiesel mandates in various coun-tries may be eased (which would reduce the demand for competing edible oils) and to the possibility of fur-ther increases in energy prices (making the biodiesel industry profitable).
Soybeans

0
1
2
3
4Monthly Prices($/metric ton)
Jan-10Jan-08Jan-06Jan-04Jan-02Jan-00
0.5
1.0
1.5
2.0
2.5
3.0 Constant 2000Current
202020152010200520001995199019851980
150
275
400
525
650Monthly Prices ($/ton)
Jan-10Jan-08Jan-06Jan-04Jan-02Jan-00
100
225
350
475
600Constant 2000Current
202020152010200520001995199019851980
0
25
50
75
100 Constant 2000Current
202020152010200520001995199019851980
0
15
30
45
60Monthly Prices($/metric ton)
Jan-10Jan-08Jan-06Jan-04Jan-02Jan-00
100
175
250
325
400Constant 2000Current
202020152010200520001995199019851980
125
175
225
275
325COCOA ICCO ($/kg)
Jan-10Jan-08Jan-06Jan-04Jan-02Jan-00
Rubber Soybeans
Source: World Bank
Source: World Bank
Source: World Bank
Source: World Bank
Sugar Tea
Constant 2000
Current
Constant 2000
Current
Source: World Bank
Source: World Bank
Source: World Bank
Source: World Bank
Constant 2000
Current
Constant 2000
Current
ForecastForecast
Forecast Forecast
0
1
2
3
4Monthly Prices($/metric ton)
Jan-10Jan-08Jan-06Jan-04Jan-02Jan-00
0.5
1.0
1.5
2.0
2.5
3.0 Constant 2000Current
202020152010200520001995199019851980
150
275
400
525
650Monthly Prices ($/ton)
Jan-10Jan-08Jan-06Jan-04Jan-02Jan-00
100
225
350
475
600Constant 2000Current
202020152010200520001995199019851980
0
25
50
75
100 Constant 2000Current
202020152010200520001995199019851980
0
15
30
45
60Monthly Prices($/metric ton)
Jan-10Jan-08Jan-06Jan-04Jan-02Jan-00
100
175
250
325
400Constant 2000Current
202020152010200520001995199019851980
125
175
225
275
325COCOA ICCO ($/kg)
Jan-10Jan-08Jan-06Jan-04Jan-02Jan-00
Rubber Soybeans
Source: World Bank
Source: World Bank
Source: World Bank
Source: World Bank
Sugar Tea
Constant 2000
Current
Constant 2000
Current
Source: World Bank
Source: World Bank
Source: World Bank
Source: World Bank
Constant 2000
Current
Constant 2000
Current
ForecastForecast
Forecast Forecast
23
Global Commodity Markets World Bank
Annual Prices (cents/kg)Monthly Prices (cents/kg)
GLOBAL MARKET DATA
2006/07 2007/08 2008/09 2009/10 2006/07 2007/08 2008/09 2009/10PRODUCTION (000 metric tons) EXPORTS (000 metric tons)
Brazil 31,450 31,600 31,850 35,750 Brazil 20,850 19,500 21,550 23,850India 30,780 28,630 16,130 17,300 Thailand 4,705 4,914 5,500 5,800EU-27 17,757 15,614 13,570 15,485 Australia 3,860 3,700 3,522 3,700China 12,855 15,898 13,317 13,161 UAE 1,600 1,715 1,656 1,700Thailand 6,720 7,820 7,200 7,700 Guatemala 1,500 1,333 1,490 1,515US 7,662 7,396 6,789 6,998 EU-27 2,439 1,656 1,105 1,475Mexico 5,633 5,852 5,260 5,400 Colombia 942 661 630 1,035Australia 5,212 4,939 4,814 4,900 South Africa 1,267 1,154 1,000 900Pakistan 3,615 4,163 3,512 3,520 World 51,227 51,433 48,180 51,277Russian Fed. 3,150 3,200 3,480 3,350 IMPORTS (000 metric tons)Indonesia 1,900 1,900 2,680 2,960 India 0 0 2,800 6,000Colombia 2,354 2,245 2,050 2,575 EU-27 3,530 2,948 3,250 3,500South Africa 2,313 2,360 2,350 2,380 Russia Fed. 2,950 3,100 2,800 2,400Argentina 2,440 2,190 2,420 2,250 US 1,887 2,377 2,796 2,200World 164,467 163,297 143,781 153,527 Korea, Rep. 1,518 1,648 1,550 1,600
STOCKS (000 metric tons) UAE 1,774 1,900 1,580 1,550India 9,850 9,150 3,690 3,480 Malaysia 1,670 1,430 1,540 1,530EU-27 2,720 3,130 2,175 3,185 Indonesia 1,800 2,420 1,570 1,500Thailand 1,745 2,651 2,351 2,151 Canada 1,191 1,416 1,444 1,450China 1,401 3,965 3,464 2,047 Egypt 936 1,390 1,410 1,410Egypt 383 544 746 936 Japan 1,350 1,372 1,450 1,313US 1,632 1,506 1,317 922 Saudi Arabia 1,515 1,670 1,285 1,300World 35,769 39,776 27,570 26,002 World 43,975 44,384 46,568 49,921Source: US Department of Agriculture
Sugar prices averaged 40 cents/kg in 2009, almost 42 percent higher than in 2008, and they averaged more than 50 cents/kg during the last five months of 2009. Sugar is among the few commodities whose prices rose continually during 2009. The rally began when it became clear that global supplies in 2008/09 would be limited, due to a weather-induced production shortfall of 44 percent in India. India’s 2009/10 output is ex-pected to be equally disappointing. The shortfall has made India the world’s largest sugar importer (it im-ported 2.8 million tons in 2008/09 and is projected to import 6 million tons in 2009/10).
The US Department of Agriculture update of No-vember 2009 projects global sugar production at 153.5 million tons in 2009/10, as Brazil along with the EU-27 and a number of smaller producers respond to high prices. This is still below the estimated 160 million tons projected consumption.
Brazil has long been the world’s largest sugar sup-plier, currently accounting for almost half of global ex-ports although 60 percent of its sugarcane production is used as feedstock for ethanol. Most Brazilian sug-arcane processors have flexibility to switch between sugar and ethanol production. Higher crude oil prices encourage Brazilian ethanol production at the expense of sugar output, thus boosting sugar prices. In view of the current global sugar balance and crude oil pric-es, sugar prices are projected to average 35 cents/kg in 2010, down from 40 cents/kg in 2009, with some further declines in 2011 and 2012. These price levels are more than double those of the early 2000s. Sugar prices could decline further if global production recov-ers more strongly from recent weakness, especially in India. Conversely, if crude oil prices increase further Brazilian ethanol production will become more profit-able, putting upward pressure on sugar prices.
Sugar

0
1
2
3
4Monthly Prices($/metric ton)
Jan-10Jan-08Jan-06Jan-04Jan-02Jan-00
0.5
1.0
1.5
2.0
2.5
3.0 Constant 2000Current
202020152010200520001995199019851980
150
275
400
525
650Monthly Prices ($/ton)
Jan-10Jan-08Jan-06Jan-04Jan-02Jan-00
100
225
350
475
600Constant 2000Current
202020152010200520001995199019851980
0
25
50
75
100 Constant 2000Current
202020152010200520001995199019851980
0
15
30
45
60Monthly Prices($/metric ton)
Jan-10Jan-08Jan-06Jan-04Jan-02Jan-00
100
175
250
325
400Constant 2000Current
202020152010200520001995199019851980
125
175
225
275
325COCOA ICCO ($/kg)
Jan-10Jan-08Jan-06Jan-04Jan-02Jan-00
Rubber Soybeans
Source: World Bank
Source: World Bank
Source: World Bank
Source: World Bank
Sugar Tea
Constant 2000
Current
Constant 2000
Current
Source: World Bank
Source: World Bank
Source: World Bank
Source: World Bank
Constant 2000
Current
Constant 2000
Current
ForecastForecast
Forecast Forecast
0
1
2
3
4Monthly Prices($/metric ton)
Jan-10Jan-08Jan-06Jan-04Jan-02Jan-00
0.5
1.0
1.5
2.0
2.5
3.0 Constant 2000Current
202020152010200520001995199019851980
150
275
400
525
650Monthly Prices ($/ton)
Jan-10Jan-08Jan-06Jan-04Jan-02Jan-00
100
225
350
475
600Constant 2000Current
202020152010200520001995199019851980
0
25
50
75
100 Constant 2000Current
202020152010200520001995199019851980
0
15
30
45
60Monthly Prices($/metric ton)
Jan-10Jan-08Jan-06Jan-04Jan-02Jan-00
100
175
250
325
400Constant 2000Current
202020152010200520001995199019851980
125
175
225
275
325COCOA ICCO ($/kg)
Jan-10Jan-08Jan-06Jan-04Jan-02Jan-00
Rubber Soybeans
Source: World Bank
Source: World Bank
Source: World Bank
Source: World Bank
Sugar Tea
Constant 2000
Current
Constant 2000
Current
Source: World Bank
Source: World Bank
Source: World Bank
Source: World Bank
Constant 2000
Current
Constant 2000
Current
ForecastForecast
Forecast Forecast
24
Global Commodity Markets World Bank
Annual Prices (cents/kg)Monthly Prices (cents/kg)
GLOBAL MARKET DATA
2005 2006 2007 2008 2005 2006 2007 2008PRODUCTION (000 metric tons) GROSS EXPORTS (000 metric tons)
China 935 1,028 1,140 1,200 Kenya 348 312 344 383India 946 982 945 981 Sri Lanka 299 315 294 298Kenya 324 311 370 346 China 287 287 289 297Sri Lanka 317 311 305 319 India 195 216 176 193Vietnam 133 143 148 166 Vietnam 88 105 111 104Turkey 135 142 178 155 Indonesia 102 95 84 96Indonesia 156 147 137 138 Argentina 66 71 75 77Japan 100 100 92 93 Malawi 43 42 47 40Argentina 80 88 87 72 World 1,566 1,579 1,573 1,638Bangladesh 61 53 58 59 NET IMPORTS (000 metric tons) Uganda 38 37 45 43 Russian Fed. 173 166 174 175Malawi 38 45 48 42 UK 128 135 131 130Tanzania 30 31 35 32 US 100 108 109 117Myanmar 18 18 18 19 Pakistan 139 117 106 99Iran, Islam. Rep. 25 20 17 18 Egypt 74 79 69 94Taiwan, China 19 19 18 17 Dubai 62 69 72 79Rwanda 16 17 18 17 Other CIS 53 56 58 60Nepal 13 14 15 16 Iran, Islamic Rep. 43 50 55 58Zimbabwe 15 16 14 8 Morroco 50 51 53 48PNG 7 7 7 7 Japan 51 48 47 43Burundi 8 6 7 6 Iraq 58 67 32 36World 3,458 3,580 3,751 3,804 World 1,469 1,487 1,490 1,532Sources: International Tea Committee, F.O. Lichts and World Bank estimates
TeaTea prices (the three-auction average) were 272 cents/kg during 2009, 13 percent higher than in 2008 and well above their 172 cents/kg average of 2000-07. After a sharp fall during 2008:Q3, reflecting the credit crunch and the ensuing global economic downturn, tea prices climbed steeply to an all-time high of more than 300 cents/kg in nominal terms during 2009:Q4.
Preliminary data show that tea production was low-er in 2009 than in 2008, with production in the three principal black tea suppliers—Kenya, Sri Lanka, and India—declining by 11, 7, and 4 percent, respectively, or total fall of 95 thousand tons. The Kenyan crop was plagued by a two-year drought compounded by civil disturbance in early 2008; the Sri Lankan crop was re-duced by high costs of transport, energy products, in-sufficient application of fertilizer (due to high prices and drought), and labor strikes.
Compared to that of many other commodities, tea consumption has been less affected by the economic downturn, even though demand for some premium-grade teas has declined. In India, domestic demand has been boosted by consumers’ rising purchasing power, which in turn has driven exports down. Early estimates for 2009 export volumes show an 8 percent decline in Kenya and 3 percent declines in India and Sri Lanka. Despite the lower export volumes, global export rev-enues from tea increased in 2009 due to high prices.
Tea prices in 2010 are expected to average 230 cents/kg. The medium-term price forecast is 210 cents/kg, as supply is expected to respond to the recent high prices. Over the longer term, prices will be shaped by growing domestic demand from India, input costs, ris-ing demand for higher-grade teas and organic teas, as well as by concern of climate changes.

50
150
250
350
450Monthly Prices($/metric ton)
Jan-10Jan-08Jan-06Jan-04Jan-02Jan-00
50
150
250
350
450 Constant 2000Current
202020152010200520001995199019851980
0
1
2
3
4COCOA ICCO ($/kg)
Jan-10Jan-08Jan-06Jan-04Jan-02Jan-00
0
1
2
3
4Constant 2000Current
202020152010200520001995199019851980
0.75
1.00
1.25
1.50
1.75
2.00Monthly Prices($/metric ton)
Jan-10Jan-08Jan-06Jan-04Jan-02Jan-00
0.75
1.25
1.75
2.25
2.75 Constant 2000Current
202020152010200520001995199019851980
1200
1700
2200
2700
3200COCOA ICCO ($/kg)
Jan-10Jan-08Jan-06Jan-04Jan-02Jan-00
300
975
1650
2325
3000Constant 2000Current
202020152010200520001995199019851980
Wheat Cocoa
Source: World Bank
Source: World Bank
Source: World Bank
Source: World Bank
Cotton Aluminum
Constant 2000
Current
Constant 2000
Current
Source: World Bank
Source: World Bank
Source: World Bank
Source: World Bank
Constant 2000
Current
Constant 2000
Current
Forecast
Forecast
Forecast Forecast
50
150
250
350
450Monthly Prices($/metric ton)
Jan-10Jan-08Jan-06Jan-04Jan-02Jan-00
50
150
250
350
450 Constant 2000Current
202020152010200520001995199019851980
0
1
2
3
4COCOA ICCO ($/kg)
Jan-10Jan-08Jan-06Jan-04Jan-02Jan-00
0
1
2
3
4Constant 2000Current
202020152010200520001995199019851980
0.75
1.00
1.25
1.50
1.75
2.00Monthly Prices($/metric ton)
Jan-10Jan-08Jan-06Jan-04Jan-02Jan-00
0.75
1.25
1.75
2.25
2.75 Constant 2000Current
202020152010200520001995199019851980
1200
1700
2200
2700
3200COCOA ICCO ($/kg)
Jan-10Jan-08Jan-06Jan-04Jan-02Jan-00
300
975
1650
2325
3000Constant 2000Current
202020152010200520001995199019851980
Wheat Cocoa
Source: World Bank
Source: World Bank
Source: World Bank
Source: World Bank
Cotton Aluminum
Constant 2000
Current
Constant 2000
Current
Source: World Bank
Source: World Bank
Source: World Bank
Source: World Bank
Constant 2000
Current
Constant 2000
Current
Forecast
Forecast
Forecast Forecast
25
Annual Prices ($/metric ton)Monthly Prices ($/metric ton)
Global Commodity Markets World Bank
GLOBAL MARKET DATA
2006/07 2007/08 2008/09 2009/10 2006/07 2007/08 2008/09 2009/10PRODUCTION (000 metric tons) EXPORTS (000 metric tons)
EU-27 124,870 120,133 151,072 138,339 US 24,725 34,363 27,637 23,814China 108,466 109,298 112,464 114,500 EU-27 13,816 12,271 25,390 19,000India 69,350 75,810 78,600 80,580 Canada 19,434 16,116 18,812 18,500US 49,217 55,821 68,016 60,314 Russian Fed. 10,584 12,552 18,393 18,000Russian Fed. 44,900 49,400 63,700 59,500 Australia 8,728 7,487 14,800 15,000Canada 25,265 20,054 28,611 26,500 Ukraine 3,366 1,236 13,037 9,000Pakistan 21,277 23,300 21,500 24,000 Kazakhstan 8,089 8,181 5,701 7,500Australia 10,822 13,569 20,939 22,500 Argentina 10,709 11,193 6,000 2,500Ukraine 14,000 13,900 25,900 20,500 Turkey 2,377 1,722 2,238 2,300Turkey 17,500 15,500 16,800 17,800 Mexico 548 1,261 1,406 1,200Kazakhstan 13,450 16,450 12,550 17,000 World 111,636 117,202 142,288 124,673Iran, Islamic Rep. 14,500 15,000 10,000 12,000 IMPORTS (000 metric tons)Argentina 16,100 18,000 8,400 8,000 Egypt 7,300 7,700 9,900 8,300World 595,720 610,430 682,034 673,862 EU-27 5,137 6,942 7,740 7,000
STOCKS (000 metric tons) Brazil 8,048 6,711 6,000 6,500China 38,450 38,963 48,685 60,585 Indonesia 5,596 5,224 5,423 5,500US 12,414 8,323 17,867 24,485 Algeria 4,874 5,904 6,359 5,300India 4,500 5,800 13,540 18,050 Japan 5,747 5,701 5,156 5,300EU-27 14,075 12,343 18,265 17,604 Iran, Islamic Rep. 1,100 200 6,700 4,500Russian Fed. 2,231 1,819 8,429 9,429 Iraq 2,912 3,424 3,868 3,800Canada 6,865 4,406 6,556 7,656 Korea, Rep. 3,439 3,092 3,371 3,700Egypt 4,120 4,120 5,343 4,483 Nigeria 3,265 2,677 3,550 3,500World 127,531 121,006 163,753 190,909 World 114,585 113,391 136,359 120,359Source: US Department of Agriculture
Wheat prices averaged $224/ton in 2009, down 31 per-cent from 2008, and reached a low of $190/ton in Sep-tember 2009. The 2008 rally, partly fuelled by strong biofuel demand for competing crops, occurred despite a record wheat crop in 2008/09. The US Department of Agriculture (November-2009) expects global wheat production to decline somewhat in 2009/10; a likely shortfall in the EU will be offset by increases in several smaller producers.
Stocks are projected to increase for the second straight year, pushing the stock-to-use ratio to 0.30, well above its 2007/08 record low of 0.20 and in line with the long-term historical average. Almost two thirds of global stocks will be held by the world’s four key suppliers: China, the US, India, and the EU. The inventory build-up by some countries has been moti-vated by food security concerns.
Despite the marginal reduction in output projected for 2009/10, the rebuilding of stocks and the relative price weakness during the second half of 2009 sug-gests that the global wheat market is well supplied. International wheat trade is expected to decline by 12 percent in 2009/10, but exceeds the 2007/08 crop-year level by more than seven million tons (6 percent high-er). Barring any unfavorable weather event, prices are expected to average $225/ton in 2010, similar to their 2009 average, and only a moderate price increase is expected for 2011. Such a forecast is subject to upside risks if crude oil prices increase further (putting indi-rect pressure on wheat as prices of biofuel crops such as maize and rye rise in tandem with energy prices). In the longer term, real wheat prices are expected to remain well above the averages experienced during the early 2000s.
Wheat

26
Global Commodity Markets World Bank
Table A1: Commodity Price Data2007 2008 2009 2008 2009 2009 2009 2009 2009 2009 2009
Jan-Dec Jan-Dec Jan-Dec Oct-Dec Jan-Mar Apr-Jun Jul-Sep Oct-Dec Oct Nov DecEnergy
Coal, Australia a/ $/mt 65.73 127.10 71.75 92.97 71.93 66.48 71.31 77.29 71.07 78.80 82.00Crude oil, average a/ $/bbl 71.12 96.99 61.76 56.00 44.11 59.19 68.21 75.50 74.08 77.55 74.88Crude oil, Brent a/ $/bbl 72.70 97.64 61.86 55.89 44.98 59.13 68.37 74.97 73.19 77.04 74.67Crude oil, Dubai a/ $/bbl 68.37 93.78 61.75 53.67 44.56 58.93 68.07 75.46 73.28 77.63 75.49Crude oil, West Texas Int. a/ $/bbl 72.28 99.56 61.65 58.45 42.80 59.52 68.21 76.08 75.77 78.00 74.49Natural gas Index a/ 2000=100 186.5 267.9 153.4 266.2 198.2 142.9 123.3 149.3 142.8 141.4 163.8Natural gas, Europe a/ $/mmbtu 8.56 13.41 8.71 15.75 11.94 8.18 6.91 7.81 7.60 7.81 8.01Natural gas, US a/ $/mmbtu 6.98 8.86 3.95 6.40 4.57 3.70 3.17 4.36 4.02 3.70 5.35Natural gas LNG, Japan a/ $/mmbtu 7.68 12.53 8.93 14.62 10.90 7.60 7.91 9.30 9.10 9.30 9.50
Non EnergyAgricultureBeveragesCocoa b/ ¢/kg 195.2 257.7 288.9 224.1 259.4 257.9 296.4 342.0 336.0 338.5 351.4Coffee, Arabica b/ ¢/kg 272.4 308.2 317.1 267.8 283.9 320.2 322.7 341.7 340.8 335.6 348.7Coffee, robusta b/ ¢/kg 190.9 232.1 164.4 192.6 175.8 165.3 160.1 156.4 162.1 153.2 154.1Tea, auctions (3) average b/ ¢/kg 203.6 242.0 272.5 206.6 218.0 266.1 303.6 302.5 302.7 305.6 299.1Tea, Colombo auctions b/ ¢/kg 252.2 278.9 313.7 208.8 261.7 299.1 356.1 338.0 352.4 335.0 326.7Tea, Kolkata auctions b/ ¢/kg 192.1 225.5 252.0 220.2 177.4 271.3 273.0 286.2 294.4 291.2 273.0Tea, Mombasa auctions b/ ¢/kg 166.5 221.8 252.0 190.8 214.9 228.0 281.7 283.2 261.3 290.6 297.7
FoodFats and OilsCoconut oil b/ $/mt 919 1,224 725 772 677 779 711 734 706 729 767Copra $/mt 607 816 480 520 447 513 469 491 470 493 509Groundnut oil b/ $/mt 1,352 2,131 1,183 1,773 1,283 1,166 1,133 1,150 1,148 1,116 1,187Palm oil b/ $/mt 780 949 683 512 577 743 679 732 680 725 791Palmkernel oil $/mt 888 1,130 694 609 577 763 700 737 728 726 758Soybean meal b/ $/mt 308 424 408 320 365 424 431 412 413 422 401Soybean oil b/ $/mt 881 1,258 849 830 755 863 856 920 897 931 933Soybeans b/ $/mt 384 523 437 377 394 461 454 439 427 440 451
GrainsBarley b/ $/mt 172.4 200.5 128.3 129.5 116.3 129.5 122.0 145.5 130.7 155.3 150.6Maize b/ $/mt 163.7 223.1 165.5 168.4 166.9 176.0 151.3 167.8 167.3 171.6 164.6Rice, Thailand, 5% b/ $/mt 326.4 650.2 555.0 564.4 586.3 552.4 539.0 542.3 493.0 542.8 591.0Rice, Thailand, 25% $/mt 306.5 n.a. 458.1 449.9 469.4 458.7 441.4 462.8 412.8 460.3 515.3Rice, Thailand, 35% $/mt 300.1 n.a. n.a. n.a. n.a. n.a. n.a. n.a. n.a. n.a. n.a.Rice,Thai, A.1 $/mt 272.3 482.3 326.4 314.1 323.4 326.3 309.7 346.1 298.4 337.0 403.0Sorghum $/mt 162.7 207.8 151.1 151.0 145.3 155.8 139.3 163.8 159.0 166.0 166.3Wheat, Canada $/mt 300.4 454.6 300.5 322.1 321.9 325.6 271.2 283.2 274.1 288.4 287.2Wheat, US, HRW b/ $/mt 255.2 326.0 224.1 228.1 231.6 250.5 208.8 205.4 198.8 211.0 206.3Wheat, US SRW $/mt 238.6 271.5 186.0 182.7 187.4 195.6 165.2 195.6 175.6 204.7 206.5
Other FoodBananas EU $/mt 1,037 1,188 1,145 944 1,142 1,288 1,118 1,031 1,080 1,027 986Bananas US b/ $/mt 676 844 847 847 891 858 826 812 810 834 794Fishmeal $/mt 1,177 1,133 1,230 1,023 1,013 1,097 1,276 1,535 1,427 1,526 1,651Meat, beef b/ ¢/kg 260.3 313.8 263.6 268.0 245.2 262.8 273.2 273.5 264.8 275.6 280.0Meat, chicken b/ ¢/kg 156.7 169.6 171.7 174.7 173.5 174.1 173.9 165.1 166.1 164.6 164.7Meat, sheep ¢/kg 412.0 458.5 427.6 410.0 378.5 428.7 453.3 450.1 445.8 457.0 447.5Oranges b/ $/mt 957 1,107 909 842 799 870 861 1,107 1,153 1,154 1,014Shrimp, Mexico b/ ¢/kg 1,010 1,069 945 1,014 976 970 970 864 937 863 794Sugar EU b/ ¢/kg 68.09 69.69 52.44 51.97 51.44 53.76 55.43 49.11 48.78 49.63 48.92Sugar US b/ ¢/kg 45.77 46.86 54.88 44.72 43.82 47.89 57.31 70.48 67.78 70.25 73.42Sugar, world b/ ¢/kg 22.22 28.21 39.91 26.28 28.85 33.89 46.98 49.93 49.91 49.07 50.81Continued on next page
Appendix A: Prices and Forecasts

27
Global Commodity Markets World Bank
Table A1: Commodity Price Data (Continued from previous page)
2007 2008 2009 2008 2009 2009 2009 2009 2009 2009 2009Jan-Dec Jan-Dec Jan-Dec Oct-Dec Jan-Mar Apr-Jun Jul-Sep Oct-Dec Oct Nov Dec
Raw Materials Timber Logs, Cameroon $/cum 381.3 526.9 421.5 473.8 426.8 394.8 414.9 449.5 444.5 451.1 452.7 Logs, Malaysia b/ $/cum 268.0 292.3 287.2 315.7 313.6 284.5 279.6 271.1 276.6 272.0 264.8 Plywood ¢/sheets 640.7 645.5 564.6 645.5 572.8 565.8 561.5 558.4 559.3 558.6 557.2 Sawnwood, Cameroon $/cum 759.8 958.3 748.9 770.8 689.2 721.2 779.0 806.3 790.0 821.0 807.7 Sawnwood, Malaysia b/ $/cum 806.3 889.1 805.5 859.9 813.7 829.7 771.4 807.4 805.1 821.1 796.0 Woodpulp $/mt 767.0 820.2 616.2 711.0 565.1 550.0 627.7 721.8 693.5 722.0 750.0
Other Raw Materials Cotton A Index b/ ¢/kg 139.5 157.4 138.3 126.9 120.8 132.4 141.9 158.0 147.3 157.7 169.1 Cotton Memphis ¢/kg 142.9 161.3 144.2 129.4 122.4 137.5 148.8 168.1 163.7 171.5 169.2 Rubber RSS1, US ¢/kg 248.0 284.1 214.6 202.8 165.8 187.0 221.0 284.7 264.8 279.3 310.0 Rubber RSS3, SGP b/ ¢/kg 226.3 258.6 192.1 159.0 146.0 166.4 199.3 256.5 235.2 254.2 280.1
FertilizersDAP b/ $/mt 432.5 967.2 323.1 663.3 362.2 303.6 309.6 316.9 300.1 290.3 360.4Phosphate rock b/ $/mt 70.9 345.6 121.7 371.3 193.3 113.3 90.0 90.0 90.0 90.0 90.0Potassium chloride b/ $/mt 200.2 570.1 630.4 766.7 865.2 726.7 506.8 423.0 435.0 435.0 399.0TSP b/ $/mt 339.1 879.4 257.4 658.7 321.7 247.7 224.7 235.7 246.5 228.5 232.0Urea b/ $/mt 309.4 492.7 249.6 292.2 267.3 241.1 241.6 248.3 239.0 244.8 261.1
Metals and MineralsAluminum b/ $/mt 2,638 2,573 1,665 1,821 1,360 1,485 1,812 2,003 1,879 1,949 2,180Copper b/ $/mt 7,118 6,956 5,150 3,905 3,428 4,663 5,859 6,648 6,288 6,676 6,982Gold $/toz 697 872 973 795 909 922 960 1,102 1,043 1,127 1,135Iron ore b/ ¢/dmtu 84.7 140.6 101.0 140.6 101.0 101.0 101.0 101.0 101.0 101.0 101.0Lead b/ ¢/kg 258.0 209.1 171.9 124.5 115.7 149.9 192.8 229.3 224.1 230.9 232.9Nickel b/ $/mt 37,230 21,111 14,655 10,843 10,471 12,920 17,700 17,528 18,525 16,991 17,066Silver ¢/toz 1,341 1,500 1,469 1,020 1,265 1,376 1,477 1,760 1,726 1,788 1,764Steel products index c/ 2000=100 182.0 289.3 227.1 310.4 274.5 215.5 210.8 207.5 210.4 206.8 205.2Steel cr coilsheet c/ $/mt 650 966 783 1,100 1,033 700 700 700 700 700 700Steel hr coilsheet c/ $/mt 550 883 683 1,000 933 600 600 600 600 600 600Steel rebar c/ $/mt 522 760 486 630 473 450 500 522 580 495 490Steel wire rod c/ $/mt 533 1,010 970 1,200 1,200 1,007 857 816 850 825 773Tin b/ ¢/kg 1,454 1,851 1,357 1,310 1,103 1,351 1,459 1,517 1,501 1,494 1,555Zinc b/ ¢/kg 324.2 187.5 165.5 118.5 117.2 147.3 176.1 221.4 207.2 219.3 237.6
World Bank Commodity Price Indices (2000 =100)Energy 244.8 342.0 214.3 212.9 166.3 204.5 230.3 256.0 249.9 261.5 256.5Non Energy 224.7 272.0 213.1 206.3 189.9 207.8 219.8 235.1 228.3 235.3 241.7Agriculture 180.3 229.5 197.7 178.6 181.9 197.1 199.5 212.4 206.6 213.2 217.3Beverages 169.9 210.0 219.9 181.2 197.9 207.3 226.4 248.0 246.0 245.4 252.6Food 184.7 247.4 205.0 185.7 190.4 209.8 206.4 213.5 207.8 215.3 217.4Fats and Oils 209.0 277.3 216.2 182.4 191.4 227.9 220.9 224.5 217.0 225.6 231.0Grains 189.0 281.7 214.9 218.6 221.3 225.3 202.3 210.8 201.0 214.3 217.0Other Food 149.0 177.1 181.5 160.2 161.3 172.1 191.2 201.4 201.8 202.7 199.8Raw Materials 174.9 195.7 168.7 160.0 153.1 161.1 168.9 191.7 183.7 191.8 199.4Timber 136.8 150.5 138.9 149.4 143.1 141.8 133.6 137.3 137.6 139.2 135.1Other Raw Materials 216.6 245.3 201.2 171.6 164.0 182.2 207.5 251.1 234.2 249.4 269.7Fertilizers 240.1 566.7 293.0 492.2 376.6 300.6 252.1 242.8 242.7 242.2 243.5Metals and Minerals 314.0 325.7 235.6 230.6 185.0 219.0 257.6 280.8 271.2 279.8 291.4
a/ Included in the energy index (2000=100)b/ Included in the non-energy index (2000=100)c/ Steel not included in the non-energy indexSources include: Africa Tea Brokers Ltd Weekly Market Report, Bloomberg, Canadian Grain Commission, Canadian Wheat Board, Cotton Outlook, Coal Week International, Fertilizer International, Fertilizer Week, FRuiTROP, INFOFISH, INTERFEL Fel Actualités hebdo, International Cocoa Organization, International Coffee Organization, Interna-tional Rubber Study Group, International Tea Committee, International Tropical Timber Organization, Internatonal Sugar Organization, ISTA Mielke GmbH Oil World, Japan Lumber Journal, Japan Metal Bulletin, Meat Trades Journal, MLA Meat & Livestock Weekly, Platts International Coal Report, Platts Metals Week, Singapore Commodity Exchange, Sopisco News, Sri Lanka Tea Board, Statistisches Bundesamt, US Department of Agriculture, US NOAA Fisheries Service, Vale and World Gas Intelligence.
Appendix A: Prices and Forecasts

28
Global Commodity Markets World Bank
Table A2: Commodity Prices and Price Forecast in Current DollarsActual Forecast
1970 1980 1990 2000 2009 2010 2011 2012 2015 2020Energy
Coal, Australia $/mt 7.8 40.1 39.7 26.3 71.8 80.0 85.0 85.0 75.0 80.0Crude oil, average $/bbl 1.2 36.9 22.9 28.2 61.8 76.0 76.6 76.6 77.8 79.8Natural gas, European $/mmbtu 0.4 4.2 2.8 3.9 8.7 8.3 8.5 8.8 9.5 10.0Natural gas, US $/mmbtu 0.2 1.6 1.7 4.3 3.9 6.0 7.0 7.5 9.0 9.5LNG, Japanese $/mmbtu n.a. 5.7 3.6 4.7 8.9 8.8 9.0 9.3 10.0 10.5
Non-Energy Agriculture Beverages Cocoa ¢/kg 68 260 127 91 289 300 240 180 175 170 Coffee, arabica ¢/kg 115 347 197 192 317 270 255 250 255 230 Coffee, robusta ¢/kg 91 324 118 91 164 178 177 175 180 150 Tea, auctions (3) average ¢/kg 84 166 206 188 273 230 210 205 212 225
Food Fats and Oils Coconut oil $/mt 397 674 337 450 725 750 750 800 850 715 Groundnut oil $/mt 379 859 964 714 1,183 1,325 1,340 1,345 1,325 1,110 Palm oil $/mt 260 584 290 310 683 660 670 700 780 715 Soybean meal $/mt 103 262 200 189 408 350 330 316 308 304 Soybean oil $/mt 286 598 447 338 849 800 810 820 850 800 Soybeans $/mt 117 296 247 212 437 410 403 396 375 375
Grains Barley $/mt n.a. 78 80 77 128 140 145 148 160 173 Maize $/mt 58 125 109 89 166 166 167 168 174 175 Rice, Thailand, 5% $/mt 126 411 271 202 555 460 462 464 470 483 Wheat, US, HRW $/mt 55 173 136 114 224 225 230 235 250 260
Other Food Bananas, US $/mt 166 377 541 424 847 850 847 826 710 605 Meat, beef ¢/kg 130 276 256 193 264 265 270 275 290 325 Meat, chicken ¢/kg n.a. 69 98 119 172 169 171 174 181 197 Oranges $/mt 168 400 531 363 909 900 941 951 950 900 Shrimp ¢/kg n.a. 1,152 1,069 1,515 945 875 907 941 1,050 1,150 Sugar, world ¢/kg 8.2 63.2 27.7 18.0 40.0 35.0 34.0 33.8 34.0 38.0
Agricultural Raw Materials Timber Logs, Cameroonian $/cum 43 252 343 275 421 450 450 449 445 490 Logs, Malaysian $/cum 43 196 177 190 287 270 273 276 285 320 Sawnwood, Malaysian $/cum 175 396 533 595 806 810 817 824 845 970
Other Raw Materials Cotton ¢/kg 68 206 182 130 138 137 135 138 145 140 Rubber, Malaysian ¢/kg 41 142 86 67 192 160 170 175 190 185 Tobacco $/mt 1,076 2,276 3,392 2,976 4,223 4,000 3,600 3,505 3,500 3,500
Fertilizers DAP $/mt 54 222 171 154 323 300 310 322 360 400 Phosphate rock $/mt 11 47 41 44 122 100 90 86 80 95 Potassium chloride $/mt 32 116 98 123 630 400 300 274 255 220 TSP $/mt 43 180 132 138 257 270 290 298 310 340 Urea $/mt 18 192 119 101 250 225 185 190 200 245
Metals and Minerals Aluminum $/mt 614 1,775 1,639 1,549 1,665 2,000 2,100 2,200 2,500 2,600 Copper $/mt 1,416 2,182 2,661 1,813 5,150 7,000 7,500 6,500 5,000 5,100 Gold $/toz 36 608 383 279 973 1,000 975 950 850 900 Iron ore ¢/dmtu 9.8 28.1 32.5 28.8 101.0 120.0 120.0 110.0 80.0 85.0 Lead ¢/kg 30 91 81 45 172 225 240 230 180 190 Nickel $/mt 2,846 6,519 8,864 8,638 14,655 17,500 19,000 18,000 15,000 16,000 Silver c/toz 176 2,064 482 500 1,469 1,550 1,525 1,500 1,350 1,400 Tin ¢/kg 367 1,677 609 544 1,357 1,650 1,800 1,700 1,400 1,500 Zinc ¢/kg 30 76 151 113 166 225 250 230 170 180Projections as of January 7, 2010.
Appendix A: Prices and Forecasts

29
Global Commodity Markets World Bank
Table A3: Commodity Prices and Price Forecast in Constant 2000 DollarsActual Forecast
1970 1980 1990 2000 2009 2010 2011 2012 2015 2020Energy
Coal, Australia $/mt 27.0 49.5 38.5 26.3 60.3 66.3 69.9 69.9 60.8 63.2Crude oil, average $/bbl 4.2 45.5 22.2 28.2 51.9 63.0 63.0 63.0 63.1 63.1Natural gas, Europe $/mmbtu 1.5 5.2 2.7 3.9 7.3 6.8 7.0 7.2 7.7 7.9Natural gas, US $/mmbtu 0.6 2.0 1.7 4.3 3.3 5.0 5.8 6.2 7.3 7.5LNG, Japan $/mmbtu n.a. 7.0 3.5 4.7 7.5 7.2 7.4 7.6 8.1 8.3
Non-Energy Agriculture Beverages Cocoa ¢/kg 234 321 123 91 243 249 197 148 142 134 Coffee, arabica ¢/kg 397 427 192 192 267 224 210 206 207 182 Coffee, robusta ¢/kg 316 400 115 91 138 147 146 144 146 119 Tea, auctions (3) average ¢/kg 289 205 200 188 229 191 173 169 172 178
Food Fats and Oils Coconut oil $/mt 1,376 831 327 450 610 621 617 658 689 565 Groundnut oil $/mt 1,311 1,059 936 714 995 1,098 1,102 1,106 1,074 877 Palm oil $/mt 901 720 282 310 574 547 551 576 632 565 Soybean meal $/mt 355 324 195 189 343 290 271 260 250 240 Soybean oil $/mt 992 737 435 338 713 663 666 674 689 632 Soybeans $/mt 405 365 240 212 367 340 331 325 304 296
Grains Barley $/mt n.a. 96 78 77 108 116 119 122 129 137 Maize $/mt 202 154 106 89 139 138 137 138 141 138 Rice, Thailand, 5% $/mt 438 506 263 202 467 381 380 382 381 382 Wheat, US, HRW $/mt 190 213 132 114 188 186 189 193 203 205
Other food Bananas, US $/mt 575 465 526 424 712 704 697 679 575 478 Meat, beef ¢/kg 452 340 249 193 222 220 222 226 235 257 Meat, chicken ¢/kg n.a. 85 96 119 144 140 141 143 147 155 Oranges $/mt 582 493 516 363 764 746 774 782 770 711 Shrimp ¢/kg n.a. 1,420 1,039 1,515 795 725 746 774 851 909 Sugar, world ¢/kg 28.5 77.9 26.9 18.0 33.6 29.0 28.0 27.8 27.6 30.0
Agricultural Raw Materials Timber Logs, Cameroon $/cum 149 310 334 275 354 373 370 369 361 387 Logs, Malaysia $/cum 149 241 172 190 241 224 224 227 231 253 Sawnwood, Malaysia $/cum 608 489 518 595 677 671 672 678 685 767
Other Raw Materials Cotton ¢/kg 234 254 177 130 116 113 111 114 117 111 Rubber, Asia ¢/kg 141 176 84 67 161 133 140 144 154 146 Tobacco $/mt 3,727 2,806 3,297 2,976 3,550 3,314 2,961 2,883 2,836 2,766
Fertilizers DAP $/mt 187 274 167 154 272 249 255 264 292 316 Phosphate rock $/mt 38 58 39 44 102 83 74 71 65 75 Potassium chloride $/mt 109 143 95 123 530 331 247 226 207 174 TSP $/mt 147 222 128 138 216 224 239 245 251 269 Urea $/mt 63 237 116 101 210 186 152 156 162 194
Metals and Minerals Aluminum $/mt 2,128 2,188 1,593 1,549 1,400 1,657 1,727 1,810 2,026 2,055 Copper $/mt 4,904 2,690 2,586 1,813 4,330 5,800 6,169 5,346 4,052 4,031 Gold $/toz 125 749 373 279 818 829 802 781 689 711 Iron ore ¢/dmtu 34 35 32 29 85 99 99 90 65 67 Lead ¢/kg 105 112 79 45 145 186 197 189 146 150 Nickel $/mt 9,860 8,037 8,614 8,638 12,322 14,499 15,628 14,805 12,155 12,646 Silver ¢/toz 609 2,544 468 500 1,235 1,284 1,254 1,234 1,094 1,106 Tin ¢/kg 1,273 2,068 591 544 1,141 1,367 1,481 1,398 1,134 1,186 Zinc ¢/kg 102 94 147 113 139 186 206 189 138 142Projections as of January 7, 2010.
Appendix A: Prices and Forecasts

30
Global Commodity Markets World Bank
Table A4. Weighted Indices of Commodity Prices and Inflation, 2000=100 a/Actual Forecast
Index 1970 1980 1990 2000 2009 2010 2011 2012 2015 2020Current dollarsEnergy 5.6 124.3 81.3 100.0 214.4 260.5 264.8 265.8 270.6 278.7Non-energy commodities 53.0 143.5 118.6 100.0 213.1 224.4 226.0 215.5 201.3 205.4
Agriculture 54.4 157.8 116.4 100.0 197.7 186.2 182.9 180.7 185.2 185.8 Beverages 66.5 221.2 120.3 100.0 219.9 213.1 183.9 157.9 158.0 149.3 Food 58.0 161.8 118.9 100.0 205.0 193.0 192.9 193.9 198.0 197.3 Fats and Oils 68.4 158.7 108.0 100.0 216.2 201.7 199.5 200.3 206.1 195.5 Grains 58.9 161.0 124.7 100.0 214.9 201.7 203.8 205.8 213.4 218.7 Other Food 43.7 166.5 128.0 100.0 181.5 173.7 174.3 174.6 173.5 180.3 Raw Materials 39.3 115.7 108.2 100.0 168.7 156.0 158.0 160.2 167.8 176.4 Timber 28.0 74.6 90.4 100.0 138.9 137.5 138.8 140.0 143.8 164.3 Other Raw Materials 51.7 160.6 127.6 100.0 201.1 176.3 179.1 182.3 194.1 189.6Fertilizers 23.6 143.9 101.2 100.0 293.0 238.7 205.2 202.8 203.3 226.4Metals and Minerals 53.4 114.1 125.2 100.0 235.6 301.1 316.9 288.5 234.1 243.3
Constant 2000 dollars b/Energy 19.3 153.2 79.0 100.0 180.2 215.8 217.8 218.6 219.3 220.3Non-energy commodities 183.4 176.9 115.3 100.0 179.2 185.9 185.9 177.3 163.1 162.3
Agriculture 188.4 194.5 113.1 100.0 166.2 154.3 150.4 148.6 150.1 146.8 Beverages 230.4 272.7 116.9 100.0 184.9 176.6 151.3 129.9 128.0 118.0 Food 201.1 199.5 115.5 100.0 172.4 159.9 158.6 159.5 160.5 155.9 Fats and Oils 236.9 195.7 105.0 100.0 181.8 167.1 164.1 164.8 167.0 154.5 Grains 203.9 198.6 121.1 100.0 180.7 167.1 167.6 169.3 172.9 172.8 Other Food 151.4 205.3 124.4 100.0 152.6 143.9 143.4 143.6 140.6 142.5 Raw Materials 136.1 142.7 105.1 100.0 141.8 129.3 130.0 131.8 136.0 139.4 Timber 97.0 92.0 87.9 100.0 116.8 113.9 114.1 115.2 116.6 129.8 Other Raw Materials 178.9 198.0 124.0 100.0 169.0 146.1 147.4 149.9 157.3 149.9Fertilizers 81.6 177.4 98.4 100.0 246.3 197.8 168.8 166.8 164.7 179.0Metals and Minerals 184.9 140.7 121.7 100.0 198.1 249.5 260.7 237.3 189.7 192.3
Inflation indices, 2000=100 c/MUV index f/ 28.87 81.11 102.90 100.00 118.93 120.70 121.58 121.58 123.41 126.53% change per annum 10.88 2.41 -0.29 2.19 1.48 0.73 0.00 0.30 0.50
US GDP deflator 27.43 53.87 81.45 100.00 124.11 126.39 129.68 133.11 144.45 166.02% change per annum 6.98 4.22 2.07 2.74 1.83 2.61 2.64 1.65 2.82
a/ Commodity price forecast as of January 7, 2010. b/ Computed from unrounded data and deflated by the MUV Index.c/ Inflation indices for 2008-2020 are forecast as of August 20, 2008. Growth rates for years 1980, 1990, 2000, 2009, 2015 and 2020 refer to compound annual rate of
change between adjacent end-point years; all others are annual growth rates from the previous year.d/ Unit value index of global manufacture exports in US dollar terms.Sources: World Bank, Development Prospects Group. Historical US GDP deflator: US Department of Commerce.
Appendix A: Prices and Forecasts

31
Global Commodity Markets World Bank
Appendix B: Description of Price SeriesAluminum (LME) London Metal Exchange, unalloyed pri-
mary ingots, high grade, minimum 99.7% purity, set-tlement price beginning 2005; previously cash price
Bananas (Central & South America), major brands, c.i.f. Hamburg
Bananas (Central & South America), major brands, US import price, free on truck (f.o.t.) US Gulf ports
Barley (Canada), feed, Western No. 1, Winnipeg Com-modity Exchange, spot, wholesale farmers’ price
Coal (Australia), thermal, f.o.b. piers, Newcastle/Port Kembla, 6,300 kcal/kg (11,340 btu/lb), less than 0.8%, sulfur 13% ash beginning January 2002; previ-ously 6,667 kcal/kg (12,000 btu/lb), less than 1.0% sulfur, 14% ash
Cocoa (ICCO), International Cocoa Organization daily price, average of the first three positions on the terminal markets of New York and London, nearest three future trading months
Coconut oil (Philippines/Indonesia), bulk, c.i.f. Rotter-dam
Coffee (ICO), International Coffee Organization indica-tor price, other mild Arabicas, average New York and Bremen/Hamburg markets, ex-dock
Coffee (ICO), International Coffee Organization indi-cator price, Robustas, average New York and Le Havre/Marseilles markets, ex-dock
Copper (LME), grade A, minimum 99.9935% purity, cathodes and wire bar shapes, settlement price
Copra (Philippines/Indonesia), bulk, c.i.f. N.W. EuropeCotton (Cotton Outlook “CotlookA index”), middling
1-3/32 inch, traded in Far East, c.&f. beginning 2006; previously Northern Europe, c.i.f.
Cotton Cotton (US), Memphis/Easter, middling 1-3/32 inch, c. & f. Far East beginning October 2008; previ-ously c.i.f. Northern Europe
Crude oil, average spot price of Brent, Dubai and West Texas Intermediate, equally weighed
Crude oil, Dubai Fateh 32° API, f.o.b. Dubai, spot priceCrude oil, UK Brent 38° API, f.o.b. UK ports, spot priceCrude oil, West Texas Intermediate (WTI) 40° API,
f.o.b. Midland Texas, spot priceDAP (diammonium phosphate), standard size, bulk,
spot, f.o.b. US GulfFishmeal (any origin), 64-65%, c.&f. Bremen, estimates
based on wholesale price, beginning 2004; previ-ously c.&f. Hamburg
Gold (UK), 99.5% fine, London afternoon fixing, aver-age of daily rates
Groundnut oil (any origin), c.i.f. RotterdamIron ore (Brazil), Companhia Vale do Rio Doce (Vale,
formerly CVRD) Carajas sinter feed, for years 2005-09, 67.50% Fe (iron) content (dry weight) ores,
moisture 8.0%; for year 2004, 67.40% Fe; 2000-03, 67.55% Fe, moisture 7.6 - 8.0 %; contract price to Europe, f.o.b. Ponta da Madeira. Unit dry metric ton unit (dmtu) stands for mt 1% Fe-unit. To con-vert price in cents/dmtu to $/dmt SSF (dry ore), multiply by percent Fe content.
Lead (LME), refined, 99.97% purity, settlement priceLogs (Malaysia), meranti, Sarawak, sale price charged
by importers, Tokyo beginning February 1993; pre-viously average of Sabah and Sarawak weighted by Japanese import volumes
Logs (West Africa), sapele, high quality (loyal and marchand), 80 centimeter or more, f.o.b. Douala, Cameroon beginning January 1996; previously of unspecified dimension
Maize (US), no. 2, yellow, f.o.b. US Gulf portsMeat, beef (Australia/New Zealand), chucks and cow
forequarters, frozen boneless, 85% chemical lean, c.i.f. US port (East Coast), ex-dock, beginning No-vember 2002; previously cow forequarters
Meat, chicken (US), broiler/fryer, whole birds, 2-1/2 to 3 pounds, USDA grade “A”, ice-packed, Georgia Dock preliminary weighted average, wholesale
Meat, sheep (New Zealand), frozen whole carcasses Prime Medium (PM) wholesale, Smithfield, Lon-don beginning January 2006; previously Prime Light (PL)
Natural Gas (Europe), average import border price ex-cluding UK beginning June 2000; previously includ-ing UK
Natural Gas (US), spot price at Henry Hub, LouisianaNatural Gas Index, composite index weighted by con-
sumption volumes for Europe, US and Japan lique-fied natural gas (LNG)
Natural gas LNG (Japan), import price, cif, recent two months’ averages are estimates
Nickel (LME), cathodes, minimum 99.8% purity, settle-ment price beginning 2005; previously cash price
Oranges (Mediterranean exporters) navel, EEC indica-tive import price, c.i.f. Paris
Palm oil (Malaysia), 5% bulk, c.i.f. N. W. EuropePalmkernel Oil (Malaysia), c.i.f. RotterdamPhosphate rock (Morocco), 70% BPL, contract, f.a.s.
CasablancaPlywood (Africa and Southeast Asia), Lauan, 3-ply, ex-
tra, 91 cm x 182 cm x 4 mm, wholesale price, spot Tokyo
Potassium chloride (muriate of potash), standard grade, spot, f.o.b. Vancouver
Rice (Thailand), 5% broken, white rice (WR), milled, indicative price based on weekly surveys of export transactions, government standard, f.o.b. Bangkok

32
Global Commodity Markets World Bank
Rice (Thailand), 25% broken, WR, milled indicative survey price, government standard, f.o.b. Bangkok
Rice (Thailand), 100% broken, A.1 Super beginning 2006, broken kernel obtained from the milling of WR 15%, 20%, and 25%, government standard, f.o.b. Bangkok; previously A.1 Special
Rubber (any origin), Ribbed Smoked Sheet (RSS) no. 1, in bales, Rubber Traders Association (RTA), spot, New York
Rubber (Asia), RSS3 grade, Singapore Commodity Ex-change Ltd (SICOM) nearby contract beginning 2004; during 2000 to 2003, Singapore RSS1; previ-ously Malaysia RSS1
Sawnwood (Cameroon), sapele, width 6 inches or more, length 6 feet or more, f.a.s. Cameroonian ports
Sawnwood (Malaysia), dark red seraya/meranti, select and better quality, average 7 to 8 inches; length av-erage 12 to 14 inches; thickness 1 to 2 inch(es); kiln dry, c. & f. UK ports, with 5% agents commission including premium for products of certified sustain-able forest beginning January 2005; previously ex-cluding the premium
Shrimp (Mexico), west coast, frozen, white, No. 1, shell-on, headless, 26 to 30 count per pound, wholesale price at New York
Silver (Handy & Harman), 99.9% grade refined, New York
Sorghum (US), no. 2 milo yellow, f.o.b. US Gulf portsSoybean meal (any origin), Argentine 45/46% extrac-
tion, c.i.f. Rotterdam beginning 1990; previously US 44%
Soybean oil (any origin), crude, f.o.b. ex-mill Soybeans (US), c.i.f. RotterdamSteel products price index, 2000=100, (Japanese), com-
posite price index for eight selected steel prod-ucts based on quotations f.o.b. Japan excluding shipments to the US, including China after 2002, weighted by product shares of apparent combined consumption (volume of deliveries) at Germany, Japan and the United States. The eight products are as follow: rebar (concrete reinforcing bars), merch bar (merchant bars), wire rod, section (H-shape), plate (medium), hot rolled coil/sheet, cold rolled coil/sheet and galvanized iron sheet for building which replaced galvanized sheet for appliances.
Sugar (EU), European Union negotiated import price for raw unpackaged sugar from African, Caribbean and Pacific (ACP) under Lome Conventions, c.i.f. European ports
Sugar (US), import price, nearest future, c.i.f. New YorkSugar (world), International Sugar Agreement (ISA)
daily price, raw, f.o.b. and stowed at greater Carib-bean ports
Tea (Colombo auctions), Sri Lankan origin, all tea, arithmetic average of weekly quotes.
Tea (Kolkata auctions), leaf, include excise duty, arith-metic average of weekly quotes.
Tea (Mombasa/Nairobi auctions), African origin, all tea, arithmetic average of weekly quotes.
Tea, average three auctions, arithmetic average of quo-tations at Kolkata, Colombo and Mombasa/Nairobi.
Tin (LME), refined, 99.85% purity, settlement priceTSP (triple superphosphate), up to September 2006
bulk, spot, f.o.b. US Gulf; from October 2006 on-wards Tunisian, granular, f.o.b.
Urea, (Black Sea), bulk, spot, f.o.b. Black Sea (pri-marily Yuzhnyy) beginning July 1991; for 1985-91 (June) f.o.b. Eastern Europe
Wheat (Canada), no. 1, Western Red Spring (CWRS), in store, St. Lawrence, export price
Wheat (US), no. 1, hard red winter, ordinary pro-tein, export price delivered at the US Gulf port for prompt or 30 days shipment
Wheat (US), no. 2, soft red winter, export price de-livered at the US Gulf port for prompt or 30 days shipment
Woodpulp (Sweden), softwood, sulphate, bleached, air-dry weight, c.i.f. North Sea ports
Zinc (LME), high grade, minimum 99.95% purity, settle-ment price beginning April 1990; previously special high grade, minimum 99.995%, cash prices
Appendix B: Description of Price Series

33
Global Commodity Markets World Bank
Appendix C: Definitions and ExplanationsCommodity Composition of Indices. Composition of the
sub-indices is as follows: Beverages: cocoa, coffee (arabica and robusta), tea; Cereals: barley, maize, rice, wheat; Edible oils: coconut oil, groundnut oil, palm oil, soybean meal, soybean oil, soybeans; Other food: bananas, meat (beef and chicken), or-anges, shrimp, sugar; Raw materials: cotton, rubber, timber (tropical hardwood logs and sawnwood); Fertilizers: DAP, phosphate rock, potassium chlo-ride, TSP, urea; Metals: aluminum, copper, iron ore, lead, nickel, tin, zinc.
Constant prices are prices which are deflated by the Manufactures Unit Value Indices (MUV), with a base of 2000=100. The MUV is the unit value index in US dollar terms of manufactures exported from the G-5 countries (France, Germany, Japan, UK, and US), weighted proportionally to the countries’ exports to the developing countries.
Dollars are US dollars unless otherwise specifiedIndex Weights. Energy consists of crude oil [84.6%],
natural gas [10.8%], and coal [4.6%]. Non-energy consists of metals [31.6%], fertilizers [3.6%], and agriculture [64.8%]. Agriculture consists of bever-ages [8.4%], raw materials [16.5%], and food [39.9%] while Food consists of cereals [11.2%], edible oils [16.3%], and other food [12.4%].
Price Indices were computed by the Laspeyres formu-la. The Energy Price Index is comprised of 3 com-modities; the Non-Energy Price Index is comprised of 34 commodities. U.S. dollar prices of each com-modity are weighted by 2002-04 average develop-ing countries’ export values. Base year reference for all indexes is 2000. Countries comprised of all low and middle income economies according to World Bank income classification.
Reporting period. Calendar vs. crop or marketing year refers to the span of the year. It is common in many agricultural commodities to refer to production and other variables over the twelve month period which begins with harvest. A crop or marketing year will often differ by commodity and, in some cases, by country or region. Commodities such as metals use calendar year.
Tons refer to metric tons (1,000 kilograms)

34
Global Commodity Markets World Bank
ACP African, Caribbean, and Pacific (Lome Convention)API American Petroleum Institute bbl barrelBP British PetroleumBPL Bone phosphate of lime CBGA Central Bank Gold Agreementc.i.f. cost, insurance, and freightCIS Commonwealth of Independent StatesCWRS Canada Western Red SpringDAP Diammonium Phosphatec.& f. cost and freightcum cubic meterdmtu dry metric ton unitEEC European Economic Community EU European Unionf.a.s. Free alongside (steamer/ship) f.o.b. free on boardf.o.r. free on railf.o.t. free on truckfe ironFSU Former Soviet UnionG-5 France, Germany, Japan, United Kingdom, and
United StatesGDP Gross domestic productHRW Hard Red WinterICAC International Cotton Advisory CommitteeICCO International Cocoa OrganizationICO International Coffee OrganizationIEA International Energy AgencyIRSG International Rubber Study GroupISA International Sugar AgreementITC International Tea CommitteeITTO International Tropical Timber Organizationkcal kilogram-calorie
kg kilogramlb poundLME London Metal ExchangeLNG Liquefied Natural Gasmb/d million barrels per daymmbtu million of British thermal unitsmt metric tonMUV Manufactures unit valuen.a. data not availablen.q. no quotationOECD Organization for Economic Cooperation and
DevelopmentOPEC Organization of Petroleum Exporting CountriesPNG Papua New GuineaRSS1 Ribbed Smoked Sheet [grade 1]RTT Rubber Traders AssociationSGP SingaporeSICOM Singapore Commodity ExchangeSRW Soft Red WinterSSF Standard Sinter Feedtoz troy ozTSP Triple SuperphosphateUAE United Arab EmiratesUN United NationsUS DOE US Department of EnergyUSDA US Department of AgricultureVale Companhia Vale do Rio DoceWBMS World Bureau of Metal StatisticsWFP World Food ProgrammeWR white riceWTI West Texas Intermediate$ US dollar¢ US cent
Appendix D: Acronyms and Abbreviations


Global Commodity Markets World Bank
For more information on the analysis, please see www.worldbank.org/prospects/Prospects for the Global Economy/Commodity markets
THE WORLD BANK1818 H Street, NWWashington, DC 20433 USATelephone: 202 477-1234Facsimile: 202 477-6391Internet: www.worldbank.orgE-mail: [email protected]