t e s t re p o rt: re di -ro ck barri e r t e s t i ng
TRANSCRIPT

TEST REPORT:
REDI-ROCK BARRIER TESTING:PHASE TWO Hollow Core Freestanding Unit (F-HC) Beam Test Results
Tested By:Aster Brands2940 Parkview DrivePetoskey, Michigan 49770866-222-8400
August 17, 2021

1.0 IntroductionThis report documents the performance and bending capacity of a barrier wall stem constructedfrom standard hollow core Redi-Rock system blocks. Test wall samples consisted of twocourses of Redi-Rock Hollow Core Freestanding blocks (F-HC), as shown in Figure 1. Wallswere dry-stacked, steel reinforcing bars were placed, and then the cores were filled withconcrete to create a solid barrier wall stem section. In this study two identical wall sampleswere constructed and tested.
Construction and testing was performed by Aster Brands at its testing facility located inCharlevoix, Michigan throughout the months of February, March, and May 2020. Redi-Rock isan Aster Brands company.
Figure 1 - Sample test wall from
2.0 PurposeThe objective of this test program was to verify the static, in-plane, flexural load capacity, andperformance of a “unit beam” section of barrier wall stem. Secondary objectives includedexploring possible failure mechanisms and providing data to calibrate mathematical models.
2

3.0 MaterialsTypical barrier wall cross sections consist of a wall base moment slab connected to a wall stem.This test project focused on the bending capacity of the stem of the barrier wall constructedfrom two courses of Redi-Rock Hollow Core Freestanding Blocks (F-HC).
Redi-Rock F-HC blocks (Figure 2) are wet-cast concrete, precast modular block (PMB) unitswith a nominal width of 24 inches (610 mm), length of 46⅛ inches (1172 mm), and height of 18inches (457 mm). These blocks are cast in a standard freestanding block form with inserts tocreate cores through the block. Test blocks were cast with a low-profile, smooth-face facetexture. No attempt has been made to account for any contribution from the extra concrete in astandard Redi-Rock face texture. Block weight (with Ledgestone texture) is about 770 lb (350kg). Average test block weight was 440 lb (200 kg). Precast blocks do not contain reinforcingsteel.
Note: Drawing dimensions are in inches (mm)
Figure 2 - F-HC Block and Cross Sectional Depiction
Concrete blocks used in this series of testing were produced by Aster Brands at its testingfacility located in Charlevoix, Michigan. Blocks were cast from redi-mix concrete with a targetcompressive strength of 4,000 psi (27.6 MPa). The blocks were cast and cured inside a heatedfacility for a minimum 14 days before construction of the walls began. All blocks were cured aminimum 28 days before the wall samples were tested. Compressive strength of the concreteused to produce the test blocks taken at the actual test date ranged from 3,600 psi (24.8 MPa)to 4,500 psi (31.0 MPa), as determined by ASTM C39 on 4-inch by 8-inch (102 mm by 203 mm)field-cured concrete cylinder specimens. Block strengths for each test wall are shown in Figure3.
Concrete infill used to fill the cores of the wall samples was a pumpable concrete mix with atarget compressive strength of 4,000 psi (27.6 MPa). Wall cores were filled on 2/26/2020 and
3

allowed to cure a minimum of 28 days before barrier wall testing began. The concrete infillcompressive strength at the actual test dates was 5,576 psi (38.4 MPa), as determined byASTM C39 on 4-inch by 8-inch (102 mm by 203 mm) field-cured concrete cylinder specimens.Concrete infill strengths for each test wall are shown in Figure 3.
Reinforcing steel used in the construction of the test walls was specified as ASTM A615 - Grade60, uncoated bars. Structural reinforcement was specified as #6 (19.1 mm) bar. Stirrups werefabricated from #4 (12.7 mm) bar. Reinforcement was cut and bent per specified drawings byStriker Concrete Supply located in Traverse City, Michigan. None of the rebar was field cut orbent.
Figure 3 - Concrete Compressive Strengths (looking from the front of the wall sample)
4

4.0 Barrier Wall DesignA total of two test walls were constructed for this portion of the test, both with identicalarrangement and reinforcement configurations. See Figures 4 through 6 for block patterns,reinforcement layouts and actual dimensions of wall samples constructed.
Test Walls A and B had a standard running bond with a joint centered in the middle of the testspecimen. Test samples were reinforced both horizontally and vertically with with #6 (19.1mm)reinforcement. Two bars were placed horizontally in each of the two courses through thehorizontal cores of the F-HC blocks. There were also twenty four #6 vertical bars spaced intwelve pairs equally spaced along the length of the wall. This reinforcement helps to spread loadlaterally throughout the beam section. Twelve #4 (12.7 mm) U-shaped stirrups finish the top ofthe wall and are placed 1-inch (25 mm) clear from the top.
Figure 4 - Test Block Layout
Figure 5 - Reinforcement Layout
5

Figure 6 - Wall Cross Section
4.0 Barrier Wall ConstructionBarrier wall sections were constructed directly adjacent to the testing frame in the Aster Brandstesting facility. Size of the wall specimens was such that they could be moved into and out ofthe testing frame by an overhead crane. Walls were constructed by placing the first course ofF-HC hollow core freestanding blocks on a leveled plywood platform topped with a ⅛-inch (3mm) plastic sheet. The second course of F-HC blocks was then stacked on top of the first toform the barrier section. After the walls were dry stacked, rebar was placed in the cores andtied in place with standard, uncoated wire ties. The outside edges of the walls were then formedand braced with plywood formwork. Joints were lightly tuck pointed on the outside withnon-shrink grout to seal all joints before filling the cores with infill concrete.
Once both of the wall test specimens were constructed, they were infilled from a single pour ofconcrete. Concrete infill was placed by pump and the walls were vibrated while filling to ensureall of the voids were filled. Lifting anchors were cast into the tops of the walls to facilitatemoving test wall sections into and out of the testing frame. Forms were stripped the next dayand wall samples were left undisturbed for a minimum of (28) days before moving or testing.See Figure 7 for photos taken during construction.
6
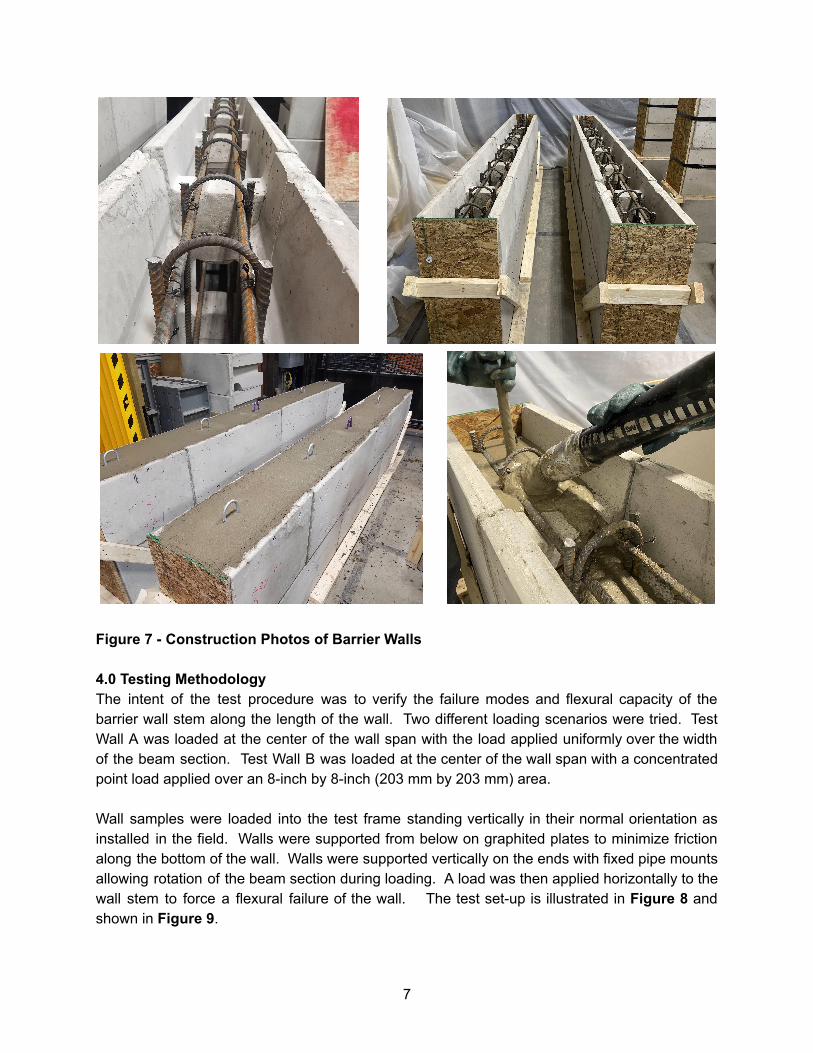
Figure 7 - Construction Photos of Barrier Walls
4.0 Testing MethodologyThe intent of the test procedure was to verify the failure modes and flexural capacity of thebarrier wall stem along the length of the wall. Two different loading scenarios were tried. TestWall A was loaded at the center of the wall span with the load applied uniformly over the widthof the beam section. Test Wall B was loaded at the center of the wall span with a concentratedpoint load applied over an 8-inch by 8-inch (203 mm by 203 mm) area.
Wall samples were loaded into the test frame standing vertically in their normal orientation asinstalled in the field. Walls were supported from below on graphited plates to minimize frictionalong the bottom of the wall. Walls were supported vertically on the ends with fixed pipe mountsallowing rotation of the beam section during loading. A load was then applied horizontally to thewall stem to force a flexural failure of the wall. The test set-up is illustrated in Figure 8 andshown in Figure 9.
7

Figure 8 - Test Set-up (looking down from above)
Figure 9 - Test Set-up (looking from the front
8

Load was applied to the test sample using the horizontal hydraulic actuator mounted in AsterBrands’ structural test frame. Two 100 kip (445 kN) capacity load cells were installed in seriesat the end of the hydraulic actuator. A hardened, spherical load button was attached to the loadcells and pushed against a set of hardened, graphited plates which allowed for rotation andlateral movement at the point of application of the load. Load was spread to the bearing area onthe wall sample with a 8-inch (203 mm) wide steel beam backed by a 1-inch (25 mm) thickpolyurethane bearing pad. Load was applied at mid-span, centered vertically on the wall.Horizontal displacements of the wall were measured at the point of load application with an LDTdisplacement gauge mounted inside the hydraulic cylinder.
A preload of approximately 1,000 lbs (4.4 kN) was applied to each wall sample to seat the wallin the test frame before recording displacements. The preload was held for approximately oneminute before loading of the wall commenced. Displacement measurements were zeroed at theend of the preload period. Walls were then pushed until failure with a slowly increasing,pseudo-static, load-controlled rate of approximately 2,000 lb per minute (20.5 kN per minute),which correlates to an approximate 0.25-inch per minute (2.5 mm per minute) displacement rateof the actuator. This load rate was maintained until the wall failed and load dropped offsignificantly (approximately at 4.75-inch (12.7 mm) of actuator displacement). After significantload drop, the test was switched to a displacement-control rate of approximately 0.75-inch (10mm) per minute until the end of the test. Walls were then pushed to a final actuatordisplacement of approximately 9-inch (229 mm).
Test data was recorded at 1-second intervals with a National Instruments brand data acquisitionsystem and Labview DAQ software. Both load cells, horizontal hydraulic cylinder displacement,pump speed, horizontal cylinder velocity, and time were recorded. In addition to this data, videowas taken from multiple angles to evaluate failure modes of the wall assembly.
9

5.0 ResultsResults from this test program can be seen in Table 1 and the graph shown in Figure 13. Loadand deflection data (at the point of application of the load) was tabulated for two distinct points:yield and peak. Yield denotes a dip in the graph and corresponds to initial cracking in the wallsection. Peak corresponds to the point of maximum load that the wall was able to sustain. Theyield and peak points are annotated in Figure 13. Both of the walls failed by cracking in thetension face of the beam and failure of at least one of the main horizontal reinforcement bars.Flexural cracking patterns can be seen Figures 10 - 12.
Figure 10 - Typical Failure Mode (taken from Test Wall A)
10

Figure 11 - Typical Failure Mode (taken from Test Wall B)
Figure 12 - Typical Failure Mode (taken from Test Wall B)
11

Table 1 - Results
Test Wall
YieldLoad
lb (kN)
Deflectionat Yield
inch (mm)
PeakLoad
lb (kN)
Deflectionat Peak
inch (mm)
Notes
A14,402(64.1)
0.12(3.0)
38,402(170.8)
2.82(72)
Tensile cracks on outside face of wall
B12,772(56.8)
0.09(2.3)
39,863(177.3)
4.86(123)
Tensile cracks on outside face of wall
Figure 13 - Test Results
12

6.0 ClosureThis data and conclusions should be used with care. The user should verify that projectconditions are equivalent to laboratory conditions and account for variations.
This test data is accurate to the best of our knowledge. It is the responsibility of the user todetermine suitability for the intended use.
ASTER BRANDS
Matthew A. Walz, P.E. Nils W. Lindwall, P.E.Testing Manager Chief Engineer
13