systems ecology of water mouse xeromys myoides in · pdf filesystems ecology of water mouse...
TRANSCRIPT

Emergy Synthesis 9, Proceedings of the 9th Biennial Emergy Conference (2017)
47
12
Systems Ecology of Water Mouse Xeromys myoides in
Port Curtis, Australia
John McLachlan-Karr
ABSTRACT
Port Curtis is part of a naturally turbid, tropical, estuarine ecosystem that has developed over the past
four to seven thousand years under the influence of 3.3 meter tides, monsoonal climate and periodic
cyclonic events. It has several unique features including a specialist species of significant conservation
concern, the Water mouse, Xeromys myoides an inter-tidal rodent. In this Article, the results of field
surveys for X. moides in 2011-12 are presented along with measurements of primary production and
water column properties in Port Curtis. Data from past studies are also used to construct an energy
systems model of the Study Area ecosystem to evaluate the annual flows of Emergy and matter coursing
through the network that ultimately supports X. myoides. The properties of this ecosystem network were
analysed in terms of available energy (Exergy) and energy quality (Emergy) to drive processes. The
results show that there is a very significant convergence of available energy in the Study Area. The
largest source is from geo-potential energy in the tides (57% Exergy and 43% Emergy). Lesser amounts
are from sunlight (Emergy 24 %), cyclonic energy (Exergy 8% and Emergy 9%) and rain chemical
potential energy (Exergy 7% and Emergy 3.58%).The convergence of Emergy use most effectively by
the Rhizophora dominated mangrove communities associated with tidal streams and run-off. In subtidal
areas, phytoplankton and benthic primary production is less than anticipated because of the estuary’s
high total suspended solids (TSS) and related light limitations. Drying winds limit the upper tidal areas
to cyano-bacterial mats and salt couch.The detritus consumer pathways converge on X. myoides in the
protected mid to lower intertidal zones. Here, tidal eddies concentrate detritus and other matter that
are utilized by benthic detritus feeding organisms, particularly species of Grasid and Grapsoid crabs,
which are important X. myoides prey items. X. myoides move onto the lower intertidal areas at night in
search of prey. X. myoides is an active rodent with flexible diet and complex, social, behavioural
patterns. Family groups nest in the adjacent supra-littoral banks. Within its restricted home range it
provides feedback to these pathways and plays a significant role in the system’s organization.
BACKGROUND
The Water mouse (Xeromys myoides Thomas, 1889) is a small, non-arboreal, nocturnal rodent
(Woinarski et al., 2007). Xeromys myoides is listed as Vulnerable under the Queensland Nature
Conservation Act 1992 and the Commonwealth Environment Protection and Biodiversity Conservation
Act 1999. It is also recognized internationally as such under the IUCN Red List of Threatened Species.
A species recovery plan was developed as part of the Action Plan for Australian Rodents (Australian
Nature Conservation Agency, 1995).

48
Much of what is known about Xeromys myoides life history is based on studies in South East
Queensland where it appears to revolve around mangroves and adjacent plant communities (Gynther
and Van Dyck 1997; S. Van Dyck, 1996). Adult X. myoides have an average head-body length of
103mm, tail length of 81mm and an maximum weight of 64 g (average 42 g) (DERM, 2010). There
appears to be three geographically distinct populations of Xeromys myoides known to occur in coastal
mangrove areas in south east Queensland/northern NSW, south central Queensland, and the Northern
Territory and has also been recorded from SE Papua New Guinea (Commonwealth of Australia, 2009).
Xeromys myoides is known to construct up to five types of nest, including free standing termite-
mound-like structures, mounds at the base of mangrove trees, or mound nests or or in simple tunnels in
the spring tide high water bank holes in supralittoral banks (Van Dyck & Gynther 2003; Van Dyck et al.
2003). Up to eight individuals of various ages and either sex live in a nest, with usually only one adult
male present (ibid.). A survey in nearby Mackay identified inhabited mud nests, sloping against buttress
mangrove roots (DERM, 2010). Xeromys myoides is in breeding condition throughout the year (Van
Dyck et al., 2003). From its nest, Xeromys myoides follows the receding tide out through the sedgeland
and into the mangroves, where they forage over a home range estimated at 0.8ha for males and 0.6ha for
females. Home ranges overlap slightly, but core areas, estimated at around 0.2ha, do not overlap (Van
Dyck et al, 2003).
In Central Queensland, X. myoides has previously been found in Gladstone but has not been
previously studied in detail and overall, little is known about X. myoides ecology in Port Curtis. In
central Queensland, the species has only been captured previously within fringing mangroves in the high
intertidal zone dominated by Ceriops tagal and/or Bruguiera spp. (Ball, 2004).
The diet of Xeromys myoides consists of small crustaceans, mainly the Grapsid and Grapsoid crabs,
marine flatworms and molluscs (Commonwealth of Australia, 2009). Potential predators include, inter
alia, foxes, cats, carpet pythons, rough-scaled snakes and tawny frogmouths (Commonwealth of
Australia 2009).
The initial capture of Xeromys myoides in the vicinity of a gas pipeline alignment was in 2010.
Following this, the Study Area was the subject of intensive trapping for Xeromys myoides over a series
of nocturnal field surveys based around spring tides events in November and December 2011 (MCJV
Water Mouse Habitat Assessment, Trapping, and Tracking Project (herein referred to The Survey
Report, 2011)).
This purpose of this Article is to document the ecology of X. myoides in Port Curtis as part of the
area’s significant species management program. In this Article, a systems ecology methodology is
applied to X. myoides habitat (the Study Area) to help provide insights into the fundamental questions
concerning X. myoides including: What kind of habitat does this species prefer and what are the possible
contributions by X. myoides to a monsoonal, macro-tidal dominated, estuarine ecosystem?
This study uses energy systems analysis of the systems variables to guide interpretations for the
species’ preference for certain habitat attributes as well as possible ecological function of the species. It
also contributes to ecological understanding of the wider Port Curtis estuarine systems through
preliminary estimates of the primary production and its fate and nutrient dynamic in the study area
section of the Port.
THE STUDY AREA
The Study Area for this Article is centred on 151˚ 137΄ 01˝ E and 23˚ 752̒ 61˝ S, Port Curtis,
Australia. Port Curtis is a shallow, naturally turbid estuary of a classic, funnel-shaped depositional
geometry located on the Great Barrier Reef coastline. It is protected from inner barrier reef ocean
conditions by a series of barrier islands along its eastern margin.
The study area is part of The Narrows, in the inner zone of the tidally-dominated estuary. During
its Holocene evolution over the past 7000 or so years, the area appears to have taken on most of its
current macro tidal characteristics. The main geo-morphological features of the Study Area include
mangrove fringed estuarine branches namely Humpy and Targinnie Creeks. To the East is the salt marsh

49
Figure 1. The Study Area from Humpy Creek to Laird Point on Curtis Island.
area then the high current, Narrows Crossing section from Friend Point to Laird Point on Curtis Island.
Rhizophora mangroves associated with the Creeks suggest the dominance of tidal over fluvial processes
and sedimentary fill has reached a surface equilibrium with ambient low-energy conditions (Geocoastal,
2010).
The Study Area includes the pipeline footprint (40 m width) and a contiguous buffer zone of 50 m
each side used for the targeted Water mouse surveys (The Survey Report 2011). The vertical boundaries
of the Study Area are from the height of tallest mangroves (around 5 m) and to a depth of 1 m of the
sediments, as indicated by the approximate depth of potential acid sulphate soil distribution as measured
by pH KCL (Geocoastal, 2010).
Likely habitat was searched for evidence of breeding site or usage, or other indications of nesting
habitat (i.e. feeding middens, fresh workings, scats, etc.) during the day time surveys. Fringing
mangroves (Ceriops tagal) were inspected, but the communities of Rhizophora stylosa were generally
impenetrable because of the vegetation density. The Study Area was also sampled by up to four trap
nights and up to 100 Elliot traps per night including habitat assessments, live trapping in accordance
with the Significant Impact Guidelines for the species (SEWPaC 2011).
Radio transmitting devices were attached to individual X. myoides trapped during field work,
according to the method approved in Animal Ethics Permit. Radio-tracking of individual Xeromys
myoides was undertaken for 3 days.
The ecological network (systems model) was drawn from field observations. Background ecological
data on Port Curtis was assembled from limited field sampling and from other publications, reports and
data sets. Most of these data were obtained during the course of environmental impact studies conducted

50
since the 1970s for the possible environmental consequences of Port Curtis development. These include:
Port Curtis Integrated Management Programme (PCIMP) Water Quality Monitoring Programs from
2006 to 2011, the Western Basin Dredge Environmental Monitoring (WBDEM) since 2009 and Project
EIS for the development of gas pipelines and related commissioned reports.
Meteorological data are from the Australian Bureau of Meteorology (BOM). Geomorphology data
are from Geocoastal Australia QGC Reports Vol. 1 & 2 2011.1 Water quality data is from Vision
Environment (2012); Primary production data (seagrasses) are from QGC DEEDI Reports (Chartrand,
K. M. Et al, 2010). Mangrove production data was obtained from measurements within the Study Area
and other primary production data from the Intertidal wetlands of Port Curtis: Ecological patterns and
processes, and their implications Report (Connolly et al, 2006). Nekton data is from Alquezar, R and
Scannell, J. (2010) and oceanographic data from APASA Reports, 2012. Geographical data were
calculated as part of this Study was recorded in 2012 from high resolution digitized aerial photographs
using Mapinfo software. Data sources are referenced in the Tables in Appendix 1.
DATA SYNTHESIS
Although most scientists and engineers recognize that energy is the source and control of all things
(Odum and Odum 1976), this fact has seldom been taken as the basis for analysing the ecology of a
species or the structure and function of components of a tropical estuarine system of which they are a
part.
In this Article, available energy is used as a common denominator to evaluate certain key
components of the Study Area because the transformation of energy underlies the organization of
components and processes in all systems (Campbell, 2001). Energy systems theory is the study of how
ecosystem designs are determined by certain scientific laws and principles including: the conservation
of energy and mass (first law of thermodynamics), the second law of thermodynamics, and the maximum
power principle (Lotka 1922; Odum 1994; Odum 1995).
When taken as a whole, the energy systems approach provide a set of design principles through
which ecosystem organization may be better understood and interpreted. For example, this method can
be used to sort out the relative contributions of the various energy sources of different kinds that support
the productivity and ecological organization in the Study Area (Odum 1996). To accomplish this,
environmental accounting is used to express input-output flows in the same units (i.e., Joules per year),
making them directly comparable. In this study, available energy is defined as the energy with the
capacity to do work sometimes called Exergy. The mass flows were converted to Exergy, and estimates
made of turnover times. The Emergy flow is calculated by multiplying each of the available Exergy
numbers given in Joules per year with the appropriate Transformity (sej J-1.
A potentially powerful explanatory hypothesis underlying this Article is that the suite of forcing
functions or the ‘energy signature’ of an estuary determines the kind and amount of ecological
organization found there (Campbell 2000, Odum, 1996). These principles appear universal and guided
the interpretation of the Study Area ecological network. A fundamental principal offered by this
approach is that the Study Area is dynamic with interconnected inputs and outflows, stored materials
and populations all pulsing at different time scales and intensities. As the largest natural pulses are
considered to be extra-seasonal, the time scale appropriate for this Article is yearly and eergy fluxes.
While the systems diagram generally adheres to the hierarchical nature of system organization,
further data synthesis requires additional data for the calculation of specific transformities that are not
readily available for all data and so have not been included.
1Geocoastal Australia Reports Vol. 1 & 2 2011.
51
Caveat
The ecological network drawn for this Article is not complete because information was not available
on all aspects of the Study Area or for the Port Curtis ecosystem. Estimates of the fate of primary
production rely on literature values of ecosystem components and processes obtained by other
investigators in other studies and at other times. In addition, the estimates of consumption are predicated
on assumptions that often grossly over simplify the complex system.
Significant data deficiencies include numerical measures of the origin and fate of all detritus sources
and nutrient dynamics that support the primary production and consumer groups essential for the X.
myoides population. A systems network for these processes are included, however, and some order of
magnitude estimates were made from prior studies and assumptions based on the principle of
conservation of energy and mass used in the systems diagram. One potential contribution of this Article
is to highlight data deficiencies that may be useful for future studies on Xeromys myoides.
Estimates used in this Article are based on the same data found in the information sources mentioned
above but may be slightly different from the estimates given in them because different averaging rules
were used and or different assumptions were made about the distribution of values in unsampled areas.
Also, standard deviations of data sets, in general, are not included. Nevertheless, the numbers provide a
useful first order estimate of production, nutrients, and some consumer groups, based on available
information from the Study Area.
Systems Diagram
The systems model of the Study Area shows interconnected sub-tidal and intertidal habitats
comprising salt marshes, mangrove wetlands and intertidal soft mud and sandy sediments. The patterns
in the data are shown in Table 1 and the calculations and data sources are documented for the Table 1
are given in Appendix 1.
RESULTS
The energy signature of the Study area is show in Figure 3. Total renewable energy flows account
for about 9.8 E+8 J m-2 yr-1 or 12.3 E+12 sej m-2 over the Study Area2 (Table 1).
Tidal energy (R10 in the systems diagram) is the largest energy flow estimated at 5.9 E+14 J yr-1
(4.17 E+17 sej yr-1) or 45.3 % of the yearly total. Geo-potential energy in tides is important for X.
myoides habitat by transport and re-suspension of sediments (Total suspended solids (TSS) (R13),
transport of nutrients (R12) (as total available N and P per year), organic matter (R11) as well as carrying
species (Nekton) (R14) and larvae (R15) into and away from the Study Area (R10).
There is a secondary energy peak with Sunlight energy (R1-R4) estimated at 2.56 E+17 J yr-1 or
24% of the yearly total using an estimated 20% Albedo. The diagram has a function showing a reduction
of photosynthetically available radiance (PAR) to benthic primary producers proportional to TSS and
impacting benthic primary producers (BPP) seagrasses phytoplankton production (P).
Another peak in the energy spectrum is from cyclonic energy (R16)(3E+12 J yr-1 and 8.87 E16 sej
yr-1 or 9% of the yearly total Emergy and calculated as the geo-potential energy in waves generated
during periodic cyclones events. This Emergy is concentrated over a small area and for short a duration
as crashing storm waves and shown as a kinetic energy switch in the systems diagram (Figure 2) for one
cyclonic event every seven years for 24 hours duration (BOM, 2012)3. The Emergy signature is given
in Figure 3.
2Calculated by using the arithmetic means of two impendent energy flows (solar radiation and gravitational
attraction) to avoid double counting. 3 Cyclonic energy is coupled to the solar energy absorbed elsewhere over the sea so is given here as an independent
source.

52
Figure 2. Systems Diagram of the Study Area.
Figure 3. Emergy signature of the study area.
53
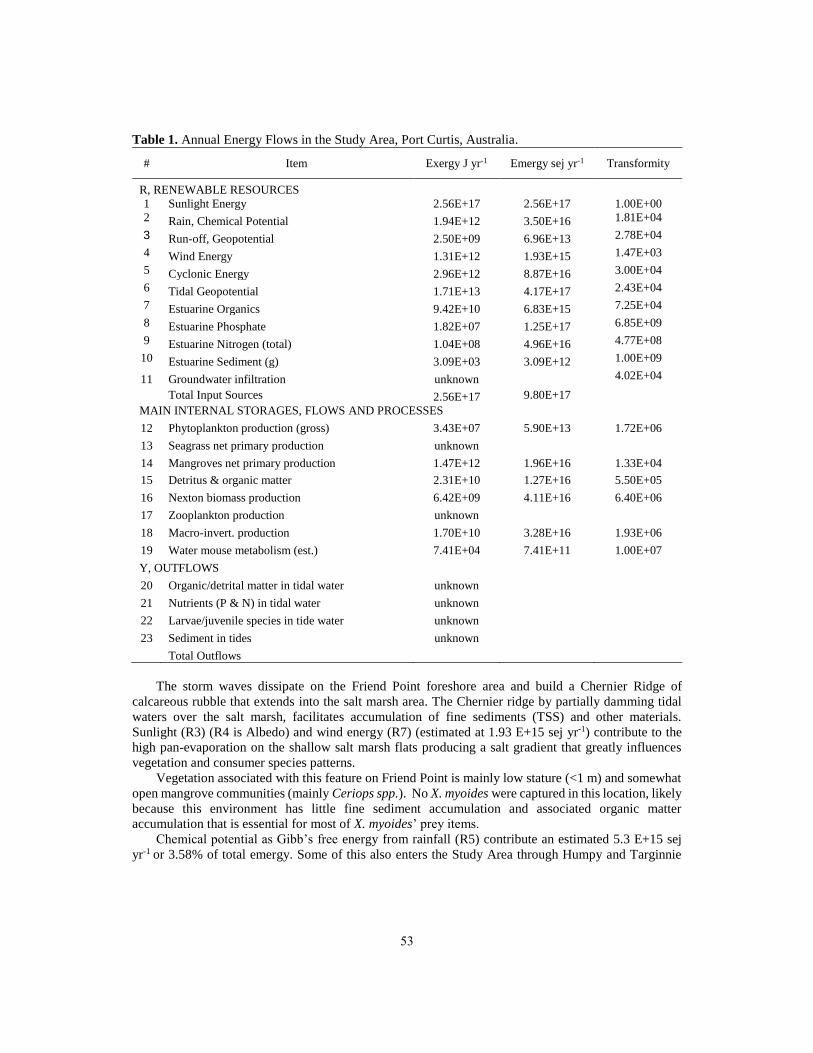
Table 1. Annual Energy Flows in the Study Area, Port Curtis, Australia.
# Item Exergy J yr-1 Emergy sej yr-1 Transformity
R, RENEWABLE RESOURCES 1 Sunlight Energy 2.56E+17 2.56E+17 1.00E+00
2 Rain, Chemical Potential 1.94E+12 3.50E+16 1.81E+04
3 Run-off, Geopotential 2.50E+09 6.96E+13 2.78E+04
4 Wind Energy 1.31E+12 1.93E+15 1.47E+03
5 Cyclonic Energy 2.96E+12 8.87E+16 3.00E+04
6 Tidal Geopotential 1.71E+13 4.17E+17 2.43E+04
7 Estuarine Organics 9.42E+10 6.83E+15 7.25E+04
8 Estuarine Phosphate 1.82E+07 1.25E+17 6.85E+09
9 Estuarine Nitrogen (total) 1.04E+08 4.96E+16 4.77E+08
10 Estuarine Sediment (g) 3.09E+03 3.09E+12 1.00E+09
11 Groundwater infiltration unknown 4.02E+04
Total Input Sources 2.56E+17 9.80E+17 MAIN INTERNAL STORAGES, FLOWS AND PROCESSES
12 Phytoplankton production (gross) 3.43E+07 5.90E+13 1.72E+06
13 Seagrass net primary production unknown 14 Mangroves net primary production 1.47E+12 1.96E+16 1.33E+04
15 Detritus & organic matter 2.31E+10 1.27E+16 5.50E+05
16 Nexton biomass production 6.42E+09 4.11E+16 6.40E+06
17 Zooplankton production unknown 18 Macro-invert. production 1.70E+10 3.28E+16 1.93E+06
19 Water mouse metabolism (est.) 7.41E+04 7.41E+11 1.00E+07
Y, OUTFLOWS 20 Organic/detrital matter in tidal water unknown 21 Nutrients (P & N) in tidal water unknown 22 Larvae/juvenile species in tide water unknown 23 Sediment in tides unknown
Total Outflows
The storm waves dissipate on the Friend Point foreshore area and build a Chernier Ridge of
calcareous rubble that extends into the salt marsh area. The Chernier ridge by partially damming tidal
waters over the salt marsh, facilitates accumulation of fine sediments (TSS) and other materials.
Sunlight (R3) (R4 is Albedo) and wind energy (R7) (estimated at 1.93 E+15 sej yr-1) contribute to the
high pan-evaporation on the shallow salt marsh flats producing a salt gradient that greatly influences
vegetation and consumer species patterns.
Vegetation associated with this feature on Friend Point is mainly low stature (<1 m) and somewhat
open mangrove communities (mainly Ceriops spp.). No X. myoides were captured in this location, likely
because this environment has little fine sediment accumulation and associated organic matter
accumulation that is essential for most of X. myoides’ prey items.
Chemical potential as Gibb’s free energy from rainfall (R5) contribute an estimated 5.3 E+15 sej
yr-1 or 3.58% of total emergy. Some of this also enters the Study Area through Humpy and Targinnie
54
Creeks as wet season flows from run-off from the small catchment areas4. These flows may be significant
for brief periods in the wet season, the two minor streams, however, are considered to be mainly
maintained by the stream transport capacity generated by the tides. From the Creeks and supra-littoral
area, small surficial groundwater flows have been observed into the intertidal area but their importance
to X. myoides is uncertain and ground water infiltration rates into the intertidal area is unknown.
Nutrients
Nutrients as Total Nitrogen 1.04 E+8 J yr-1 (4.96 E+16 sej yr-1) and Total Phosphorus 1.82 E+7 J
yr-1 (1.25 E+17 sej yr-1) enter the Study Area mainly with tides (R12). Some also enters as fluvial inflows
as well as direct atmospheric deposition (Nitrogen R16)5. How much new Nitrogen (Nitrogen is assumed
to be limiting) entering the Study Area, however, as well as its fate each year, is uncertain.
The quite large shifts in Nitrogen and Phosphorus nutrient concentrations in the Study Area are
accounted for by wet summer and dry winter seasonal pattern typical of Australian tropical estuarine
systems. Wet season and other large rainfall events bring pulses of materials including new nutrients
into Port Curtis that replenish supplies that may be used up over the previous growing season (Carruthers
et al, 2002).
Although nutrients and organic matter also enter the Study Area from the catchment area of the
Creeks in run-off (R17) these inputs are considered relatively low. A recent study indicated that Carbon
utilised by higher trophic levels (e.g. fish, crabs and prawns) is largely derived from marine autotrophs
and not terrestrial sources in Port Curtis (Connolly & Guest, 2004). This is shown in the systems diagram
as a proportion of the available nutrients flowing through the Study Area each year and used by
phytoplankton in the water column or settling to the sediments where they are used directly by other
auto-trophs.
The fairly high sedimentary nutrient concentration may be indicative of sedimentary nutrients being
re-mineralized by benthic microorganisms mainly bacteria and fungi (J14) in respiration (J6). Nitrogen
and Phosphorus is also recycled by the metabolism of all consumer groups. Some of these re-
mineralized nutrients are buried in the sediments or lost to the Study Area with tidal outflows or though
oxidation on the surface.
Some of sedimentary nutrients may be periodically resuspended through the mixing actions of tides,
storms and cyclones and bio-turbation especially in the lower intertidal areas. If enough nutrients are in
the water column or re-suspended from the sediments they may contribute to the significant algae blooms
that periodically occur within Port Curtis (J15).i
Primary Production
The primary production groups use the available Emergy in the forcing functions of sunlight, wind,
rainfall and run-off, periodic storm events and tides to incorporate nutrients into macro-phyte Carbon
production within the auto-trophs. Mangrove net production (NPP) is the largest contributor overall in
the Study Area (Emergy 1.96 E+16 sej yr-1). The study area mangrove community includes seven
species: Rhizophora stylosa (dominant), Avicenna marina, Ceriops tangal (australis), Osbornia
octodonta, Aegiceras corniculatus and rarely Brugeria spp. and Lumnitzera racemosa.
The Rhizophera mangroves communities are densest in the lower intertidal zone where they are
inundated on most tides. The Rhizophora communities merge with mainly Ceriops spp., Osbornia
octodonta and Avicenna marina at the landward side. These low mangroves are replaced by Samphire
Forbs, low diversity succulents with special adaptations for growth under conditions with increased salt
concentrations. Mangroves (Ceriops tangal (australis) are diminutive on the dry rubble ridge on the
4 Gibb’s free energy from the main catchments is not included because the estuarine water in the Study Area is
already mixed and about that of sea water. 5 The available nutrients concentration is estimated as the yearly concentration in the volume of water in the Study
Area (Narrows Crossing and Creeks).
55
landward side of Friend Point at or below Highest Astronomical Tide (HAT) and are rarely covered by
tidal water. Near HAT, on sandy substrates, salt couch predominates.
Much of the Study Area appears bare because over most of the year (April-November), sunlight and
dry winds on the salt marsh concentrate shallow tidal water on spring tides causing high temperatures
and evaporation between mean high water and HAT. This salt marsh has high acidity, salinity and low
oxygen levels to which most plants and animals are not adapted. Although productivity declines with
the increasing salt concentrations, there is some primary production in the salt marsh, mainly by cyano-
bacterial mats. The presence of cyano-bacterial mats may be indicative of fertile estuarine waters and
where nutrients and organic matter have also been concentrated by evaporation.
On the seaward side, benthic primary production (BPP) includes seagrasses and associated micro
and macro algae as well as cyano-bacterial production. BPP is mainly by seagrasses: Zostera capricornii,
Halophila ovalis and H. decipens and associated micro and macro-algae (e.g. Caulerpa spp.) especially
in the lower and sub-tidal areas adjacent to Friend and Laird Points (Chartrand, et al, 2010). BPP was
estimated at 10 g dwt m-2 yr-1. Annual assessments show, however, that this habitat is highly variable,
more in relation to PAR (phytosynthetically available radiance) where TSS is high (Chartrand et al,
2010). Seagrasses had all but disappeared in late 2010 after a 50 year flood event but had recovered
somewhat by the end of the growing season in January 2012 (McCormack and Rasheed, 2012). The
other main variables affecting seagrass density include tidal exposure, periodic storm impacts and
grazing.
Phytoplankton primary production is based on the average standing Chla concentration in the
average volume of water in the Study Area (1.2 E+10 J yr-1 (5.9 E+13 sej yr-1)). Phytoplankton may be
an important source of Carbon and nutrients by grazers, either pelagic (mainly zooplankton) and to a
lesser degree by the sparse sedentary filter feeders such as oysters, barnacles and mussels found on the
Curtis Island rocky shoreline. These secondary sources of production, however, are quite low in spite
of the available nutrient concentrations mainly because of the high turbidity.
Detritus
A percentage of the suspended phytoplankton, benthic algae and seagrasses die and also become
part of the detritus pool. Detritus is the accumulation of organic matter, wastes (faeces) from consumers
as well as the bacteria and microorganisms (bacteria, fungi and micro-invertebrates) (M) that feed on
the organic matter and help transform it into detritus. Some detritus is consumed in bacterial respiration
as part of its metabolism. A lot of detritus is assumed to be consumed by benthic macro-fauna, especially
Crabs (C) and some Nekton species (N).
The detritus pool pulses with the seasons. In the dry season, some mangroves respond with increased
leaf falls and seagrasses growth increases with more available light. A feature of the Study Area appears
to be an eddy system driven by wind and tide driven currents that results an accumulation of sediments
mainly suspension muds, organic matter and nutrients into the protected mangrove and marsh areas
mainly via the Creeks. A proportion of this mangrove litter, particularly fruits, are processed directly in
the intertidal areas by specialized mangrove crabs and other species.
There are also larger scale system pulses (cyclones and storms) that periodically disperse detritus
accumulations in the Study Area before the system resets. Some detritus with its associated micro-fauna
is suspended or re-suspended in the water column where a portion may be consumed by filter feeders
and Nekton. A percentage of the detritus and organic matter is lost to the detritus pool by oxidization
from the surface or buried as reduced organic material in the sediments, creating the potential for acid
sulfate soil generation.
Consumers
The four groups of primary producers supply the two major pathway of consumption in the Study
Area: the grazing and detritus consumer pathways. This new Carbon from primary production drives

56
flows of energy and matter through the system and to consumers lumped as Microbes (J6), Zooplankton
(J7) Macro-invertebrate fauna (J8 and J13), Nekton (J10) and X. myoides.
Consumer groups are dominated by macroinvertebrates (3.28 E+16 sej yr-1 and Nexton (4.11 sej
yr-1). Macro-invertebrates (C consumer group) includes about ten common detritus feeding crabs
species: Metopograpsus latifrons, Parasesarma erythodactyla, Australoplax tridentate, Metopograpsus
frontalis, Neosarmatium trisponosum, Scylla serrate, Uca coarctata and Uca spp. and the Pistol Shrimp
(Fam. Alpheidae). The average biomass of this group was estimated from a limited sampling period (3
nights, with 5 duplicate pitfall traps per site (2 total) (GHD unpubl. report, 2015).
The division of producers, according to the manner in which they supply Carbon to consumers is
not mutually exclusive, however, because a portion of macro-phyte Carbon is grazed by benthic macro-
fauna (e.g., Pulmonate snails and mangrove crabs etc.) as well as insects in the mangroves.
Detritus appears to be most important pathway supplying a high quality energy source that supports
the dominant, and dense in places, consumer groups in the Study Area. The distribution of crab species
is limited by tolerance to oxygen levels, excessive salt and other environmental extremes within the
sediments. Burrow estimates suggests that detritus feeding benthic macro-invertebrates abundance is
highest in the densely vegetated areas where crabs burrows are inundated on most tides. Crabs are still
relatively abundant on the sparsely vegetated upper tidal areas, mainly Uca spp., presumably because
detritus is also concentrated here. The resulting zonation may reduce inter-specific competition and
allowing more species to inhabit the intertidal zone.
Other large consumers (S) graze on secondary level microorganisms and filamentous algae
including Pulmonate snails (Mud whelks, Telescopium telescopium and Terebralia spp.). Individuals
from this group were only common in limited areas associated with increased density of benthic micro-
algae and a proportion of benthic primary producers are assumed to be consumed by these grazers. No
data were collected on Zooplankton (Z) although this group, as a main consumer of phytoplankton, is
assumed to be proportionate to phytoplankton concentrations.
Fin-fish and invertebrates comprising the Nexton (N) were observed to move into intertidal areas
with the incoming tide (J10). Nekton is composed mainly of Families Clupeidae, Mugilidae,
Leiognathidae, Penaidae, Ambassidae, Gobidae and Tetraodontidae (Vision Environmen0t, 2011). The
largest component species are Southern herring Herklotsichthys castelnaui (35% total) and the Banana
prawn Fenneropenaeus merguiensis (34%) (Vision Environment, 2011). Total Nekton biomass estimate
of 4.9 E+9 J yr-1 included the average sampled Nekton individual weight (50 g) for Targinnie Creek over
half of the intertidal area of the Study Area and with assumed turnover time of 1 year.
Xeromys myoides
Five X. myoides individuals comprising three juveniles (two males and one female), one sub-adult
male, and one adult female were trapped near mangroves on the eastern side of Targinnie Creek in the
Study Area (The Survey Report, 2011). Radio transmitters were attached to all five animals and two of
the juveniles were relocated during the day within the marine couch (Sporobolus spp.) dominated upper
littoral stream bank. A third juvenile was relocated within a flat mound structure around the roots of a
mangrove Aegiceras corniculatus near the Targinnie Creek stream bank in an area inundated during
spring tides.
The results suggest that a viable population X. myoides occurs in the mangroves to the south of the
pipeline alignment at Targinnie East. The presence of juveniles, a sub adult, and an adult is indicative
of a breeding population in this area. Although it was suspected that the transmitters on the adult and
sub adult came off below ground because of glue failure and making them un-relocatable, the movements
of one of the juveniles was followed over two nights, giving a provisional indication of its home range
(The Survey Report, 2011).
Other X. myoides were previously captured on the opposite steam bank at Targinnie West during
preclearance trapping surveys in the June 2011 (GHD Preclearance survey report, 2011). All of the
57
trapped X. myoides during the targeted surveys were in areas of low Ceriops spp. in an area adjacent to
low but very dense Rhizophora stylosa along Targinnie Creek. 6
The survey results also suggest that there is no X. myoides population at the Curtis Island Study
Area because of the lack of suitable habitat. It is also considered highly unlikely that a viable population
of X. myoides will be found in the mangroves within or immediately adjacent to the alignment at Humpy
Creek and Friend Point because of the poor quality habitat (The Survey Report, 2011). As with the
Targinnie Creek sites, the trapping intensity at these sites was considered sufficient to intercept and
capture any resident or mobile animals (The Survey Report, 2011).
Although no X. myoides nesting structures were positively identified during the field surveys, salt
couch at the supra-littoral limits (above HAT) with steep banks may be an important geo-morphological
feature for X. myoides contending with large tidal ranges (The Survey Report, 2011). This feature may
provide below ground nesting opportunities for the species away from competitors while remaining
within distance of the main foraging grounds near mangrove habitat.
There may be some competition for prey item between X. myoides with crab eating fish species,
particularly species of Tetradontidae, that move into its foraging habitat as soon as the rising tide permits.
Downward pressure on the mainly nocturnal X. myoides from higher level consumers such as
Frogmouths (Podargus strigoides), snakes and feral species (dogs, foxes and cats are common from
tracks left on the marshlands) and raptors. All are intermittent visitors to the Study Area and are shown
in a box on the right of the systems diagram. Feral Pigs may also destroy nesting structures at the upper
tidal limits.
DISCUSSION
The results of X. myoides radio tracking showed it was active mainly at night in borrows and over
the ground following the tide and hunting for prey items. Although the amount of tracking data was
limited, prior studies indicate X. myoides covers up to 3 km a night while criss-crossing home ranges
averaging 0.7ha (Gynther and Janetzki 2008). Home range estimates by Van Dyck (1996) suggested
animals had an average home range of 0.64ha (1996) and is along the lines of the estimate for 1 juvenile
of approximately 0.35ha (The Survey Report, 2011). These results suggests that X. myoides home range
may be much less compared to the home range for terrestrial species of rodent of similar size (estimated
at 5-7 hectares as extrapolated from Holling, C. S. 1992).
X. myoides, by specializing in relatively large pretty items with longer turnover times may also
provide a buffer against the system pulses from the larger scale related to seasonal variations in rainfall
as well as cyclones. The limited X. myoides range may be linked to the quality of its habitat and the
abundance of diverse prey species. The locations where it was trapped has mainly stiff to soft clays with
many crab burrows. Based on crab abundance, Grapsid crab species form a major component of the prey
items for X. myoides in the Study Area. X. myoides enters traps with pilchards (fish) and presumably
scavenges on fish left by the tide as well. In the systems diagram, diverse prey items were lumped in
consumer groups (C, S) are drawn as converging trophic levels, 1.5-2 levels above auto-trophs on X.
myoides as well as some other species of higher consumers (Nekton).
Suitable nest building areas adjacent to foraging grounds appears to be important determine the
presence of X. myoides. With the incoming tide and foraging grounds are submerged, X. myoides may
retreat to higher ground with salt couch (Sporobolus virginicus) although no confirmed nests were found
during the surveys. Low oxygen levels and excessive salt in the sediments associated with the blue green
algal mats lies between X. myoides capture sites and potential nesting habitat above HAT. This saltpan
has limited prey species except immediately adjacent to areas of Samphire Forbes where there are many
crabs feeding and burrowing (particularly Fiddler crabs). This suggests that the quality of prey items
here more than compensates for the challenges to X. myoides from by high tidal ranges in Port Curtis.
6Targinie Creek (west) from the preclearance surveys (GHD Report 2011).
58
Although the Curtis Island section of the Study Area has a narrower intertidal area because of the
rocky foreshore morphology, the open mangrove community (mainly tall Rhizophora) has a generally
lower density of crab borrows and is adjacent to open bushland, This fact, as well as an abundance of
foraging ants and proximity to potential terrestrial competitors suggested this area was unfavourable to
X. myoides.
In spite of apparently suitable habitat adjacent to Humpy Creek, no X. myoides were captured here.
Although Humpy Creek has habitat features apparently suitable to X. myoides including fresh water7 is
not at the spatial centre (‘upstream’ on a lower Order stream) and may contain other potential
competitors such as littoral rodents (for example Rattus spp. and Melomys spp.), and owls with
large territories overlapping with X. myoides habitat8.
So what contribution does X. myoides make to the estuarine system to which it has become
specialized? The annual work done by X. myoides as basal metabolism estimate given for a Rodent
of similar size, for example, is small compared to flows through the system, a Joule of work by X.
myoides, performs a very different function within the ecosystem (does a different kind of work)
than a Joule of work done in Carbon fixation by seagrasses, for example.
X. myoides by consuming species at higher trophic levels of the Study Area, eats prey that are not
so different in chemical composition to itself, allowing a degree of flexibility in prey species (Odum,
2007). The convergence of different prey species to the X. myoides is significant as it represents a greater
diversity of chemical molecules supplying more complex nutrition which these small mammals are
evolved. The high energy nutrition from invertebrates allows more complex functions, rapid movements,
elaborate behavioral adaptations including social systems of organisation, the details of which are still
largely unknown in Port Curtis.
The presence of juveniles, a sub adult, and an adult is indicative of a breeding population in the
Study Area (Survey Report, 2012). The water mouse’s well developed social structure of a dominant
male, several females and offspring reported elsewhere (van Dyke, 1996) may be favourable because
prey items are fairly large and concentrated. It may also be a factor that permits the females to be in
breeding condition through the year.
X. myoides, as it moves rapidly over the mud flats, quickly removes any senescent crabs, fish or
larger invertebrates before fish can arrive on the proceeding tide. This allows for tighter nutrient cycling
within its home range. With prey selector programming, it may shift from one species to another if any
one species to another if any species becomes too numerous. Thus, the X. myoides family group may
exert a degree of system control far greater than its numbers suggest.
CONCLUSIONS
An energy systems model was used in this Article to integrate field sampling and observations with
some available data for Port Curtis to get a better overall picture of habitat preference and ecology of X.
myoides. This method of environmental accounting used to help sort out the relative contributions of the
various energy sources of different kinds to the support the productivity and ecological organization in
the Study Area. To help accomplish this, the physical basis for biological support for X. myoides was
undertaken by constructing and evaluating an energy systems model of this estuarine ecosystem. It is
7 Fresh water in Humpy Creek is mainly by surfical groundwater inflows as the Creek itself is ephemeral and flows
only after rain events. X. myoides is reported to obtain its water mainly from its prey items elsewhere (Van Dyke,
1996) and the Survey results in this Article suggests the same is true is Port Curtis. 8 Of greater concern for the species is the introduction of feral animals notably cats, dogs, foxes and pigs. Many
feral species tracks were observed over the salt marshes and these animals appear to cover long distances over the
Study Area in search of food.

59
used to trace the energy supplied by the forcing functions, i.e., solar radiation, tide, wind, waves and
nutrients, expressed in the same units (i.e., Joules per year), making them directly comparable.
The findings showed that Port Curtis, as a part of a first order embayment of the Coral Sea, the
Study Area has received extraordinary inflows of energy from the land and sea for the last 4 to 7 thousand
years over which time the area was slowly inundated and in-filled by Holocene sediments. This large
convergence of nature’s energies course through the system and supports a diverse system of life
with dense, in patches, sources of plant production.
The interplay between climate, geomorphology and hydrology influences the composition (variety
and abundance) and the configuration (spatial arrangement) of habitats found within the Study Area.
This, in turn, is likely to be a key determinant of the types and rates of organic matter production and
transmission. Within the Study area, the most important in terms of Carbon production is the closed
mangrove communities in the lower intertidal areas. Although seagrass communities, phytoplankton,
salt marshes and macro-benthic communities also contribute to the basis for a diverse web of life, it is
less than anticipated based on the available nutrients and likely due to year round high turbidity.
Recent modelling of sediment plumes suggest that retention times for water within Port Curtis is
quite long (Apasa, 2012) and that tidal flows from the Narrows enter Targinnie and Humpy Creeks
before spilling over the banks and flooding a broad, shallow salt marsh on higher tides before retreating
into the Creeks and through channels at Friend Point. This process is facilitated by eddies from the strong
macro-tidal currents of Port Curtis in the Creeks section of the Study Area (Apasa 2012). Although only
limited data is currently available on the fate of organic matter and nutrients in the Port, there is prima
facie evidence from sediment analysis of a net accumulation, concentration and processing of organic
matter sediments and nutrients within the intertidal Creek and Salt marsh areas of the Study Area.
In the upper tidal areas, nutrients and detritus concentrated from tides and favours microbial
respiration close to the surface of the salt tolerant cyano-bacterial mats releasing re-mineralized
nutrients. The nutrient outflow from this zone by tides and run-off, in turn, may reinforce photosynthetic
production downstream in mangroves and seagrasses. Here, photosynthetic production may be further
reinforced by workings of Grapsid and Uca crabs species as well as other macro-invertebrates that
increases the vertical extent of oxygenation under the vegetation as well as flushing excess salt and
acidity (Wolanski et al. 2005).
Such bio-turbation ventilates the sediments and pore water facilitating oxygen inflows, reinforcing
microbial respiration and the release of critical nutrients for use by mangrove roots and stimulating
primary production across a larger expanse of the intertidal zone than otherwise might be possible. This
pattern appears to be an example of self organisation of energy to maximize production over broad
intertidal areas.
Another observation is that the areas of highest energy transformation by maintaining the abundant
prey items within the Study Area appears to favour X. myoides. This pattern appears to be consistent
with principles of system organization with energy converging in spatial centres, supporting small
numbers of specialized species from where they exert significant feedback by over a much larger area.
Thus power in an ecosystem network is a measure of the complexity of organization and of the
expected competitiveness of the ecosystem or an ecosystem component in the evolutionary process
(Lotka 1922, Odum 1996)9. In general, network power would be expected to increase with increases in
species richness, the complexity of interactions among species, and total energy flow through the
network. Species and interactions change within ecosystems over time to adjust to the changes in inputs
under the imperative to maximize power under the new conditions, a scenario for which X. myoides
appears to be well suited.
9This refers mainly to a measure of Energy quality (Emergy). These three factors must be considered together to
determine the power of alternate system designs. Ecological processes are expected to interact and evolve over time
toward ecosystem designs that produce higher power states (Odum 1996), assuming that the suite of forcing
functions (emergy signature) supplying the emergy base for the system remains the same.
60
REFERNCES
Alquezar, R and Scannell, J. Fish Habitat Assessment of The Narrows Pipeline Crossing (Unpubl
Report to QGC) 2010.
APASA Narrows Crossing Dredge Plume Modelling_FINAL.docx Unpubl. Report to QGC 2012.
Ball, D (2004). Distribution and Habitat of the Water Mouse, Xeromys myoides Thomas, 1889
(Rodentia: Muridae) in Intertidal Areas of Central Eastern Queensland. Memoirs of the Queensland
Museum. 49 part 2. Brisbane.
Brown, M.T., and E. Bardi. 2001. Handbook of Emergy Evaluation: Folio #3 Emergy of
Ecosystems. Center for Environmental Policy, Environmental Engineering Sciences,
University of Florida, Gainesville, FL. 93 pp.
Campbell, D.E. 2000. Using Energy Systems theory to define, measure, and interp ret ecological
integrity and ecosystem health. Ecosystem Health 6:181–204.
Campbell, D.E. Evaluation and AEmergy Analysis of the Cobscook Bay Ecoystems Northeastern
Naturalist 11 2004.
Carruthers, TJB, Dennison, WC, Longstaff, BJ, Waycott, M, Abal, EG, McKenzie, LJ and Lee Long,
WJ 2002, ‘Seagrass habitats of northeast Australia: models of key processes and controls’, Bulletin
of Marine Science 71, 1153–1169.
Chartrand, K.M., McKenna, S.A., Petrou, K., Jimenez-Denness, I., Franklin, J., Sankey, T.L.,
Hedge, S.A., Rasheed, M.A. and Ralph, P.J. (2010) Port Curtis Benthic Primary Producer
Habitat Assessment and Health Studies Update: Interim Report December 2010. DEEDI
Publication. Fisheries Queensland, Cairns, 128 pp.
Commonwealth of Australia Background Paper to EPBC Act Policy Statement 3.20 - Significant
impact guidelines for the vulnerable water mouse Xeromys myoides.
Connolly RM, Guest MA (2004) Critical estuarine habitats for food webs supporting fisheries in Port
Curtis, central Queensland, Australia. Cooperative research centre for coastal zone, estuary and
waterway management, p 25.
Connolly RM, Currie DR, Danaher KF, Dunning M, Melzer A, Platten JR, Shearer D, Stratford
PJ, Teasdale PR & Vandergragt M (2006) Intertidal wetlands of Port Curtis: ecological
patterns and processes, and their implications. Technical Report No. 43, CRC for Coastal
Zone, Estuary and Waterway Management, Brisbane, Department of Environment and Resource
Management (2009a).
GHD Mangrove rehabilitation, The Narrows Report to QGC, 2015.
Golder Associates, 2010, Geotechnical Report, QCLNG Narrows Crossing Pipeline, Marshland Section
Geocoastal Report on Sedimentary Unpubl Report, 2010
Herzfeld, M., J., Andrewartha, P. Sakov and I. T. Webster. 2006. Numerical hydrodynamic modelling
of the Fitzroy Estuary. CSIRO Land and Water.
Holling, C. S. 1992. Cross-scale morphology, geometry, and dynamics of ecosystems. Ecological
Monographs 62: 447-502.
Lotka, A.J. 1922. Contribution to the energetics of evolution. Proceedings of the National
Academy of Science 8:147–155.
McCormack, C.V. and Rasheed, M. A. Gladstone Permanent Transect Seagrass Monitoring,
DEEDI Report unpubl. 2012.
National recovery plan for the water mouse (false water rat) Xeromys myoides. Report to Department of
the Environment, Water, Heritage and the Arts, Canberra. Department of the Environment and
Resource Management, Brisbane.
Odum , H. T. 2007 Environment, Power and Society for the Twenty first Century, The Hierarchy
of Energy Columbia Uni Press.
Odum, E.P. 1980. The status of three ecosystem-level hypotheses regarding saltmarsh estuaries:
Tidal subsidy, outwelling, and detritus-based food chains. Pp. 485–495, In V. Kennedy (Ed.).
Estuarine Perspectives. Academic Press, New York, NY.

61
Odum, H.T. 1994. Ecological and General Systems: An Introduction to Systems Ecology.
University Press of Colorado, Niwot, CO. 644 pp.
Odum, H.T. 1995. Self-organization and maximum power. Pp. 311–330, In C.A.S. Hall (Ed.).
Maximum Power, the Ideas and Applications of H.T. Odum. University of Colorado Press,
Niwot, CO.
Odum, H.T. 1996. Environmental Accounting: Emergy and Environmental Decision Making. John
Wiley and Sons, New York, NY. 370 pp.
Van Dyck, S. & E. Durbidge (1992). A nesting community of false water rats (Xeromys myoides
on the Myora sedgelands, North Stradbroke Island. Memoirs of the Queensland Museum.
32:374.
Van Dyck, S. & I. Gynther (2003). Nesting strategies of the Water Mouse Xeromys myoides in
southeast Queensland. In: Memoirs of the Queensland Museum 49(1):453-479.
Van Dyck, S. (1996). Xeromys myoides Thomas, 1889 (Rodentia: Muridae) in mangrove
communities of North Stradbroke Island, southeast Queensland. Memoirs of the Queensland
Museum. 42:337-366.
Vision Environment (2012) Fish Habitat Assessment, The Narrows Fish Assessment Report for
QGC (unpubl.).
Vision Environment (2012) Narrows Water Quality Assessment Report for QGC (unpubl.).
Woinarski, J., Pavey, C., Kerrigan, R., Cowie, I., and Ward, S (2007). Lost from our Landscape:
Threatened Species of the Northern Territory, NT Government Printer, Darwin, NT.
Wolanski E, Yoshihiro M, Furukawa K, Ridd P, Kitheka J, Spagnol S & Stieglitz T (2005) Water
circulation in mangroves, and its implications for biodiversity. Australian Institute of Marine
Science, Townsville.
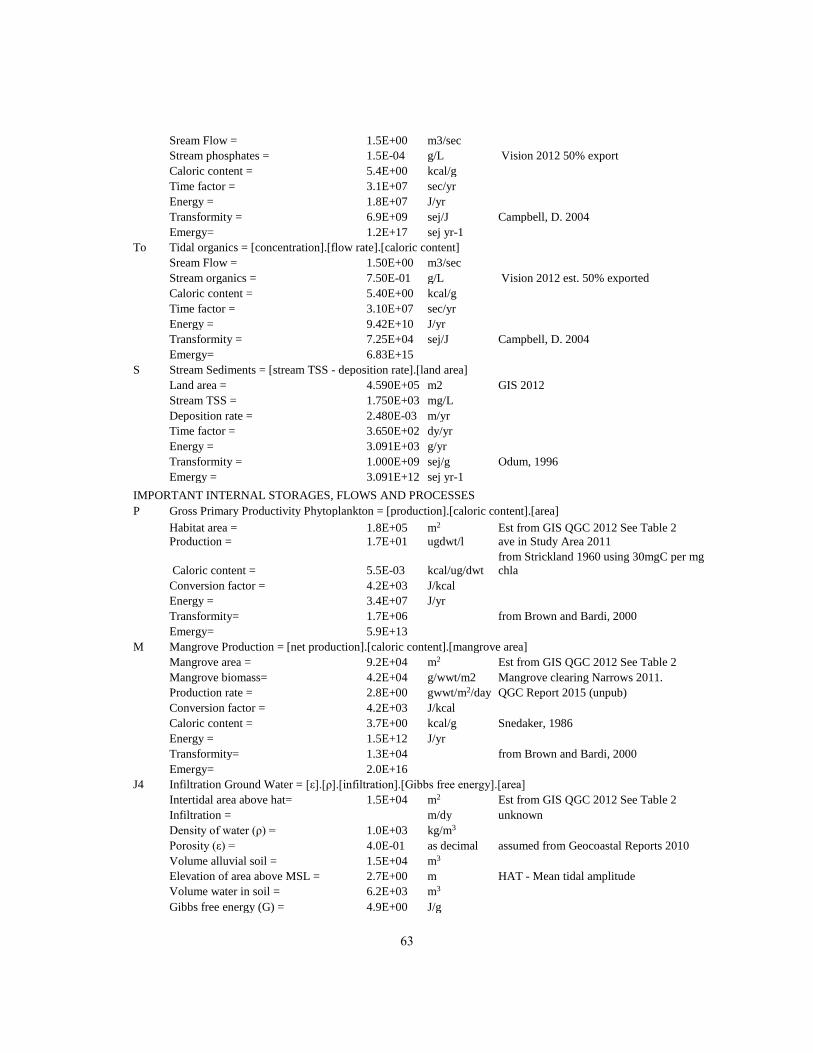
APPENDIX: NOTES FOR TABLE 1
RENEWABLE INPUTs
No. Diagram R1-R2 Solar Energy = [1- albedo].[solar intensity].[total area]
Study area = 4.6E+05 m2 QGC GIS 2012
Solar exposure = 1.9E+01 MJ/m2/day 8.E+04
Albedo = 2.0E+01 % Assumed
Energy = 2.6E+17 J/yr 5.6E+11
Transformity 1.0E+00 Definition
Nr Run-off Chemical Potential = [ρ].[Gibbs free energy][land area].[run-off coefficient land area]
Study area = 4.6E+05 m2 est. QGC GIS 2012
Density of water (ρ) = 1.0E+03 kg/m3 Gibbs free energy (G) = 4.7E+00 J/g Time factor = 3.1E+07 s/yr Run-off chemical potential Energy = 1.2E+12 J/yr
Transformity = 5.0E+04 sej J-1 Cambell 2004 (9.26E24 sej y-1 baseline)
Emergy= 6.0E+16 sej yr-1 Nr Rain Chemical Potential = [ρ].[rainfall].[Gibbs free energy]
Study area = 4.6E+05 m2 QGC GIS 2012
Rainfall = 8.5E-01 m/yr See Table 2
Average Run-off 3.5E-01 decimal from BOM for Gladstone accessed 2013.
Density of water (ρ) = 1.0E+03 kg/m3 See Table 2
Gibbs free energy (G) = 4.9E+03 J/kg for est. 10 ppm rain
Energy = 1.9E+12 J/yr
Total Chemical Potential Energy = 1.9E+12 J/yr
Transformity= 1.8E+04 sej yr-1 Campbell, D. 2004

62
Emergy= 3.5E+16 sej/yr R1 Run-off Geopotential = [ρ].[g].[stream flow rate].[elevation change]
Study area = 4.6E+05 m2 See Table 2
Density of water (ρ) = 1.0E+03 kg/m3 average run-off 35% rainfall (BOM)
Change in elevation (ΔH) = 1.0E+00 m QGC GIS 2012
Gravity constant (g) = 9.8E+00 m/s2 Time factor = 3.1E+07 s/yr assume run-off 1 month of the year
Energy = 2.5E+09 J/yr
Emergy = 7.0E+13 J/yr
Transformity= 2.8E+04 J Wind Energy = [ρ].[drag coeffecient].[wind velocity]3.[total study area]
Study area = 4.6E+05 m2 QGC GIS 2012
Density of air (ρ) = 1.2E+00 kg/m3 Velocity of wind = 4.2E+00 m/s See Table 2
Drag coefficient (CD) = 1.0E-03 Time factor = 3.1E+07 s/yr Energy = 1.3E+12 J/yr
Transformity= 1.5E+03 Campbell, D. 2004
Emergy= 1.9E+15 sej yr-1
Cyclone Wave Energy = [α].[ρ].[g].[Shore Area].[velocity].[wave height]2
Shore area = 1.4E+03 m est. wave impact width 10 m (See Table 2)
Mean wave height = 1.5E+00 m est from max wave height 3 m QGC sEIS
2010 Average velocity of hurricane wave = 6.0E+00 m/s Odum, 1996
Density of sea water (ρ) = 1.0E+03 kg/m3 See Table 2
Gravity constant (g) = 9.8E+00 m/s2
Absorbed (α) = 1.3E-01 as percent from Odum, 1996
Time factor = 1.2E+04 seconds
Ass 1 cycl in 7 yrs (BOM) for 1 day
(Odum, 1983)
Energy = 3.0E+12 J/yr
Transformity= 3.0E+04 3.000E+04 Campbell, D. 2004
Emergy= 8.9E+16 sej yr-1
Td Tidal Energy (geopotential) = [estuary habitat area]*1/2 [α].[ρ].[g].[tide range]2.[number tides per year]
Intertidal area = 3.5E+05 m2 See Table 2
Average Tide range = 3.3E+00 m See Table 2
Density of sea water (ρ) = 1.0E+03 kg/m3 See Table 2
Number Tides = 7.1E+02 tides year BOM, 2012
Gravity constant (g) = 9.8E+00 m/s2 Absorbed (α) = 6.3E-01 as decimal assumed
Energy = 1.7E+13 J/yr
Transformity= 2.4E+04 from Campbell, 2004
Emergy= 4.2E+17 sej yr-1
Nt Tide Nitrogen = [concentration].[flow rate].[caloric content]
Usable Nitrogen concentration = 9.9E+04 ug m-3 for Narrows yearly ave (See Table 2)
Stream volume = 1.5E+00 m -3 Est from GIS QGC 2012 See Table 2
Caloric content = 5.4E-06 kcal/ug Conversion factor = 4.2E+03 J/kcal Energy = 1.0E+08 J/yr
Transformity= 4.8E+08 from Campbell, 2004
Emergy= 5.0E+16 sej yr-1
N Total usable N in water and soils #REF! mg m-3 P Stream Phosphates = [stream P]*[flow rate]*[Cal.]
63
Sream Flow = 1.5E+00 m3/sec
Stream phosphates = 1.5E-04 g/L Vision 2012 50% export
Caloric content = 5.4E+00 kcal/g
Time factor = 3.1E+07 sec/yr
Energy = 1.8E+07 J/yr
Transformity = 6.9E+09 sej/J Campbell, D. 2004
Emergy= 1.2E+17 sej yr-1 To Tidal organics = [concentration].[flow rate].[caloric content]
Sream Flow = 1.50E+00 m3/sec
Stream organics = 7.50E-01 g/L Vision 2012 est. 50% exported
Caloric content = 5.40E+00 kcal/g
Time factor = 3.10E+07 sec/yr
Energy = 9.42E+10 J/yr
Transformity = 7.25E+04 sej/J Campbell, D. 2004
Emergy= 6.83E+15 S Stream Sediments = [stream TSS - deposition rate].[land area]
Land area = 4.590E+05 m2 GIS 2012
Stream TSS = 1.750E+03 mg/L
Deposition rate = 2.480E-03 m/yr
Time factor = 3.650E+02 dy/yr
Energy = 3.091E+03 g/yr
Transformity = 1.000E+09 sej/g Odum, 1996
Emergy = 3.091E+12 sej yr-1
IMPORTANT INTERNAL STORAGES, FLOWS AND PROCESSES
P Gross Primary Productivity Phytoplankton = [production].[caloric content].[area]
Habitat area = 1.8E+05 m2 Est from GIS QGC 2012 See Table 2
Production = 1.7E+01 ugdwt/l ave in Study Area 2011
Caloric content = 5.5E-03 kcal/ug/dwt
from Strickland 1960 using 30mgC per mg
chla
Conversion factor = 4.2E+03 J/kcal
Energy = 3.4E+07 J/yr
Transformity= 1.7E+06 from Brown and Bardi, 2000
Emergy= 5.9E+13 M Mangrove Production = [net production].[caloric content].[mangrove area]
Mangrove area = 9.2E+04 m2 Est from GIS QGC 2012 See Table 2
Mangrove biomass= 4.2E+04 g/wwt/m2 Mangrove clearing Narrows 2011.
Production rate = 2.8E+00 gwwt/m2/day QGC Report 2015 (unpub)
Conversion factor = 4.2E+03 J/kcal Caloric content = 3.7E+00 kcal/g Snedaker, 1986
Energy = 1.5E+12 J/yr
Transformity= 1.3E+04 from Brown and Bardi, 2000
Emergy= 2.0E+16 J4 Infiltration Ground Water = [ε].[ρ].[infiltration].[Gibbs free energy].[area]
Intertidal area above hat= 1.5E+04 m2 Est from GIS QGC 2012 See Table 2
Infiltration = m/dy unknown
Density of water (ρ) = 1.0E+03 kg/m3 Porosity (ε) = 4.0E-01 as decimal assumed from Geocoastal Reports 2010
Volume alluvial soil = 1.5E+04 m3 Elevation of area above MSL = 2.7E+00 m HAT - Mean tidal amplitude
Volume water in soil = 6.2E+03 m3 Gibbs free energy (G) = 4.9E+00 J/g
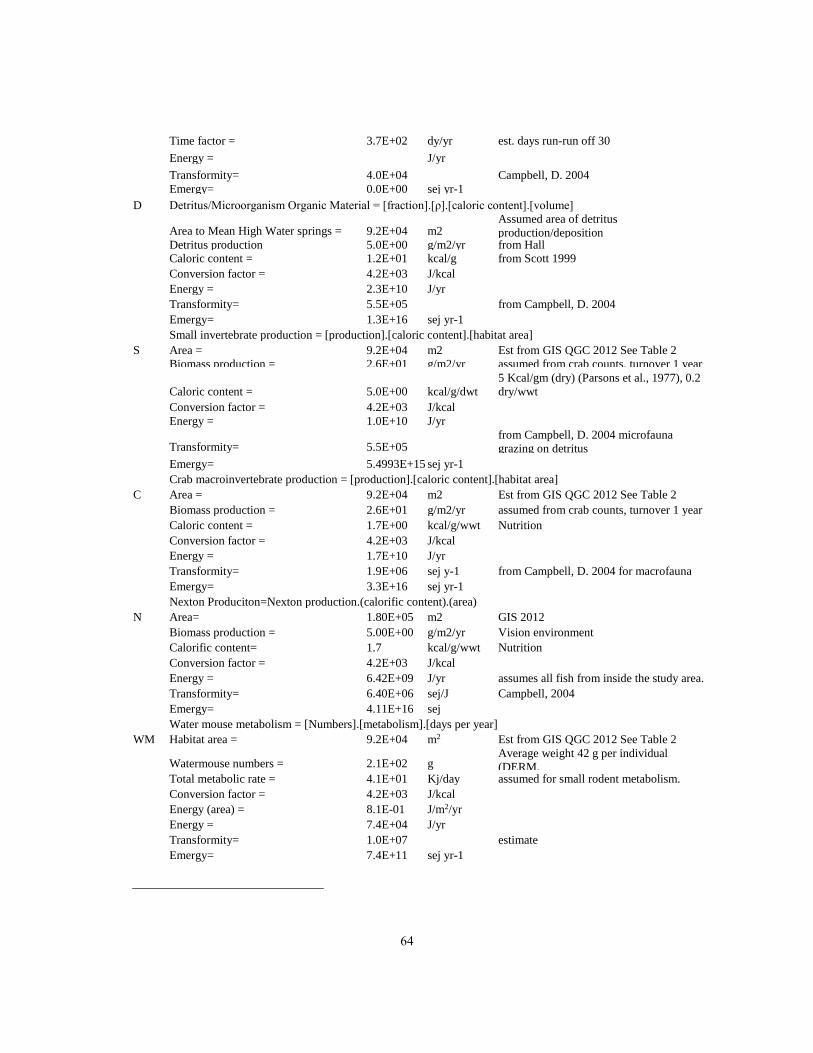
64
Time factor = 3.7E+02 dy/yr est. days run-run off 30
Energy = J/yr
Transformity= 4.0E+04 Campbell, D. 2004
Emergy= 0.0E+00 sej yr-1
D Detritus/Microorganism Organic Material = [fraction].[ρ].[caloric content].[volume]
Area to Mean High Water springs = 9.2E+04 m2 Assumed area of detritus
production/deposition Detritus production 5.0E+00 g/m2/yr from Hall Caloric content = 1.2E+01 kcal/g from Scott 1999
Conversion factor = 4.2E+03 J/kcal Energy = 2.3E+10 J/yr Transformity= 5.5E+05 from Campbell, D. 2004
Emergy= 1.3E+16 sej yr-1
Small invertebrate production = [production].[caloric content].[habitat area]
S Area = 9.2E+04 m2 Est from GIS QGC 2012 See Table 2
Biomass production = 2.6E+01 g/m2/yr assumed from crab counts, turnover 1 year
Caloric content = 5.0E+00 kcal/g/dwt
5 Kcal/gm (dry) (Parsons et al., 1977), 0.2
dry/wwt
Conversion factor = 4.2E+03 J/kcal
Energy = 1.0E+10 J/yr
Transformity= 5.5E+05
from Campbell, D. 2004 microfauna
grazing on detritus
Emergy= 5.4993E+15 sej yr-1
Crab macroinvertebrate production = [production].[caloric content].[habitat area]
C Area = 9.2E+04 m2 Est from GIS QGC 2012 See Table 2
Biomass production = 2.6E+01 g/m2/yr assumed from crab counts, turnover 1 year
Caloric content = 1.7E+00 kcal/g/wwt Nutrition
Conversion factor = 4.2E+03 J/kcal
Energy = 1.7E+10 J/yr
Transformity= 1.9E+06 sej y-1 from Campbell, D. 2004 for macrofauna
Emergy= 3.3E+16 sej yr-1
Nexton Produciton=Nexton production.(calorific content).(area) N Area= 1.80E+05 m2 GIS 2012
Biomass production = 5.00E+00 g/m2/yr Vision environment
Calorific content= 1.7 kcal/g/wwt Nutrition
Conversion factor = 4.2E+03 J/kcal
Energy = 6.42E+09 J/yr assumes all fish from inside the study area.
Transformity= 6.40E+06 sej/J Campbell, 2004
Emergy= 4.11E+16 sej
Water mouse metabolism = [Numbers].[metabolism].[days per year]
WM Habitat area = 9.2E+04 m2 Est from GIS QGC 2012 See Table 2
Watermouse numbers = 2.1E+02 g Average weight 42 g per individual
(DERM,
Total metabolic rate = 4.1E+01 Kj/day assumed for small rodent metabolism.
Conversion factor = 4.2E+03 J/kcal
Energy (area) = 8.1E-01 J/m2/yr
Energy = 7.4E+04 J/yr
Transformity= 1.0E+07 estimate
Emergy= 7.4E+11 sej yr-1