systems analysis and modeling – biomass scenario · pdf file ·...
TRANSCRIPT

Systems Analysis and Modeling – Biomass Scenario Model
Emily Newes National Renewable Energy Laboratory
This presentation does not contain any proprietary, confidential, or otherwise restricted information
March 7, 2017 Bioenergy Technology Office (BETO) Analysis Platform Review

2
Goal Statement
Inform stakeholders, management, and policy-makers of the implications of policy choices and market developments to enable prioritization and evaluation of various actions and enable researchers to design and analyze the impacts of additional biomass-to-biofuels scenarios.
• Outcomes: o Understand the transition dynamics to a bioeconomy o Generate scenarios for prospective policies, incentives, investments, R&D
impacts, and strategies o Enable and facilitate focused discussion among stakeholders.
• Relevance: o Explore different strategies to directly provide context and justification for
decisions at all levels o Provide a bridge for analytic collaboration between BETO and other
bioenergy stakeholders.

3
• Timeline o Started October 2006 o Current funding scope FY2015-
FY2017 o Ongoing project subject to annual
DOE approval
Quad Chart Overview
• Barriers o Comparable, Transparent, and
Reproducible Analysis [MYPP At-A] o Analytical Tools and Capabilities for
System-Level Analysis [MYPP At-B] o Data Availability [MYPP At-C]
• Partners o Project Lead: NREL Systems
Engineering & Program Integration Office
o Modeling & Analysis Support: Lexidyne LLC
o Subject-Matter Expertise: o DOE Laboratories
(especially ORNL, INL, PNNL, ANL) o Issue-focused subcontracts o Federal Agencies (DOE, FAA, USDA,
EPA) o Other stakeholders (universities
[ASCENT], CARB, Airlines for America)
Total Costs FY 12 –FY 14
FY 15 Costs
FY 16 Costs
Total Planned Funding (FY 17)
DOE Funded
$2550k $1000k $1100k $1100k
Project Cost Share (Comp.)
0 0 0 0

4
The Biomass Scenario Model (BSM) is a system dynamics model of the domestic biofuels supply chain.
Project Overview - History
Characterized as… • Unique • Validated • State-of-the-art • Fourth-generation.
Developed to help understand… • Under what conditions biofuel
technologies might be deployed • Trade-offs • Bottlenecks • Impacts of actions in one part of supply
chain on other parts of the supply chain.

5
Inform stakeholders, management, and policy-makers of the implications of policy choices and market developments to enable prioritization and evaluation of various actions and enable researchers to design and analyze the impacts of additional biomass-to-biofuels scenarios.
Project Overview Collaborative System Dynamics Model of the Bioenergy Supply Chain
ModelingBuild Numbers
InputsVariables
Req
uire
men
ts/N
eeds
Ana
lysi
s
Scenario Design
RunsStudies
Data Preparation
Data sources, ProvenanceExtract, Load, Transform
Simulation Ex ploratory Analysis
Visualization and Reporting
QA/QC
Sta
keho
lder
s
• Stakeholder engagement • Publications and datasets.
• Interactive results visualization • Analyses providing insights
into system behavior and policy effectiveness taking into account transition dynamics.
• Model release • Public scenario browser.

6
Management Approach Increased Collaboration since 2015
Bioenergy Viewer
External Collaborations • Analysis with FAA • Streamlined link with ANL’s Bioeconomy AGE model • Increased collaboration on model inputs with ORNL, INL, and PNNL.
Scenario Analysis with BETO • Worked interactively with BETO
to explore areas of interest • Working groups (BETO + labs) to
refine model inputs/logic and explore scenarios of interest to BETO
• Contribution to MYPP for Analysis and DMT
• Interactive scenario exploration in 3D.
Public Access • Public model release • Results on KDF • Bioenergy Browser.

7
Technical Approach Key Characteristics of BSM Modules
Source: MYPP

8
Technical Approach Key Characteristics of BSM Modules
Source: MYPP

9
• Reliance on appropriate and well established modeling techniques
• Careful consideration of level of detail.
Technical Approach System Dynamics Model of the Bioenergy Supply Chain

10
• Emphasis on a flexible development process with stakeholder feedback
• State-of-the-art approach to reproducibility and quality
• Sophisticated information architecture to enable inventorying and mining of results.
Technical Approach Comparable, Transparent, and Reproducible Analysis
PostgreSQL©
GitHubRepository
Output data in CSV format
STELLA® Professional
Input data in CSV format
Report
Zotero
Model File for Batch runs
Model File for Interactive runs
Microsoft Office
Access
Tableau®
SQL Client
List of Equations
Stella Parse
Build Numbers
Interactive runs on single machine
Batch runs on single machine
Batch runs on high performance computing clusterR, ArcGIS®,
Other
11
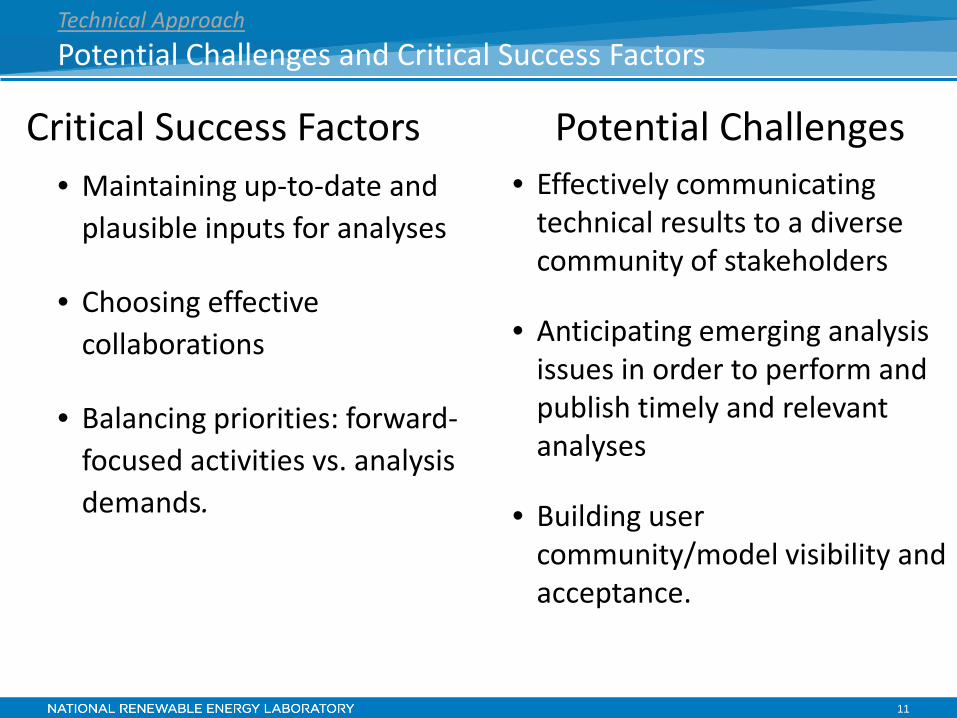
• Maintaining up-to-date and plausible inputs for analyses
• Choosing effective collaborations
• Balancing priorities: forward-focused activities vs. analysis demands.
Technical Approach Potential Challenges and Critical Success Factors
Critical Success Factors Potential Challenges • Effectively communicating
technical results to a diverse community of stakeholders
• Anticipating emerging analysis issues in order to perform and publish timely and relevant analyses
• Building user community/model visibility and acceptance.

12
• Impactful analyses o Informed DOE and FAA aviation biofuel goals o Visualized and communicated impact on BETO strategy o Explored scenarios of biofuels penetration in marine applications o Identified conversion and feedstock coupling impacts on the biofuel industry
• Sensitivity analysis on over 100 model parameters
• Development of user-accessible visualization platform o Created collaborative virtual/augmented reality for the BSM o Published on ORNL’s BioEnergy KDF o Produced beta version of interactive scenario library browser with direct connection to BSM data
infrastructure and access control
• Model development to meet analysis needs o Incorporated biodiesel and alcohol to jet (conversion technologies) and fats, oils, and greases (feedstock) o Built biogas model (in collaboration with EPA) was continued as separate Waste to Energy System Simulation
(WESyS) model o Established dynamic interaction with the Automotive Deployment Options Projection Tool (ADOPT) allowing
co-optimization of fuels and engines o Updated techno-economics, feedstock logistics (with INL), and other data
– Data updated to be consistent with Billion Ton Study 2016
o Convened cross-Lab / BETO working group to review and update assumptions within the conversion module reflecting learning and scale-up.
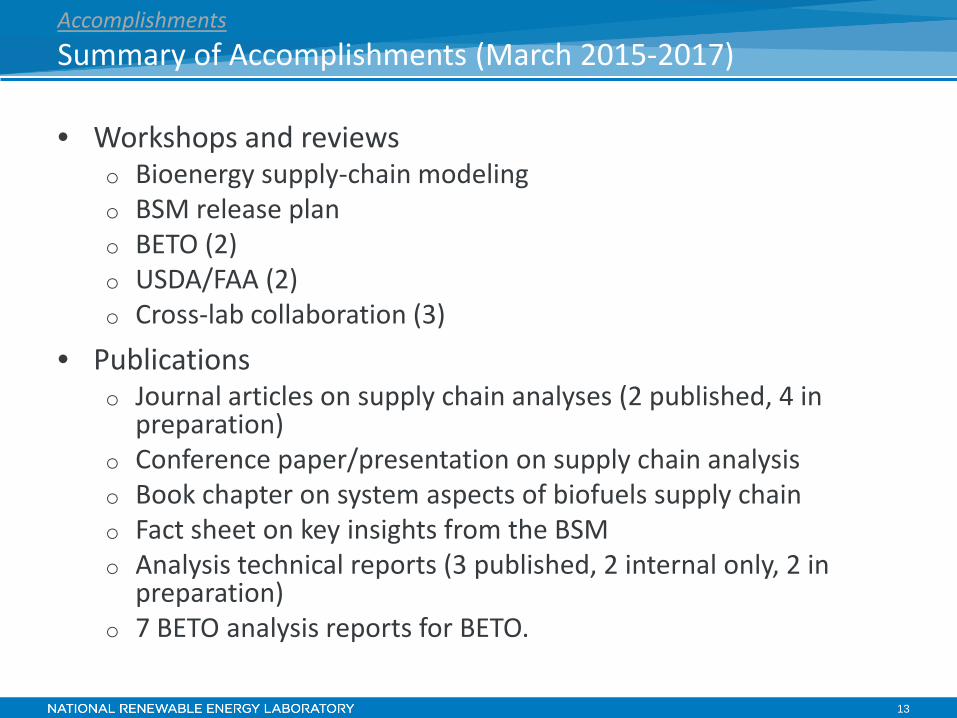
Accomplishments Summary of Accomplishments (March 2015-2017)
13
• Workshops and reviews o Bioenergy supply-chain modeling o BSM release plan o BETO (2) o USDA/FAA (2) o Cross-lab collaboration (3)
• Publications o Journal articles on supply chain analyses (2 published, 4 in
preparation) o Conference paper/presentation on supply chain analysis o Book chapter on system aspects of biofuels supply chain o Fact sheet on key insights from the BSM o Analysis technical reports (3 published, 2 internal only, 2 in
preparation) o 7 BETO analysis reports for BETO.
Accomplishments Summary of Accomplishments (March 2015-2017)

14
Accomplishments BSM Analysis Informs DOE Goals for Aviation Biofuels
Baseline = $0.50/RIN; tax credit extension and 80% loan guarantee for first billion gallons of total production; AEO 2015 Reference Case
Increasing Policy In
crea
sing
Dire
ct In
vest
men
t Analysis suggests six billion gallons of aviation biofuel in 2030 is possible. • Presented to Secretary Moniz

15
Accomplishments BSM Analysis Helps FAA to Reconsider Goals
With current conditions continuing, 1 billion gallons of aviation biofuel are reached by 2042.
With aggressive policy, 1 billion gallons is reached 20 years sooner.

16
Collaborative Virtual/Augmented Reality
• “Hands on” interaction to create, simulate, and view new scenarios
• Filtering and highlighting to quickly find scenarios of interest
• “Parallel planes” and “3D scatterplot” views for visualization of up to 25 dimensions simultaneously
• Bookmarking and sharing
• Visualizations and sets of scenarios.
Accomplishments Development of User-Accessible Visualization Platform

17
• Used advanced statistical techniques and high-performance computing to gain deep insights into the model
• Identified which model factors are the most influential for a given set of outputs
• Examples:
o Price subsidies (above circa $0.75/gal) are one of the most influential factors for maximizing cellulosic ethanol production.
o For cellulose to hydrocarbon fuels, the fixed capital investment (FCI) incentive is key to maximizing fuel production, but it is only impactful at levels exceeding 80% FCI.
Accomplishments Identification of Most Influential Model Factors
FCI incentive threshold for HC production

18
Accomplishments Visualizing and Communicating Impact of BETO Strategy
The precise quantity and timing of production is sensitive to a variety of assumptions, including • Techno-economic analysis (TEA) • Timing of plant starts • Learning • External conditions.
Additional investment in deployment of integrated biorefineries (IBRs) helps the biofuels industry reach a tipping point for substantial growth.
Figure from BETO’s Multi-Year Program Plan (MYPP).
Cellulosic Feedstocks to Ethanol Cellulosic Feedstocks to Hydrocarbons

19
BETO Scenario Analysis • Vetting learning curve built understanding and trust in BSM
results (BETO, PNNL, NREL NBC) • Combining strategies from feedstock, conversion, and DMT
emphasized supply-chain impacts • MYPP development
Aviation Biofuels Analysis • BETO analysis joint effort with national labs and DOE Energy
Policy and Systems Analysis presented to Secretary Moniz • FAA analysis led to collaboration with Airlines for America, the
California Air Resources Board and the Aviation Sustainability Center (ASCENT) team
BSM External Review of Planned Release • Combination of academics, industry representatives, federal
stakeholders and national lab employees expressed support and recommended success factors for the BSM release.
Accomplishments Collaborations Increase Visibility, Credibility, and Acceptance of BSM

20
Accomplishments Milestone/Deliverable History and Status
Period Milestone/Deliverable Status
FY15 Q2: Report, briefing, or workshop on scenario analysis on the implications of feedstock constraints for conversion pathways.
Completed on schedule
Q3: Report, briefing, or workshop on scenario analysis on the role of aviation, marine, and rail biofuels in the development of the bioeconomy.
Completed on schedule
Q4: Journal article, conference proceeding, or book chapter on integrated analysis on the effectiveness and cost of biofuels policies in the context of the development of a large scale domestic bioeconomy.
Completed on schedule
FY16 Q2: Provide a briefing to BETO on key insights from BSM support to strategic planning including a comprehensive synopsis of BSM activities (analyses, hands-on workshops, publications) that directly support BETO strategic planning.
Completed on schedule
Q3: Complete scenario analysis on an early-market transition issue delivered in the form of a report, briefing, or workshop for BETO and its collaborators.
Completed on schedule
Q3: Deliver master summary of BSM insights and scenarios and plan for disseminating learning materials to BETO and other audiences.
Completed on schedule
Q4: Complete scenario analysis on a risk-related early-market transition issue delivered in the form of a report, briefing, or workshop for BETO and its collaborators.
Completed on schedule
Q4: Brief BETO on the progress made towards the development of a rich BSM scenario library browser for full completion and release in FY2017.
Completed on schedule
FY17 Q1: Post updated scenario library to ORNL’s BioEnergy KDF with results of FY15-16 scenario analyses. Completed on schedule
Q2: Deliver results of external review of BSM in the form of a report or briefing. On schedule
Q2: Deliver scenario analysis results on a BETO selected topic, such as BETO strategy analysis or a bioeconomy-related question, in the form of a report or briefing.
On schedule
Q2: Demonstrate NREL’s three-dimensional interactive visualization capabilities, employed with the BSM, to key BETO staff.
On schedule
Q4: Deliver scenario analysis results on a BETO selected topic such as a bioeconomy-related question or exploration of fuel cuts versus refining to intermediates in the form of a report or briefing.
On schedule
Q4: Release the BSM to the public. On schedule

21
Relevance
Intertemporal, Supply-Chain Impacts of Locally-Made Decisions
Financial incentives for growing cellulosics
Financial incentives for ethanol conversion plants
Financial incentives for stations owners to supply
ethanol
Gas tax
Financial attractiveness of growing cellulosics Land allocated to cellulosics
Cellulosic crop production
Feedstock price
Feedstock demand
Biofuel conversion capacity
Financial attractiveness of biofuel conversion plants
Biofuel conversion
costs Technology maturity
Biofuel price relative to petroleum fuels
Biofuel demand Biofuel consumers
(for ethanol) station availability
Biofuel supply
+
+
-
-
-
-
KEY “-” = negative (balancing /counteracting) loop “+” = positive (reinforcing) loop
BSM allows dynamic exploration in supporting decision making of interactions across systems, accounting for nonlinearity, constant change, historical dependence, and evolving markets.
22
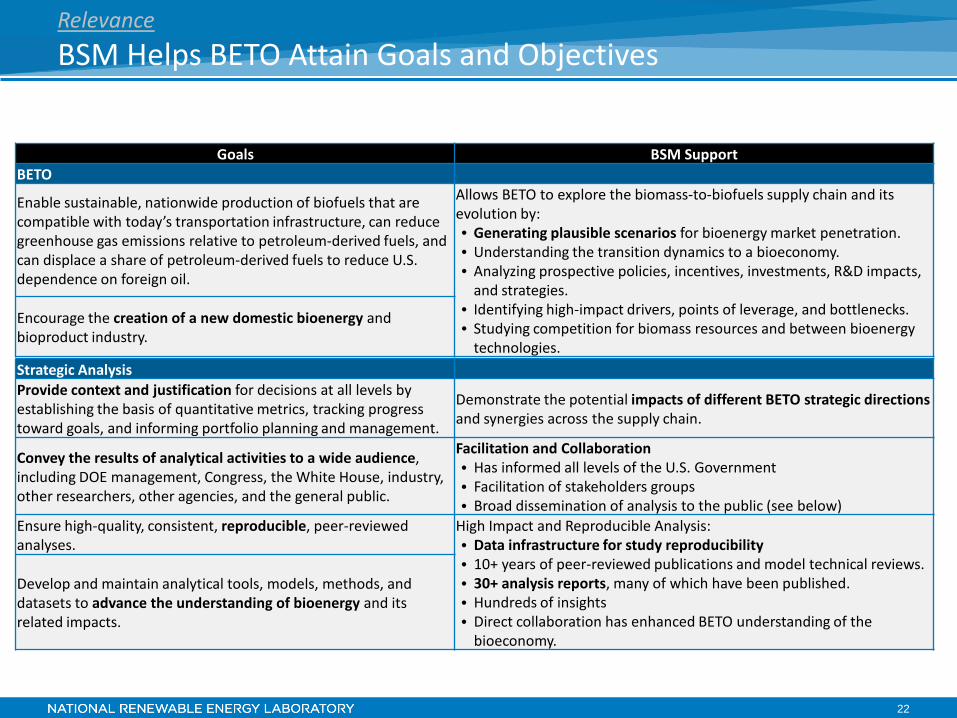
Relevance BSM Helps BETO Attain Goals and Objectives
Goals BSM Support BETO
Enable sustainable, nationwide production of biofuels that are compatible with today’s transportation infrastructure, can reduce greenhouse gas emissions relative to petroleum-derived fuels, and can displace a share of petroleum-derived fuels to reduce U.S. dependence on foreign oil.
Allows BETO to explore the biomass-to-biofuels supply chain and its evolution by: • Generating plausible scenarios for bioenergy market penetration. • Understanding the transition dynamics to a bioeconomy. • Analyzing prospective policies, incentives, investments, R&D impacts,
and strategies. • Identifying high-impact drivers, points of leverage, and bottlenecks. • Studying competition for biomass resources and between bioenergy
technologies.
Encourage the creation of a new domestic bioenergy and bioproduct industry.
Strategic Analysis Provide context and justification for decisions at all levels by establishing the basis of quantitative metrics, tracking progress toward goals, and informing portfolio planning and management.
Demonstrate the potential impacts of different BETO strategic directions and synergies across the supply chain.
Convey the results of analytical activities to a wide audience, including DOE management, Congress, the White House, industry, other researchers, other agencies, and the general public.
Facilitation and Collaboration • Has informed all levels of the U.S. Government • Facilitation of stakeholders groups • Broad dissemination of analysis to the public (see below)
Ensure high-quality, consistent, reproducible, peer-reviewed analyses.
High Impact and Reproducible Analysis: • Data infrastructure for study reproducibility • 10+ years of peer-reviewed publications and model technical reviews. • 30+ analysis reports, many of which have been published. • Hundreds of insights • Direct collaboration has enhanced BETO understanding of the
bioeconomy.
Develop and maintain analytical tools, models, methods, and datasets to advance the understanding of bioenergy and its related impacts.

23
Element MYPP Goal BSM Contribution Strategic Analysis
provide context and justification for decisions at all levels [p. 2-130]
• Analysis of potential biofuel penetration in jet fuel market
• Analysis in support of MYPP
Feedstock Supply
develop technologies to provide a sustainable, secure, reliable, and affordable biomass feedstock supply [p. 2-8]
• BETO feedstock working group to explore different BETO strategies
• Analysis of transition to advanced logistics • Analysis of feedstock flexibility for conversion
pathways
Conversion R&D
develop commercially viable technologies for converting biomass feedstocks [p. 2-59]
• BETO conversion working group to explore different BETO strategies
• Analysis of effects of industrial learning • Study of technological lock-in
Deployment and Market Transform-ation
develop commercially viable biomass utilization technologies that build and validate integrated biorefineries; develop supporting infrastructure to enable a biomass-to-bioenergy value chain [p. 2-99]
• Analysis of impacts of a transition to high octane fuel
• Studies of impact of investments in biorefineries for MYPP
Strategic Communi-cations
conduct outreach to target audiences, promoting the benefits of sustainable bioenergy production [p. 2-138]
• Scenario design and analysis workshops • Journal and report publications • Presentations at energy conferences • Scenario results browser on BioEnergy KDF
Relevance BSM Helps BETO Attain Goals and Objectives

24
Leveraging BETO work for external bioenergy stakeholders:
• Policy-makers o Exploration of scenarios that highlight possible biofuels
volumes under different policy considerations and external drivers
• Industry o Highlights importance of R&D for industry takeoff o Shows different investment schemes and possible
implications
• Universities o Novel system dynamics approach o Release of code for virtual reality visualization of model
results.
Relevance BSM Supports Analysis across Bioenergy Community

25
Future Plans and Directions
Deliverable Objective
FY20
17
Outside Collaboration
Q2 Deliver results of external review of BSM in the form of a report or briefing.
• Provide transparent, externally-vetted plan for releasing the BSM.
Q2 Demonstrate NREL’s three-dimensional interactive visualization capabilities, employed with the BSM, to key BETO staff.
• Use a diverse set of communication modes to effectively communicate technical results.
Q4 Release the BSM to the public.*
* Pending Go/No Go Decision
• Build user community around this publicly-funded model.
• Increase visibility and acceptance.
BETO Collaboration
Q2 Deliver scenario analysis results on a BETO-selected topic, such as BETO strategy analysis or a bioeconomy-related question, in the form of a report or briefing.
• Continue to engage BETO on exploring strategies and looking for synergies across platforms.
Q4 Deliver scenario analysis results on a BETO selected topic such as a bioeconomy-related question or exploration of fuel cuts versus refining to intermediates in the form of a report or briefing.
• Complete analysis on an emerging bioenergy topic.
• Support BETO and other stakeholders in thinking through potential future scenarios.

26
Future Plans and Directions FY
2018
Analysis • Support DOE-level analysis (e.g. policy administrative transition-focused
support) • Continue support of BETO goals through BETO strategy scenario analysis • Collaboration with national labs and federal agencies • Further understanding of the bioeconomy through key bioenergy-related
topics
Advanced statistics and visualization capabilities
Model development • Primarily to support specific analyses or collaborations
Expand outside collaborations: • Continue analysis with other federal agencies • Propose collaborative analyses with new community of users
BSM external user community • Limited support of released BSM • Define needs of new BSM community of users.

27
• Challenge/Objective o Inform stakeholders, management, and policy-makers of the implications of policy
choices and market developments to enable prioritization and evaluation of various actions and enable researchers to design and analyze the impacts of additional biomass-to-biofuels scenarios.
• High-impact BSM analyses tie R&D to market realities and policies/incentives. o The model explicitly focuses on policy issues, feasibility, and potential side effects.
o The BSM is a carefully validated and vetted model of the full bioenergy supply chain.
• Outreach o BSM release planned
o Analyses providing insights into system behavior and policy/incentive effectiveness
o Stakeholder workshops and collaborative analyses
o Reports and datasets summarizing research
o Interactive visualization tools for BSM scenario browsing.
Summary The BSM Provides Unique Insights into Bioeconomy Transitions

28
Additional Slides

30
• “Despite indications of stakeholder education and engagement through workshops and the use of the KDF, the audience for these analyses seems to have been primarily internal managers. Such analyses need to be shared in a transparent way with a broader external audience. Only then will the value of this tool be fully realized.” o The project has contributed to a significant body of published literature, available to all
interested audiences. In addition, we have more closely engaged with federal agencies, namely USDA, FAA, and EPA, in elaboration of analyses of interest to them. Finally, we plan to release the BSM to the public in 2017.
• “Conspicuously missing from their planned activities is more effort to open the model up to others outside the internal management team within BETO.” o We held an external review of a potential BSM release to the public in December 2016. The
review expressed support and offered guidance for the release of the BSM in 2017. • “It's good to know that the scenario model will be usable by the public.
As a layperson, I'm glad to know that you will be producing a simplified version.” o Two reviewers concurred as to the value of public dissemination of a simplified version of the
model. We published a learning model that is based on learning in the BSM. We also plan to have an interactive scenario library of BSM results available to the public for those who do not wish to use the full model.
• “The Panel sees the BSM as one place where almost all of the projects have some need to (and are) interfacing in a way that allows it to build an integrated understanding of a path forward for evolving a sustainable bioenergy industry.” o We have broad outreach efforts to better integrate the BSM with other BETO-funded work
(GREET, Billion Ton Study, Co-Optima, and others) in addition to forming BETO working groups for exploring different strategic directions across platforms and informing the Multi-Year Program Plan.
Responses to Previous Reviewers’ Comments

31
• Fact Sheets & Brochures o National Renewable Energy Laboratory. (2016). Biomass Scenario Model. NREL/FS-6A20-64956. Golden, CO: National Renewable Energy Laboratory.
• Journal Articles o Vimmerstedt, Laura J., Brian W. Bush, Dave D. Hsu, Daniel Inman, and Steven O. Peterson. “Maturation of Biomass-to-Biofuels Conversion
Technology Pathways for Rapid Expansion of Biofuels Production: A System Dynamics Perspective.” Biofuels, Bioproducts and Biorefining 9, no. 2 (2015): 158–76. doi:10.1002/bbb.1515.
o Newes, Emily K., Brian W. Bush, Corey T. Peck, and Steven O. Peterson. “Potential Leverage Points for Development of the Cellulosic Ethanol Industry Supply Chain.” Biofuels 6, no. 1–2 (2015): 21–29. doi:10.1080/17597269.2015.1039452.
• Book Chapters o D. Inman, L. Vimmerstedt, E. Newes, B. Bush, and S. Peterson. (2017). “Using system dynamics to model industry’s developmental response to
energy policy” The Handbook of Applied Systems Science (Routledge Publishing).
• Technical Reports o Vimmerstedt, Laura J., E. Warner, and D. Stright. “Effects of Deployment Investment on the Growth of the Biofuels Industry: 2016 Update.” Golden,
CO: National Renewable Energy Laboratory, 2016. http://www.nrel.gov/docs/fy16osti/65903.pdf. o Johnson, Caley, Emily Newes, Aaron Brooker, Robert McCormick, Steve Peterson, Paul Leiby, Rocio Uria Martinez, Gbadebo Oladosu, and Maxwell
Brown. “High-Octane Mid-Level Ethanol Blend Market Assessment.” Golden, CO: National Renewable Energy Laboratory, December 2015. http://www.nrel.gov/docs/fy16osti/63698.pdf.
o Levine, Aaron, Ethan. Warner, Brian. Bush, Jacob Jacobson, and Paul Leiby. “Legal and Regulatory Context of the Renewable Fuel Standard Program (Internal Use Only - Not for Public Distribution),” 2015. https://highpoint.nrel.gov/sites/iop/Documents/gen/fy15/63374.pdf.
o Newes, Emily, Jeongwoo Han, and Steve Peterson. “Potential Avenues for Significant Biofuels Penetration in the U.S. Aviation Market.” Golden, CO: National Renewable Energy Laboratory, 2017.
o Warner, Ethan, Aaron Levine, Brian Bush, Jacob Jacobson, and Paul Leiby. “Renewable Identification Number (RIN) Market Assessment and Retrospective (DO NOT DISTRIBUTE),” 2015. https://highpoint.nrel.gov/sites/iop/Documents/gen/fy15/61813.pdf.
• Conference Papers o Vimmerstedt, L., B. Bush, and S. Peterson. “Dynamic Modeling of Learning in Emerging Energy Industries: The Example of Advanced Biofuels in the
United States.” In The 33rd International Conference of the System Dynamics Society. Cambridge, MA, 2015. http://www.systemdynamics.org/conferences/2015/proceed/papers/P1067.pdf.
• Presentations o B. Bush. (2015). Biomass Scenario Model. PR-6A20-63808.
For a full list of BSM publications go to https://www.zotero.org/groups/bsm_publications/items
Major BSM Publications (March 2015-2017)

32
Supply Chain
Major Data Sources and Mechanisms Across the Supply Chain
Feedstock Production
Feedstock Logistics
Biofuel Production
Biofuel Distribution
Biofuel End Use
Grower Payment, Feedstock Supply, Feedstock Market
• Price signals (endogenous) • Farmer decision logic (Bass diffusion, logit) • Land basin (USDA) • Yield (USDA) • Agriculture Per-acre production costs
(ORNL/POLYSYS) • Forestry supply (ORNL/ForSEAM) • Harvest costs and efficiency (INL/BLM)
Distribution Logistics • Installation of ethanol infrastructure
(Bass diffusion) • Fuel terminals (EIA)
Fuel Use • Fuel choice (logit) • Gasoline price scenario (EIA) • Hi-blend price (Endogenous
and EIA)
Vehicles • Vehicle fleet (EIA) • Fleet efficiency (EIA)
Feedstock Logistics • Logistic system transitions (Bass diffusion) • Logistics system costs and efficiency
(INL/BLM) • Transportation distance
o Feedstock production density (endogenous)
o Fixed and variable costs (BLM/INL)
Dispensing Station • Investment (NPV) • Stations (U.S. Census) • Capital investment parameters
(NREL) • Annual revenue and spend
parameters (NACS)
Conversion • Commercial investment (NPV, logit) • Current/historic plants (plant survey) • Technology maturity (experts/historic data) • Techno-economics (NREL and PNNL design
reports) • Industrial learning rates (historic data) • Industrial learning curves (experts/historic
data)
Acronyms: BLM = Biomass Logistics Model; EIA = Energy Information Administration; ForSEAM = Forest Sustainable and Economic Analysis Model; INL = Idaho National Laboratory; NACS = National Association of Convenience Stores; NPV = net present value; NREL = National Renewable Energy Laboratory; ORNL = Oak Ridge National Laboratory; PNNL = Pacific Northwest Laboratory; POLYSYS = Policy Analysis System; USDA = United States Department of Agriculture.

33
Technical Approach Biofuel Pathways in the BSM
Gasoline
Diesel
Jet
LignocellulosicBiomass
Energy crops (herbaceous and
woody)
Residues (herbaceous,
woody, urban)
Catalytic synthesis
Fischer -Tropsch synthesis
Hydro-processing
Catalytic Upgrading
Fermentation
Bio-Oils
SynGas
Sugars
Fermentation
Fermentation
HydrodeoxygenationOilsCrop Oils
Waste Fats, Oils, and Greases
Algae
Corn
Butanol
Ethanol
Ethanol and Mixed Alcohols
Diesel and Jet
Methanol Synthesis,Methanol-Gasoline
Gasoline
Gasification
Hydrothermal Liquefactionn
Pyrolysis
Pretreatment & Hydrolysis
Hydrolysis
Processing at biorefineryOptional processing
BiorefineryProcessing
Biomass Feedstocks Petrochemical
Refining
Blending at Refinery
FinishedFuels
“Drop In” points for infrastructure- compatible fuels
Sugars
Ethanol
Extraction
Thermochemical Ethanol
Indirect Liquefaction (IDL) to High Octane Gasoline
Fischer Tropsch Synthesis
Fast Pyrolysis and Hydrotreatment
Low-Temperature Deconstruction…
and Catalytic Sugar Upgrading
and Fermentation
Biochemical Ethanol
Starch Ethanol
Hydro-processed Esters and Fatty Acids (HEFA)
Pond Algal Lipid Upgrading
Photobioreactor Algae Hydrothermal Liquefaction
and Upgrading
Name in Report

34
Techno-Economic Assumptions
Feedstock/Fuel Technology Pathway Biofuel Yield
(gal/dt)
Max Throughput
Capacity (dt/dy)
Fixed Capital Costs
(mil 2011$)
Operating Costs
(mil 2011$)
Co-Product Revenue
(mil 2011$) Data Source
Fats, Oils, and Greases to
Hydrocarbons HEFA 245 840 71 16 7.9 a
Cellulosic Ethanol
Biochemical 79 2,200 450 43 6.2 (Humbird et al. 2011)d
Thermochemical 84 2,200 550 35 14 (Dutta et al. 2011)d
Cellulosic Hydrocarbons
Fischer Tropsch [road and jet]
69 2,200 580 32 4.5 (Zhang et al., n.d.)
Indirect Liquefaction 65 2,200 420 34 0 (Tan et al. 2015) Fast Pyrolysis (Finished Fuel)
84 2,200 670 66 0 (Jones et al. 2013)
Biological Conversion of Sugars [road]
43 2,200 550 36 5.1 (Davis et al. 2013)
Biological Conversion of Sugars [jet]
43 2,200 540 39 5.0 (Davis et al. 2013)
Sugar Catalytic Upgrading [road and jet]
78 2,200 630 86 5.4 (Davis et al. 2015)
Algae to Hydrocarbons
Combined Algal Processing 140 1,300 440 230 22 (Davis et al. 2014) Hydrothermal Liquefaction 150 1,300 450 230 36 (Jones et al. 2014)
Alcohol to Jet (ATJ)
Starch Ethanol to Jet (ETJ) 73 2,200 350 48 26 (Wang et al. 2016)
Cellulose ETJ 51 2,200 590 55 6 a Unpublished NREL modeling based on (M. N. Pearlson 2011; M. Pearlson, Wollersheim, and Hileman 2013). b Operating costs include algal oils from open pond. c Operating costs include algae feedstock from photobioreactor d Techno-economic assumptions were aligned with more recent unpublished design cases. e Assumes no DDGS co-product for the isobutanol system due to the use of a GMO bug.
Sensitivity Analyses

36
Our Computing Infrastructure Allows for Novel Analyses
• Traditional SD analysis involves exploring a scenario or group of scenarios in a one-at-a-time fashion.
• Results are conditioned on the specifics of the scenario(s) and are not necessarily generalizable beyond the particulars of the scenario(s).
• Our computing infrastructure allows us to go beyond traditional SD analyses by using statistically designed studies and analysis methods.
• Variance based sensitivity analysis (VBSA) is one method that we have used extensively in the BSM project.
Do Not Distribute

37
• VBSA allows us to gain a deeper understanding of the model and system.
• What model inputs are most influential, alone and in combination?
• What combinations of input factors are significant?
• In our analysis, VBSA is one tool that we use as part of a tiered analytical approach.
Sensitivity Analyses
Do Not Distribute

38
Sensitivity Analysis is a Hierarchical Analytical Approach
Large randomized design – Identify key model factors
Advanced visualization - Identify regions of interest (ROI)
Local Sensitivity – What is different about the ROI
Within-group differences- clustering
Do Not Distribute

39
Designed Experiment Across Model Factors <
Mod
el F
acto
rs >
<
Leve
ls >
< Model Factors > < Levels >
• Using Sobol’s method, the size of the study design = 2N (k + 1) – for total and interactions. • We have applied methods to reduce the size of the study design. • VBSA uses a variance decomposition to determine, what factors and what combination of factors are responsible to variance in model output.
Do Not Distribute

40
High-Dimensional Visualization of Results
• Using advanced visualization in N dimensions allows for identification of regions of interest. • Once identified, these regions may be further analyzed using statistical methods.
For example, the region shown in blue exhibit characteristics that deserve further study.
Do Not Distribute

41
Local Sensitivity Analysis
Abscissa
Ord
inat
e
subset subset subset
• What model factors and levels result certain behaviors? • We can apply statistical methods to determine this.
In this example, we use the Anderson – Darling multiple comparisons test to determine what factors have input levels that are significantly different from the full study design.
Do Not Distribute

42
Further Analysis of Runs of Interest – Time Series O
rdin
ate
Ordinate
• We can also use time-series analysis and clustering to further understand subsets of interest. • For example, we have applied wavelet clustering to group runs based On their wavelet transform. • Such information could be used in machine learning algorithms to identify time-series of particular interest.
Do Not Distribute