systemic risk from derivatives: network analysis
TRANSCRIPT
PRESENTATION : ALI RAIS SHAGHAGHI
JOINT WORK WITH PROF. SHERI MARKOSE
FEB 2011
Systemic Risk from Derivatives: Network Analysis

Outline
Financial Derivatives Market and Systemic Risk
Network Analysis of US Financial Derivatives Market
Contagion Analysis
Concluding Remarks and Further Work

Financial stability and systemic risk
The recent financial crisis has emphasized the importance of contagion and systemic risk, definedas risk which can influence the stability of the financial system as a whole
Control over systemic risk has been the main motivation of the recent bailouts of large financialinstitutions
Regulators have had great difficulties anticipating the impact of defaults partly due to a lack of visibility and lack of relevant indicators on the structure of the financial system

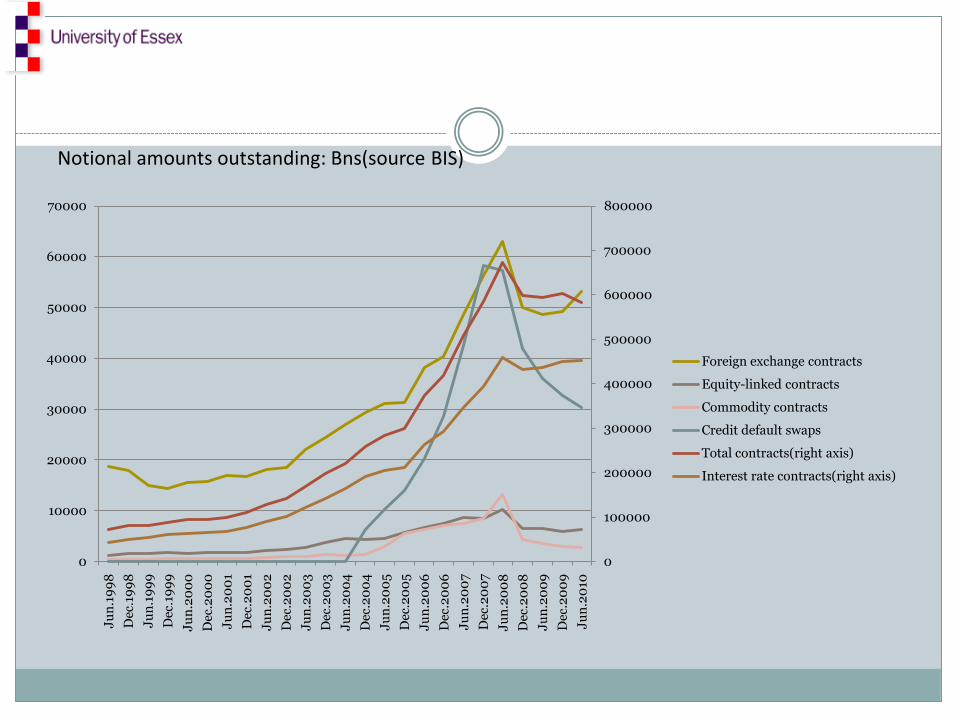
$603 Trillion Dec 2009 OTC Derivatives
When compared to the size of world GDP at $70 tn, and size of the global bond market (total debt outstanding) at about $82 tn, the implication is that the size of off balance sheet activities of financial intermediaries (FIs) has grown to many multiples of their assets and derivatives obligations of FIs under conditions of market wide adverse movements on the underlying (such as interest rates, house prices, exchange rates, external debt of countries including sovereign debt) could overwhelm the equity and assets of FIs.

Indeed, the key structural aspect of the networks underpinning financial derivatives has been summarized in the 2009 Fitch survey: “dependence on a limited number of counterparties looks to be a permanent feature of the market; this is underscored by the fact that the top 12 counterparties comprised 78% of total exposure in terms of the number of times cited, up from the 67% reported last year. The top five institutions that provided volume figures accounted for 95% of total notional amount bought and sold. This concentration is a reflection of the dominant role of banks and dealers as counterparties, particularly after the collapse of a limited number of financial institutions who were important intermediaries in this market.”http://www.scribd.com/doc/37557210/Fitch-Market-Research-Global-Credit-Derivatives-Survey-09162010 .
These are Goldman Sachs, JP Morgan Chase, Barclays, Bank of America, Deutsche Bank, Morgan Stanley, Credit Suisse, BNP Paribas, UBS, Bank of America, Merrill Lynch, Royal Bank of Scotland.

Derivative Dilemmas
The degree to which derivatives had created a dangerously interconnected financial system became clear amid the collapse of Bear Stearns, Lehman Brothers and AIG in 2008. A default by one bank at the centre of a tangled web of derivatives contracts could paralyse the entire financial system, because the derivatives could become worthless if the bank writing the contract went under. http://www.ft.com/cms/s/0/fa3794be-a57b-11df-a5b7-00144feabdc0.html#axzz1E4jpq2G1
0
100000
200000
300000
400000
500000
600000
700000
800000
0
10000
20000
30000
40000
50000
60000
70000
Ju
n.1
99
8
Dec
.19
98
Ju
n.1
99
9
Dec
.19
99
Ju
n.2
00
0
Dec
.20
00
Ju
n.2
00
1
Dec
.20
01
Ju
n.2
00
2
Dec
.20
02
Ju
n.2
00
3
Dec
.20
03
Ju
n.2
00
4
Dec
.20
04
Ju
n.2
00
5
Dec
.20
05
Ju
n.2
00
6
Dec
.20
06
Ju
n.2
00
7
Dec
.20
07
Ju
n.2
00
8
Dec
.20
08
Ju
n.2
00
9
Dec
.20
09
Ju
n.2
010
Foreign exchange contracts
Equity-linked contracts
Commodity contracts
Credit default swaps
Total contracts(right axis)
Interest rate contracts(right axis)
Notional amounts outstanding: Bns(source BIS)

US Banks With Derivative Positions($):2009 Q4 FDIC Data
F.I.Name IR F.I.Name FX F.I.Name Equity F.I.Name
Commodity F.I.Name CDS SOLD GN F.I.Name Total
JPMORGAN 63,382,511,000 JPMORGAN 7,082,377,000 JPMORGAN 1,238,114,000 JPMORGAN 738,168,000 ICE 3,301,673,718 JPMORGAN 75,381,081,000
GOLDMAN 39,278,924,000 CITIBANK 3,856,043,000 BoA 162,675,418 CITIBANK 58,800,000 JPMORGAN 2,939,911,000 BoA 42,222,864,886
BoA 37,849,749,439 BoA 2,240,063,347 CITIBANK 161,300,000 STATE STREET 52,947,641 BoA 1,964,463,832 GOLDMAN 41,118,442,000
CITIBANK 30,920,952,000 GOLDMAN 1,493,888,000 WACHOVIA 50,275,000 WACHOVIA 47,263,000 CITIBANK 1,089,611,000 CITIBANK 36,086,706,000
WACHOVIA 1,981,439,000 HSBC USA 573,909,305 HSBC USA 24,150,553 HSBC USA 28,055,496 HSBC USA 372,604,526 ICE 3,301,673,718
HSBC USA 1,489,008,938 STATE_STREET 567,798,875 FARGO 20,847,000 FARGO 23,450,000 GOLDMAN 339,144,000 HSBC USA 2,487,728,818
NY MELLON 1,033,472,000 NY MELLON 234,277,000 SUNTRUST 10,252,532 GOLDMAN 6,168,000 WACHOVIA 85,699,000 WACHOVIA 2,263,355,000
FARGO 960,528,000 NORTHERN 163,587,384 NY MELLON 7,653,000 BoA 5,912,850 KEYBANK 1,916,952
NY MELLON 1,275,404,000
SUNTRUST 178,222,685 WACHOVIA 98,679,000 HARRIS 816,666 OKLAHOMA 5,583,549 PNC_BANK 542,000 FARGO 1,073,469,000
PNC 124,850,181 FARGO 68,304,000 PNC 343,956 UNION 3,405,389 FARGO 340,000 STATE STREET 622,692,567
Others 517,244,091 Others 58,711,625 Others 1,339,142 Others 5,100,690 Others 485,772 Others 1,070,136,563 Total 177,716,901,334 Total 16,437,638,536 Total 1,677,767,267 Total 974,854,615 Total 10,096,391,800 Total 206,903,553,552
Market Mean ($000s) Standard
Deviation
(σ)
Skewness Kurtosis Max
IR 875,452,715.9 6,214,603,264.6 7.9 65.8 63,382,511,000.0
FX 80,973,588.8 595,760,179.8 9.7 103.5 7,082,377,000.0
Equity 8,264,863.4 88,307,824.6 13.6 188.9 1,238,114,000.0
Other 4,802,239.5 52,188,019.6 13.9 195.8 738,168,000.0
CDS 49,735,920.2 347,192,019.0 8.0 65.8 3,301,673,718.0
Total 1,019,229,327.8 7,131,250,614.2 8.1 71.0 75,381,081,000.0

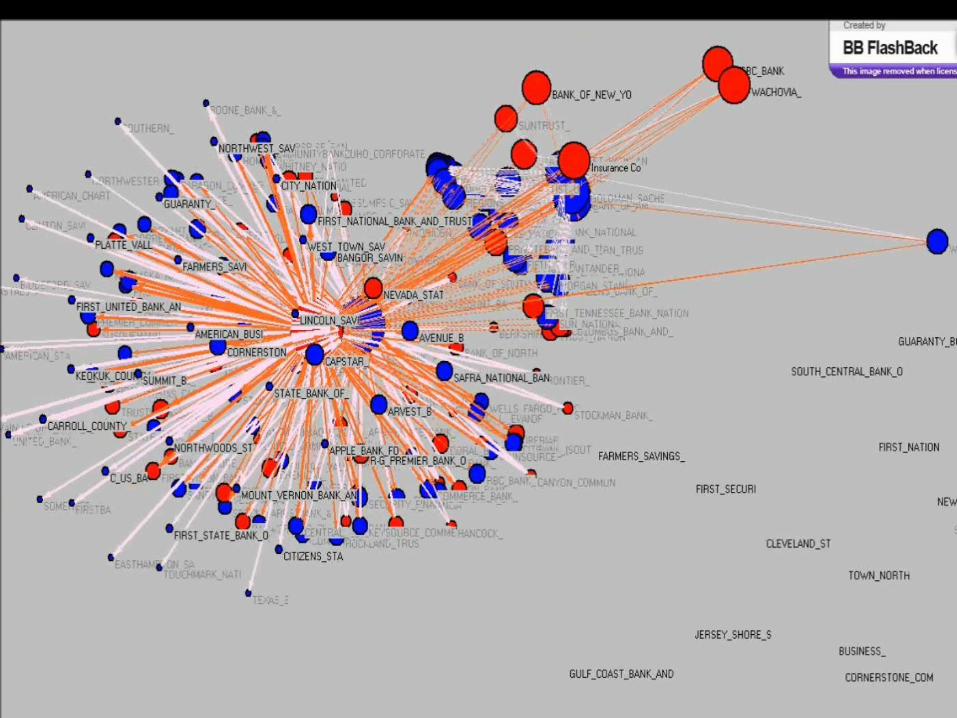
Structure of Financial Derivatives Market: (2009, Q4): Green(Interest Rate),
Blue (Forex), Maroon ( Equity); Red (CDS); Yellow (Commodity); Circle Broker Dealers in all markets (Bi-partite Graph)

Use of Networks in Finance and Economics
Relatively new but since the financial crises of 2008-2009 has received more interest
Real world complex networks: unsuspected regularities across many domains, ranging from biology or computer systems to society and economics
Universal or at least generic mechanisms are at work in the formation of many such networks
(Estrada et al. 2010)

Levels of Network Analysis
First: purely topological approach(best optimised by a binary adjacency matrix where links simply exist or not
Second: allowing the links to carry weights, or weights and direction
Third: the nodes themselves are assigned a degree of freedom or fitness

Type of Financial Networks
It is important to understand which type of networks can be constructed for financial systems , and evaluating the imperial results on networks obtained by investigating large databases of financial data ranging from individual transactions in a financial market to strategic decisions at a bank level.
In this regard there are three main type of networks that has been studied (Estrada et al. 2010)
1)Networks to extract information from Correlation Matrices
2)Networks of control as, for example, the Ownership Network and the Board of Directors Network
3)Trading networks as the World Trade Web and the Banks’ Credit networks
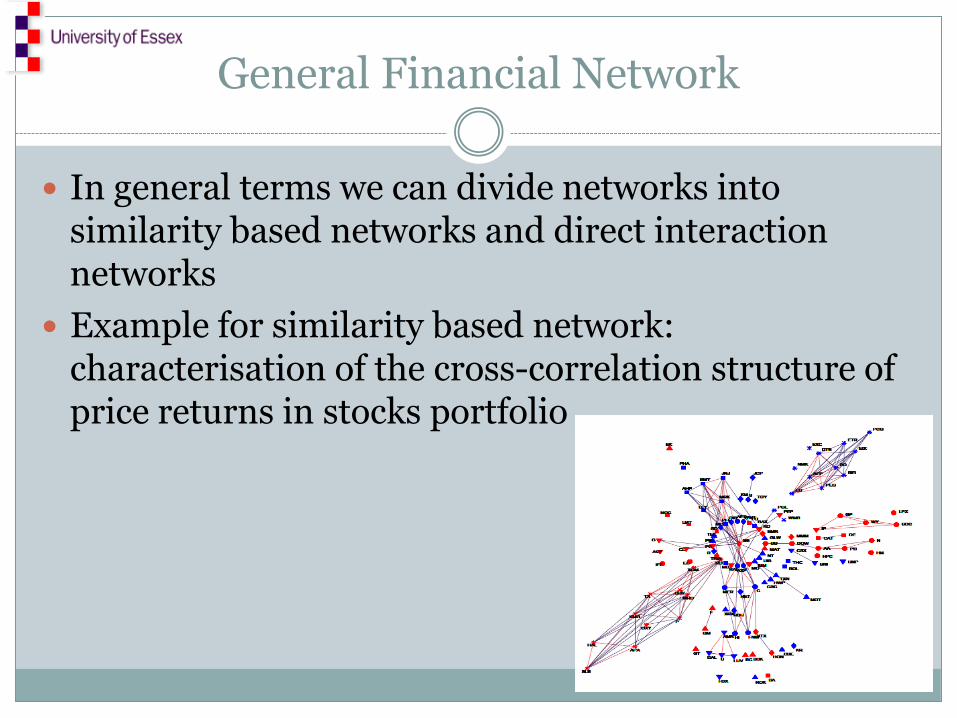
General Financial Network
In general terms we can divide networks into similarity based networks and direct interaction networks
Example for similarity based network: characterisation of the cross-correlation structure of price returns in stocks portfolio

Transaction Networks
Interbank Networks and Bank-Firm Networks(Boss et al. Interbank market and payment system

Some Network Concepts : A graphical representation of random graph (left) and small world graph with hubs, Markose et. al. 2004
High Assortative

Properties of NetworksDiagonal Elements Characterize Small World Networks
Watts and Strogatz (1998), Watts (2002) See Markose et. al. (2004)
Properties
Networks
Clustering
Coefficient
Average Path
Length
Degree
Distribution
Regular
High
High
Equal and fixed
In-degrees to each
node
Random
Low
Low
Exponential/
Poisson
Scale Free/Power
Law
Low
Variable
Fat Tail
Distribution

Financial Networks for the Derivatives Obligations: High Clustering from broker dealer behaviour and Barabasi et. al. Preferential attachment model
• Our algorithm assigns in and out degrees for a bank in terms of its respective market shares (si
B/G) for Derivatives purchases(B) and Derivatives sales (G), resp. GNFV and GPFV
otherwise
NssGx
G
i
B
j
i
ij0
tiescounterpar s)'(1largest for the

Empirical Validation of Constructed Network
The Table below gives the FDIC amount of assets and liabilities for a sample number of FIs compared to model estimated values derived from the network construction algorithm. The original bilateral payables and receivables are shuffled, so that the empirical bilaterally netted amounts are obtained.
FI Name Actual Assets Actual Liabilities Model Estimated
Assets Model Estimated
liabilities
'JPMORGAN_CHASE_BANK' 72,008,000 64,340,000 53.96947572 20.63947572
'BANK_OF_AMERICA' 29,452,150 8,471,760 38.92072465 18.41826065
'CITIBANK' 58,966,000 46,986,000 34.96444539 18.73644539
'HSBC_BANK_USA' 8,615,308 5,196,214 10.72017734 11.84431334
'GOLDMAN_SACHS_BANK_USA' 22,662,000 12,040,000 98.1738958 35.1038958
'WACHOVIA_BANK' 14,381,000 4,612,000 10.62476032 10.95076032
'KEYBANK_NATIONAL_ASSOCIATION' 848,516 918,223 1.141161049 1.046082049
'PNC_BANK' 595,504 322,404 1.46812615 1.45225215
'WELLS_FARGO_BANK' 7,023,000 4,350,000 5.838533597 4.349533597


Contagion
The first step to measuring credit exposure in derivative contracts involves identifying those contracts where a bank would lose value if the counterparty to a contract defaulted today. The total of all contracts with positive value (i.e., derivatives receivables) to the bank is the gross positive fair value (GPFV) and represents an initial measurement of credit exposure. The total of all contracts with negative value (i.e., derivatives payables) to the bank is the gross negative fair value (GNFV) and represents a measurement of the exposure the bank loses
to its counterparties.(2009 OCC Derivatives Report)

Objective: Build Derivatives Network and Conduct Stress Tests
There is very high correlation between the dominance of market share in Derivatives market and network connectivity
Stress Tests: Follow Furfine (2003) Algorithm We use 2% reduction of Tier 1 capital to signal bank failure Experiment : (A) The loss of derivatives payables due to the failed bank
as counterparty suspending its guarantees will have a contagion like first and multiple order effects. Full bilateral tear up assumed; No possibility for Novation
NET EXPOSURE > 2% Tier 1 Capital
Too Interconnected To Fail :Stress Test

JPMorgan BoA Goldman CITI ICEWells Fargo KeyBank
Financial_Institution_Name
Tier 1 capital
Loss($)in bn %
Loss($)in bn %
Loss($)in bn %
Loss($)in bn %
Loss($)in bn %
JPMORGAN_CHASE 96.372 -96.372-
100.000% -1.423 -1.477% -9.706 -10.071% -10.331 -10.720% -0.036 -0.037% 0 0
BANK_OF_AMERICA 111.916 -0.271 -0.242% -111.916-
100.000% -0.271 -0.242% -0.271 -0.242% -0.022 -0.020% 0 0
GOLDMAN_SACHS 17.152 -18.617-
108.544% -10.940 -63.783% -17.152-
100.000% -8.306 -48.425% -0.068 -0.395% 0 0
CITIBANK,_N.A. 96.833 -0.401 -0.414% -0.115 -0.119% -0.401 -0.414% -96.833 -100.000% -0.017 -0.018% 0 0
ICE_TRUST_U.S._LLC 0.046 0.000 0.000% 0.000 0.000% 0.000 0.000% 0.000 0.000% -0.046 -100.000% 0 0
HSBC_BANK_USA 13.354 -9.664 -72.373% -10.720 -80.279% -9.664 -72.373% -9.664 -72.373% 0.000 0.000% 0 0
WACHOVIA_BAN 39.786 -9.503 -23.886% -10.625 -26.705% -9.503 -23.886% -9.503 -23.886% 0.000 0.000% 0 0
NEW_YORK_MELLON 10.149 -2.368 -23.335% -2.662 -26.231% -2.368 -23.335% -2.762 -27.219% 0.000 0.000% 0 0
WELLS_FARGO_BANK 43.765 -2.810 -6.422% -2.632 -6.014% -2.379 -5.436% -2.775 -6.340% 0.000 0.000% 0 0
STATE_STREET_BANK 11.378 -0.920 -8.088% -0.953 -8.378% -0.920 -8.088% -1.073 -9.434% 0.000 0.000% -43.765 0
SUNTRUST_BANK 11.973 -0.560 -4.673% -0.852 -7.115% -0.560 -4.673% -0.653 -5.451% 0.000 0.000% 0 0
NORTHERN_TRUST 4.756 -0.291 -6.122% -0.443 -9.321% -0.291 -6.122% -0.340 -7.141% 0.000 0.000% 0 0
PNC_BANK 24.491 -0.398 -1.625% -0.606 -2.474% -0.398 -1.625% -0.862 -3.520% 0.000 0.000% 0 0
KEYBANK 8.090 -0.323 -3.995% -0.463 -5.725% -0.304 -3.760% -0.355 -4.386% 0.000 0.000% 0 -8.090
REGIONS_BANK 10.577 -0.212 -2.008% -0.463 -4.379% -0.212 -2.008% -0.248 -2.342% 0.000 0.000% 0 0
U.S._BANK 16.250 -0.170 -1.044% -0.404 -2.486% -0.170 -1.044% -0.347 -2.135% 0.000 0.000% 0 0
FIFTH_THIRD_BANK 13.575 -0.143 -1.055% -0.361 -2.662% -0.143 -1.055% -0.310 -2.287% 0.000 0.000% 0 0
UNION_BANK 7.207 -0.095 -1.320% -0.237 -3.292% -0.095 -1.320% -0.204 -2.827% 0.000 0.000% 0 0
RBS_CITIZENS 8.237 -0.179 -2.177% -0.191 -2.323% -0.179 -2.177% -0.272 -3.305% 0.000 0.000% 0 0
BRANCH_BANKING 13.544 -0.072 -0.533% -0.169 -1.247% -0.072 -0.533% -0.150 -1.109% 0.000 0.000% 0 0
BANK_OF_OKLAHOMA 1.079 -0.051 -4.767% -0.078 -7.259% -0.051 -4.767% -0.060 -5.561% 0.000 0.000% 0 0
DEUTSCHE_AMERICAS 8.289 -0.689 -8.307% -0.466 -5.627% -0.306 -3.696% -0.357 -4.311% 0.000 0.000% 0 0
HUNTINGTON 2.873 -0.051 -1.790% -0.063 -2.200% -0.051 -1.790% -0.090 -3.130% 0.000 0.000% 0 0
COMERICA_BANK 5.763 -0.072 -1.249% -0.166 -2.874% -0.072 -1.249% -0.142 -2.468% 0.000 0.000% 0 0
MANUFACTURERS 4.988 -0.055 -1.111% -0.120 -2.414% -0.055 -1.111% -0.103 -2.073% 0.000 0.000% 0 0
Total US Banks 705.221
No of Banks Failed 18 32 18 32 1 1 1Tier1 Capital loss for top 25 -144.290 -157.071 -55.326 -146.012 -0.189 -43.765 -8.090
Total Tier 1 Capital Loss -151.809 -159.899 -62.837 -153.585 -0.189 -43.765 -8.090

Conclusion and Future Work
“Systemic risk involves understanding structure and dynamics of complex financial networks. Efficientmethods for large scale simulation and optimization of these networks provide better insight than simplistic equilibrium models based on homogeneous network structures” (Rama Cont)
The extension of the current model will focus on global derivatives market specifically the addition of European institutions.
Also the current aggregate model could be extended to the activity of financial intermediaries in multiple markets, for this the theory of hyper-networks could be utilised