system evaluation and user studies
TRANSCRIPT

Com S/Geron 415X Gerontechnology in Smart Home
Environments
System Evaluation and User Studies
Dr. Hen-I Yang
Computer Science Dept., ISU
April 19, 2011
Product Evaluation and
User Studies

Usability
Usability (ease of use, user friendliness): how well users can
learn and use a product to achieve their goals and how
satisfied they are with that process.
Learnability (ease of learning): How easy is it for users to
accomplish basic tasks the first time they encounter the design?
Efficiency: Once users have learned the design, how quickly can they
perform tasks?
Memorability (retention): When users return to the design after a
period of not using it, how easily can they reestablish proficiency?
Errors: How many errors do users make, how severe are these errors,
and how easily can they recover from the errors?
Satisfaction: How pleasant is it to use the design?
http://usability.gov, http://www.useit.com/alertbox/20030825.html

How do We Evaluate Usability?
Qualitative Method
Direct Observation
Interview and Questionnaire
Focus Group
Quantitative Method
User Studies
Questionnaire
Mixed Method

Qualitative Method
Originated from anthropology, often used by social
scientists
Better suited for answering in-depth type of question
(why and how)
Exploration (generate hypothesis)
Explanation
Find unintended effect
Used to validate a specific hypothesis, and generally
cannot be generalized to other cases directly
The role of the research can have significant effects on
the outcome of the study

Focus Group
Moderated discussion among 8 -12 representative users
Covers a range of topics that you decide on beforehand
(often with prepared script)
Allow participants to talk;
researchers hear them tell you about their work
You will learn
about user’s attitudes, beliefs, desires, and their reactions to
ideas or to prototypes.
You will not learn
how users really work with your products and what problems
users really have with those sites
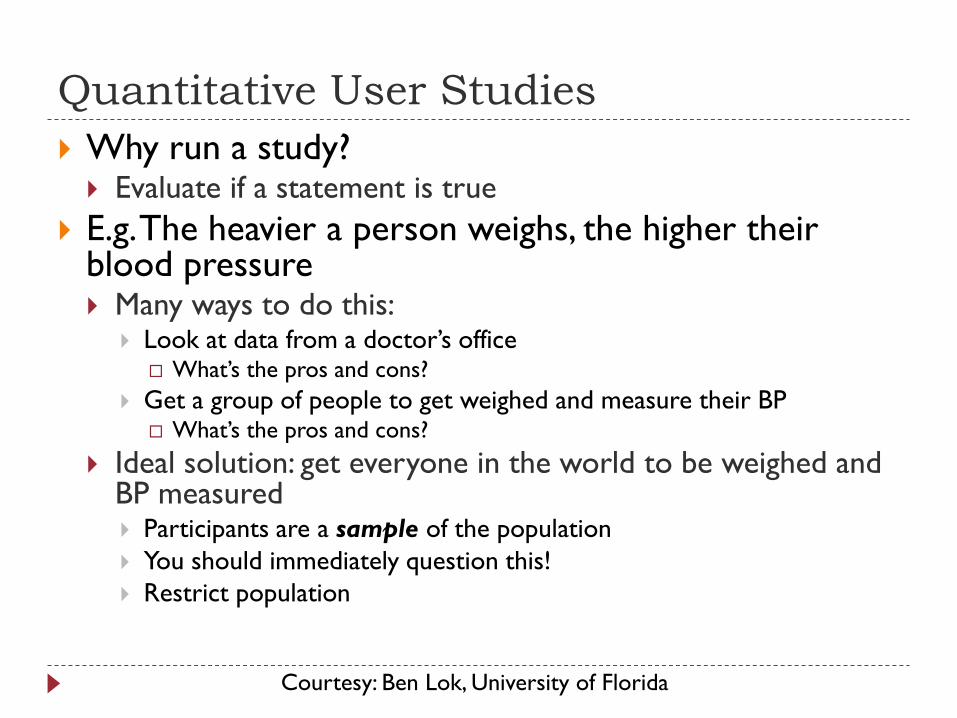
Quantitative User Studies
Why run a study? Evaluate if a statement is true
E.g. The heavier a person weighs, the higher their blood pressure Many ways to do this:
Look at data from a doctor’s office What’s the pros and cons?
Get a group of people to get weighed and measure their BP What’s the pros and cons?
Ideal solution: get everyone in the world to be weighed and BP measured Participants are a sample of the population
You should immediately question this!
Restrict population
Courtesy: Ben Lok, University of Florida

Population Design
Identify the statement to be evaluated E.g. The heavier a person weighs, the higher their blood pressure
Create a hypothesis E.g. Weight is directly proportional to blood pressure
Identify Independent and Dependent Variables Independent Variable – the variable that is being manipulated by the
experimenter (weight)
Dependent Variable – the variable that is caused by the independent variable. (blood pressure)
Design Study Invite 100 people
Weigh them and take their BP
Create a graph using the collected data
See if there is a trend
Courtesy: Ben Lok, University of Florida

Two Group Design
One of the most frequently used and simplest design of user studies
Identify the statement to be evaluated Ex. Uconnect system improves the frequency of social
interactions of people who are hard of hearing (HoH)
Create a hypothesis Ex. HoH People with Uconnect talk to their family and friends
more frequently than those who don’t
Design Study Two groups called conditions
How many people?
What’s your design?
What is the independent and dependent variables?
Confounding factors – factors that affect outcomes, but are not related to the study
Courtesy: Ben Lok, University of Florida

Design
External validity – do your results mean anything?
Results should be similar to other similar studies
Use accepted questionnaires and methods
Power – how much meaning do your results have?
The more people the more you can say that the participants
are a sample of the population
Generalization – how much do your results apply
to the true state of things
Courtesy: Ben Lok, University of Florida

Group Exercise: Design a User Study
Identify a statement of interest with regarding to your
project about one of the five measures of usability
Create a hypothesis based on the statement
Design a quantitative user study (population or two-
group design)
What are the independent and dependent variables?
How many and who should be recruited for the study?
How do you plan to use the collected data to validate your
hypothesis?
Do your results have enough power? Can you generalize your
results to general population?

Phases in Conducting User Studies
Design of the Study
Preparation of the Study
Acquire IRB approval*
Recruiting participants
Preparation of the documentations
Setup the environment
Execution of the Study
Formally have all participants sign up for a time slot (if individual testing is needed)
Informed Consent
Execute study
Questionnaires/Debriefing
Data Analysis
Courtesy: Ben Lok, University of Florida

Hypothesis Proving
Hypothesis: People who use FallAlert receive the necessary medical attention in a
more timely fashion.
NULL Hypothesis: Assume people who use FallAlert and those who do not receive the necessary medical attention in the same amount of time
Your job to prove differently!
Alternate Hypothesis 1: people who use FallAlert receive the necessary medical attention more quickly than those who do not
Alternate Hypothesis 2: people who use FallAlert receive the necessary medical attention with longer delay than those who do not
Courtesy: Ben Lok, University of Florida

Data Analysis – Mean
Let’s say we conduct a user study about how OSS help
people to find the lost wallet faster
On average, the group with OSS find the wallet in 34.30 sec
On average, the group without OSS find the wallet in 35.20 sec
What does the mean (average) tell us? Is that enough?
Does it mean people are better off with OSS ?

Variances
Standard deviation – measure of dispersion (square
root of the sum of squares divided by N)
The group with OSS find the wallet in 34.25 sec
The standard deviation of this group is 16.85 sec
The group without OSS find the wallet in 36.50 sec
The standard deviation of this group is 5.45 sec
What does the data collectively tell us? Is OSS really
helping users find their wallets?

B
A
C

T - test
We assumed the means are “equal”
But are they? Or is the difference due to chance?
T – test – statistical test used to determine whether two
observed means are statistically different
Mean of
control group
Mean of
treatment group
Mean of
control group
Mean of
treatment group
Mean of
control group
Mean of
treatment group
Courtesy: Ben Lok, University of Florida

T – test
t-value formula:
(rule of thumb) Good values of t > 1.96
Mean of
control group
Mean of
treatment group
Courtesy: Ben Lok, University of Florida
http://socialresearchmethods.net/kb/stat_t.htm

F Statistic and p Value F statistic – assesses the extent to which the means of
the experimental conditions differ more than would be expected by chance
Important when studying the analysis of variance (ANOVA)
T-test is related to F statistic
Look up a table or use Excel to get the p value for your data set.
Compare to α value
α value – probability of making a Type I error (rejecting the null hypothesis when it is really true)
p value – statistical likelihood of an observed pattern of data happening, calculated on the basis of the sampling distribution of the statistic. (% that the result of observations were due to chance)
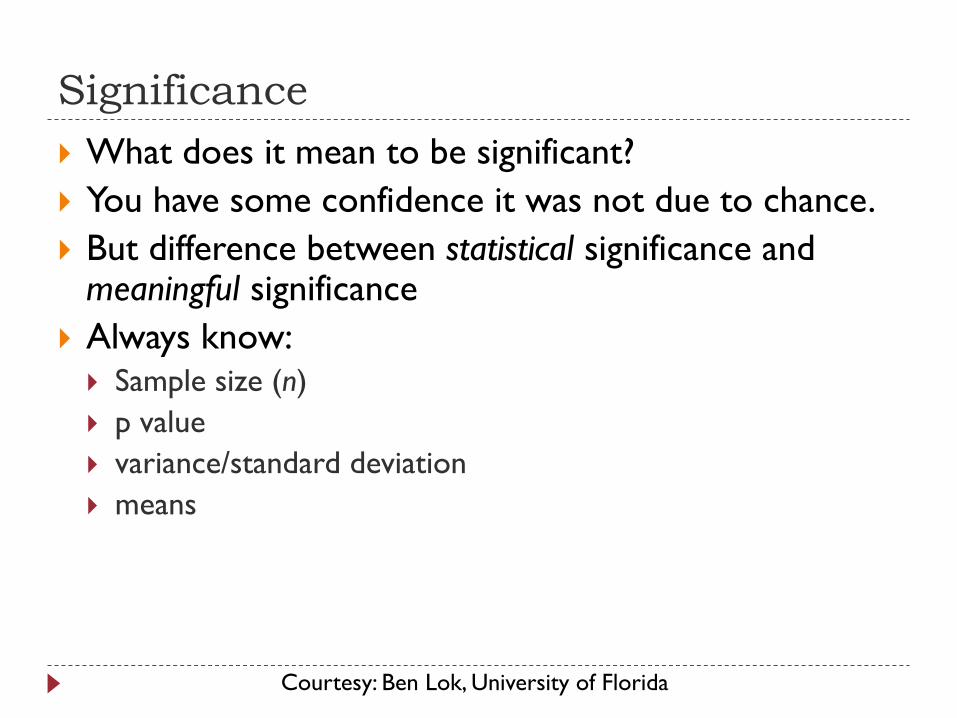
Significance
What does it mean to be significant?
You have some confidence it was not due to chance.
But difference between statistical significance and meaningful significance
Always know: Sample size (n)
p value
variance/standard deviation
means
Courtesy: Ben Lok, University of Florida

To Learn More
http://usability.gov
Assigned reading on “Protecting Human Research
Participants”