hci evaluation studies part 2: user studies compsci 705 / soft eng 702
TRANSCRIPT

HCI EVALUATION STUDIESPART 2: USER STUDIES
Compsci 705 / Soft Eng 702
TODAY
• Types of Studies • Usability • Comparative
• Planning the study• Task design• Bias• Questionnaires• Recruiting participants
• Piloting
• Performing the study
• Collecting and analysing results• Statistical analysis
• Reporting

USABILITY STUDIES
• Evaluating a single piece of software in isolation.
• Usually you ask users to complete specific tasks.
• You can then calculate metrics like:• Time• Success rate• Number of attempts needed to succeed• Enjoyability
• Importantly, you get to observe people using the software
• Look at CS345/SE350 Lecture notes if you need a reminder. Or http://www.usability.gov/
COMPARATIVE STUDIES
• Comparing two (or more) pieces of software.
• Considerably more challenging!
• Needs to be a fair test.• How can you be sure that an effect isn’t just due to the
task ordering, or the users’ experience with doing the task?

PLANNING A STUDY
• You need to do lots of planning.
• Write up a proposal – this will help you get your thoughts straight, and it provides material that can go into your ethics application and even your report/thesis.• See
http://www.cs.auckland.ac.nz/courses/compsci705s1c/lectures/UsabilityTestingTemplate.doc
• Types of questions you need to answer• Where will you conduct the study? Does it matter?• What hardware/software do you need?

EXAMPLE STUDY
• We want to compare two tools:• A commercial widget-based tool for mind mapping,
and• A sketch-based tool to do a similar task.
PLANNING A STUDY
• What’s your hypothesis?• That tool X is better than tool Y?• That tool X takes less time to learn than tool Y?
• What are you measuring?• How do you define ‘better’?• Time? Error rate? Satisfaction?• Are these subjective or objective measures?
PLANNING A STUDY
• Design your tasks.• What will you ask users to do?
• Write a script.• Specify exactly how users can achieve the task, and
exactly how you will measure their performance.
DESIGNING TASKS
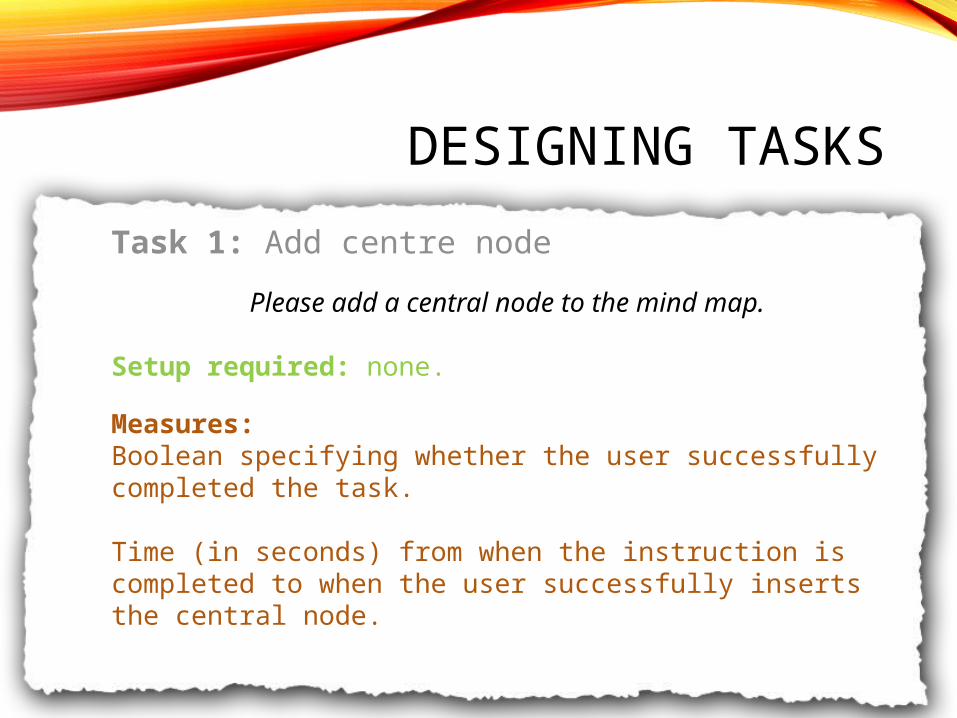
Task 1: Add centre node
Please add a central node to the mind map.
Setup required: none.
Measures:Boolean specifying whether the user successfully completed the task.
Time (in seconds) from when the instruction is completed to when the user successfully inserts the central node.
DESIGNING TASKS
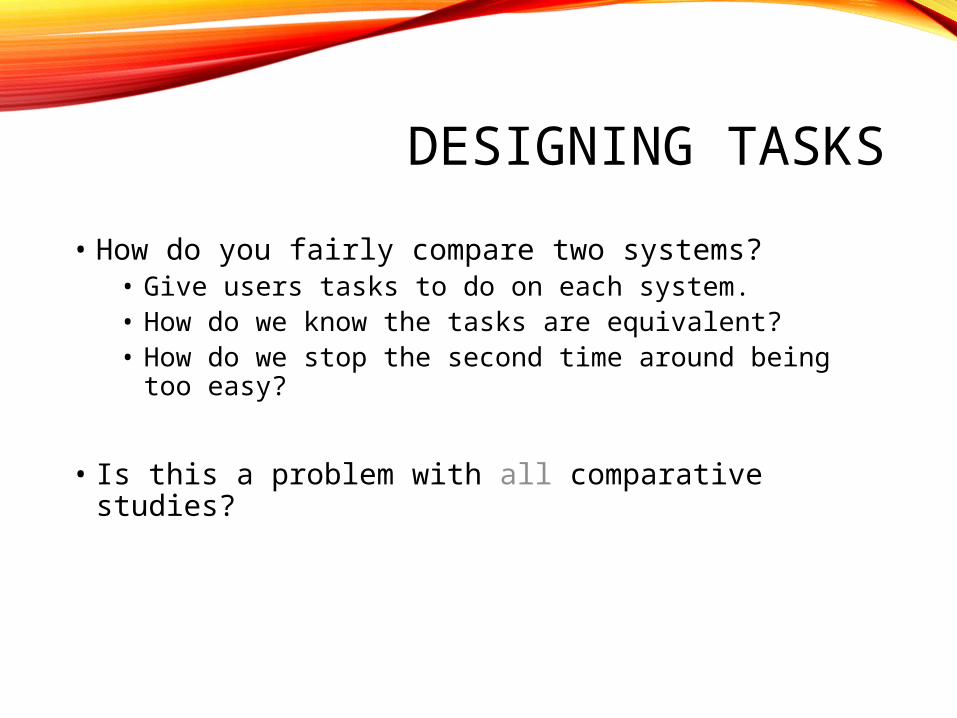
• How do you fairly compare two systems?• Give users tasks to do on each system.• How do we know the tasks are equivalent?• How do we stop the second time around being too
easy?
• Is this a problem with all comparative studies?
DESIGNING TASKS
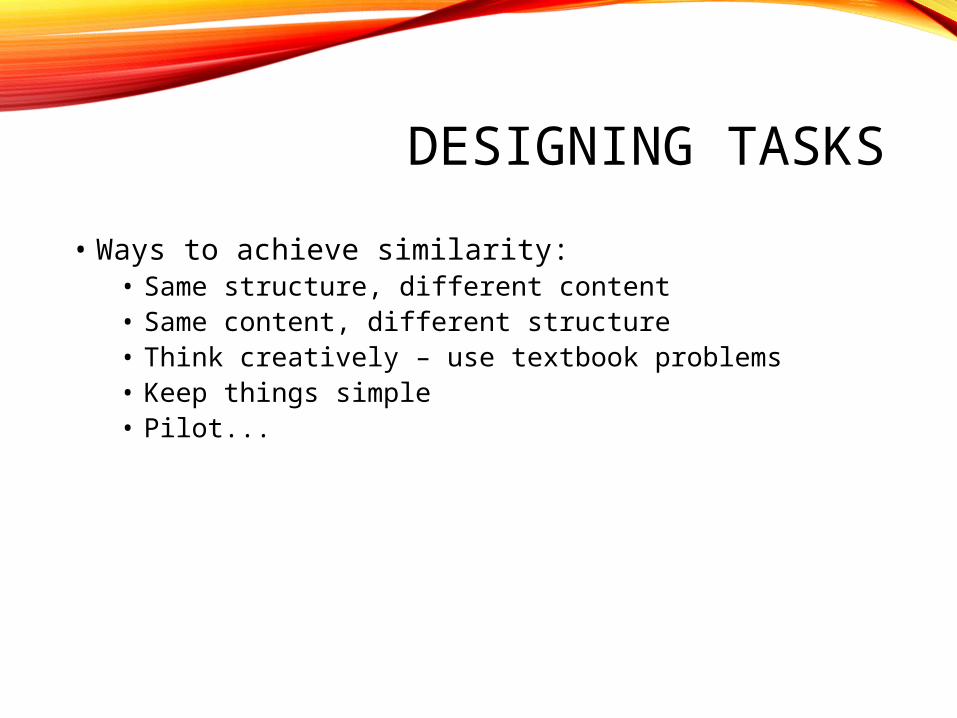
• Ways to achieve similarity:• Same structure, different content• Same content, different structure• Think creatively – use textbook problems• Keep things simple• Pilot...

AVOIDING BIAS
• Bias: something about the methodology or analysis makes it an unfair test.
• Sources of bias in HCI evaluations?• Experimenter effects: ‘pushing’ users to respond the
way you want, or analysing data the way you want it to turn out (maybe inadvertently)
• Participant/self-selection biases: most experiments are done on first year psychology students...
• Task order effects: will the user have more knowledge by the time they get to task 2?
AVOIDING BIAS
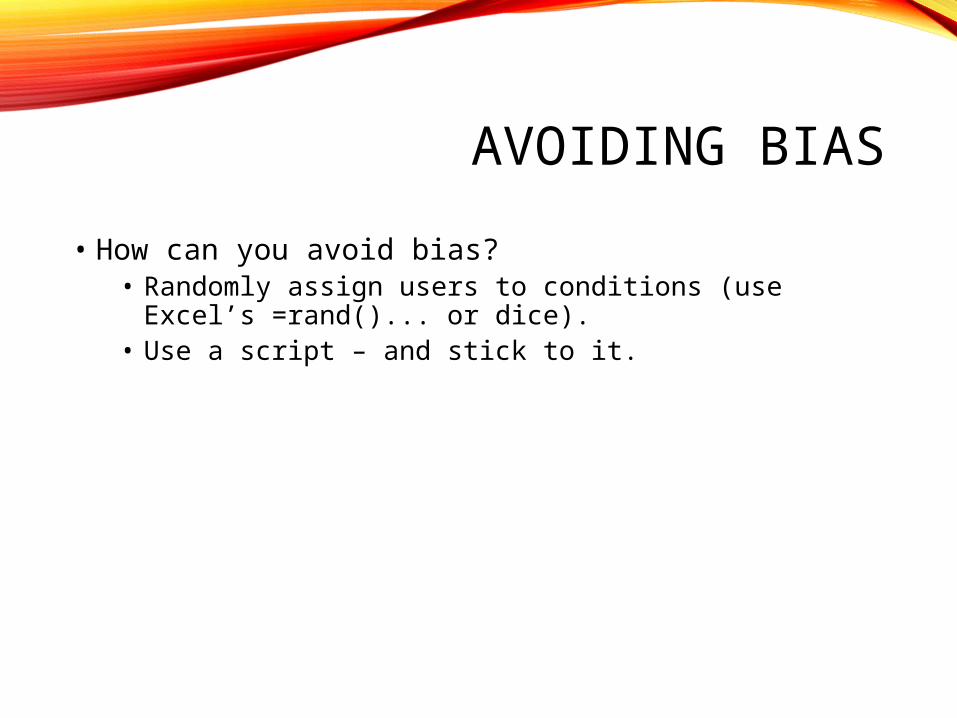
• How can you avoid bias?• Randomly assign users to conditions (use Excel’s
=rand()... or dice).• Use a script – and stick to it.
PLANNING A STUDY
• What about subjective measures?• How much did you enjoy using this application?• Which would you prefer to use again?• Demographics?
• Questionnaires are often the easiest way to get this information.• Be careful – don’t overload yourself with data.
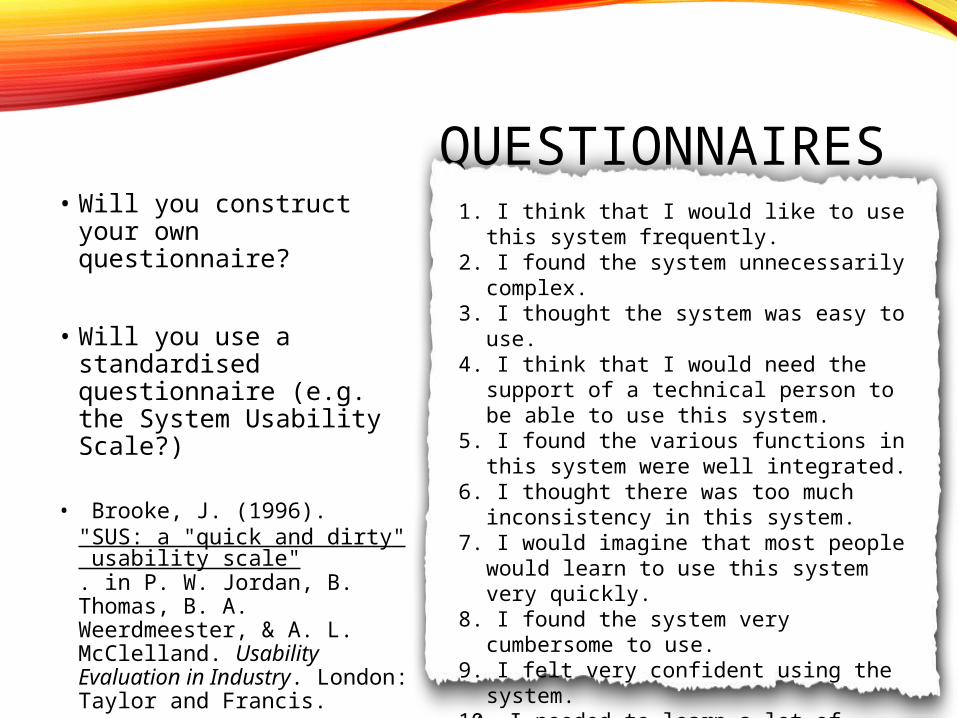
QUESTIONNAIRES• Will you construct your
own questionnaire?
• Will you use a standardised questionnaire (e.g. the System Usability Scale?)
• Brooke, J. (1996). "SUS: a "quick and dirty" usability scale". in P. W. Jordan, B. Thomas, B. A. Weerdmeester, & A. L. McClelland. Usability Evaluation in Industry. London: Taylor and Francis.
1. I think that I would like to use this system frequently.
2. I found the system unnecessarily complex.
3. I thought the system was easy to use.4. I think that I would need the support of a
technical person to be able to use this system.
5. I found the various functions in this system were well integrated.
6. I thought there was too much inconsistency in this system.
7. I would imagine that most people would learn to use this system very quickly.
8. I found the system very cumbersome to use.
9. I felt very confident using the system.10. I needed to learn a lot of things before I
could get going with this system.
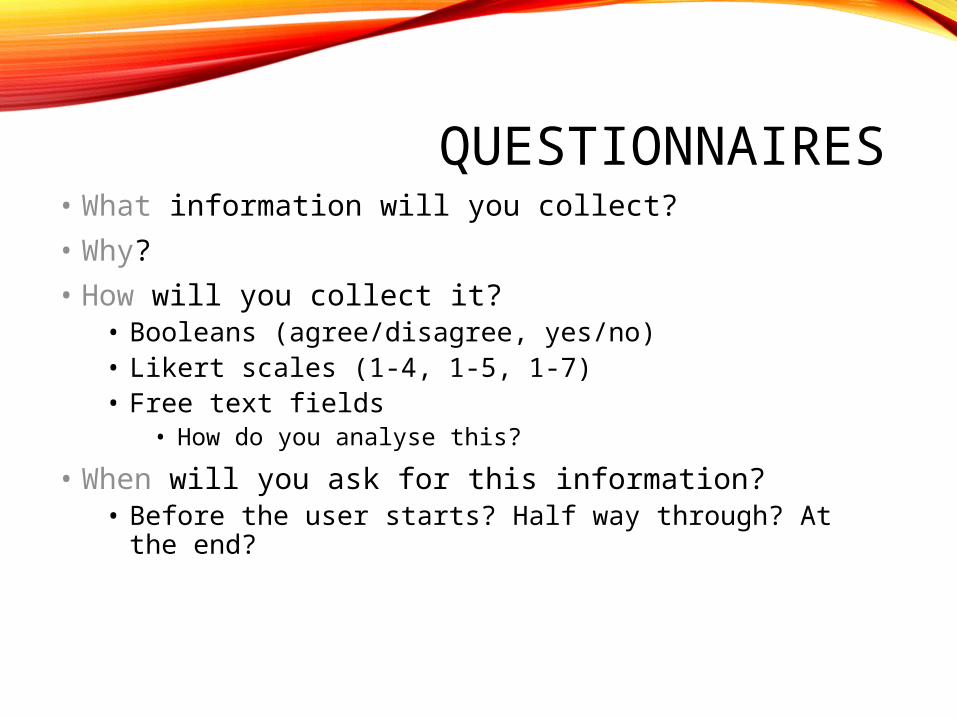
QUESTIONNAIRES• What information will you collect?
• Why?
• How will you collect it?• Booleans (agree/disagree, yes/no)• Likert scales (1-4, 1-5, 1-7)• Free text fields
• How do you analyse this?
• When will you ask for this information?• Before the user starts? Half way through? At the end?
QUESTIONNAIRES
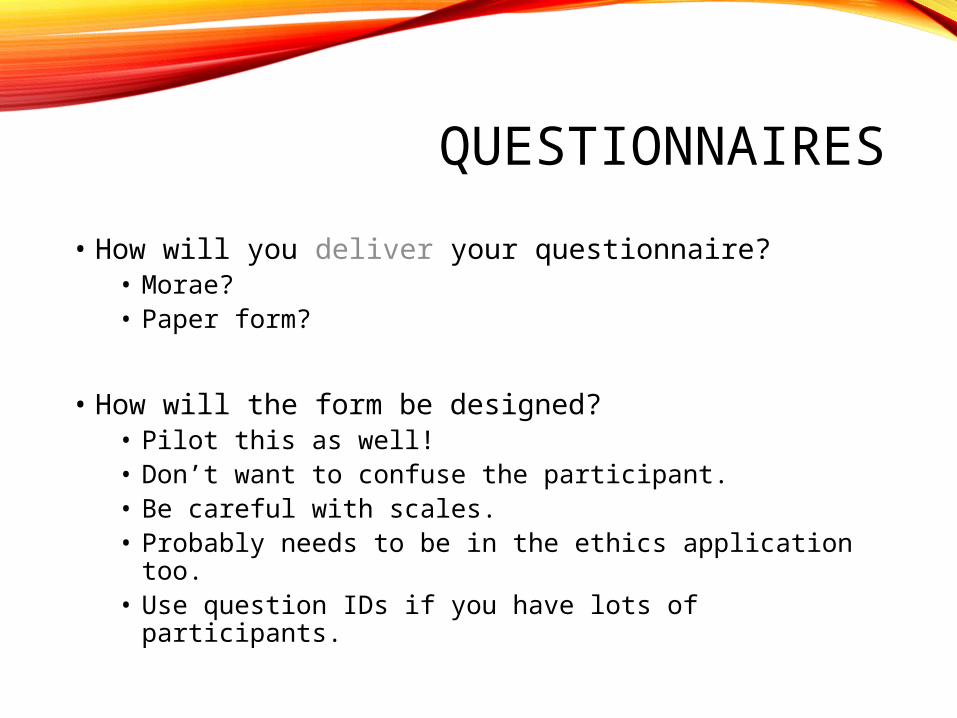
• How will you deliver your questionnaire?• Morae?• Paper form?
• How will the form be designed?• Pilot this as well!• Don’t want to confuse the participant.• Be careful with scales.• Probably needs to be in the ethics application too.• Use question IDs if you have lots of participants.

QUESTIONNAIRES
• How will you code the information?• Morae: you don’t need to.• Paper form: type in all the data?
• How will you analyse?• Which statistics will you calculate?• What effects do you expect?

GETTING PARTICIPANTS
• Work out the type and number of participants you need.• Usability studies: depends!
• 4 x 2 is a good• Do 4, analyse problems and correct most frequent problems• Do another 4 – correct any further major problems.
• Comparative studies: need to have enough for each permutation of task and system.
Condition Task 1 Task 2Task Application Task Application
1 Animals SketchHousehold Items Widget
2Household Items Sketch Animals Widget
3 Animals WidgetHousehold Items Sketch
4Household Items Widget Animals Sketch

GETTING PARTICIPANTS
• How will you find participants?• This will be important for the ethics application too.• Where will you advertise?• Who are you looking for?• Does age/background/gender/experience matter?
PILOTING
• This is more important than you think.
• In a crunch, just pilot with one participant. If possible, do 2-3 pilot studies.
• Make software and study design changes as you need to.• Try to get most of these done before the study begins.• You can sometimes make changes during a study too,
but check with your supervisor.
PERFORMING THE STUDY
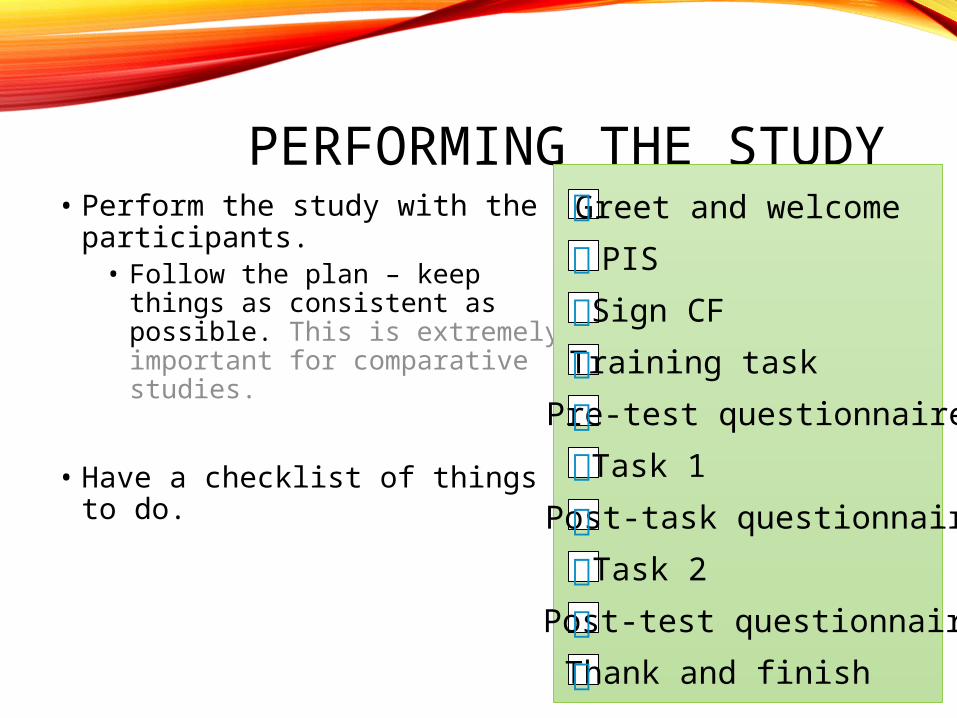
• Perform the study with the participants.• Follow the plan – keep things as
consistent as possible. This is extremely important for comparative studies.
• Have a checklist of things to do.
Greet and welcome
PIS
Sign CF
Training task
Pre-test questionnaire
Task 1
Post-task questionnaire
Post-test questionnaire
Task 2
Thank and finish
COLLECTING AND ANALYSING RESULTS
• Once you studies are finished, collect up your information.• If you’re doing a study which involves time coding, use
a program like Morae to flag the time indexes for each task – this helps a lot.
• Make sure you’ve defined this well so you are keeping your coding consistent.
• Then you can analyse these results.
A NOTE ON USABILITY TESTING RESEARCH PROJECTS
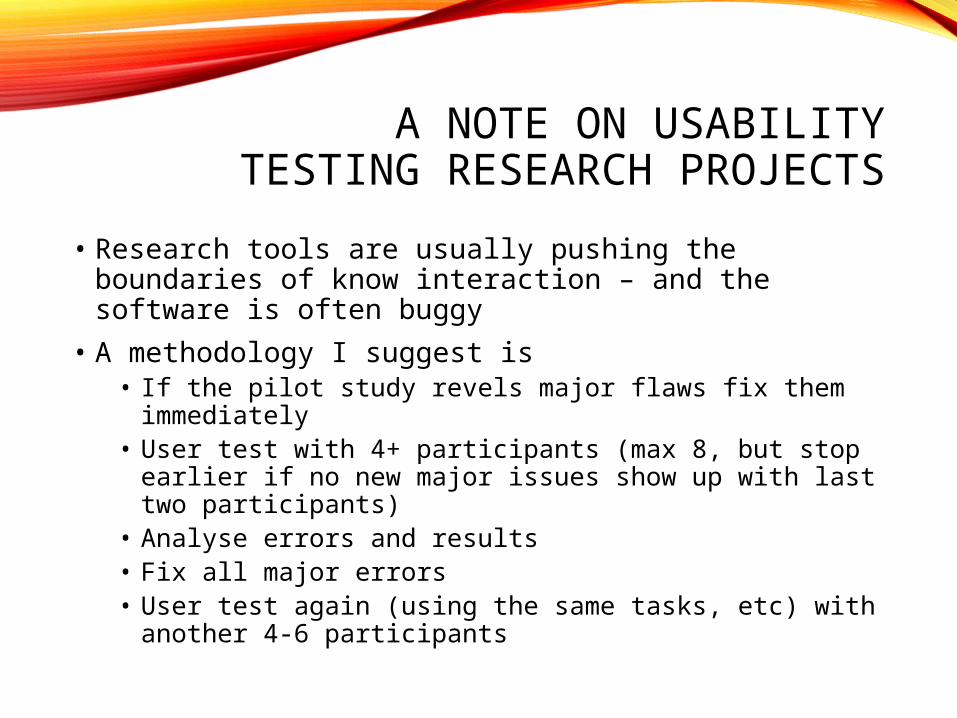
• Research tools are usually pushing the boundaries of know interaction – and the software is often buggy
• A methodology I suggest is • If the pilot study revels major flaws fix them
immediately • User test with 4+ participants (max 8, but stop earlier
if no new major issues show up with last two participants)
• Analyse errors and results• Fix all major errors• User test again (using the same tasks, etc) with
another 4-6 participants
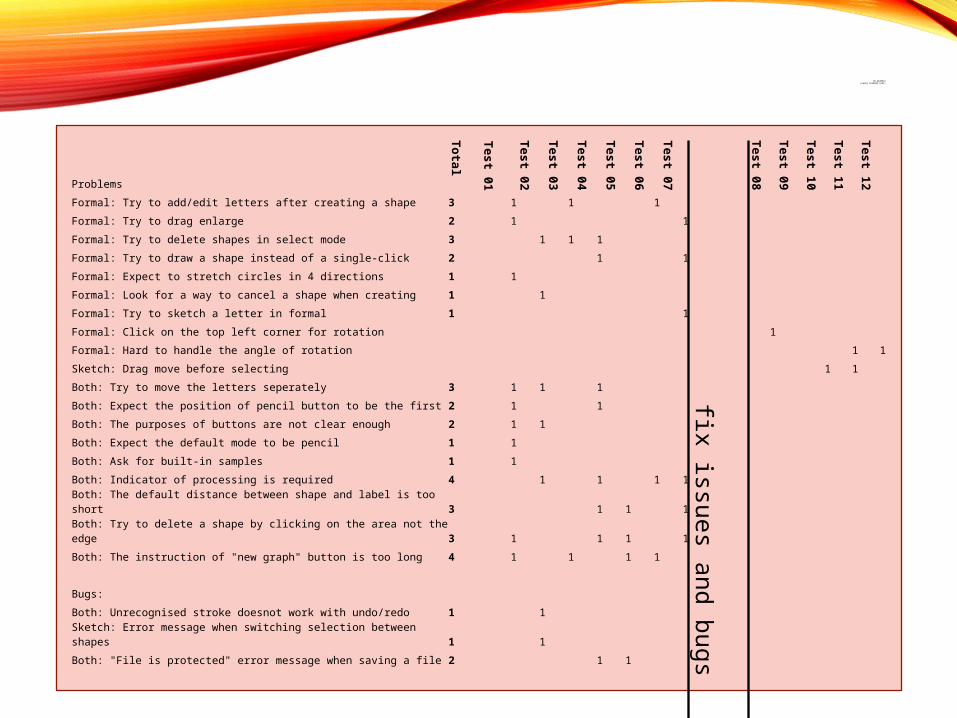
A N E X A M P L E(E U L E R D IA G R A M T O O L )
Problems Total
Test 01Test 02
Test 03
Test 04
Test 05
Test 06
Test 07
fix issues and bugs
Test 08
Test 09
Test 10
Test 11
Test 12
Formal: Try to add/edit letters after creating a shape 3 1 1 1
Formal: Try to drag enlarge 2 1 1
Formal: Try to delete shapes in select mode 3 1 1 1
Formal: Try to draw a shape instead of a single-click 2 1 1
Formal: Expect to stretch circles in 4 directions 1 1
Formal: Look for a way to cancel a shape when creating 1 1
Formal: Try to sketch a letter in formal 1 1
Formal: Click on the top left corner for rotation 1
Formal: Hard to handle the angle of rotation 1 1
Sketch: Drag move before selecting 1 1
Both: Try to move the letters seperately 3 1 1 1
Both: Expect the position of pencil button to be the first 2 1 1
Both: The purposes of buttons are not clear enough 2 1 1
Both: Expect the default mode to be pencil 1 1
Both: Ask for built-in samples 1 1
Both: Indicator of processing is required 4 1 1 1 1
Both: The default distance between shape and label is too short 3 1 1 1
Both: Try to delete a shape by clicking on the area not the edge 3 1 1 1 1
Both: The instruction of "new graph" button is too long 4 1 1 1 1
Bugs:
Both: Unrecognised stroke doesnot work with undo/redo 1 1
Sketch: Error message when switching selection between shapes 1 1
Both: "File is protected" error message when saving a file 2 1 1
Both: Duplicate letter are not properly handled 2 1 1

SURVEY RESULTSQuestionnaire 5: Strongly Agee 3: Neutral 1: Strongly Disagree
Information: Test 01 Test 02 Test 03 Test 04 Test 05 Test 06 Test 07 Test08 Test09 Test10 Test11 Test12 Average SD
Gender F M M F M M M F M M F M
Age 28 25 26 29 26 29 25
Maojr Business CS CS CS Infosys InfosysManagement CS CSCommerce Public Health CS
Computer tools 1/week < 1/month 1/month <1/month > 2/week <1/month <1/month <1/month Never <1/month <1/month <1/month
Sketching tools 1/week Never Never <1/month Never Never <1/month <1/month Never <1/month <1/month Never
Tablet PC Never NeverCouple of times Never
Couple of times Occasionally Never Occasionally Never Once NeverCouple of times
Sketch:
Understand the tasks 4 5 5 5 5 5 5 5 5 5 5 5 4.92 0.29
Easy to find buttons 3 5 4 5 4 4 5 5 5 4 5 5 4.50 0.67
Easy to create 3 5 4 5 4 4 5 5 5 4 5 5 4.50 0.67
Easy to edit 3 5 4 5 4 3 4 5 5 3 5 5 4.25 0.87
Overall easy 3 5 4 5 3 4 5 5 5 4 5 5 4.42 0.79
Formal:
Understand the tasks 5 5 5 5 5 5 5 5 5 5 5 5 5.00 0.00
Easy to find buttons 4 4 4 5 4 5 5 5 5 5 5 5 4.67 0.49
Easy to create 3 5 5 5 4 5 4 5 5 5 5 5 4.67 0.65
Easy to edit 2 5 5 5 4 5 5 5 5 5 5 4 4.58 0.90
Overall easy 3 5 5 5 3 5 5 5 5 5 5 5 4.67 0.78
Switching:
Understand the tasks 4 5 5 5 5 5 5 5 5 5 5 5 4.92 0.29
Easy to find buttons 3 5 4 5 5 5 5 5 5 4 5 5 4.67 0.65
Easy to create 3 5 5 4 3 5 5 5 5 5 5 5 4.58 0.79
Easy to edit 3 5 5 5 5 5 4 5 5 5 5 5 4.75 0.62
Overall easy 3 5 5 5 4 5 5 5 5 4 5 5 4.67 0.65
General:
Satisfied with amount of time 5 5 5 5 4 5 5 5 5 5 5 5 4.92 0.29
Satisfied with ease of completing 4 5 5 3 4 4 5 5 5 5 5 5 4.58 0.67
Conversion of shape is accurate 2 5 5 5 4 4 5 5 5 5 5 4 4.50 0.90
Conversion of text is accurate 3 5 5 5 4 4 5 5 5 4 5 5 4.58 0.67
Would like to use again 2 5 4 5 4 5 4 4 5 5 5 5 4.42 0.90
Preferred interface (drawing) Either Either Sketch Formal Formal Sketch Sketch Sketch Sketch Either Sketch Formal
Preferred interface (editing) Either Formal Sketch Either Either Either Formal Formal Sketch Formal Either Formal
Preferred interface (visualizing) Either Sketch Sketch Formal Formal Formal Formal Either Sketch Sketch Formal Either
Mixed satisfactio
n
Much higher results
STATISTICAL ANALYSIS
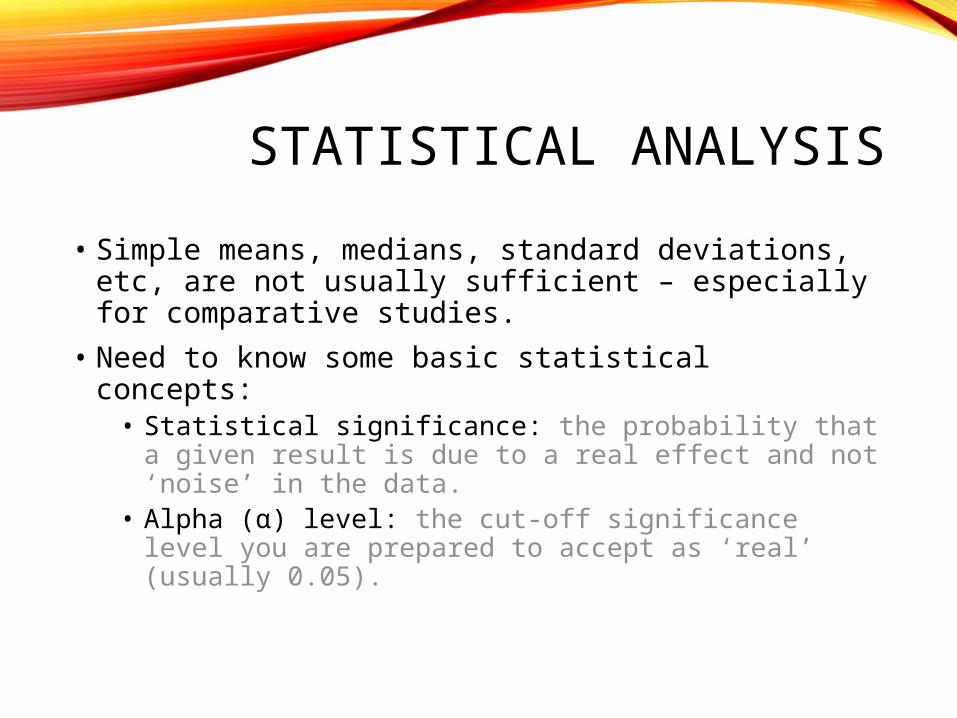
• Simple means, medians, standard deviations, etc, are not usually sufficient – especially for comparative studies.
• Need to know some basic statistical concepts:• Statistical significance: the probability that a given
result is due to a real effect and not ‘noise’ in the data.• Alpha (α) level: the cut-off significance level you are
prepared to accept as ‘real’ (usually 0.05).

STATISTICAL ANALYSIS
• There are many different types of tests.• t-test: describes the significance of the difference
between two means.• ANOVA (analysis of variance): describes the
significance of any differences between several means.• Chi square: describes the significance of the difference
between categorical variables.

STATISTICAL ANALYSIS
• The test you use will depends on the type of study and analysis.• t-test: many usability studies• ANOVA: almost all comparative studies• Chi square: some questionnaire items
• You’ll need to read about these before you do them – they all have assumptions that need to be met.

STATISTICAL ANALYSIS
• Example of a t-test:• Our α level = 0.05.• Males (N=20) score average 56% on a particular test.• Females (N=25) score 60% on the same test.• Run an independent samples t test and find that the
significance level is 0.07.• This is not a statistically significant result.
STATISTICAL ANALYSIS
• Don’t data mine!• i.e. run every possible combination of tests and see
which ones come out with a result you like.• This is very dodgy.• Know what you will be looking for ahead of time.

STATISTICAL ANALYSIS
• Good statistics do not make up for bad study design!• Choose participants wisely.• Specify exactly what you will measure.• Be consistent in how you deal with all participants and
how you look at their data.• Get someone else to check (or independently code) if
you’re worried.• Use the right statistical test for the problem – ask
someone for help if you’re in doubt.

REPORTING• How do you write up your study method and results?
Results Section“Data were analysed using [test]...”Report the exact test used, the p value,the test statistics (t, F, χ², etc).There are particular ways you report the statistics – check these.
Method Section1. Participants2. Apparatus3. Procedure
1. Pre-Test Familiarisation2. Screening3. Questionnaire4. Testing

REPORTING
Experimental data were analysed using a series of 2x2x2 factorial analyses of variance for factors software (sketch or widget), task (‘animals’ or ‘household items’) and order (1 or 2 – the order in which the participant performed the task).
For the ‘household items’ task, the mean number of nodes was significantly higher (F(1,8)=8.895, p=.018) for the widget software condition (mean 19.25 nodes) than the sketch software condition (mean 9.75 nodes).
Type of test used
Specific results, in ANOVA format, for
one task

ONE LAST EXAMPLE
• Which is the ‘best’ fisheye lens?
• Schmieder, P., Luxton-Reilly, A., Plimmer, B., & Hosking, J. (2013, September). Visual guides for comprehending digital ink in distortion lenses. In Proceedings of the 27th International BCS Human Computer Interaction Conference (p. 3). British Computer Society.
USEFUL REFERENCES
• Purchase, H.C. (2012). Experimental human-computer interaction: A practical guide with visual examples. Cambridge University Press.
• Cairns, P., & Cox, A. L. (2008). Research methods for human-computer interaction. Cambridge University Press.