synthesis of heterocyclic unit substituted carbazole...
TRANSCRIPT

SYNTHESIS OF HETEROCYCLIC UNIT SUBSTITUTED CARBAZOLE
DERIVATIVES AND THEIR ELECTROCHEMICAL POLYMERIZATION
A THESIS SUBMITTED TO
THE GRADUATE SCHOOL OF NATURAL AND APPLIED SCIENCES
OF
MIDDLE EAST TECHNICAL UNIVERSITY
BY
HATİCE ESRA OĞUZTÜRK
IN PARTIAL FULFILLMENT OF THE REQUIREMENTS
FOR
THE DEGREE OF MASTER OF SCIENCE
IN
POLYMER SCIENCE AND TECHNOLOGY
SEPTEMBER 2013

Approval of the thesis:
SYNTHESIS OF HETEROCYCLIC UNIT SUBSTITUTED CARBAZOLE
DERIVATIVES AND THEIR ELECTROCHEMICAL POLYMERIZATION
submitted by HATİCE ESRA OĞUZTÜRK in partial fulfillment of the requirements for the degree of Master of Science in Polymer Science and Technology Department,
Middle East Technical University by,
Prof. Dr. Canan Özgen
Dean, Graduate School of Natural and Applied Sciences ___________________
Prof. Dr. Teoman Tinçer
Head of Department, Polymer Science and Technology ___________________
Prof. Dr. Ahmet M. Önal ___________________
Supervisor, Chemistry Dept., METU
Assist. Prof. Dr. Seha Tirkeş ___________________
Co-Supervisor, Chem. Eng. And App. Chem. Dept., ATILIM UNIVERSITY
Examining Committee Members
Prof. Dr. Teoman Tinçer ___________________
Chemistry Dept., METU
Prof. Dr. Ahmet M. Önal ___________________
Chemistry Dept., METU
Assoc. Prof. Dr. Ali Cirpan ___________________
Chemistry Dept., METU
Assist. Prof. Dr. Seha Tirkeş ___________________
Co-Supervisor, Chem. Eng. And App. Chem. Dept., ATILIM UNIVERSITY
Assist. Prof. Dr. Akın Akdağ ___________________
Chemistry Department, METU
Date: 03.09.2013

iv
I hereby declare that all information in this document has been obtained and presented
in accordance with academic rules and ethical conduct. I also declare that, as required
by these rules and conduct, I have fully cited and referenced all materials and rules
that are not original to this work.
Name, Last Name: Hatice Esra OĞUZTÜRK
Signature:

v
ABSTRACT
SYNTHESIS OF HETEROCYCLIC UNIT SUBSTITUTED CARBAZOLE
DERIVATIVES AND THEIR ELECTROCHEMICAL POLYMERIZATION
Oğuztürk, Hatice Esra
MSc., Department of Chemistry
Supervisor: Prof. Dr. Ahmet M. Önal
Co-supervisor: Assist. Prof. Dr. Seha Tirkeş
September 2013, 50 pages
The study comprises synthesis of 3,6 and 2,7 substituted carbazole derivatives. Substitution
was done by furan groups. The main purpose to conduct this study is to synthesize new low
band gap donor-acceptor type monomers and analyze the differences stem from the
substitution site difference and alkyl chain effect attached to the nitrogen atom. For this aim,
four monomers; 3,6-Di(2-furyl)-9H-carbazole (M1), 3,6-Di(2-furyl)-9-ethyl-carbazole (M2),
2,7-Di(2-furyl)-9-H-carbazole (M3) , 2,7-Di(2-furyl)-9-(tridecan-7-yl)-9H-carbazole (M4),
were synthesized via Stille Cross Coupling reaction between brominated derivatives of
carbazole and furan. The synthesized molecules were characterized by spectroscopic
methods such as, NMR, UV-vis, and FTIR. The obtained molecules were investigated in
terms of electrochemical polymerization conditions. Polymers of these monomers; poly(3,6-
Di(2-furyl)-9H-carbazole) (P1), poly(3,6-Di(2-furyl)-9-ethyl-carbazole) (P2), poly(2,7-Di(2-
furyl)-9-H-carbazole) (P3), poly(2,7-Di(2-furyl)-9-(tridecan-7-yl)-9H-carbazole) (P4), were
synthesized by electrochemical polymerization with optimized conditions. The
characterization of corresponding polymers included analytical and electrochemical methods
like FTIR, UV-vis, cyclic voltammetry, spectroelectrochemical methods. After
characterization of polymers, polymer films were obtained and optical, electrochemical,
morphological and thermal properties of the polymers were investigated.
Keywords: D-A-D approach, electrochromic polymers, carbazole, furan

vi
ÖZ
HETEROSİKLİK VERİCİ-ALICI-VERİCİ TİPİ KARBAZOL TÜREVLERİNİN
SENTEZİ VE ELEKTROKİMYASAL POLİMERLEŞMELERİ
Oğuztürk, Hatice Esra
MSc., Department of Chemistry
Supervisor: Prof. Dr. Ahmet M. Önal
Co-supervisor: Assist. Prof. Dr. Seha Tirkeş
September 2013, 50 pages
Bu çalışmada 3,6 ve 2,7 konumlarından fonksiyonlandırılmış karbazol türevleri
sentezlenmiştir. Fonksiyonlandırma furan grupları ile yapılmıştır. Bu çalışmanın asıl amacı
düşük bant aralıklı alıcı-verici tipi yeni monomerlerin sentezi ve sübstitüsyon konumu ve
azot atomuna konumlandırılmış alkil zincirinden kaynaklanan farkların araştırılmasıdır. Bu
amaç için, dört monomer; 3,6-Di(2-furyl)-9H-carbazole (3,6-F-Cz-F), 3,6-Di(2-furyl)-9-
ethyl-carbazole (3,6-F-N-et-F), 2,7-Di(2-furyl)-9-H-carbazole (2,7-F-Cz-F) , 2,7-Di(2-
furyl)-9-(tridecan-7-yl)-9H-carbazole (2,7-F-3DCN-F), Stille Reaksiyonu ile
sentezlenmiştir. Sentezlenen moleküllerin karakterizasyonu NMR, UV-vis and FTIR gibi
spektroskopik yöntemlerle yapılmıştır. Elde edilen moleküller elektrokimyasal
polimerizasyon şartları açısından incelenmiş ve şartların optimizasyonundan sonra dört
polimer; poly(3,6-Di(2-furyl)-9H-carbazole) (P(3,6-F-Cz-F)), poly(3,6-Di(2-furyl)-9-ethyl-
carbazole) (P(3,6-F-N-et-F)), poly(2,7-Di(2-furyl)-9-H-carbazole) (P(2,7-F-Cz-F),
poly(2,7-Di(2-furyl)-9-(tridecan-7-yl)-9H-carbazole) (P(2,7-F-3DCN-F)), elektrokimyasal
yolla sentezlenmiştir. Sentezlenen polimerlerin karakterizasyonu FTIR, UV-vis, Döngülü
Voltametre ve spektroelektrokimyasal metotlarla yapılmıştır. Polimerlerin
karakterizasyonundan sonra, polimer filmleri sentezlenip optik, elektrokimyasal, morfolojik
ve termal özellikleri araştırılmıştır.
Anahtar Kelimeler: D-A yaklaşımı, elektrokromik polimerler, karbazol, furan

vii
TO MY BELOVED PARENTS,

viii
ACKNOWLEDGEMENTS
I would like to express my gratitude to my supervisor Prof. Dr. Ahmet M. Önal and my co-
supervisor Assist. Prof. Dr. Seha Tirkeş because of their guidance, support, encouragement
and of course patience. It is a great chance to take part in Önal’s research group.
I would like to thank Research Assistant Dr. Buket Bezgin Çarbaş for her sharing
experiences with me and also it would be difficult to finish this research without her support
on experiments.
I should thank Assoc. Prof. Dr. Atilla Cihaner for his suggestions and helpfulness.
I would like to thank head of department of Polymer Science and Technology, Prof. Dr. Teoman Tinçer for his encouragement, suggestions and also for thermal analyses.
I wish to thank Assist. Prof. Dr. Akın Akdağ for sharing his knowledge generously. Also, I should express that he is not only an instructor but also a brother that I could talk about
everything and every time.
My sincere thank is for Kıvanç Akkaş. He tried to answer my all questions about organic
part of my research with infinite patience and he had always time for me to help. I feel
myself very lucky to have a great friend for years like him.
My grateful thank is for Tuğba Kaya Deniz. She always believed in me and support every
time. She shared her experiences and helped all the time that I needed.
I should thank Serap Eken for her being such a perfect friend. She was always with me in lab
even in weekends and at nights which made me comfortable while working.
I would like to thank my dear friends Eda Karaarslan and Alper Büyük for their encouragement every time. Whenever I had in trouble with lab work, they took me for a little
bit breath and they have always a couch for me to sleep in their flat.
I should also thank to Onur Özdemir, Vildan Sanduvaç, Halil İpek and Yağız Ünver for their
endless helps.
My precious thanks go to my dear parents Emine Oğuztürk and Mustafa Kemal Oğuztürk,
and my lovely brother Murat Oğuztürk for their endless support and love and of course
understanding.

ix
TABLE OF CONTENTS
ABSTRACT..............................................................................................................................v
ÖZ.............................................................................................................................................vi
ACKNOWLEDGEMENTS...................................................................................................viii
TABLE OF CONTENTS.........................................................................................................ix
LIST OF TABLES..................................................................................................................xii
LIST OF FIGURES...............................................................................................................xiii
LIST OF SCHEMES...............................................................................................................xv
ABBREVATIONS.................................................................................................................xvi
CHAPTERS
1. INTRODUCTION ....................................................................................................... 1
1.1. Electrically Conducting Polymers ......................................................................... 1
1.2. Brief History of Conducting Polymers .................................................................. 1
1.3. Conductivity ......................................................................................................... 2
1.3.1 Factors Affecting on Tuning and Modification of the Band Gap ...................... 2
1.4. Chromism ............................................................................................................. 4
1.4.1. Electrochromism ............................................................................................ 4
1.4.1.1 Electrochromic Contrast ........................................................................... 4
1.4.1.2 Coloration Efficiency (Electrochromic Efficiency) ................................... 4
1.4.1.3. Switching Speed ...................................................................................... 5
1.4.1.4. Optical Memory ...................................................................................... 5
1.4.1.5. Stability ................................................................................................... 5
1.4.2. Origin of Electrochromism in Conjugated Polymers ....................................... 5
1.5.1. Charge Carriers .............................................................................................. 6
x
1.6. Synthesis of Doped Polymers ................................................................................ 7
1.6.1. Electrochemical Polymerization ...................................................................... 7
1.7. Overview of Carbazole and Polycarbazole ............................................................. 8
1.8. Overview of Furan and Polyfuran ..............................................................................9
1.9. Coupling Reactions ............................................................................................. 10
1.9.1. Stille Cross-Coupling Reaction ..................................................................... 10
1.9.2. Advantages of Stille Coupling....................................................................... 10
1.9.3. Mechanism of the Stille Coupling Reaction ................................................... 10
Aim of the Study ........................................................................................................ 12
2. EXPERIMENTAL ..................................................................................................... 13
2.1. Materials ............................................................................................................. 13
2.1.1. Monomer Synthesis ...................................................................................... 13
2.1.2. Polymerization and Analysis ......................................................................... 13
2.2. Instrumentation ................................................................................................... 13
2.3. Synthesis Route ................................................................................................... 14
2.3.1. Monomer Synthesis ...................................................................................... 14
2.3.1.1 Bromination of Acceptor Groups ............................................................. 14
2.3.1.2 Coupling of Donor and Acceptor Groups................................................. 15
3.1.2. Polymer Synthesis ........................................................................................ 19
3. RESULTS AND DISCUSSION ................................................................................. 21
3.1. Structural Design of the Monomer ....................................................................... 21
3.2. Properties of the Monomers ................................................................................. 21
3.2.1. Electrochemical Properties of the Monomers ................................................ 21
3.2.2. UV-VIS and Fluorescence spectra of the Monomers .................................... 22
3.3. Electrochemical Polymerization and Characteristics of the Polymers ....................... 24
3.3.1. Electrochemical Polymerization .................................................................... 24
3.3.2. Scan Rate Dependence Study of the Polymers ............................................... 25

xi
3.3.3. Spectroelectrochemical and Switching Attitudes of the Polymers ..................26
3.3.4. Colorimetric Measurements of the Polymers .................................................29
3.3.5. FTIR Results of the Polymers........................................................................30
3.4. Properties of the Polymers ...................................................................................31
3.4.1 Energy Band Diagram and Conductivities of the Polymers...............................31
3.4.2. Morphology of the Polymers .........................................................................33
3.4.3. DSC results and Thermal Properties of the Polymers .....................................34
4. CONCLUSIONS ........................................................................................................37
REFERENCES ..................................................................................................................39
APPENDICES
A: FTIR SPECTRA OF THE MONOMERS AND THE POLYMERS.............................43
B: NMR SPECTRA OF THE MONOMERS.....................................................................45

xii
LIST OF TABLES
Table 3.1. Electrochemical data of monomers and their constituents vs. Ag/ AgCl...............22
Table 3.2 Colors of the polymers in their neutral and oxidized states....................................28
Table 3.3. Optical and switching time data of electrochemically synthesized polymers........29
Table 3.4. L*, a*, b* measurements of the polymers in neutral, intermediate and oxidized
states........................................................................................................................................30
Table 3.5 Electrochemical property, band-gap and conductivity of the polymers..................32

xiii
LIST OF FIGURES
Figure 1.1. Applications of conjugated polymers, a) sensor, b) OFETs, c) solar cell..............2
Figure 1.2. Schematic representation of three types of materials in terms of their band
gaps…........................................................................................................................................2
Figure 1.3. Energy Diagram of poly(3,4-ethlenedioxythiophene), poly(cyanoacetylene) and
the combined polymer...............................................................................................................3
Figure 1.4. The allowed transitions of thiophene trimer in neutral, polaron and bipolaron
states..........................................................................................................................................6
Figure 1.5. Formation of the polaron and bipolaron bands during oxidation.........................7
Figure 3.1. Cyclic voltammograms of monomers and their constituents together with
ferrocene a) M1, b) M2, c) M3, d) M4 recorded in 0.1 M TBAPF6/ACN electrolytic
solution............................................................................................................................. .......22
Figure 3.2. Electronic absorption spectra and photoluminescence spectra of monomers in
ACN solution a) M1, b) M2, c) M3, d) M4………………………………………………….23
Figure 3.3. Normalized UV-VIS absorption a) and PL spectra b) of monomers M1, M2, M3
and M4 (Excitation at 340 nm)…………………………………………………………........24
Figure 3.4. Electropolymerization of monomers at 200 mV/s in ACN and 0.1 M TBAPF6 as
electrolyte a) M1, b) M2, c) M3, d) M4..................................................................................25
Figure 3.5. CV of polymers at different scan rates changing between 20- 200 mV/s in ACN
and 0.1 M TBAPF6 as electrolyte a) P1b) P2, c) P3, d) P4 (Inset: Relationship of anodic and
cathodic currents with respect to scan rate)…………………………………………….........26
Figure 3.6. Electronic absorption spectra of polymers on ITO at 50 mV/s in ACN and 0.1 M
TBAPF6 as electrolyte between 0-1.1 V a) P1, b) P2, c) P3, d) P4………………………….27
Figure 3.7. Choronoabsorptometry experiment for P1 on ITO in ACN/ 0.1 M TBAPF6…...29
Figure 3.8. Electronic absorption spectra of P1 on ITO to represent band gap value
determination...........................................................................................................................32
Figure 3.9. Energy band diagrams of the polymers................................................................33
Figure 3.10. SEM micrographs of P1, P2 and P4. Magnification: x2500 for a, and x15000 for
b............................................................................................................................. ..................34

xiv
Figure 3.11. DSC results of polymers a) P1, b) P2 and c) P4 (Inset: Derivative of the heat
flow vs. temperature)…………………………………………………….…………………..35

xv
LIST OF SCHEMES
Scheme 1.1. Oxidation of a conjugated polymer…………………………………………….7
Scheme 1.2. Mechanism of electrochemical polymerization of heterocyclic monomers (X =
O, S, and NH)……………………………………………………………………………...….8
Scheme 1.3. Structure of Carbazole…………………………………………………………..8
Scheme 1.4. Structure of furan………………………………………………………………..9
Scheme 1.5. General Mechanism of Stille Cross-Coupling Reaction…………………...…..11
Scheme 1.6. D-A-D type polymers including P1, P2, P3, P4……………………………….12
Scheme 2.1. Bromination reaction of carbazole derivatives………………………………...15
Scheme 2.2. Reaction set-up for coupling reactions of brominated carbazole derivatives and
furan…...……………………………………………………………………………………..17
Scheme 2.3. Coupling reactions between carbazole derivatives and furan………………….18
Scheme 2.4. Electrochemical polymerization of monomers………………………………...19

xvi
ABBREVIATIONS
% T Percent Transmittance
a.u. Arbitrary Unit
A Acceptor
ACN Acetonitrile
CB Conduction Band
CE Counter Electrode
CE Coloration Efficiency
CV Cyclic Voltammetry
D Donor
D-A-D Donor-Acceptor-Donor
DCM Dichloromethane
DSC Differential Scanning Calorimeter
Eg Band Gap
HOMO Highest Occupied Molecular Orbital
ITO Indium Tin Oxide
LUMO Lowest Unoccupied Molecular Orbital
RE Reference Electrode
SEM Scanning Electron Microscope
SPEL Spectroelectrochemistry
t Time
TBAPF6 Tetrabutylammonium hexafluorophosphate
TLC Thin Layer Chromatography
VB Valance Band
WE Working Electrode

1
CHAPTER 1
INTRODUCTION
1.1. Electrically Conducting Polymers Conjugated polymers that conduct electricity are called as conductive polymers. These compounds may have metallic conductivity with conductivity in the range of 104-106 S.cm-1 or can be semiconductors. After conjugated polymers started to take part in electrically conductive materials, studies on simple modification of ordinary conjugated polymers have been increasing day by day1. For the last three decades, conjugated organic polymers have been widely studied. They were reported as successful in being electrically conductive. Conducting polymers are also advantageous for many aspects when compared to other conducting materials including light weight, greater workability, resistance to corrosion and chemical attack, and lower cost2.
1.2. Brief History of Conducting Polymers In 1977, A.J. Heeger, A. G. MacDiarmid and H.Shirakawa reported that polyacetylene, PA, a naturally insulating polymer, becomes highly conducting after being exposed to iodine vapor (an electron-acceptor). This process is called as doping. With this study, they won the Nobel Prize in chemistry in 20003. After this discovery, studies have been continuing on other candidates of organic conjugated systems. Polythiophene, PTh, polypyrolle, PPy, polyaniline, PANI, polyfluorene, PF, and polycarbazole, PCz, can be counted as popular examples in this group. The increasing demand on synthesizing these types of conjugated polymers is because of the wide application areas such as organic light-emitting diodes (OLEDs), organic thin film transistors (OTFTs), organic nonvolatile memory, sensors, and organic photovoltaic cells (OPVs) 1. Furthermore, conjugated polymers have the advantage of the higher degree of color tunability through structural modification4. In Figure 1.1, some of the application areas of conjugated polymers are shown.

2
Figure 1.1. Applications of conjugated polymers, a) sensor, b) OFETs, c) solar cell
1.3. Conductivity Depending on their conductivities materials could be classified into three main categories as insulators, semiconductors and conductors based on the magnitude of the energy difference between highest occupied molecular orbital (HOMO) and lowest unoccupied molecular orbital (LUMO). This energy difference is known as the band gap, Eg, and is equivalent to the energy needed to free an outer shell electron to become a mobile charge carrier. Thus, the band gap is the major factor which determines the electrical conductivity of the material. As it is shown in Figure 1.2, the band gap value for insulators is greater than 3.0 eV, metals on the other hand, have zero band gap energy due to the overlap of valance and conduction bands. The band gap value for semiconductors is usually less than 3.0 eV which makes promotion of valance band electrons to the conduction band possible via different kinds of excitations.
Figure 1.2. Schematic representation of three types of materials in terms of their band gaps5.
1.3.1 Factors Affecting on Tuning and Modification of the Band Gap Since, the band gap is the major factor which determines the electrical conductivity of the material, tuning of the band gap has crucial importance in determining the application area of
a) c) b)

3
conjugated polymers. Following factors are among the most important in band gap engineering6:
1. Molecular weight 2. Bond Length Alternation 3. Planarity 4. Aromatic Resonance Energy 5. Substituents 6. Intermolecular Attractions
Most popular methods to modify the band gap of conjugated polymers are either substitution effect or utilizing electron donor and electron acceptor units alternatingly along the polymer backbone. The second approach is based on the appropriate combination of electron donating and electron withdrawing substituents. Electron donating substituents increase the HOMO level (or valance band), and electron acceptor units positioned in the middle decrease the LUMO level (or conduction band) so synthesized co-monomer and its polymer both have low band gap.
Poly (bis-3,4 ethylenedioxythiophene-cyano vinylene) (PBEDOT-CNV) is a good example to analyze the effect of alternating donor-acceptor units on the band gap. Cyano vinylene is acting as an acceptor unit and two EDOT on both sides of cyano vinylene are acting as donor units. The resulting polymer has a lower band gap (approximately 1.1-1.2 eV) than the parent homopolymers4.
Another example of donor-acceptor approach is Poly (bis-3,4 ethylenedioxythiophene-cyano acetylene). The combined polymer has lower band gap than the parental units ((3,4-ethlenedioxythiophene) and poly(cyanoacetylene))5 as shown in Figure 1.3.
Figure 1.3. Energy Diagram of poly(3,4-ethlenedioxythiophene), poly(cyanoacetylene) and the combined polymer5

4
1.4. Chromism Chromism is a reversible change in a substance’s color resulting from a process caused by some form of stimulus7. There are different types of chromism depending on the type of stimulus. Among them, thermochromism, photochromism, solvatochromism, and electrochromism are most common. Reversible color change is achieved by temperature change in thermochromism. In the case of photochromism, exposure to electromagnetic radiation is the reason for the color change. Solvent and potential changes are the stimuli for solvatochromism and electrochromism, respectively.
1.4.1. Electrochromism Electrochromism can be defined as the reversible optical change due to an applied external voltage and has been known since 1968. Electrochromic materials can be divided into three groups:
Metal Oxide Films
Molecular Dyes
Conducting Polymers
Among them, conducting polymers present additional advantages8, such as;
1. Easy processability 2. Rapid response time 3. High optical contrast and 4. Ability to modify their structure to obtain multicolor electrochromes
For these reasons, PTh, PPy, and PANI derivatives are widely used in electrochromic device applications such as smart windows, optical shutters, mirrors and displays.
To identify and characterize electrochromism, there are some important parameters including electrochromic contrast, coloration efficiency, switching speed, stability, and optical memory.
1.4.1.1 Electrochromic Contrast Electrochromic contrast is defined as the percent transmittance change (Δ%T) at a specific wavelength where the electrochromic material has the highest optical contrast8. For some cases, rather than using a single wavelength, a specific range may be used to report a contrast. For calculations, the sensitivity of human eye to different wavelengths is taken into account.
1.4.1.2 Coloration Efficiency (Electrochromic Efficiency) Coloration efficiency is the ratio of optical density change per area as a function electrical charge induced during oxidation and reduction of the material8.
η = (ΔOD)/ Qd= log [Tb/Tc]/ Qd
5
where η (cm2/C) is the coloration efficiency at a given λ (wavelength) and Tb and Tc are the bleached and the colored transmittance values, respectively.
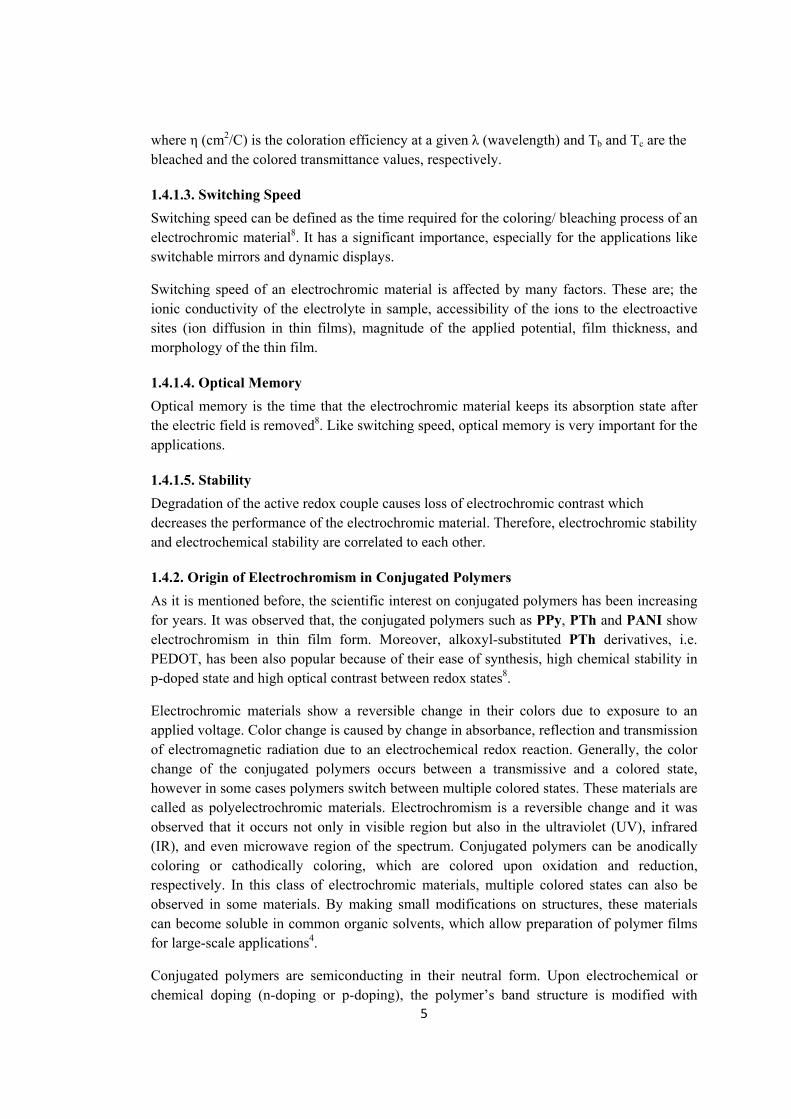
1.4.1.3. Switching Speed Switching speed can be defined as the time required for the coloring/ bleaching process of an electrochromic material8. It has a significant importance, especially for the applications like switchable mirrors and dynamic displays.
Switching speed of an electrochromic material is affected by many factors. These are; the ionic conductivity of the electrolyte in sample, accessibility of the ions to the electroactive sites (ion diffusion in thin films), magnitude of the applied potential, film thickness, and morphology of the thin film.
1.4.1.4. Optical Memory Optical memory is the time that the electrochromic material keeps its absorption state after the electric field is removed8. Like switching speed, optical memory is very important for the applications.
1.4.1.5. Stability Degradation of the active redox couple causes loss of electrochromic contrast which decreases the performance of the electrochromic material. Therefore, electrochromic stability and electrochemical stability are correlated to each other.
1.4.2. Origin of Electrochromism in Conjugated Polymers As it is mentioned before, the scientific interest on conjugated polymers has been increasing for years. It was observed that, the conjugated polymers such as PPy, PTh and PANI show electrochromism in thin film form. Moreover, alkoxyl-substituted PTh derivatives, i.e. PEDOT, has been also popular because of their ease of synthesis, high chemical stability in p-doped state and high optical contrast between redox states8.
Electrochromic materials show a reversible change in their colors due to exposure to an applied voltage. Color change is caused by change in absorbance, reflection and transmission of electromagnetic radiation due to an electrochemical redox reaction. Generally, the color change of the conjugated polymers occurs between a transmissive and a colored state, however in some cases polymers switch between multiple colored states. These materials are called as polyelectrochromic materials. Electrochromism is a reversible change and it was observed that it occurs not only in visible region but also in the ultraviolet (UV), infrared (IR), and even microwave region of the spectrum. Conjugated polymers can be anodically coloring or cathodically coloring, which are colored upon oxidation and reduction, respectively. In this class of electrochromic materials, multiple colored states can also be observed in some materials. By making small modifications on structures, these materials can become soluble in common organic solvents, which allow preparation of polymer films for large-scale applications4.
Conjugated polymers are semiconducting in their neutral form. Upon electrochemical or chemical doping (n-doping or p-doping), the polymer’s band structure is modified with

6
formation of lower energy intra-band transitions and creation of charge carriers (polaron and bipolarons). These charge carriers are responsible for the increased conductivity and optical modulation8. Conjugated polymers’ π-π* transition is characterized by the polymers band gap, Eg and λmax. Due to the optical properties of the polymers which is determined by the π-π* transition, all conjugated polymers are potentially electrochromic materials4. The optical band gap in conjugated polymers is evaluated from the π-π* transition of the neutral polymer4.
Figure 1.4. The allowed transitions of thiophene trimer in neutral, polaron and bipolaron states4
1.5.1. Charge Carriers High conductivity of conjugated polymers is the result of the formation of self-localized excitations such as solitons, polarons and bipolarons during doping process. The formation of these excitations which may move freely through the material stems from the strong interaction between the charge on the chain which may be electron or hole, and the molecular structure2.
In a neutral conjugated polymer, electronic transition occurs between the valence band and the conduction band. At low oxidation levels, electrons move from the valence band and a radical cation is formed which behaves as a polaronic charge carrier. The radical cation is delocalized over a polymer segment. Upon further oxidation of the polymer, a dication formation is observed. The new electronic transitions which can be called as bipolaron levels occur from the top of the valence band to unoccupied bipolaron level4. Scheme 1.1 shows the dication formation on a conjugated linear chain and Figure 1.5 represents the new electronic transitions which make electron movement easier along the chain during oxidation.

7
Scheme 1.1. Oxidation of a conjugated polymer9
Figure 1.5. Formation of the polaron and bipolaron bands during oxidation10
1.6. Synthesis of Doped Polymers Doped electrically conductive polymers can be obtained by three different methods2:
1. Chemical synthesis of the polymer and then doping with oxidizing or reducing agents
2. Chemical synthesis of the polymer followed by doping by an electrochemical method.
3. Electrochemical polymerization and doping with a suitable dopant during the process
1.6.1. Electrochemical Polymerization PPy, PTh, PF, PCz and their derivatives are some examples of conjugated-conductive polymers. These polymers can be obtained by electrochemical polymerization and simultaneously doping with the suitable dopant. Therefore, polymers can be obtained pure and homogeneous. Electrochemical polymerization mechanism has some steps including:
1. Formation of the radical cation via oxidation of the monomer 2. Dimerization of the radical cations to obtain a neutral dimer with the loss of proton 3. The reaction between dimer radical cation and another radical cation

8
X2 - 2 e-
X2
.+
XX
H
H
+
+
-2H+
XX
- e-
XX
H .X.+
XX
H
H
+
+X X X
X + 2H+
Scheme 1.2 given below, represents the mechanism of electro-oxidative polymerization of heterocyclic monomers.
Scheme 1.2. Mechanism of electrochemical polymerization of heterocyclic monomers (X = O, S, and NH) 11
1.7. Overview of Carbazole and Polycarbazole Carbazole is a heterocyclic, tricyclic compound with two benzene rings and between them, a five-membered nitrogen containing ring12. It is a thermally stable material with boiling point of 355°C and melting point in the range of 247–248°C. Thermal stability of a material is important to deal with it due to its easiness during further reactions. In Scheme 1.3, the structure of carbazole together with its numbering system is shown.
Scheme 1.3. Structure of Carbazole
The most reactive sites of carbazole for coupling reaction are 3,6 and 9 positions. 1,8 substitution is also possible but these positions are sterically hindered due to the rigid structure of the molecule13. By adding different substituents to the possible substitution sites of carbazole, optical and electrical properties of the monomers can be adjusted. The possible substitution sites of carbazole are 2-, 3-, 6-, 7-, and 9-12.
Furthermore, carbazole can easily be polymerized via electrochemical or chemical polymerization techniques to yield conjugated polymer. In general, polymerization proceeds either through 3,6- or 2,7-positions. Among various classes of conjugated polymers,

9
polycarbazole derivatives are of great importance because of its variety of useful properties, such as easy formation of relatively stable radical cations (holes), high charge carrier mobility, and high thermal and photochemical stability14-18. These properties make polycarbazole derivatives as suitable materials for optoelectronic applications. Since carbazole moiety is fully aromatic19, in contrast to fluorene unit, it has better chemical and environmental stability which makes it applicable as light-emitting layer, emitting blue light. Moreover, carbazole derivatives are widely used as charge-transporting materials. Followings are some of the reasons for carbazole and their derivatives being suitable for opto-electronic applications19:
i. To obtain a stable radical cations (holes) is easy from carbozolyl groups, ii. Some carbazole-containing compounds exhibit relatively high charge carrier
mobilities; iii. Different substituents can be easily introduced into the carbazole ring; iv. Carbazole-containing compounds exhibit high thermal and photochemical
stability; v. Carbazole is a cheap raw material readily available from coal-tar distillation.
One disadvantage of PCz’s to mention is their poor solubility in common solvents. To solve the solubility problem bulky side chains are usually attached onto the conjugated polymer backbone20.
1.8. Overview of Furan and Polyfuran Furan is one of the simplest five membered aromatic heterocyclic compounds (Scheme 1.4). Pyrrole and thiophene are other members of this class. Furan has a planar unsaturated structure and it has one heteroatom like thiophene and pyrrole. These systems can be stated as aromatic systems in case of including an interrupted cycle of p-orbitals containing six electrons. Furan has four carbon atoms and the oxygen atom is sp2 hybridized21.
Scheme 1.4. Structure of furan
Similar to thiophene and pyrrole, furan can also be polymerized to yield conjugated polymers. However, studies that involve polymerization of furan have remained limited due to the susceptibility of furan on the side reactions (i.e., ring opening) during its polymerization. To overcome this disadvantage, many methods have been tried including the use of boron trifuoridediethylether to reduce the aromaticity of the furan ring to avoid overoxidation and making the copolymers of furan with different monomeric units such as thiophene22. However, the corresponding polymers were not fully conjugated. In order to lower the oxidation potential of furan and to obtain fully conjugated polyfurans, hybrid conjugated polymers utilizing donor-acceptor approach have been used23, 24.

10
Thus, the development of new low-band gap copolymers based on furan and carbazole units should therefore lead to interesting features for optoelectronic applications.
1.9. Coupling Reactions In the synthesis of hybrid monomers by coupling two heterocyclic monomers one containing electron donor substituent and the other containing electron withdrawing substituents, palladium catalyzed cross-coupling reactions are preferred. The type of the cross-coupling reaction changes with respect to the reactants. The main palladium catalyzed cross-coupling reactions can be classified as Heck Reaction, Stille Reaction, Suzuki Reaction, Sonogashira Reaction, Tsuji-Trost Reaction, and Negishi reaction.
To perform coupling reaction of carbazole derivatives and furan, Stille Cross-Coupling Reaction was used.
1.9.1. Stille Cross-Coupling Reaction Stille coupling reaction occurs between stannanes and aryl halides25. It has been applied to synthesize various organic compounds due to its advantages. Different functional groups can be used in Stille coupling and the reaction takes place under mild conditions. Therefore, Stille coupling is a widely preferred reaction to design desirable materials which can take part in specific applications from nonlinear optics to biologic sensors. One of the most appealing usages of Stille coupling reaction has been made for the synthesis of conjugated polyaromatic systems. Due to their semiconducting properties, these systems have been popular for the last two decades.
1.9.2. Advantages of Stille Coupling A wide variety of organometallic reactions can be used for the formation of sp2-sp2 carbon bonds, like in semiconducting polymers25. Heck, Suzuki-Miyaura, Sonogashira and Yamamoto reactions can be counted in this class of reactions. There are some differences between Stille coupling reaction and the other organometallic reactions which make Stille coupling reaction more advantageous. First of all, Stille coupling is stereospecific, regioselective and gives high yields. Also, organotin and organohalide compounds can be prepared easily without the necessity of protecting functionalities in the monomers. Besides these advantages, Stille coupling has mild reaction conditions including high monomer solubility, wide range of functional group usage, and simple preparation of monomers. Due to these reasons, Stille coupling reaction is one of the most preferable reactions in organometallic chemistry.
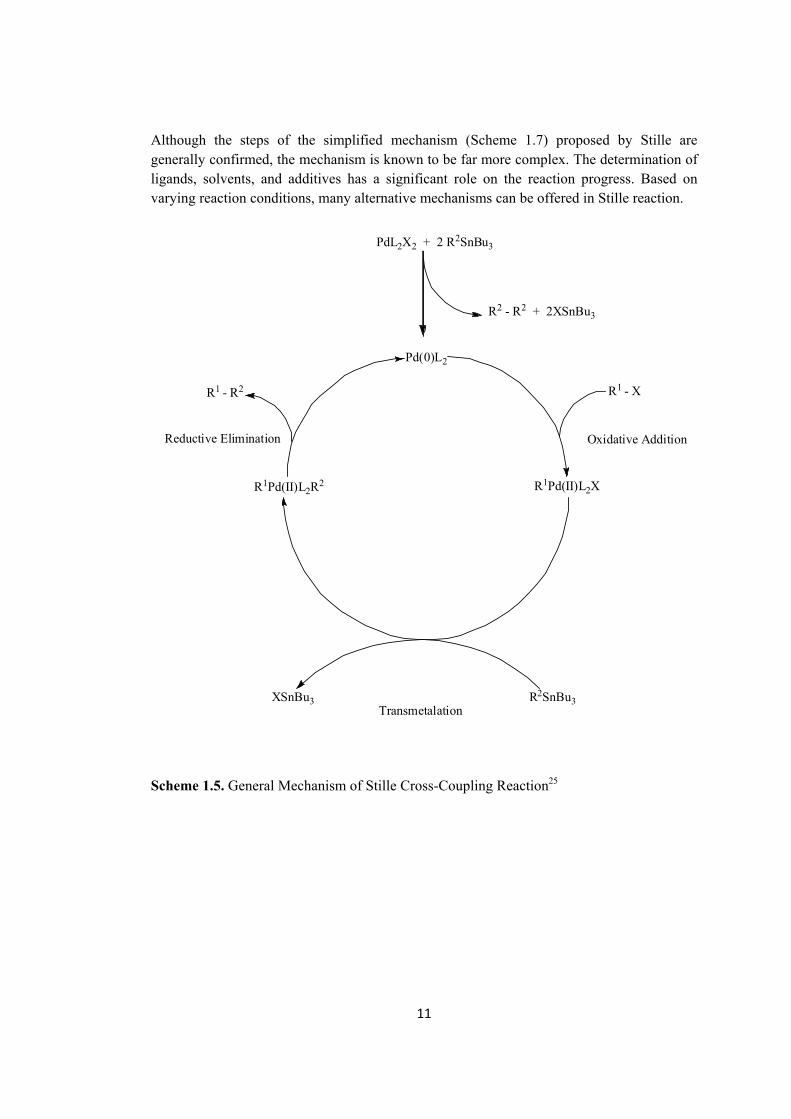
1.9.3. Mechanism of the Stille Coupling Reaction The Stille reaction encloses Pd (0)- mediated cross-coupling of organohalides, triflated, and acyl chlorides with organostannanes. As it is seen in Scheme 1.7, mechanism consists of three steps. Reaction starts with an oxidative step, secondly a transmetallation step takes part and transmetallation step is followed by reductive elimination step which results in the product formation and regeneration of the catalyst25. The Pd(0) is the active catalyst, so Pd(II) is used to be reduced to Pd(0) by organostannane monomers giving the possibility to enter the catalytic cycle.
11
PdL2X2 + 2 R2SnBu3
R2 - R2 + 2XSnBu3
Pd(0)L2
R1 - X
Oxidative Addition
R1Pd(II)L2XR1Pd(II)L2R2
R1 - R2
Reductive Elimination
R2SnBu3XSnBu3Transmetalation
Although the steps of the simplified mechanism (Scheme 1.7) proposed by Stille are generally confirmed, the mechanism is known to be far more complex. The determination of ligands, solvents, and additives has a significant role on the reaction progress. Based on varying reaction conditions, many alternative mechanisms can be offered in Stille reaction.
Scheme 1.5. General Mechanism of Stille Cross-Coupling Reaction25

12
NO O n
NH
O O n
N
O O n
NH
O O n
Aim of the Study In this study, our aim is to design new donor-acceptor type monomers including carbazole derivatives and furan. Synthesized monomers are polymerized electrochemically and the differences of the properties of polymers are investigated in terms of alkyl substituents on the nitrogen atom or different substitution sites of carbazole (i.e., 3,6- or 2,7-substitution).
For this aim, four monomers 3,6-Di(2-furyl)-9H-carbazole (M1), 3,6-Di(2-furyl)-9-ethyl-carbazole (M2), 2,7-Di(2-furyl)-9-H-carbazole (M3) , 2,7-Di(2-furyl)-9-(tridecan-7-yl)-9H-carbazole (M4) and their corresponding polymers; poly(3,6-Di(2-furyl)-9H-carbazole) (P1), poly(3,6-Di(2-furyl)-9-ethyl-carbazole) (P2)), poly(2,7-Di(2-furyl)-9-H-carbazole) (P3), poly(2,7-Di(2-furyl)-9-(tridecan-7-yl)-9H-carbazole) (P4) (Scheme 1.8) are synthesized.
P1 P2
P3 P4
Scheme 1.6. D-A-D type polymers including P1, P2, P3, P4

13
CHAPTER 2
EXPERIMENTAL
2.1. Materials
2.1.1. Monomer Synthesis N-Bromosuccinimide (Fluka), dichloromethane ,DCM, (Sigma-Aldrich), CaH2 (Acros, 99%), Tetrakis(triphenylphosphine)palladium(0) (Aldrich, 99%), 2-(Tributylstannyl)furan (Aldrich, 97%), 2,7-dibromo-9H-carbazole (Lumtec, >98%), 2,7-dibromo-9-(tridecan-7-yl)-9H-carbazole (Lumtec, >98%) were used as received.
Tolune (Sigma-Aldrich) was stirred with calcium hydride (CaH2) over night and then distilled over it. For hexane and ethyl acetate, simple distillation method was used for the purification of these solvents.
Thin layer chromatography (TLC) and column chromatography techniques were used to purify the monomers. For TLC, 20x20 Silica gel 60 aluminum sheets were supplied from Merck and for the column chromatography, silica gel (Acros, 0.06-0.20 mm, 60A) was used.
2.1.2. Polymerization and Analysis For electrochemical synthesis and the analysis of the polymers, tetrabutylammonium hexafluorophosphate ,TBAPF6, (Fluka, > 98%) was used as supporting electrolyte without further purification. Acetonitrile, ACN, (Sigma-Aldrich) was stirred with CaH2 over night and then distilled over it.
There are two electrochemical cell set-ups in electroanalysis. First set-up involves polished platinum button electrode (area: 0.02 cm2), platinum wire and Ag/AgCl in 0.1 M NaCl as WE, CE, and RE, respectively. In second set-up, indium tin oxide coated quartz glass slide (ITO, delta Tech. 8-12 Ω, 0.7x5 cm2), platinum wire and silver wire are used as WE, CE, and pseudo-RE, respectively.
2.2. Instrumentation Bruker Spectrospin Avance DPX-400 Spectrometer was used for 1H and 13C NMR analyses at 400 MHz. Chemical shifts were calculated relative to tetramethylsilane (TMS) as the internal Standard during measurements. FT-IR analysis of monomers and polymers were performed with Thermo Scientific Nicolet S10 with attenuated total reflectance. Electroanalytical measurements were carried out with Gamry PCI/300 potensiostat-

14
galvanostat. Electro-optical study was operated with Hewlett-Packard 8453A diode array spectrometer. Fluorescence spectra were recorded on Varian Carry Eclipse Spectrophotometer. Scanning electron micrographs were performed with JSM-6400 Electron Microscope (JEOL). Calorimetric measurements were done with Perkin Elmer Differential Scanning Calorimeter under N2 medium from 25 oC to 300 oC with 10oC/ min heating rate.
2.3. Synthesis Route
2.3.1. Monomer Synthesis Monomer synthesis consists of two main steps:
1. Bromination of the acceptor unit 2. Coupling reaction of donor and acceptor units
2.3.1.1. Bromination of Acceptor Groups
3,6-Dibromo-9-H-carbazole and 3,6-Dibromo-9-ethyl-carbazole monomers were synthesized from carbazole and N-ethyl-carbazole respectively via bromination reaction. Bromination reaction was done with N-Bromosuccinimide in DCM medium under N2 atmosphere at room temperature.
1. 3,6-Dibromo-9-H carbazole (a) Carbazole (1 g, 5.99 mmol), N-Bromosuccinimide (2.24 g, 12.5 mmol) were stirred in DCM (10 ml) at room temperature. After 24 hr, the reaction mixture was purified by silica gel column chromatography with hexane-ethylacetate mixture. After evaporation of the solvent, beige crystals were obtained.
NMR (Appendix Figure B.1. & B.2.): 1H NMR (400 MHz, CDCl3) δ 8.07 (s, 1H), 7.45 (dd, J = 8.6, 1.8 Hz, 2H), 7.25 (d, J = 8.6 Hz, 2H), 7.19 (s, 2H)
13C NMR (101 MHz, CDCl3) δ 129.71 (s), 123.67 (s), 112.66 (s)
2. 3,6-Dibromo-9-ethyl-carbazole (b)
9-ethyl-carbazole (4.88 g, 25 mmol), N-Bromosuccinimide (9.34 g, 52.5 mmol) were stirred in DCM (30 ml) at room temperature. After 24 hr, the reaction mixture was purified by silica gel column chromatography with hexane-ethylacetate mixture. After evaporation of the solvent, white crystals were obtained.
NMR(Appendix Figure B.3. & B.4.): 1H NMR (400 MHz, CDCl3) δ 7.92 (d, J = 1.7 Hz, 2H), 7.38 (dd, J = 8.7, 1.8 Hz, 2H), 7.05 (d, J = 8.7 Hz, 2H), 4.07 (q, J = 7.2 Hz, 2H), 1.22 (t, J = 7.2 Hz, 3H).
13C NMR (101 MHz, CDCl3) δ 137.61 (s), 127.87 (s), 122.37 (s), 110.83 (s), 108.99 (s), 36.66 (s), 12.61 (s)

15
NH
N
+ NBr
OODCM, 25 oC
NH
BrBr
N
BrBr
(a)
(b)
Scheme 2.1. Bromination reaction of carbazole derivatives
2.3.1.2 Coupling of Donor and Acceptor Groups Integration of donor and acceptor units was performed via Stille cross coupling reaction. Reactions take place in distilled toluene medium, under N2 atmosphere. Scheme 2.2 shows the reaction set-up for coupling reactions.
1. 3,6-Di(2-furyl)-9H-carbazole (M1)
3,6-Dibromo-9-H-carbazole (400 mg, 1.23 mmol), 2-(Tributylstannyl)furan (1.09 g, 3.08 mmol), and Pd(PPh3)4 (142.134 mg, 0.123 mmol) in toluene (35 ml) were refluxed at 90 oC under nitrogen atmosphere. After 24 h, to remove the catalyst and make the purification easier, work-up was done after evaporation of toluene. After extraction of the reaction mixture, dry MgSO4 was added to remove the remaining water and the mixture was filtered with filter paper. Purification was done with silica gel column chromatography with hexane-ethyl acetate mixture. Evaporation gave dirty white product with 75% yield.
NMR(Appendix Figure B.5. & B.6.): 1H NMR (400 MHz, Acetone) δ 10.39 (s, 1H), 8.42 (d, J = 15.0 Hz, 2H), 7.68 (ddd, J = 8.5, 6.5, 1.7 Hz, 2H), 7.48 (d, J = 1.3 Hz, 2H), 6.69 (dd, J = 6.7, 3.4 Hz, 2H), 6.42 (dd, J = 3.3, 1.8 Hz, 2H).
13C NMR (101 MHz, Acetone) δ 156.03 (s), 142.36 (s), 140.91 (s), 124.32 (s), 123.75 (s), 123.30 (s), 116.56 (s), 112.46 (s), 111.94 (s) 104.24 (s) FTIR (ATR/ cm-1) (Appendix Figure A.1.): 3400, 3150, 3115, 2850-2960, 1611, 1463, 1371, 1293, 1236, 1160, 1078, 1010, 932, 885, 723
2. 3,6-Di(2-furyl)-9-ethyl-carbazole (M2) 3,6-Dibromo-9-ethyl-carbazole (170 mg, 0.482 mmol), 2-(Tributylstannyl)furan (429.9 mg, 1.204 mmol), and Pd(PPh3)4 (55.64 mg, 0.048 mmol) in toluene (20 ml) were refluxed at 90 oC under nitrogen atmosphere. After 24 h, to remove the catalyst

16
and make the purification easier, work-up was done after evaporation of toluene. After extraction of the reaction mixture, dry MgSO4 was added to remove the remaining water and the mixture was filtered with filter paper. Purification was done with silica gel column chromatography with hexane-ethyl acetate mixture. Evaporation gave yellow product with 72% yield.
NMR(Appendix Figure B.7. & B.8.): 1H NMR (400 MHz, CDCl3) δ 7.71 – 7.57 (m, 2H), 7.40 (dd, J = 7.2, 1.8 Hz, 2H), 7.21 (t, J = 9.0 Hz, 2H), 6.53 (dd, J = 9.4, 3.3 Hz, 2H), 6.43 – 6.35 (m, 2H), 4.21 – 4.06 (m, 2H), 1.52 (qd, J = 15.0, 8.0 Hz, 3H).
13C NMR (101 MHz, CDCl3) δ 154.06 (s), 140.20 (s), 138.66 (s), 122.15 (s), 121.58 (s), 121.38 (s), 114.97 (s), 110.61 (s), 107.73 (s), 102.15 (s), 36.62 (s), 25.75 (s) FTIR (ATR/ cm-1) (Appendix Figure A.2.): 3145, 3112, 2961-2854, 1604, 1459, 1374, 1343, 1295, 1150, 1090, 1007, 940, 881, 790, 725
3. 2,7-Di(2-furyl)-9-H-carbazole (M3)
2,7-Dibromo-9-H-carbazole (200 mg, 0.615 mmol), 2-(Tributylstannyl)furan (549.25 mg, 1.538 mmol), and Pd(PPh3)4 (35.53 mg, 0.031 mmol) in toluene (20 ml) were refluxed at 90 oC under nitrogen atmosphere. After 24 h, to remove the catalyst and make the purification easier, work-up was done after evaporation of toluene. After extraction of the reaction mixture, dry MgSO4 was added to remove the remaining water and the mixture was filtered with filter paper. Purification was done with silica gel column chromatography with hexane-ethyl acetate mixture. Evaporation gave ash-colored product with 15% yield.
NMR(Appendix Figure B.9. & B.10.): 1H NMR (400 MHz, Acetone) δ 10.36 (s, 1H), 8.00 (d, J = 8.2 Hz, 2H), 7.52 (d, J = 1.2 Hz, 2H), 7.46 (dd, J = 8.2, 1.4 Hz, 2H), 6.76 (d, J = 3.3 Hz, 2H), 6.45 (dd, J = 3.3, 1.8 Hz, 2H).
13C NMR (101 MHz, Acetone) δ 154.37 (s), 141.42 (s), 140.41 (s), 127.95 (s), 121.83 (s), 119.72 (s), 115.11 (s), 111.33 (s), 105.26 (s), 104.43 (s).
4. 2,7-Di(2-furyl)-9-(tridecan-7-yl)-9H-carbazole (M4) 2,7-Dibromo-9-(tridecan-7-yl)-9H-carbazole (300 mg, 0.592 mmol), 2-(Tributylstannyl)furan (528.2 mg, 1.479 mmol), and Pd(PPh3)4 (68.38 mg, 0.0592 mmol) in toluene (20 ml) were refluxed at 90 oC under nitrogen atmosphere. After 24 h, to remove the catalyst and make the purification easier, work-up was done after evaporation of toluene. After extraction of the reaction mixture, dry MgSO4 was added to remove the remaining water and the mixture was filtered with filter paper. Purification was done with silica gel column chromatography with hexane-ethyl acetate mixture. Evaporation gave orange product with 88% yield.

17
NMR(Appendix Figure B.11. & B.12.): 1H NMR (400 MHz, CDCl3) ) δ 7.90 (t, J = 9.3 Hz, 2H), 7.72 (d, J = 62.5 Hz, 2H), 7.39 (d, J = 1.3 Hz, 2H), 6.60 (s, 2H), 6.38 (dd, J = 3.1, 1.7 Hz, 2H), 4.50 (tt, J = 10.1, 4.9 Hz, 1H), 2.23 (ddd, J = 19.8, 12.1, 7.2 Hz, 2H), 1.87 – 1.74 (m, 2H), 1.57 – 1.46 (m, 2H), 1.26 – 1.20 (m, 4H), 1.02 – 0.96 (m, 6H), 0.81 (t, J = 7.3 Hz, 4H), 0.63 (t, J = 7.0 Hz, 6H)
13C NMR (101 MHz, CDCl3) δ 155.20 (s),143.00 (s), 141.84 (s), 120.60 (s), 120.35 (s), 115.59 (s), 111.89 (s), 106.71 (s), 104.87 (s), 104.09 (s), 56.65 (s), 33.93 (s), 31.65 (s), 29.20 (s), 26.95 (s), 22.68 (s), 14.10 (s) FTIR (ATR/ cm-1) (Appendix Figure A.3.): 3150, 3113, 2958-2848, 1608, 1460, 1370, 1243, 1298, 1226, 1146, 1085, 1008, 944, 878, 793, 725
Scheme 2.2. Reaction set-up for coupling reactions of brominated carbazole derivatives and furan26

18
NH
Br Br
NBr Br
NH
N
Br Br
BrBr
+O
Sn
NH
N
NH
N
O
O
O
O
O
O
O
O
(b)
(M1)
(M2)
(M3)
(M4)
(a)
Pd(PPh3)4
90oC, Toluene
Scheme 2.3. Coupling reactions between carbazole derivatives and furan.

19
2.3.2. Polymer Synthesis In this research, all monomers were polymerized electrochemically. Electrochemical polymerization was done in ACN and 0.1 M TBAPF6 was used as supporting electrolyte.
NH
N
NH
N
O
O
O
O
O
O
O
O
NH
O O nelectrochemical polymerization
ACN / TBAPF6
N
O O n
electrochemical polymerizationACN / TBAPF6
NH
O O n
electrochemical polymerizationACN / TBAPF6
NO O n
electrochemical polymerizationACN / TBAPF6
(P1)
(P2)
(P3)
(P4)
(M1)
(M2)
(M3)
(M4)
Scheme 2.4. Electrochemical polymerization of monomers
In electrochemical synthesis, polymers were synthesized by both repetitive cycling and constant potential electrolysis. Repetitive cycling was used to investigate electro-optical properties of the polymers. To obtain polymer films with significant thickness, constant potential electrolysis was used. For conductivity, FT-IR, SEM, and DSC measurements the films synthesized by constant potential electrolysis were pulled away from ITO with the help of diethyl ether after washing the films with ACN.
For the analysis of polymers, monomer-free electrolytic solution including ACN and 0.1 M TBAPF6 was used. All electro-analyses were done under air atmosphere at room temperature.
Related NMR and FTIR results for monomers and polymers are given in APPENDICES part.

20

21
CHAPTER 3
RESULTS AND DISCUSSION
3.1. Structural Design of the Monomer In this research, our purpose was to synthesize conjugated polymers with low band gap and high optical properties. To obtain low band gap polymers, we took the advantage of donor-acceptor approach. Then, we chose furan as donor unit and four different carbazole derivatives as acceptor units. It was reported that, 2,7 and 3,6 substituted carbazole derivatives show different electrical and optical properties. To investigate this, 2,7 substituted and 3,6 substituted carbazoles were chosen as acceptor units. 1,8 substituted derivatives were not preferred due to the differences during synthesis part caused by steric hindrance in the structure. Moreover, to investigate the effect of alkyl substituent on the nitrogen atom, one 2,7 and one 3,6 substituted carbazole derivatives were chosen with alkyl chain.
3.2. Properties of the Monomers
3.2.1. Electrochemical Properties of the Monomers Cyclic voltammetry was used to determine the electrochemical behavior of monomers M1, M2, M3, M4 and the smaller units that form the monomers, furan and carbazole derivatives. The electrochemical properties of all monomers were studied via cyclic voltammetry in an electrolyte solution containing 0.1 M TBAPF6 dissolved in ACN
The voltammogram of M1 exhibited an irreversible peak at 1.0 V vs. Ag/AgCl during the first anodic scan (Figure 1a). In the case of M2 and M3, the irreversible oxidation peaks appeared at 0.93 and 0.98 V vs. Ag/AgCl in the same solvent-electrolyte couple (Figure 1b and 1c), respectively. Oxidation peak for M4, on the other hand, appeared at slightly higher potential, 1.08 V vs. Ag/AgCl, Figure 1d. These irreversible oxidations correspond to the transfer of an electron from highest occupied molecular orbital of the monomer molecule to the working electrode of the electrochemical system.
For the sake of comparison, cyclic voltammograms of furan and carbazole units of the monomers, were also recorded in 0.1 M TBAPF6/ACN medium and results are shown in Figure 3.1 a-d and tabulated in Table 3.1.
An inspection of Figure 3.1 and Table 3.1 reveals that, among the four monomers, synthesized in this study, M2 has the lowest oxidation potential. This might be due to ethyl

22
substituent (an electron donating group) on the nitrogen atom which may slightly increase the electron density in the molecule and makes its oxidation relatively easier. Furthermore, the oxidation potentials of the monomers synthesized in this work are lower than that of their smaller heterocyclic units (Eox= 1.60 V for furan and between 1.29 V to 1.49 V for carbozole units). This shift can be explained on the basis of increasing π-electron conjugation along the monomer molecules, which makes the loss of electron easier.
Figure 3.1. Cyclic voltammograms of monomers and their constituents together with ferrocene as an internal reference. a) M1, b) M2, c) M3, and d) M4 recorded in 0.1 M TBAPF6/ACN electrolytic solution.
Table 3.1. Electrochemical data of monomers and their constituents vs. Ag/ AgCl.
Monomer Starting Material Furan Ferrocene Eox, onset (V) Eox (V) Eox (V) Eox (V) Eox (V)
M1 0.74 1.0 1 1.32 1.60
0.47 M2 0.76 0.93 2 1.29
M3 0.83 0.95 3 1.34 M4 0.96 1.08 4 1.49
3.2.2. UV-VIS and Fluorescence Spectra of the Monomers The electronic absorption spectra of the monomer solutions in ACN are shown in Figure 3.2. M1 exhibits two main absorption bands at about 260 nm and 308 nm. The former is typical for benzene absorption, on the other hand, the latter is due to π-π* transition. These bands are slightly red shifted (about 5 nm) in the case of M2, due to substitution of ethyl
a) b)
c) d)

23
group on the nitrogen atom. The electronic absorption spectra of M3 and M4 exhibit similar feature to M1 and M2 with two absorption bands at about 270 nm and 350 nm with vibronic couplings. An inspection of Figure 3.2 reveals that characteristic absorption bands for M3 and M4 are red shifted (about 50 nm for π-π* transition band) as compared to M1 and M2. This red shift indicates that conjugation of p-orbitals of furan and carbazole units are stronger in 2,7 substituted derivatives making M3 and M4 more planar as compared to M1 and M2. The emission spectra of the monomers were also recorded in ACN medium and the results are depicted in Figure 3.2. In the fluorescence spectra of the monomers M3 and M4, it is observed that there is a nearly 10 nm shift when compared to the UV absorptions. Two shoulder behavior of the 2,7 substituted derivatives was also conserved in the fluorescence spectra. N-alkylated derivatives have nearly 15 nm shift to the right as in UV spectra.
Figure 3.2. Electronic absorption spectra and fluorescence spectra of monomers in ACN solution a) M1, b) M2, c) M3, and d) M4
a)
c)
b)
d)

24
In Figure 3.3-a and b, Electronic absorption spectra and fluorescence spectra of monomers (M1-M4) are depicted for comparison sake.
Figure 3.3. Normalized UV-VIS absorption a) and PL spectra b) of monomers M1, M2, M3, and M4 (Excitation at 340 nm)
3.3. Electrochemical Polymerization and Characteristics of the Polymers
3.3.1. Electrochemical Polymerization Electrochemical synthesis of the polymers was performed in ACN containing 0.1 M TBAPF6 as supporting electrolyte using Pt-bead or ITO as working electrode. Electrochemically synthesized polymers were obtained with 25 cycles (200 mV/s) via repetitive cycling within the range 0.0-1.1 V for M1, M2 and M4, and 0.0-1.0 V for M3. As shown in Figure 3.4, during second anodic scan, new redox couples appeared around 0.8 V, indicating electroactive polymer film formation on the electrode surface. After each following cycle,
a)
b)

25
the current increased steadily which indicated that both the surface area and the thickness of the polymer film on ITO glass also increased.
Figure 3.4. Electropolymerization of monomers at 200 mV/s in ACN and 0.1 M TBAPF6 as electrolyte a) M1, b) M2, c) M3, and d) M4
3.3.2. Scan Rate Dependence Study of the Polymers After repeated scans, the polymer coated WE was removed from the monomer solution and rinsed with ACN to remove the oligomeric species and the electrolyte. The electrochemical behavior of the polymer film was investigated in monomer-free electrolyte solution. The polymer films were found to exhibit one reversible redox couple representing the doping and de-doping of the polymer film at about 0.80 V vs. Ag/AgCl, Figure 3.5. It is found that both anodic and cathodic peak currents increase linearly with increasing scan rate, indicating that the redox process is non-diffusional and the polymer film is well-adhered to the WE (See inset of Figure 3.5 a-d).
a) b)
c) d)

26
Figure 3.5. CV of polymers at different scan rates changing between 20- 200 mV/s in ACN and 0.1 M TBAPF6 as electrolyte a) P1b) P2, c) P3, and d) P4 (Inset: Relationship of anodic and cathodic currents with respect to scan rate)
Electrochemically synthesized polymer films on ITO electrode exhibited color change between neutral and oxidized states of the polymer films. P1 is light green in the neutral state and dark blue in the oxidized state, while P2 changes its color from dark green to dark blue within the same range. Polymer films obtained from electrochemical polymerization of M3 and M4 also exhibits electrochromic response and P3 changes its color from yellow to light green and P4 changes its color from dirty yellow to dark green, see Table 3.2. The slight differences in the colors of polymer films in their neutral and oxidized states might stem either from the substitution of the furan to the different sites of brominated carbazole derivatives or from the alkyl chains on nitrogen atoms.
3.3.3. Spectroelectrochemical and Switching Attitudes of the Polymers The electro-optical properties of the polymer films, deposited on ITO electrode via potential cycling, were investigated by monitoring the changes in the electronic absorption spectra under a voltage pulse in a monomer free electrolyte solution. The results are depicted in Figure 3.6. The electronic absorption spectra of neutral forms of the films exhibit an absorption band at around 370 nm for P1 and P2, and around 420 nm for P3 and P4. These bands are due to π–π* transition and they all lose intensity during oxidation which is accompanied by the appearance of new intensifying bands at about 550-600 nm. Upon further oxidation, a new broad band around 800 nm (in the case of P1 and P2) and in the near IR region (in the case of P3 and P4) also starts intensifying. Appearance of these new
a) b)
c) d)

27
bands indicates the formation of charge carriers. All spectra recorded during potential cycling between 0.0 V and 1.1 V pass through a clear isosbestic points at 435 nm, 438 nm, 480 nm, and 495 nm for P1, P2, P3 and P4, respectively, indicating that polymer film was being interconverted between its neutral and oxidized states.
Figure 3.6. Electronic absorption spectra of polymers on ITO at 50 mV/s in ACN and 0.1 M TBAPF6 as electrolyte between 0.0 -1.1 V a) P1, b) P2, c) P3, and d) P4
a) b)
c) d)

28
NH
O
O
n
N
O
O
n
NH
O
O
n
N
O
O
n
The changes in the electronic absorption spectra of polymer film are also accompanied by a color change, green to blue for P1 and P2, and yellow to green for P3 and P4 as they are exhibited in Table 3.2.
Table 3.2. Colors of the polymers in their neutral and oxidized states
POLYMER NEUTRAL OXIDIZED
1
2
3
4
Due to its importance in electrochromic applications, switching times and optical contrast of the polymer films on ITO were also investigated under square wave input of 0.0 and +1.1 V in 10 s intervals by monitoring the visible transmittance and the kinetic responses of the film, and the results obtained for P1 is shown in Figure 3.7 as a representative example. Inspection of Figure 3.7 reveals that P1 exhibits a reversible response within the range of applied potential pulses with a response time of 1.2 s with an optical contrast value of 28.7 % at 570 nm. Switching time and optical contrast values for the other polymers are given in Table 3.3. Coloration efficiency values are also included in the table. As seen from Table

29
3.3, among four polymers synthesized in this work, P1 exhibits the highest coloration efficiency and lowest switching time. Switching behaviors of the polymers were investigated at specified three wavelengths, they are 390, 570, and 810 nm for P1 and P2; and 415, 578, 915 nm for P3, 420, 663, and 850 nm for P4.
Figure 3.7. Choronoabsorptometry experiment for P1 on ITO in ACN/ 0.1 M TBAPF6
Table 3.3. Optical and switching time data of electrochemically synthesized polymers
Polymer Wavelength (λmax, nm)
Contrast (%T)
CE (cm2/C)
Switching Time (s)
P1 570 28.7 190 1.2 P2 810 14.4 144 2.4 P3 415 11.5 177 1.4 P4 420 4.4 154 1.4
3.3.4. Colorimetric Measurements of the Polymers In addition to optical data of the polymers, it was necessary to determine the colors via a more scientific way. For this purpose, colorimetry was used. In previous part, the color changes of the polymers were reported and tabulated as yellow to green for P1 and P2; and green to blue for P3 and P4 in Table 3.2. During colorimetric measurements, it was observed that P1 and P2 have intermediate colors between neutral and oxidized states. The color change occurs gradually. For P3 and P4, the color change occurs from yellow to green and the observed colors between two states are too close to each other.
L*, a*, b* values indicate different characteristics in determination of the colors. L* indicates lightness, a* and b* values represent red(+)-green(-) and yellow(+)-blue(-) axes respectively. Among these polymers a* and b* values of P3 are more far away from zero when compared to others. This means, P3 has higher hue and lower transparency when compared to others. All polymers have high transparency due to their high L* values. Negative a* and large b* values together indicate yellow color as in neutral states of P3 and P4. For oxidized states of P3 and P4, b* values are smaller which results in green color formation. Due to the same reasons, neutral states of P1 and P2 participate in green part of

30
NH
O O n
N
O O n
NH
O O n
NO O n
the spectra. Negative b* values in oxidized states of P1 and P2 are in accordance with blue color. All these color characteristics of the polymers are tabulated in Table 3.4.
Table 3.4. L*, a*, b* measurements of the polymers in neutral, intermediate, and oxidized states
POLYMER COLOR NEUTRAL INTERMEDIATE OXIDIZED
1
2
3
-
4
-
3.3.5. FTIR Results of the Polymers In FTIR spectra of polymers, two main characteristics are seen. First one is the stretching due to furan moiety. The characteristic peaks are observed at 3150 and 3128 cm-1 due to aromatic C-H stretching, 1586 and 1487 cm-1 due to symmetric C=C ring stretching, 1171 cm-1 due to C-O-C stretching, 1050 and 985 cm-1 due to C-H in plane deformation, 915 and 865 cm-1 as a result of in plane and out of plane deformation of five membered aromatic ring27. The second main stretching are caused by carbazole moiety at 3400 cm-1 for N-H stretching, 2960-2850 cm-1 for aromatic ring stretching, around 1600 cm-1 for C=C
L*: 95.4392
a*: -4.6423
b*: 8.8342
L*: 90.2313
a*: -3.7057
b*: 0.9068
L*: 88.1177
a*: -2.9303
b*: -1.5656
L*: 86.9227
a*: -2.0671
b*: 2.1147
L*: 84.8815
a*: -1.6604
b*: -0.3105
L*: 80.1169
a*: 0.4106
b*: -2.0502
L*: 90.0643
a*: -4.2773
b*: 56.0639
L*: 73.7660
a*: -0.7969
b*: 0.4551
L*: 80.0319
a*: -5.6812
b*: 32.0968
L*: 76.4630
a*: -8.1733
b*: 12.0720

31
stretching, 1371, 1236 cm-1 for C-N stretching, 1293 cm-1 for C-C inter ring stretching. The in plane deformation of carbazole unit appears around 950-800 cm-1 and the peak at 723 cm-1 is due to 1,2 disubstituted benzene ring 28,29. After coupling reaction of furan and carbazole, this peak around 723 cm-1 disappears and new peaks at about 840 and 960 cm-1 appear as a result of the evidence of 1,2,4-trisubstituted benzene rings. The peak due to N-H stretching appears at 3400 cm-1 for M1 and M3. However, in the FTIR spectra of M2 and M4 N-H stretching peak is not present because of the alkyl chains attached to nitrogen atom, When FTIR spectra of monomers and corresponding polymers are compared, in polymers it is observed that, the peak coming around at 740 cm-1 (α-C-H stretching of furan) disappears. In addition, at 840 cm-1 new peak formation is seen caused by PF-
6dopant ion. Related FTIR results of the polymers are given with corresponding monomers in Appendix A.
3.4. Properties of the Polymers
3.4.1 Energy Band Diagram and Conductivities of the Polymers The band gap, Eg, values of the polymer films P1, P2, P3, and P4 were calculated from the onset of the low energy end of the π-π* transitions as shown in Figure 3.8 and were found to be 2.67 eV, 2.65 eV, 2.42 eV, and 2.45 eV, respectively. HOMO/LUMO energy levels of the polymers were elucidated utilizing their ionization potentials and electron affinities obtained from experimental data. The onset of oxidation potentials of P1 (0.56 V vs. Ag/AgCl), P2 (0.53 V vs. Ag/AgCl), and P3 (0.53 V vs. Ag/AgCl) and P4 (0.71 V vs. Ag/AgCl) were used as Eox in the equation (Ip=(Eox + 4.8) eV, where the energy level of Fc/Fc+ was taken as 4.8 eV below vacuum30.). Electron affinities were estimated by subtracting the band gap energy from Ip and the results are tabulated in Table 3.5. As seen from table, HOMO levels of the polymers are almost same. This is not unexpected since in all polymers donor groups are the same. However, their LUMO levels differ depending on the 2,7- and 3,6 substitution of carbazole derivatives. In the case of 2,7-substituted carbazole derivatives, P3 and P4, the LUMO levels are lowered.
It was reported that 2,7 diheteroaromatic carbazole derivatives have better electrochemical properties31 while 3,6 substituted carbazole derivatives have greater reactivity32,33. Relatively low reactivity of the 2,7 substituted carbazoles may be caused by the higher steric hindrance when compared to the 3,6 substituted ones. In order to investigate the effect of substitution site on the conductivity, conductivities of polymer films were also determined using four-probe technique and the results are given in Table 3.5. Since the attempts to prepare free standing films of P3 were unsuccessful, measuring its conductivity was not possible. The conductivities of P1, P2, and P4 are found to be 6.25x10⁻⁴ S.cm-1, 2.38x10⁻⁵ S.cm-1 and 1.54x10⁻² S.cm-1, respectively. The higher conductivity of P4 can be explained in terms of higher conjugation length and stronger π-stacking in accordance with the red shift observed in the electronic absorption spectrum of P4 as compared to P1 and P2.

32
Figure 3.8. Electronic absorption spectra of P1 on ITO to represent band gap value determination.
Table 3.5. Electrochemical property, band-gap and conductivity of the polymers.
Polymer Eonset
(V)
Eox (V)
Ered (V)
HOMO (eV)
LUMO (eV)
Eg (eV)
Conductivity (Scm-1)
P1 0.56 0.82 0.78 5.00 2.32 2.67 6.25x10⁻⁴ P2 0.53 0.96 0.78 4.97 2.32 2.65 2.38x10⁻⁵ P3 0.50 0.78 0.76 4.94 2.52 2.42 - P4 0.71 0.96 0.89 5.15 2.70 2.45 1.54x10⁻²
In Figure 3.9, energy band diagram of the polymers is exhibited. 2,7 substituted derivatives have lower band gap when compared to 3,6 substituted derivatives. HOMO and LUMO levels of 2,7 and 3,6 substituted derivatives are close to each other in each group. According to the theoretical research conducted by Doskocz et al., 2,7-diheteroaromatic carbazoles have lower band gap than 3,6-diheteroaromatic carbazoles31 due to linear conjugation of the 2,7 positions34.

33
Figure 3.9. Energy band diagrams of the polymers
3.4.2. Morphology of the Polymers To investigate the surface properties of the polymers, scanning electron microscope was used. Electrochemically synthesized films were pulled away from ITO glass with the help of diethyl ether after being washed with ACN. It was observed that, the surface of the polymers were porous with small granules which is a great advantage for redox activity. This surface structure provides the counter-ions to move easily into and out of the polymer film during doping and dedoping processes35,36.
In SEM micrographs of P2, a branch like formation is seen (Figure 3.10). While pulling away P2 film from ITO glass, partial swelling formation occurred on the surface of the film. Observed branch like formation might be caused by these swellings.

34
Figure 3.10. SEM micrographs of P1, P2, and P4. Magnification: x2500 for a, and x15000 for b.
3.4.3. DSC Results and Thermal Properties of the Polymers The glass transition temperature for polycarbazoles range from room temperature to 180°C37. DSC measurements were performed to evaluate Tg values of the polymer films synthesized in this work. The measurements were done from room temperature to 350°C. DSC thermogram for P2 is shown in Figure 3.11. As seen from the figure the glass transition temperature for P2 is around 100°C. In the case of P1 and P4, the measurements were unsuccesful due to the continuous heat flow into the sample, which may sometimes occur for the conducting polymer samples.
a‐1) P1 a‐2) P2 a‐3) P4
b‐1) P1 b‐2) P2 b‐3) P4

35
Figure 3.11. DSC result of P2 (Inset: Derivative of the heat flow vs. temperature)

36

37
CHAPTER 4
CONCLUSIONS
In this study, new donor-acceptor type monomers were synthesized and the differences of the corresponding polymers were analyzed. 2,7 and 3,6 carbazole derivatives were used as acceptor group and furan unit was used as donor unit. The differences were expected to be caused by substitution from different sites and alkyl chain attached to the nitrogen atom. All monomers were polymerized in TBAPF6/ACN medium successfully. It was observed that, 3,6 substituted polymers show a color change between green and blue while 2,7 substituted ones have a tendency to change their color from yellow to green. In addition, optical and chronoabsorptometry data of the polymers were also collected. According to this data, P1 was found to have highest CE and lowest switching time at 570 nm. In accordance with colorimetric measurements, all polymers were found to have high transparency however P3 was found to have highest hue and lowest transparency when compared to others.
Electronic absorption spectra of the polymers were recorded in TBAPF6/ACN. By using SPEL data, band gaps of the polymers were found and these values were used to elucidate HOMO and LUMO energies. Band gaps of the polymers were changing between 2.42 and 2.67 eV. With respect to energy band diagram of the polymers, P3 shows the lowest band gap. HOMO and LUMO levels of the polymers are close to each other when considered in each group; 2,7 and 3,6 substituted derivatives. P4 might be an exception due to its long branched alkyl chain attached to nitrogen atom.
According to conductivity data, P4 shows the highest conductivity which is 1.54x10⁻² S.cm-1. By means of SEM micrographs of the polymers, a porous structure was observed on the surface which has a great importance on the movement of counter-ions into and out of the film.

38

39
REFERENCES
1. Creating New Classes of Optpelectronics, Conducting polymers, retrieved from
http://epolymer.homepcenter.co.kr/bbs/board.php?bo_table=re_nano&wr_id=1 (last accessed on 10.8.13).
2. Bakhski A. K., Fundamentals of Electrically Conducting Polymers, Engineering and Speciality Polymers, Polymer Science, University of New Delhi, (2007), retrieved from http://nsdl.niscair.res.in/bitstream/123456789/486/1/Fundamentals+of+electrically+conducting+polymers.pdf (last accessed on 15.8.13).
3. C. K. Chiang, C. R. Fincher, Y. W. Park, A. J. Heeger, H. Shirakawa, E. J. Louis,S. C. Gau, A. G. McDiarmid, Phys. Rev. Lett., 39, 1089 -1977.
4. Skotheim, T. A.; Reynolds, J. R. Handbook of Conducting Polymers-Conjugated Polymers: Synthesis, Properties and Characterization; CRC Press: Boca Raton, FL, 2007.
5. Thomas C. A., Donor-Acceptor Methods for Band Gap Reduction in Conjugated Polymers: The Role of Electron Rich Donor Heterocycles, PhD thesis, University of Florida, 2002.
6. Chochos C. K., Choulis S. A., Progress in Polymer Science , 2011,36, 1326-1414.
7. Pratt C., Chromism, retrieved from http://homepage.ntlworld.com/colin.pratt/Chromism.pdf (last accessed on 13.8.13).
8. Argun A. A., Aubert P.-H., Thompson B. C., Schwendeman I., Gaupp C. L., Hwang J., Pinto N. J., Tanner D. B., MacDiarmid A. G., Reynolds J. R., Chem. Mater., 2004, 16, 4401-4412.
9. Reddinger J. L., Reynolds J. R., Molecular Engineering of Л-Conjugated Polymers,
Advances in Polymer Science, Vol. 145, 1999.
10. Pratt C., Conducting Polymers, retrieved from http://homepage.ntlworld.com/colin.pratt/cpoly.pdf (last accessed on 12.8.13).
11. Gaupp C. L., PhD thesis, University of Florida, 2002.

40
12. Adhikari R. M., Carbazole-Based Emitting Compounds: Synthesis, Photophysical Properties and Formation of Nanoparticles, PhD Thesis, Bowling Green State University, 2008.
13. Sotzing G. A., Reddinger J. L., Katritzky A. R., Soloducho J., Musgrave R., Reynolds J. R., Multiply Colored Electrochromic Carbazole-Based Polymers, 1996.
14. Liu Y., Xu S., Li J., Xin Y., Zhao G., Ye B., Cao S., Polym. Adv. Technol., 2008,19, 793.
15. Leclerc N., Michoud A., Sirois K., Morin J.-M., Leclerc M., Adv. Funct. Mater., 2006, 16, 1694.
16. Kim K.-S., Jeong S., Kim C., Ham J.-Y. Kwon, Y., Choi B.-D., Han Y.S.,
Synth.Met., 2009, 159, 1870.
17. Cheng Y.J., Yang S.H., Hsu C.S., Chem. Rev., 2009, 109, 5868.
18. Sarac A.S., Ates M., Parlac E.A., Int. J. Polym. Mater., 2004, 53, 785.
19. Grazulevicius J. V., Strohriegl P., Pielichowski J., Pielichowski K., Prog. Polym. Sci., 2003, 28, 1297-1353.
20. Li J., Dierschke F., Wu J., Grimsdale A.C., Mullen K. J., Mater. Chem., 2006,16, 96.
21. Khurana J. M., Chemistry of Heterocyclic Compunds, Organic Chemistry, University of Delhi, 2006, retrieved from http://nsdl.niscair.res.in/bitstream/123456789/792/1/revised+chemistry+of+Heterocyclic+compounds.pdf (last accessed on 12.8.13).
22. J. P. Ferrais and T. R. Hanlon, Polymer, 1989, 30, 1319.
23. İçli-Özkut M., İpek H., Karabay B., Cihaner A., Önal A. M., Polym. Chem., 2013, 4, 2457.
24. Güneş A., Cihaner A., Önal A. M., Electrochimica Acta, 2013, 89, 339-345.
25. Carsten B., He F., Son H. J., Xu T., Yu L., Chem. Rev., 2011, 111, 1493–1528.
26. Icli Ozkut M., Color Engineering of Л-Conjugated Donor-Acceptor Systems: The Role of Donor and Acceptor Units on the Neutral State Color, PhD thesis, Middle East Technical University, 2011.

41
27. Alakhras F., Holze R., J. Solid State Electrochem, 2008, 12, 81–94.
28. Ghaemy M., Alizadeh R., Behmadi H., Europ. Poly. J., 2009, 45, 3108-3115.
29. Zahoor A., Qiu T., Zhang J., Li X., J. Mater. Sci., 2009, 44, 6054-6059.
30. Shin W.S., Kim S.C., Lee S.-J., Jeon H.S., Kim M.-K., Naidu B.V.K., Jin S.-H., Lee J.-K., Lee J.W., Gal Y.-S., J. Polym. Sci. Part A: Polym. Chem., 2007, 45, 1394.
31. Doskocz J., Doskocz M., Roszak J., Soloducho J., Leszczynski J., J. Of Phys. Chem. A., 2006, 110, 13989-13994.
32. Hua-Ming M., Hong-Lin Z., Jing-Kun X. U., Chang-Li F., Bin D., Li-Qiang Z., Feng Z., J. Chin., Org. Chem., 2008, 26, 1922-1928.
33. Inzelt G. J., Solid State Electrochem., 2003, 7, 503-510.
34. Michinobu T., Osako H., Shigehara K., Macromolecules, 2009, 42, 8172-8180.
35. Li C., Wang M., Cui C., Xu L., Wang Z., Kong T., Int. J. Electrochem. Sci., 2012, 7, 1214-1229.
36. Zhao J., Cheng X., Fu Y., Cui C., Int. J. Electrochem. Sci., 2013, 8, 1002-1015.
37. Morin J.-F., Leclerc M., Adès D., Siove A., Macromol. Rapid Commun., 2005, 26, 761-778.

42

43
APPENDIX A
FTIR SPECTRA OF THE MONOMERS AND THE POLYMERS
Figure A.1. FTIR spectra of M1 and P1.
Figure A.2. FTIR spectra of M2 and P2.

44
Figure A.3. FTIR spectra of M4 and P4.

45
APPENDIX B
NMR SPECTRA OF THE MONOMERS
Figure B.1. 1H NMR Spectrum of (a) in CDCl3
Figure B.2. 13
C NMR Spectrum of (a) in CDCl3

46
Figure B.3. 1H NMR Spectrum of (b) in CDCl3
Figure B.4. 13
C NMR Spectrum of (b) in CDCl3

47
Figure B.5. 1H NMR Spectrum of M1 in deuterated acetone
Figure B.6. 13
C NMR Spectrum of M1 in deuterated acetone

48
Figure B.7. 1H NMR Spectrum of M2 in CDCl3
Figure B.7. 13
C NMR Spectrum of M2 in CDCl3

49
Figure B.9. 1H NMR Spectrum of M3 in deuterated acetone
Figure B.10. 13
C NMR Spectrum of M3 in deuterated acetone

50
Figure B.11. 1H NMR Spectrum of M4 in CDCl3
Figure B.12. 13
C NMR Spectrum of M4 in CDCl3