synthesis and structural characterization of artificial ... and structural characterization of...
TRANSCRIPT

UNIVERSITY OF NAPLES “FEDERICO II”
Synthesis and structural characterization
of artificial metalloproteins
FACULTY OF MATHEMATICS, PHYSICS AND NATURAL SCIENCES
PH.D. IN CHEMISTRY - XX CYCLE
2004-2007
Candidate:
Giancarlo Del Gatto
Tutor: Prof. Vincenzo Pavone
Supervisor: Prof. Lelio Mazzarella
Coordinator: Prof. Aldo Vitagliano

Contents
List of abbreviations i
Summary iii
Introduction
Chapter 1 Hemeprotein, structures and functions 2
1.1 Heme structure
1.1.1 Properties of the porphyrin macrocycle 4
1.1.2 Coordination properties 6
Chapter 2 Design of new metalloporphyrin scaffold
2.1 Covalent Peptide-Porphyrin Systems 9
2.2 Spectral Properties of Metalloporphyrins and Heme-Proteins 12
2.3 Microperoxidases 15
2.4 Peptide based-synthetic porphyrins 16
2.5 Peptide-Sandwiched Deutroheme: Mimochromes 20
Chapter 3 Design of new mimochromes 28
Results and discussion
Chapter 4 Mimochromes synthesis
4.1 Synthetic procedure 32
4.2 Peptide synthesis 35
4.2.1 Synthesis of mimochrome IV peptide 37
4.2.2 Synthesis of mimochrome IV 8Glu peptide 38
4.2.3 Synthesis of mimochrome IV 8Lys peptide 39
4.3 Peptide-deuteroporphyn coupling
4.3.1 Coupling of mimochrome IV 40
4.3.2 Coupling of mimochrome IV 8Glu 41
4.3.3 Coupling of mimochrome IV 8Lys 42
4.4: Iron insertion into mimochromes 43
4.4.1 Synthesis of Fe(III) mimochrome IV 46
4.4.2 Synthesis of Fe(III) mimochrome IV 8Glu 47
4.4.3 Synthesis of Fe(III) mimochrome IV 8Lys 48
Chapter 5 Spectroscopic characterization of mimochromes
5.1: UV-vis spectroscopy of mimochromes
5.1.1 UV-vis spectroscopy of Fe(III) mimochrome IV 8Glu 49
5.1.2 UV-vis Fe(III) mimochrome IV 8Glu pH titrations 51
5.1.3 UV-vis spectroscopy of Fe(III) mimochrome IV 8Lys 53
5.1.4 Uv-vis Fe(III) mimochrome IV 8Lys pH titrations 55
5.2: Circular dichroism spectroscopy of mimochromes
5.2.1 Circular dichroism spectroscopy of Fe(III) mimochrome IV 8Glu 57
5.2.2 Circular dichroism titrations of Fe(III) mimochrome IV 8Glu 60
5.2.3 Circular dichroism spectroscopy of Fe(III) mimochrome IV 8Lys 62
5.2.4 Circular dichroism titrations of Fe(III) mimochrome IV 8Lys 65
5.2.5 Circular dichroism titrations of Fe(III) mimochrome IV 67
Chapter 6 Square wave voltammetry of Fe mimochromes
6.1 Square wave voltammetry of Fe mimochrome IV 8Glu 69
6.2 Square wave voltammetry of Fe mimochrome IV 8Lys 71
6.3 Square wave voltammetry of Fe mimochrome IV 72
Chapter 7 Discussion 74

Experimental Section
Chapter 8 Experimental Section
8.1 Design 79
8.2 Equipment and materials ”
8.3 Synthesis of mimochrome peptide ”
8.4 Purification of mimochrome peptide 81
8.5 Coupling of mimochromes 82
8.6 Insertion of iron 85
8.7 Analytical methods 87
8.8 UV-vis spectroscopy ”
8.9 Circular dichroism 88
8.10 Square wave voltammetry ”
Appendix
A1: Fe-mimochrome IV 8Glu UV-vis titration: fiitting equation 90
A2: Fe mimochrome IV 8Lys UV-vis titration: fitting equation 93
References

i
List of abbreviations
Abs Absorbance
Ac Acetyl
Arg Arginine
Asn Asparagine
Asp Aspartic acid
Boc t-Butoxycarbonyl
CD Circular dichroism
DCC Dicyclohexylcarbodiimide
DCM Dichloromethane
DIEA Diisopropylethylamine
DMF Dimethylformamide
EDT Ethanedithiol
EtOH Ethanol
Fmoc 9-Fluorenylmethoxycarbonyl
Gln Glutamine
Glu Glutamic acid
HATU N-[(dimethylamino)-1H-1,2,3-triazolo[4,5-b]pyridin-1-ylmethylene]-N-
methylmethanaminium hexafluorophosphate N-oxide
Hb Hemoglobin
HBTU 2-(1H-Benzotriazole-1-yl)-1,1,3,3-tetramethyluronium hexafluorophosphate
His Histidine
HOBt N-hydroxybenzotriazole
Leu Leucine
Lys Lysine
MALDI Matrix Assisted Laser Desorption Ionization
Mb Myoglobin
MeOH Methanol
Mmt Methoxytrityl
MP Microperoxidases
NMR Nuclear magnetic resonance
Pbf 2,2,4,6,7-Pentamethyldihydrobenzofurane-5-sulfonyl

ii
RMD Restrained molecular dynamics
RP-HPLC Reverse Phase High Pressure Liquid Chromatography
Ser Serine
SPPS Solid Phase Peptide Synthesis
t-Bu tert-Butyl
TFA Trifluoroacetic acid
TFE Trifluoroethanol
TLC Thin Layer Chromatography
TRT Trityl

iii
Summary
Metalloproteins are involved in fundamental biological processes and utilize a relatively
small number of metal-based prosthetic groups to serve numerous and diverse chemical
functions.1,2
The hemeproteins family represents a fascinating example in this respect: a single
prosthetic group, the heme, promotes a variety of functions, such as dioxygen storage and
transport, electron transfer, hydroxylation and oxidation of organic substrates, and
hydrogen peroxide disproportion. One of most interesting aspect is how the local protein
environment surrounding the heme more finely regulates the heme-protein properties, such
as the iron redox potential.
With the aim of understanding the effects of the composition and conformation of the
peptide chain in the modulation of the heme redox potential, it has been undertaken the
development of porphyrin-peptide molecules, called mimochromes.
They are pseudo-C2 symmetric systems, composed of two helical peptides covalently
linked to the deuteroporphyrin. The use of C2 symmetry is particularly advantageous,
because it simplifies the design, synthesis and characterization. However, it leaves the
problem of possible diastereomeric forms. In the cobalt complex of the first derivative,
mimochrome I, Λ and ∆ isomers were indeed experimentally observed. All the insights
derived from the Co(III) mimochrome I structure were used to obtain a re-designed
molecule, mimochrome IV. The spectroscopic characterization of the iron and cobalt
derivatives suggested the presence of the Λ isomer as unique species. The NMR solution
structure of the diamagnetic Co(III)-mimochrome IV confirmed the ability of the molecule
to adopt a unique topology, and revealed the peptide chains to be in helical conformation,
as designed. The stereochemically stable structure of mimochrome IV provides an
attractive model for modulating the redox potential of the heme, by simple changing the
peptide chain composition around the heme. To this goal two new analogues, which are
characterized by different charges, have been development mimochrome IV 8Lys and
1 Lippard, S. J.; Berg, J. M. Principles of Bioinorganic Chemistry; University Science Books: Mill Valley 2 Holm, R. H.; Kennepohl, P.; Solomon, E. I. Chem. Rev. 1996, 96, 2239.
iv
N
N N
N
OR O R
Fe
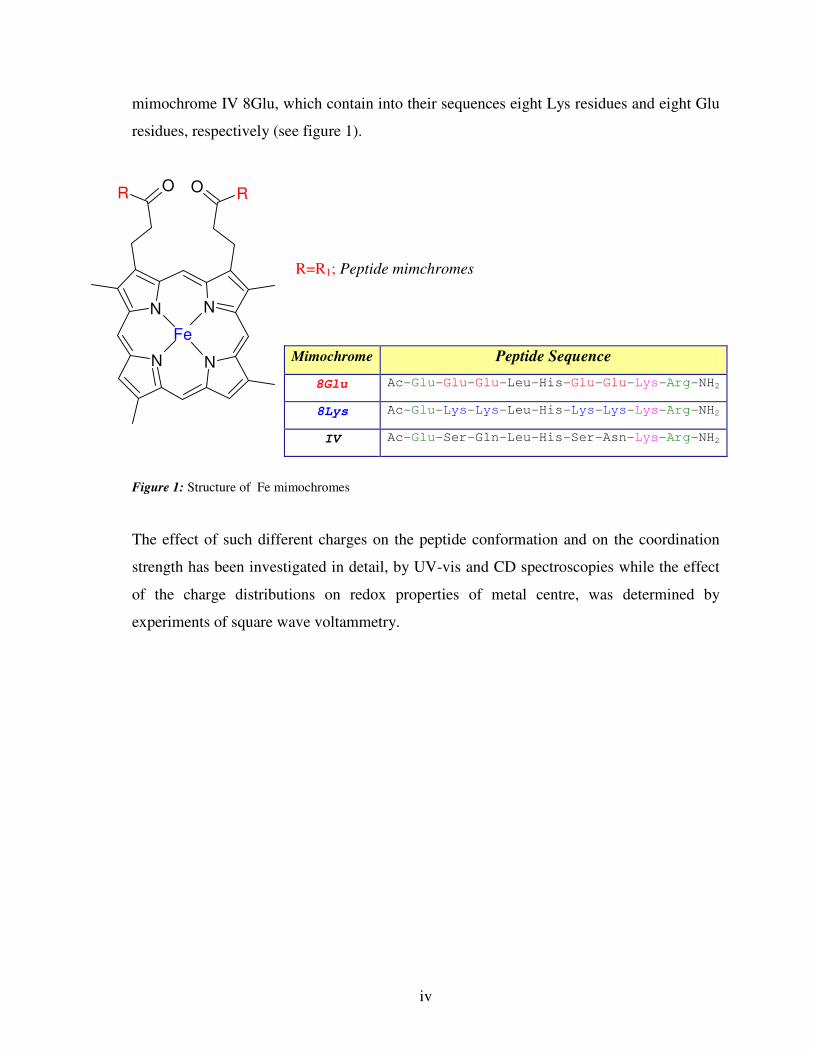
mimochrome IV 8Glu, which contain into their sequences eight Lys residues and eight Glu
residues, respectively (see figure 1).
R=R1; Peptide mimchromes
Figure 1: Structure of Fe mimochromes
The effect of such different charges on the peptide conformation and on the coordination
strength has been investigated in detail, by UV-vis and CD spectroscopies while the effect
of the charge distributions on redox properties of metal centre, was determined by
experiments of square wave voltammetry.
Mimochrome Peptide Sequence
8Glu Ac-Glu-Glu-Glu-Leu-His-Glu-Glu-Lys-Arg-NH2
8Lys Ac-Glu-Lys-Lys-Leu-His-Lys-Lys-Lys-Arg-NH2
IV Ac-Glu-Ser-Gln-Leu-His-Ser-Asn-Lys-Arg-NH2

v
Introduction

2
Chapter 1: Hemeprotein, structures and functions
Metalloproteins are involved in fundamental biological processes and utilize a relatively
small number of metal-based prosthetic groups to serve numerous and diverse chemical
functions1,2. The hemeprotein family represents a fascinating example in this respect: a
single prosthetic group, the heme, promotes a variety of functions, such as dioxygen
storage and transport, electron transfer, hydroxylation and oxidation of organic substrates,
and hydrogen peroxide disproportion3. How different proteins are able to fine-tune the
environment of the heme cofactor, thus producing such different chemistries, is becoming
increasingly clear through the study of natural and artificial model systems.
High-resolution X-ray crystallographic data as well NMR analysis available for an
increasing number of heme-proteins, have deeply contributed to understanding their
reactivity and structural and electronic properties at the molecular level4-16. It is now well
ascertained that the protein matrix, which surrounds the heme active site, controls the
intrinsic reactivity of the prosthetic group, selecting one reaction as the only or
predominant one.
Myoglobin Cytochrome c with heme c
Figure 1.1:two natural heme proteins
However the inherent complexity of natural heme proteins continues to obscure the full
description of the factors governing the heme properties.

3
Therefore, a large number of artificial model systems are being developed in an attempt to
(i) provide further insights for structure-activity relationships, (ii) understand the minimal
requirements for function, (iii) reproduce the properties of the parent natural proteins in
smaller molecules, and (iv) most importantly construct new, tailor-made molecules useful
for biomedical, pharmaceutical, biological, and environmental applications.
4
NH
14
13
12
11
15
10
16
N 9
8
7
NH1
2
3
4
N
18
5
19
18
17
6
NH
NNH
N
1.1 Heme structure
1.1.1 Properties of the porphyrin macrocycle
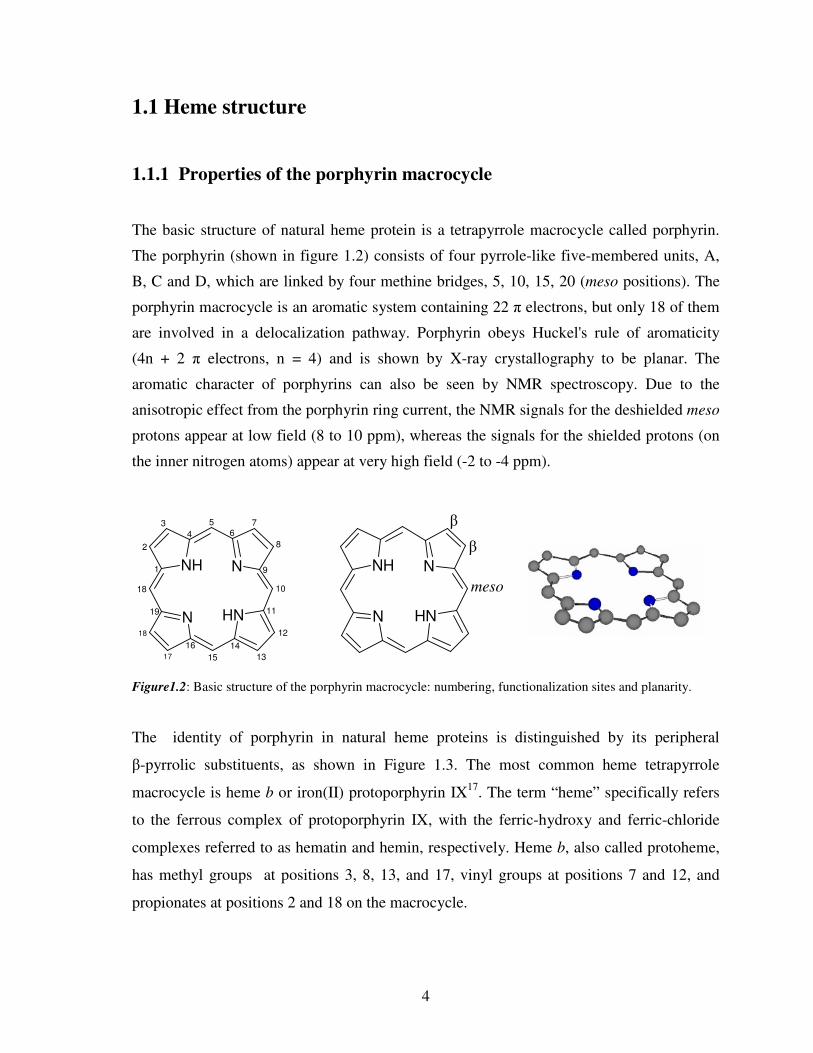
The basic structure of natural heme protein is a tetrapyrrole macrocycle called porphyrin.
The porphyrin (shown in figure 1.2) consists of four pyrrole-like five-membered units, A,
B, C and D, which are linked by four methine bridges, 5, 10, 15, 20 (meso positions). The
porphyrin macrocycle is an aromatic system containing 22 π electrons, but only 18 of them
are involved in a delocalization pathway. Porphyrin obeys Huckel's rule of aromaticity
(4n + 2 π electrons, n = 4) and is shown by X-ray crystallography to be planar. The
aromatic character of porphyrins can also be seen by NMR spectroscopy. Due to the
anisotropic effect from the porphyrin ring current, the NMR signals for the deshielded meso
protons appear at low field (8 to 10 ppm), whereas the signals for the shielded protons (on
the inner nitrogen atoms) appear at very high field (-2 to -4 ppm).
Figure1.2: Basic structure of the porphyrin macrocycle: numbering, functionalization sites and planarity.
The identity of porphyrin in natural heme proteins is distinguished by its peripheral
β-pyrrolic substituents, as shown in Figure 1.3. The most common heme tetrapyrrole
macrocycle is heme b or iron(II) protoporphyrin IX17. The term “heme” specifically refers
to the ferrous complex of protoporphyrin IX, with the ferric-hydroxy and ferric-chloride
complexes referred to as hematin and hemin, respectively. Heme b, also called protoheme,
has methyl groups at positions 3, 8, 13, and 17, vinyl groups at positions 7 and 12, and
propionates at positions 2 and 18 on the macrocycle.
β
β
meso

5
Figure1.3: Chemical structures of commonly occurring natural hemes a, b, c, and d.
All the porphyrins are synthesized in vivo as the free base forms before incorporation of the
iron(II) by the enzyme ferrocheletase18, 19. Additionally, heme b serves as the structure from
which hemes a and c are biosynthetically derived. Heme c is structurally similar to heme b
except that thioether bonds to cysteine residues replace one or both of the vinyl groups and
covalently link the heme macrocycle directly to the protein scaffold20. The covalent
attachment of heme to the protein is effected by the enzyme heme lyase,21 but in vitro
chemical synthesis has also been used to form the thioether bonds in b-type cytochrome
and c-type cytochrome scaffolds22-24. Instead Heme a is biosynthesized from heme b by
conversion of the vinyl group at position 2 into a hydroxyethylfarnesyl side chain, yielding
heme o, followed by subsequent oxidation of the methyl at position 8 to a formyl group23.
These alterations render heme a both more hydrophobic and more electron-withdrawing as
an equatorial ligand to iron than heme b. Other less common heme architectures include
heme d25, heme P-46026, siroheme27, and chlorocruoroheme28.

6
1.1.2 Coordination properties
It is now well ascertained that the protein matrix, which surrounds the heme active site,
controls the intrinsic reactivity of the prosthetic group, selecting one reaction as the only or
predominant one. The protein composition and structural organization of the peptide chain
dictate the properties of the primary (metal coordination geometry, number, type, and donor
properties of the axial ligands) and secondary (local dielectric constant, hydrophobicity,
and hydrogenbonding interactions near the active site coordination sphere) coordination
shells. Further, the protein directs long-range interactions29. These factors all contribute to
the functional specificity of the heme.
It has been well recognized that in the primary coordination sphere, therefore the axial
ligands to the iron in eme proteins, play important roles in modulation of structure and
function of heme proteins, such as redox potentials, electronic structure, spin states,
electron-transfer rates, and catalytic properties30-37.
Several amino acids are known to serve as axial or proximal ligands to heme proteins30-32.
In cytochromes (cyt), histidine, methionine, lysine, and cysteine are common axial ligands
that coordinate the heme. Bis-His and His-Met coordination, found in cyt b5 and cyt c,
respectively, are by far the most common ligation states of the cytochromes (Figure 1.4a).
Other ligation states, such as bis-Met and His-Lys, have also been found. Interesting
ligation from the terminal α-amino group of a peptide bond has been observed in cyt f
(Figure 1.4a)38. Heme-based sensors and enzymes are mostly five coordinate with an open
site for binding small molecules such as O2 and CO. In those proteins, histidine is by far the
most common axial ligand, with cysteine and tyrosine found in a few classes of heme
enzymes such as cyt P450, chloroperoxidase (CPO), and catalase (Figure 1.4b). Recently, a
new axial ligand, the N-terminal nitrogen of proline, was discovered in the CO sensing
heme protein called CooA (Figure 1.4b)39.
While the axial ligands to heme iron establish the basic coordination chemistry, the
interaction of amino acids beyond the primary coordination sphere is critical to modulating
the chemical properties of the heme, allowing it to perform a variety of biochemical
functions.

7
Figure 1.4a: Cytochromes with different axial ligand coordination
Figure 1.4b: Heme proteins with one open coordination site
The local protein environment surrounding the heme more finely regulates the heme-
protein properties, such as the iron redox potential40-45. For instance, a large number of
positively charged residues around the heme in hemoglobin and myoglobin may favor a
low oxidation state for the iron, making it ready to bind dioxygen. On the contrary, the
progressive change in the polarity of the surrounding peptide environment, from a negative
charge distribution in cytochromes b to a positive one in cytochromes c, determines a

8
gradual increase in the Fe(III)/Fe(II) redox potential. The resulting stabilization of the
matching Fe(II) and Fe(III) states enables cytochromes to mediate the electron transfer.
While the control of the functional specificity by the primary coordination sphere is well
understood, the contribution of medium- and long-range interactions is still not completely
rationalized, and their molecular description remains to be determined. Therefore, a large
number of artificial model systems are being developed in an attempt to
• provide further insights for structure-activity relationships;
• understand the minimal requirements for function;
• reproduce the properties of the parent natural proteins in smaller molecules;
• construct new, tailor-made molecules useful for biomedical, pharmaceutical,
biological, and environmental applications.
9
NH
N NH
N
OOH O OH
NH
N NH
N
OOH O OH
NH
N NH
NNH
N NH
N
OOH
O
OH
OH
O
O
OH
NH
N NH
N
OOH
O OH
NH
12
3
4
20
5
19
N6
7
8
NH 14
13
1211
N
15
10
16
17
18
OOH O
9
OHA B C
D E F
Chapter 2: Design of new metalloporphyrin scaffold
2.1 Covalent Peptide-Porphyrin Systems
In order to better understand the role of the peptide chain composition and folding in the
control of the physico-chemical properties of the heme-proteins, a great deal of attention
was devoted to the design of low molecular weight peptide based heme proteins mimetics.
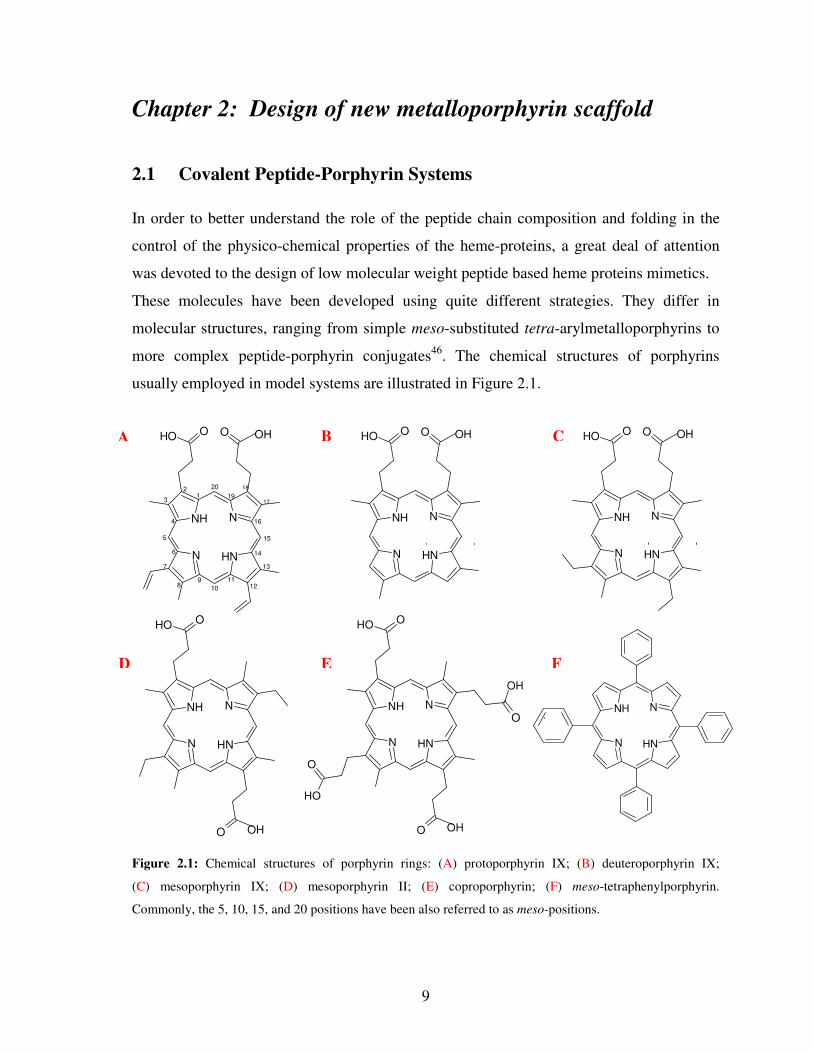
These molecules have been developed using quite different strategies. They differ in
molecular structures, ranging from simple meso-substituted tetra-arylmetalloporphyrins to
more complex peptide-porphyrin conjugates46. The chemical structures of porphyrins
usually employed in model systems are illustrated in Figure 2.1.
Figure 2.1: Chemical structures of porphyrin rings: (A) protoporphyrin IX; (B) deuteroporphyrin IX;
(C) mesoporphyrin IX; (D) mesoporphyrin II; (E) coproporphyrin; (F) meso-tetraphenylporphyrin.
Commonly, the 5, 10, 15, and 20 positions have been also referred to as meso-positions.

10
A common feature in the compounds so far developed is the assembly, around the
porphyrin ring, of several different chemical components, which are intended to fulfill the
features of the protein matrix and make the heme ready to accomplish specific functions.
As an example, to obtain oxygen carrier models, two main requirements are needed: (1)
stabilization of a five-coordinate heme complex having an imidazole proximal ligand and
(2) prevention from further oxidation of the iron-dioxygen complex47-50.
In the natural systems these mandatory conditions for efficient reversible oxygen binding
are accomplished by the presence of the steric bulkiness of the protein moiety, which
blocks the formation of a µ-oxo bridge between two heme complexes and brings the axial
ligand in the correct coordination position.
On the other hand, a chemical model system for the dioxygen activation, resembling the
cytochrome-P450 catalytic cycle and efficiency, should embody the following features.
(1) An axial thiolate ligand should be present, as it fundamentally contributes to the
heterolytic cleavage of O-O bond and modulates the intrinsic reactivity of the high valent
iron-oxo species. (2) A steric protection of the porphyrin ring is required to prevent the
rapid degradation of the catalyst by the oxidizing species produced during the reaction. (3)
Further, to control the chemio-, regio-, and stereoselectivity in oxygenation reactions, a
chiral environment, able to selectively recognize a defined substrate, should be constructed
around the heme group51-54.
The first studies on low molecular weight heme-protein models was based on the
construction around the heme of bulky moieties by covalently linking aromatic or aliphatic
substituents to the porphyrin ring 47-54.Unfortunately the low functionality of these model
systems have not permitted their use in pratical applications. Nevertheless these molecules
have gained considerable success at a molecular level, because they have better helped to
better understand the properties of the natural heme-proteins. (Figure2.2)
In more recent years, the field of heme-protein mimetics broadens to include more
elaborate peptide based models. Peptide-based models are having an enormous impact on
our understanding of the factors governing the heme properties, as they seem to be better
candidates to mimic both the structural characteristics and reactivity of the natural systems.
11
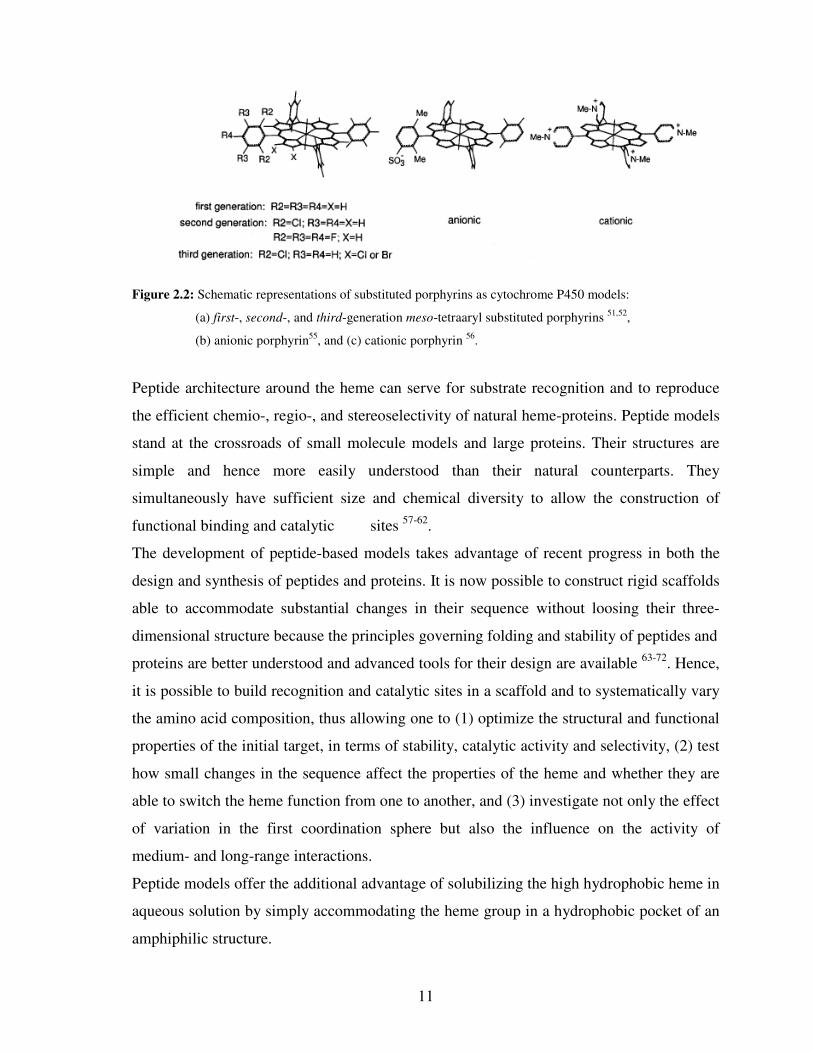
Figure 2.2: Schematic representations of substituted porphyrins as cytochrome P450 models:
(a) first-, second-, and third-generation meso-tetraaryl substituted porphyrins 51,52,
(b) anionic porphyrin55, and (c) cationic porphyrin 56.
Peptide architecture around the heme can serve for substrate recognition and to reproduce
the efficient chemio-, regio-, and stereoselectivity of natural heme-proteins. Peptide models
stand at the crossroads of small molecule models and large proteins. Their structures are
simple and hence more easily understood than their natural counterparts. They
simultaneously have sufficient size and chemical diversity to allow the construction of
functional binding and catalytic sites 57-62.
The development of peptide-based models takes advantage of recent progress in both the
design and synthesis of peptides and proteins. It is now possible to construct rigid scaffolds
able to accommodate substantial changes in their sequence without loosing their three-
dimensional structure because the principles governing folding and stability of peptides and
proteins are better understood and advanced tools for their design are available 63-72. Hence,
it is possible to build recognition and catalytic sites in a scaffold and to systematically vary
the amino acid composition, thus allowing one to (1) optimize the structural and functional
properties of the initial target, in terms of stability, catalytic activity and selectivity, (2) test
how small changes in the sequence affect the properties of the heme and whether they are
able to switch the heme function from one to another, and (3) investigate not only the effect
of variation in the first coordination sphere but also the influence on the activity of
medium- and long-range interactions.
Peptide models offer the additional advantage of solubilizing the high hydrophobic heme in
aqueous solution by simply accommodating the heme group in a hydrophobic pocket of an
amphiphilic structure.

12
2.2 Spectral Properties of Metal-Porphyrins and Heme-Proteins
UV-vis spectroscopy has been widely applied for the characterization of peptide-based
heme-protein models because it is one of the most powerful techniques for the analysis of
the heme properties. Useful information on artificial porphyrin-containing systems can be
obtained by comparing their spectral properties with those of natural heme-proteins and
viceversa. This section will provide a brief survey of the main spectral features of
metalloporphyrins and heme-proteins, which could be helpful to nonspecialists in
understanding the subsequent sections. For a more detailed description of porphyrin and
metalloporphyrin spectra together with the theoretical aspects of the spectral transitions, the
readers can refer to many excellent reviews on the arguments 73-76.
The porphyrins and their various metal complexes show very distinct spectra, and UV-vis
spectroscopy can be conveniently applied to ascertain the insertion of the metal into the
porphyrin ring, the oxidation and spin state of the metal, and the nature of the axial ligands.
The highly conjugated π-electron system of the porphyrin ring is responsible for its intense
color. Two π → π* electronic transitions are responsible for the absorption bands, typically
found in the porphyrin spectra73-76. An intense band (molar extinction coefficient ≈ 105 M-1
cm-1) is detected around 400 nm, and it is referred to as the B band, Soret band, or γ band;
much weaker bands (molar extinction coefficient ≈ 104 M-1 cm-1) are observed in the 500-
600 nm visible region. These weaker bands are referred to as Q bands or β-α bands. The α
band corresponds to the lowest porphyrin π → π* singlet transition Qo and the β band to the
vibronic envelope Qv73,74. The visible bands are very sensitive to the metal inserted into the
porphyrin ring and to peripheral substituent groups. The Qo and Qv transitions are polarized
in the x, y plane of the porphyrin; for a metal porphyrin with D4h symmetry, the dipole
transitions in the x and y directions are equivalent and both the Qo and Qv transitions are
doubly degenerate. Thus, the spectrum of a metal porphyrin usually shows two bands in the
visible region. In free base porphyrins, two protons are linked to two opposite inner
nitrogens (see Figure 1). In this case, the porphyrin plane no longer possess the 4-fold
symmetry and β and α bands splits. In fact, the degenerate Qo transition is replaced by
transitions polarized along each of the nonequivalent x and y axes, Qox and Qo
y.
13
Each transition has its vibronic envelope (Qvx and Qv
y), and, as a consequence, four distinct
bands characterize the spectrum of free base porphyrins in the visible region73-76.
The positions of the Soret, β, and α bands depend on the metal electron configuration, and
the energy of the transitions varies as a consequence of the coupling between the metal and
the porphyrin orbitals. The absorption spectra of metalloporphyrins are thus classified into
three types, normal, hypso, and hyper 76.
Normal-type spectra are observed for a majority of metalloporphyrins with closed-shell
metal ions, where the relevant porphyrin π orbitals do not significantly interact with the
metal orbitals. The Soret, α, and β bands are often found around 400, 570, and 530 nm,
respectively.
Hypso-type spectra follow the normal absorption pattern, but all bands are blue-shifted, due
to filled metal d orbitals to porphyrin π* back-donation. Metal ions that cause hypso-type
spectra are limited to those of d6-d9 electron configurations.
Finally, hyper-type spectra show charge-transfer bands in addition to a significant red-shift
of the porphyrin π-π* bands. They are difficult to analyze because the number of extra
bands varies from one metal ion to another and the positions of all bands are far more
dependent on the axial ligands than in the other types 76. Metal ions with d1-d5 electron
configurations show these hyper-type spectra. Most of them can be easily found in lower
oxidation states within the porphyrin, causing normal- or hypso-type spectra. Mn(III)- and
Fe(III)-porphyrins are the best known examples in this respect.
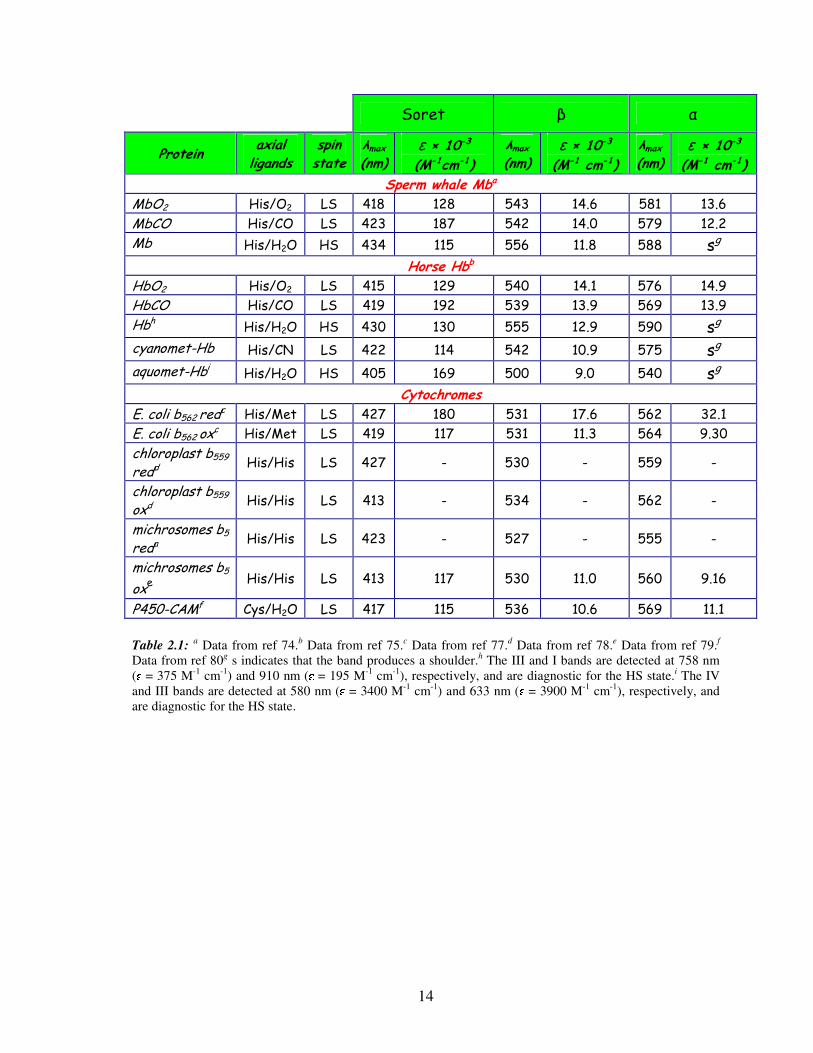
The UV-vis spectra of heme-proteins show absorption patterns quite similar to those
observed in simple metalloporphyrins. They are very sensitive to the oxidation and spin
state of the iron, which are modulated by the protein environment. In addition to the Soret,
β, and α bands, four extra bands are found in the lower energy of the visible region, and
they are usually referred to as IV, III, II, and I. The typical UV-Vis absorption data for
several hemoproteins are reported in Table 2.174,75,77-80.
14
Soret β α
Protein axial ligands
spin state
λmax (nm)
ε × 10-3
(M-1cm-1)
λmax (nm)
ε × 10-3 (M-1 cm-1)
λmax (nm)
ε × 10-3 (M-1 cm-1)
Sperm whale Mba
MbO2 His/O2 LS 418 128 543 14.6 581 13.6
MbCO His/CO LS 423 187 542 14.0 579 12.2
Mb His/H2O HS 434 115 556 11.8 588 sg Horse Hbb
HbO2 His/O2 LS 415 129 540 14.1 576 14.9
HbCO His/CO LS 419 192 539 13.9 569 13.9
Hbh His/H2O HS 430 130 555 12.9 590 sg cyanomet-Hb His/CN LS 422 114 542 10.9 575 sg aquomet-Hbi His/H2O HS 405 169 500 9.0 540 sg
Cytochromes
E. coli b562 redc His/Met LS 427 180 531 17.6 562 32.1
E. coli b562 oxc His/Met LS 419 117 531 11.3 564 9.30
chloroplast b559
redd His/His LS 427 - 530 - 559 -
chloroplast b559
oxd His/His LS 413 - 534 - 562 -
michrosomes b5
reda His/His LS 423 - 527 - 555 -
michrosomes b5
oxe His/His LS 413 117 530 11.0 560 9.16
P450-CAMf Cys/H2O LS 417 115 536 10.6 569 11.1
Table 2.1: a Data from ref 74.b Data from ref 75.c Data from ref 77.d Data from ref 78.e Data from ref 79.f
Data from ref 80g s indicates that the band produces a shoulder.h The III and I bands are detected at 758 nm ( = 375 M-1 cm-1) and 910 nm ( = 195 M-1 cm-1), respectively, and are diagnostic for the HS state.i The IV and III bands are detected at 580 nm ( = 3400 M-1 cm-1) and 633 nm ( = 3900 M-1 cm-1), respectively, and are diagnostic for the HS state.
15
2.3 Microperoxidases
Peptide-based hemoprotein models have been developed in order to reproduce better in
model systems the physical-chemical properties of the natural systems. Microperoxidases
(MP8 and MP11) have been widely employed as biomimetic models for heme-containing
enzymes.
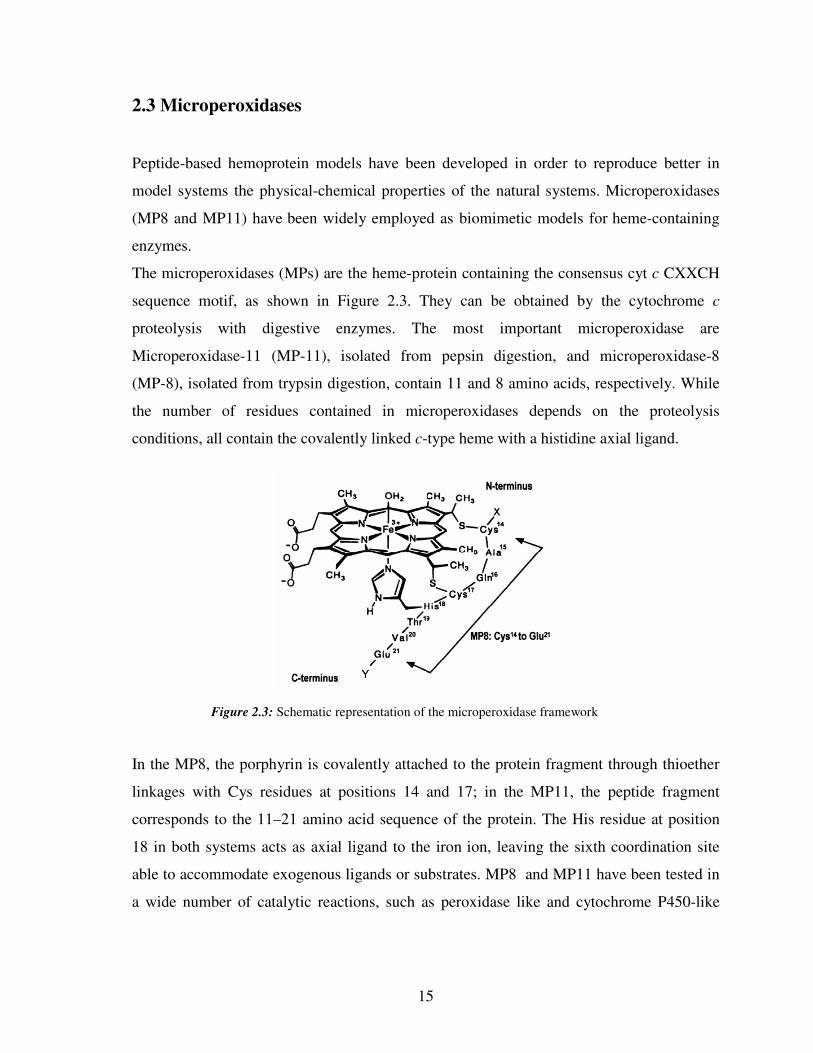
The microperoxidases (MPs) are the heme-protein containing the consensus cyt c CXXCH
sequence motif, as shown in Figure 2.3. They can be obtained by the cytochrome c
proteolysis with digestive enzymes. The most important microperoxidase are
Microperoxidase-11 (MP-11), isolated from pepsin digestion, and microperoxidase-8
(MP-8), isolated from trypsin digestion, contain 11 and 8 amino acids, respectively. While
the number of residues contained in microperoxidases depends on the proteolysis
conditions, all contain the covalently linked c-type heme with a histidine axial ligand.
Figure 2.3: Schematic representation of the microperoxidase framework
In the MP8, the porphyrin is covalently attached to the protein fragment through thioether
linkages with Cys residues at positions 14 and 17; in the MP11, the peptide fragment
corresponds to the 11–21 amino acid sequence of the protein. The His residue at position
18 in both systems acts as axial ligand to the iron ion, leaving the sixth coordination site
able to accommodate exogenous ligands or substrates. MP8 and MP11 have been tested in
a wide number of catalytic reactions, such as peroxidase like and cytochrome P450-like

16
reactions. They are able to activate hydrogen peroxide to give high valence iron
oxo species.
The applications of these systems are limited low stability under the catalytic conditions:
the porphyrin ring is rapidly degraded either by the direct action of H2O2 or by
intermolecular reactions between the iron-oxo species and a non-activated molecule of the
catalyst. However, their stability is higher than that of simple protoporphyrin systems, thus
indicating that the presence of a small peptide chain can play an important protective role.
Recently 81, the influence of peptide chain length and composition on the stability of the
microperoxidases has been investigated. An increase in the size of, the attached polypeptide
results in an increase in stability. The peptide chains can: (a) function as a scavenger for
hydroxyl or superoxide radicals; (b) make a barrier for the formation of the inactive µ-oxo
diiron dimer; (c) act as an alternative source of H-atoms, thus reducing the inactivation of
the microperoxidase by H-atom abstraction from the meso position of the porphyrin ring.
The analysis of the features of microperoxidases highlights the role of the peptide chains in
modulating the reactivity of the heme ring. Furthermore, these molecules also serve as
useful probes for the interpretation of some spectroscopic properties of synthetic heme-
peptide adducts 82.
2.4 Peptide based-synthetic porphyrins
The search for artificial catalytic systems able to reproduce the properties of natural
hemeproteins is a key field in bioinorganic chemistry. The pioneering example of an
artificial hemeprotein, based on a peptide-porphyrin conjugate system, was developed by
Sasaki and Kaiser in an effort of using a porphyrin ring as a template to direct helical
folding into the attached peptides 83-84. The resulting molecule, named “helichrome”, is
characterized by four identical 15-residue peptide chains N-terminally linked to the four
propionic groups of coproporphyrin I, shown in Figure 2.4.
17
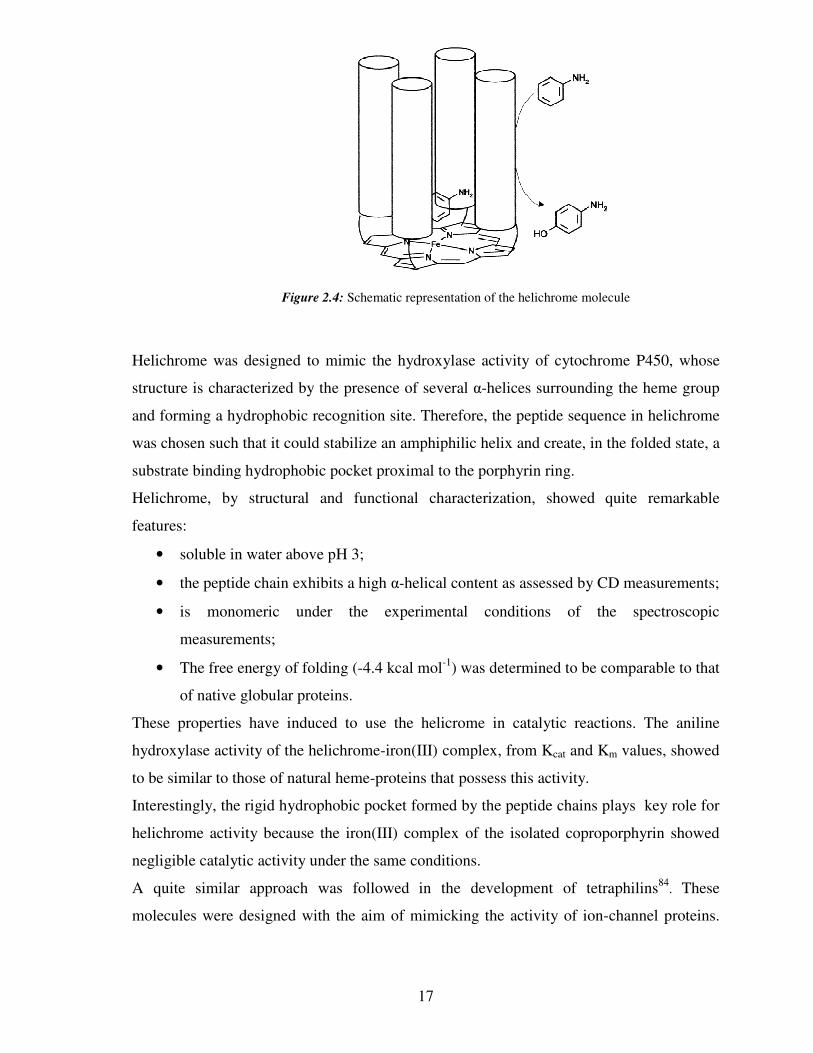
Figure 2.4: Schematic representation of the helichrome molecule
Helichrome was designed to mimic the hydroxylase activity of cytochrome P450, whose
structure is characterized by the presence of several α-helices surrounding the heme group
and forming a hydrophobic recognition site. Therefore, the peptide sequence in helichrome
was chosen such that it could stabilize an amphiphilic helix and create, in the folded state, a
substrate binding hydrophobic pocket proximal to the porphyrin ring.
Helichrome, by structural and functional characterization, showed quite remarkable
features:
• soluble in water above pH 3;
• the peptide chain exhibits a high α-helical content as assessed by CD measurements;
• is monomeric under the experimental conditions of the spectroscopic
measurements;
• The free energy of folding (-4.4 kcal mol-1) was determined to be comparable to that
of native globular proteins.
These properties have induced to use the helicrome in catalytic reactions. The aniline
hydroxylase activity of the helichrome-iron(III) complex, from Kcat and Km values, showed
to be similar to those of natural heme-proteins that possess this activity.
Interestingly, the rigid hydrophobic pocket formed by the peptide chains plays key role for
helichrome activity because the iron(III) complex of the isolated coproporphyrin showed
negligible catalytic activity under the same conditions.
A quite similar approach was followed in the development of tetraphilins84. These
molecules were designed with the aim of mimicking the activity of ion-channel proteins.

18
To provide assemblies of defined aggregation state and drive amphiphilic peptides into four
helix bundles, ion-channel-forming peptides were covalently attached to a
tetraphenylporphyrin derivative (shown in Figure 2.5).
Figure 2.5: Molecular model of tetraphyillin.
Four copies of the 21-residue peptide (LSLBLSL)3 (B= α-aminoisobutyric acid) were
covalently linked through the peptide N-terminus to meso-tetrakis (mcarboxyphenyl)
porphyrin via m-carboxamido linkages. Meta substitution provides optimal interhelical
spacing for ion transport. The tetraphilins properties in forming ion channels in planar
diphytanoyl phosphatidylcoline bilayers indicated that the attachment of the peptide to the
template stabilizes the conducting state of the peptide. Therefore, thetetraphenylporphyrin
template exerts a major influence on the lifetime and voltage dependence of (LSLBLSL)3
channels, possibly through changes in the overall hydrophobicity and geometric restrictions
imposed on the peptide.
In summary, heliochrome and tetraphilins are excellent examples of using a porphyrin
template to direct the folding of peptides into a helical conformation.
The use of porphyrin templates for inducing helical conformation in peptide sequences is as
well reported in the papers of Benson85–87. With the aim of elucidating the forces which
impart stabilization to protein structures, they developed peptide sandwiched mesoheme
molecules85,87, in which a random coil–helix transition of two identical peptides, covalently
attached to a iron III–mesoporphyrin IX moiety, occurs upon histidine to iron binding.

19
In a subsequent work86, the same effects have been investigated by using a
cystine-dimerized peptide containing two histidine residues. In the presence of
cobalt ( III )–coproporphyrin I, the peptide self assembled around the macrocyclic ring.
The authors concluded that these non-covalent model systems could be applied to probe the
influence of peptide sequence and porphyrin structure on peptide conformational stability.
A similar approach was followed by Mihara et al. in the design of heme-binding
peptides88. A 14-residue peptide segment was designed to stabilize an amphiphilic α-helix
structure. To construct a parallel 2α-helix structure the two segments were dimerized by the
disulfide linkage of Cys16.
Furthermore, a His residue was introduced at the position 6 of the sequence in order to
coordinate a heme group. The CD and UV-Visible spectroscopic characterizations showed
that the heme binding is controlled by the peptide conformation. Moreover, the formation
of the heme–peptide complex enhances the N demethylase activity of the heme.

20
N
N N
N
OR O R
Fe
2.5 Peptide-Sandwiched Deuteroheme: Mimochromes
Our laboratory has approached the challenge of constructing heme-protein models using a
miniaturization process46. A miniaturized heme-protein is a peptide-based model which
contains a minimum set of constituents necessary for
• an accurate reconstruction of a well-defined structure and
• a fine tuned reproduction of a defined function.
This strategy leads to the development of a class of miniaturized heme-proteins, named
mimochromes89-93. The schematic structures of mimochromes are reported in Figure 2.6.
1
Figure 2.6: Schematic representation of mimochromes
Mimochromes are peptide-porphyrin conjugates, with pseudo-C2 symmetry. They are made
up of deuteroporphyrin, covalently linked to two peptides (nine or fourteen residues), via an
amide bond between the porphyrin propionyl groups and the side chains of two Lys
residues89-92. The peptide fragments, which face the porphyrin plane, are in α-helical
conformation, a common feature of several natural heme-proteins. The α-helix is a well-
defined rigid scaffold, which can accommodate several amino acid substitutions without
severe structural perturbations; therefore, numerous model compounds, based on helical
Mimochrome Peptide sequence
I Ac-L-A-Q-L-H-A-N-K-L-NH2
II Ac-D-L-S-D-L-H-S-K-K-L-K-I-T-L-NH2
IV Ac-E-S-Q-L-H-S-N-K-R-NH2
R=R1 peptides sequence
21
NH
12
3
4
20
5
19
N6
7
8
NH 14
13
1211
N
15
10
16
17
18
ON O
9
N
Leu
Lys
Asn
Ala
His
Gln
Ala
Leu
NH2
Ac
Leu
Lys
Asn
Ala
His
Gln
Ala
Leu
NH2
Ac
Leu Leu
peptides, have been developed94,95. The peptide sandwiched mesoheme85-87, the disulfide
linked α-helices-mono-heme adducts96-98, the MOP derivatives99-101, and the heme-
maquettes102-105 are examples of either covalent or non-covalent artificial heme-peptide
conjugates.
The prototype mimochrome I was designed an the β-chain of human deoxyhemoglobin as
template structure. The X-ray structure of deoxyhemoglobin106 showed that the proximal
His89 residue is located in the central position of the Leu88-Leu96 protein fragment. This
protein fragment adopts an helical conformation. It represents a rigid framework both for
properly positioning His89 in the correct coordination site, and for completely covering one
face of the heme. The helix axis is about parallel to the porphyrin plane; hydrophobic
residues surround the axial coordinating residue and face the heme directly.
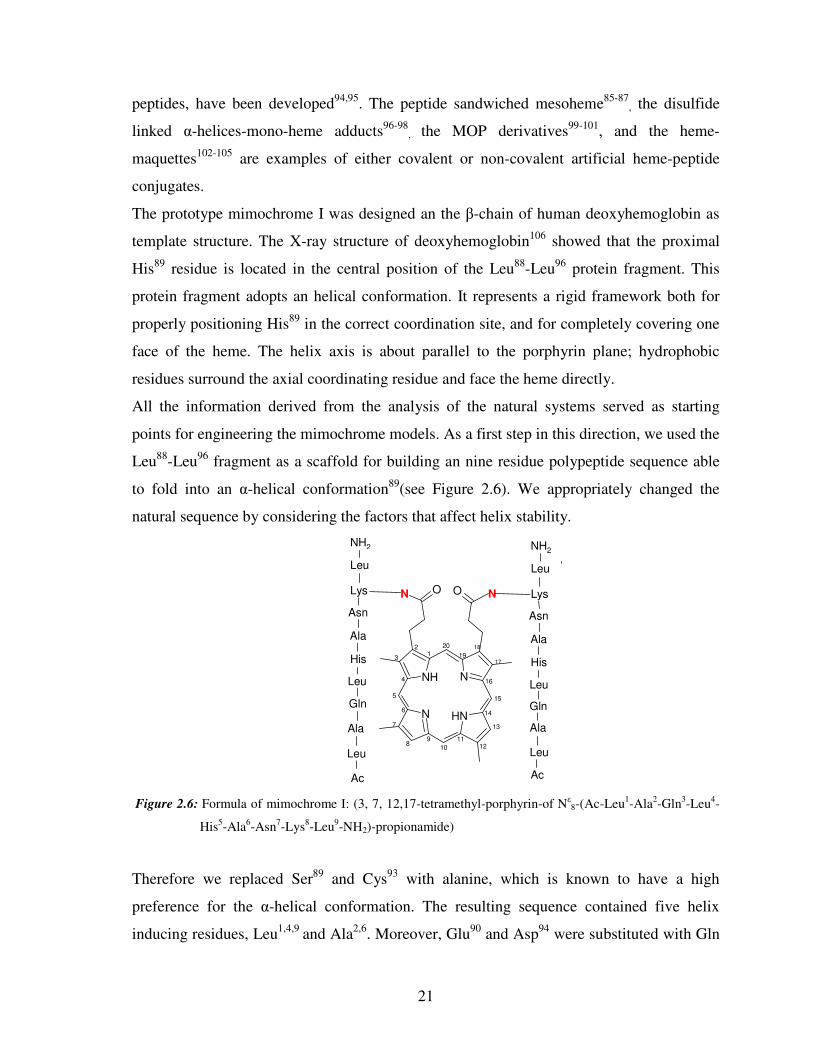
All the information derived from the analysis of the natural systems served as starting
points for engineering the mimochrome models. As a first step in this direction, we used the
Leu88-Leu96 fragment as a scaffold for building an nine residue polypeptide sequence able
to fold into an α-helical conformation89(see Figure 2.6). We appropriately changed the
natural sequence by considering the factors that affect helix stability.
Figure 2.6: Formula of mimochrome I: (3, 7, 12,17-tetramethyl-porphyrin-of Nε8-(Ac-Leu1-Ala2-Gln3-Leu4-
His5-Ala6-Asn7-Lys8-Leu9-NH2)-propionamide)
Therefore we replaced Ser89 and Cys93 with alanine, which is known to have a high
preference for the α-helical conformation. The resulting sequence contained five helix
inducing residues, Leu1,4,9 and Ala2,6. Moreover, Glu90 and Asp94 were substituted with Gln
22
and Asn respectively, in order to obtain an uncharged compound. N- and C-terminal ends
were acetylated and amidated, respectively, in order to avoid unfavorable end-charge to
helix-dipole interactions. The peptide chain was then covalently linked to the porphyrin
propionic group through the ε-amino function of Lys8. Molecular modeling showed that
changing the side chain conformation of Lys95 as found on the β chain of deoxyemoglobin
and the conformation of the closest propionyl carboxyl group, the lysine ε-amino group
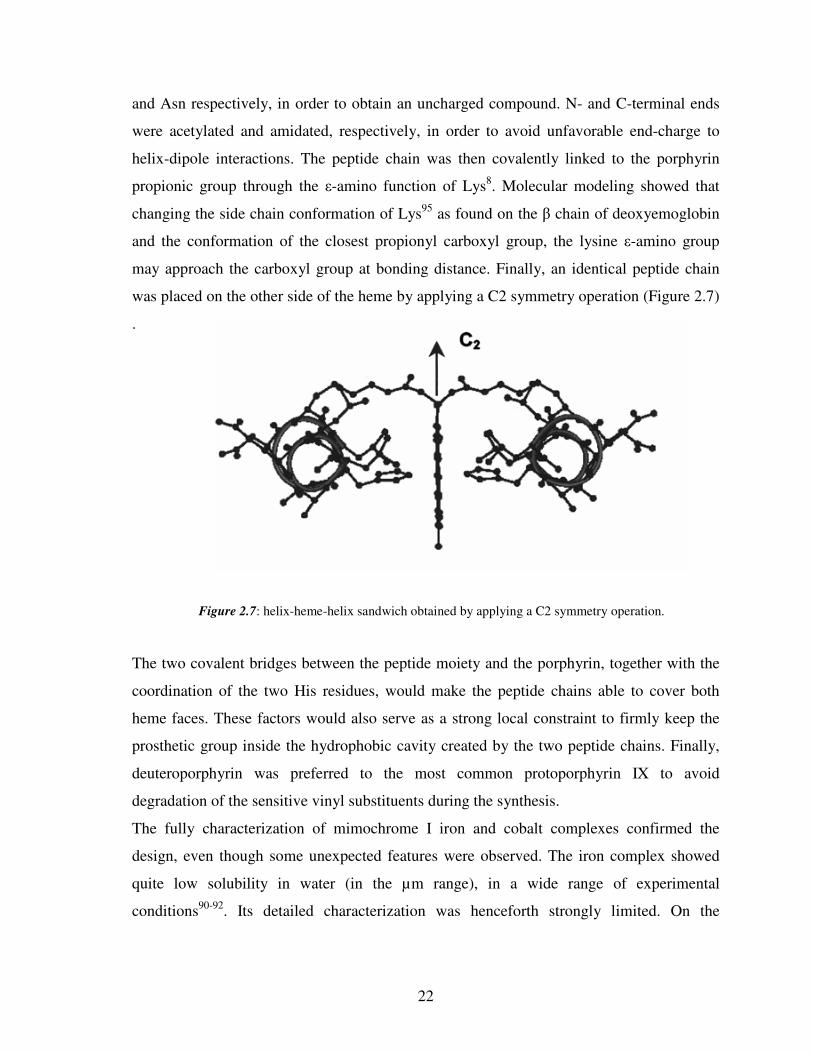
may approach the carboxyl group at bonding distance. Finally, an identical peptide chain
was placed on the other side of the heme by applying a C2 symmetry operation (Figure 2.7)
.
Figure 2.7: helix-heme-helix sandwich obtained by applying a C2 symmetry operation.
The two covalent bridges between the peptide moiety and the porphyrin, together with the
coordination of the two His residues, would make the peptide chains able to cover both
heme faces. These factors would also serve as a strong local constraint to firmly keep the
prosthetic group inside the hydrophobic cavity created by the two peptide chains. Finally,
deuteroporphyrin was preferred to the most common protoporphyrin IX to avoid
degradation of the sensitive vinyl substituents during the synthesis.
The fully characterization of mimochrome I iron and cobalt complexes confirmed the
design, even though some unexpected features were observed. The iron complex showed
quite low solubility in water (in the µm range), in a wide range of experimental
conditions90-92. Its detailed characterization was henceforth strongly limited. On the

23
opposite, the cobalt complex was soluble in water (up to mm concentration), but two
equally abundant isomers were obtained (see Figure 2.8).
Because of the flexibility of the linker between the peptide and the deuteroporphyrin ring,
each peptide chain can be positioned either above or below the porphyrin plane, giving rise
to Λ and ∆ diastereomers (see Figure 2.9)91.
Figure2.8: Schematic representation of the two possible orientations of the peptide chains around the metal
center, which give rise to the two Λ and ∆ diastereomers.
This finding was confirmed by the solution structural characterization89. In fact, the NMR
structures of the two diamagnetic Co(III) isomers (Figure 2.9), which represent the first
example of structure determination of a designed heme-protein models, allowed a definitive
identification of the two isomers as the Λ and ∆ diastereomers and a straightforward
correlation between their structure and spectral properties. As expected, the peptide chains
adopt an almost regular α-helical conformation; the helices lie parallel to the porphyrin
plane, and they are antiparallel to each other in the Λ isomer and about orthogonal in the ∆
isomer (see Figure 2.9). The analysis of the three-dimensional structure of the two cobalt
isomers was important in understanding the properties of the Fe(II) and Fe(III) complexes,
which could not be studied by NMR spectroscopy because of their poor solubility
Λ ∆

24
Figure 2.9: Average molecular structures of Co(III) mimochrome I ∆ and Λ isomers, as obtained from NMR
experimental data and RMD calculations.
The remarkably different solubility between the iron and cobalt complexes was tentatively
attributed to the simultaneous presence of the two diastereomers, for the iron complex, in
fast interconverting equilibrium. During this process both peptide chains might be
displaced from the porphyrin plane. The porphyrin ring is thus exposed to the solvent, and
aggregation by stacking of the porphyrin ring may occur. Confirmation for this hypothesis
came from the CD spectral properties in the Soret region, which are an average of those
corresponding to the two separate diastereomers (see Table 2.2).
The unpredicted but experimentally observed Λ and ∆ isomers of Co(III)-mimochrome I
clarify the concept of diastereomerism that may occur when polypeptides coordinate to
metal ions. The use of local pseudo-C2 symmetry is particularly advantageous to construct
symmetric molecules with minimized size, because it simplifies the design, reduces the size
of the molecules to be synthesized, and may simplify their structural characterization107,108.
However, great attention should be paid in the design to overcome the problem of
diastereomer formation.

25
Table 2.2: CD parameters for Mimochrome Derivativesa; (a), The intensities of the cotton effect are
proportional to the number of
The information derived from mimochrome I was fruitfully applied for improving the
structure by design. Two strategies were used to reduce the peptide flexibility:
• by elongating the peptide chain at the C-termini, with a four residue fragment,
modeled in an extended conformation;
• by amino acid substitutions that may provide intra-molecular, inter-chain
interactions.
The first strategy was successfully applied, as reported for mimochrome II, where the
stabilization of the Λ isomer was achieved91. The second strategy led to the design of
mimochrome IV, namely 3,7,12,17-tetramethylporphyrin-2,18-di-N8ε-(Ac-Glu1-Ser2-Gln3-
Leu4-His5-Ser6-Asn7-Lys8-Arg9-NH2)-propionamide.
Mimochrome IV was designed by using the NMR structures of Co(III) mimochrome I ∆
and Λ isomers as templates90. Mimochrome I contains two leucine residues at both the N-
and C-termini. These residues were selected in the initial design of mimochrome I, because
UV region Soret region
[ ]222 [ ] sign
mimochrome I not detected not detected
Fe(III)-mimochrome I (-) ; (+) S-shaped
Co(III)-mimochrome I negative
Co(III)-mimochrome I positive
mimochrome II not detected not detected
Co(III)-mimochrome II negative
mimochrome III negative
Fe(III)-mimochrome III positive
mimochrome IV not detected not detected
Fe(III)-mimochrome IV positive
Co(III)-mimochrome IV positive

26
of their high propensity to be accommodated in α-helical conformation109. Further, we
expected that hydrophobic interactions, between the leucine side chains and the porphyrin,
would drive the helices to lay on the porphyrin. Nevertheless as mentioned previously , the
sandwich was stable for the Co(III) derivative, and not for the FeIII 89,90. In order to provide
an extra contribution to the stability of the sandwich, beside the metal coordination force,
we modified the sequence of mimochrome I, by introducing intra-molecular, inter-helical
interactions.
The Cα atoms of Leu1 of one helix and of Leu9 of the other helix are about 12 Å apart in
both isomers. At this distance, the carboxylate side chain of a Glu residue at position 1 of
one peptide chain could ion pair with the guanidine group of an Arg residue at position 9 of
the other peptide chain. Thus, Glu1 and Arg9, which replace Leu1 and Leu9, was inserted to
stabilize one of the two possible diastereomers. Further, the solvent exposed Ala2 and Ala6
in mimochrome I were replaced by Ser residues in mimochrome IV in order to further
increase the water solubility of the new molecule.
The insertion of Glu and Arg residues at position 1 and 9 of the sequence, respectively, was
successful in stabilizing the sandwich structure and in favoring the formation of Λ isomer
(figure 2.10) over the other, both in the Fe(III) and Co(III) complexes. These results were
confirmed by NMR data and RMD calculations110.
Figure 2.10: Co(III)-mimochrome IV average structure as obtained from NMR data and RMD calculations

27
The UV-vis pH titration showed the iron bis-His coordination is strong enough to bring the
His pKapp value around 3.8. The bis-His coordination is even stronger in Co(III) complex,
and it occurs at very acidic conditions (pH < 2). This finding is related to the high
preference of cobalt for nitrogen donor ligands, and to the exchange- inertness of low-spin
Co(III) complexes. These low pKa values of the axially coordinating His (with values very
close to what observed in several myoglobins, hemoglobins and cytochromes in the
oxidized and reduced forms) strongly support the designed sandwich structure111,112.
CD spectra in the far UV region confirmed the peptide chain to be predominantly in an
α-helical conformation in both the apo and metalated species, even at low TFE
concentration. We also observed that the sign of the Cotton effect depends on the relative
orientation of the peptide chains respect to the porphyrin plane. In the cobalt complexes of
mimochrome I and II, the Λ configuration gives rise to a positive Cotton effect, whereas the
∆ configuration gives rise to a negative effect; in the Fe(III) mimochrome I complex, the
observed S-shaped Soret Cotton effect was attributed to the simultaneous presence of the
two diastereomeric forms. Consequently, the presence of a positive Cotton effect in both
Fe(III) and Co(III) mimochrome IV complexes indicates that both systems assume a
Λ configuration. A single positive Cotton effect detected even in the iron complex
confirmed the effectiveness of the inter-helical interactions in reinforcing the sandwich
structure and in driving the peptide chains to fold into a unique topology around the heme.
The definitive answer of the structural identity of the diastereomer stabilized in
mimochrome IV was obtained by NMR structural characterization of the cobalt complex.
The NMR analysis fully confirms the UV-vis and CD data, both regarding the helical
conformation of the peptide chains, and the Λ configuration of the hexacoordinated CoIII
ion. The RMD calculations, using the NMR experimental data as conformational restraints,
indicated two helical peptide chains, oriented about perpendicularly.
In summary, mimochrome IV is a simple, structurally defined heme protein model, which
provide an excellent opportunity for exploring the subtle mechanisms that control the heme
functions. The peptide structure of mimochrome IV is such that a partially open
hydrophobic cage around the imidazole ring is present. Except for the position 20 of the
deuteroporphyrin ring, all the other meso positions are covered by the polypeptide chains,
28
which, similarly to the natural systems, may protect the deuteroporphyrin ring from
degradation during catalytic cycles.
The amino acid composition of mimochrome IV can be modified in order to modulate the
functionality in terms of redox potentials, trying to adapt the behavior to different
applications. Substitution of serines, glutamines and asparagines, which point outward from
the molecular core, with differently charged residues may alter the electrostatics, polarity
and solvent accessibility of the heme site, and modulate its electronic, catalytic and binding
properties.

29
Chapter 3: Design of new mimochromes
On the basis of results gotten by mimochromes development, we have drawn advantage
from stereochemically stable structure of mimochrome IV for modulating the redox
potential of the heme. Based on the mimochrome IV design, two news models were
obtained: mimochrome IV 8Glu and mimochrome IV 8Lys (figure 3.1).
Figure 3.1: Schematic structures of mimochrome IV, mimochromeIV 8Glu , and mimochrome IV 8Lys
N
N N
N
O ON N
Fe
NH2
Arg -Lys Asn Ser His Leu Gln Ser Glu Ac
NH2
Arg Lys- Asn Ser His Leu Gln Ser Glu Ac
Fe-mimochrome IV
N
N N
N
O ON N
Fe
NH2
Arg -Lys Glu Glu His Leu Glu Glu Glu Ac
NH2
Arg Lys- Glu Glu His Leu Glu Glu Glu Ac
Fe-mimochrome IV 8Glu
N
N N
N
O ON N
Fe
NH2
Arg -Lys Lys Lys His Leu Lys Lys Glu Ac
NH2
Arg Lys- Lys Lys His Leu Lys Lys Glu Ac
Fe-mimochrome IV 8Lys

30
Mimochrome IV 8Glu and mimochrome IV 8Lys contain into their sequences differently
charged residues: eight Glu residues and eight Lys residues, respectively, that replace Ser,
Asn and Gln of the parent Mimochrome IV sequence. The impact of the charge on heme
properties was studied in this work thesis

31
Results and Discussion
32
N
N N
N
OR O R
Fe
Chapter 4: Mimochromes synthesis
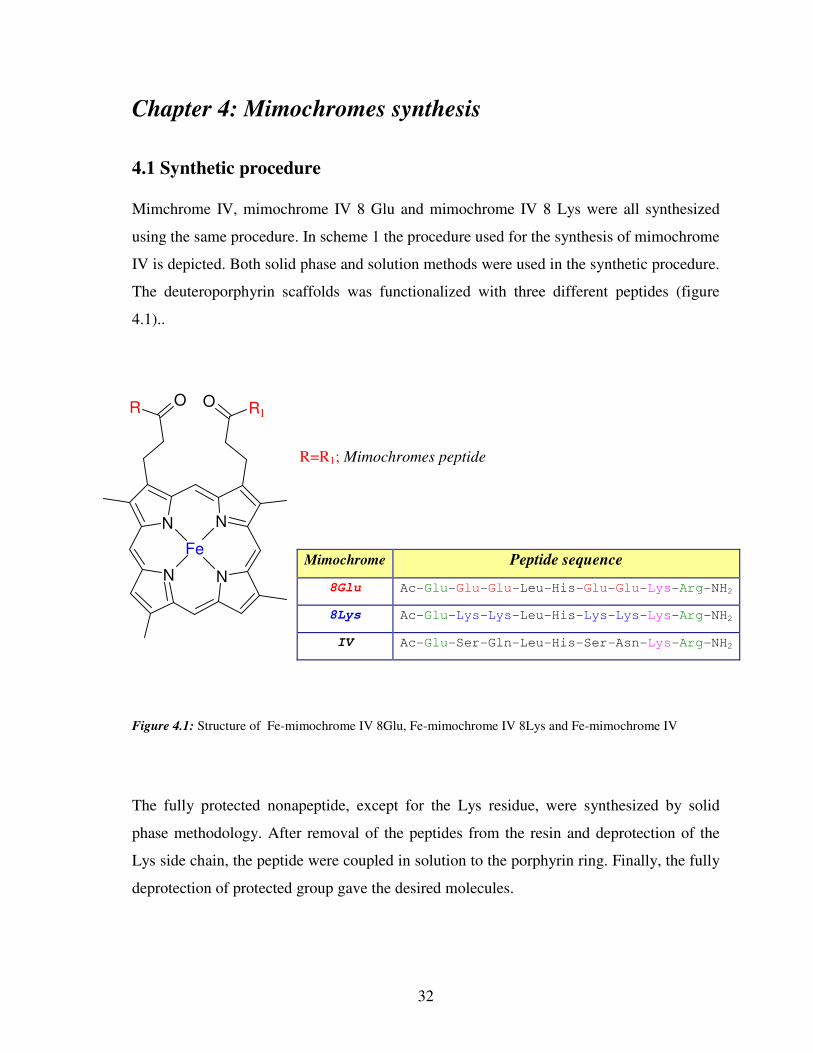
4.1 Synthetic procedure
Mimchrome IV, mimochrome IV 8 Glu and mimochrome IV 8 Lys were all synthesized
using the same procedure. In scheme 1 the procedure used for the synthesis of mimochrome
IV is depicted. Both solid phase and solution methods were used in the synthetic procedure.
The deuteroporphyrin scaffolds was functionalized with three different peptides (figure
4.1)..
R=R1; Mimochromes peptide
Figure 4.1: Structure of Fe-mimochrome IV 8Glu, Fe-mimochrome IV 8Lys and Fe-mimochrome IV
The fully protected nonapeptide, except for the Lys residue, were synthesized by solid
phase methodology. After removal of the peptides from the resin and deprotection of the
Lys side chain, the peptide were coupled in solution to the porphyrin ring. Finally, the fully
deprotection of protected group gave the desired molecules.
Mimochrome Peptide sequence
8Glu Ac-Glu-Glu-Glu-Leu-His-Glu-Glu-Lys-Arg-NH2
8Lys Ac-Glu-Lys-Lys-Leu-His-Lys-Lys-Lys-Arg-NH2
IV Ac-Glu-Ser-Gln-Leu-His-Ser-Asn-Lys-Arg-NH2
1

33
NH
N NH
N
O ON N
NH2
Arg-(Pbf) Lys- Asn-(Trt) Ser-(tBu) His-(Trt) Leu Gln-(Trt) Ser-(tBu) Glu-(otBu) Ac
NH2
Arg-(Pbf) -Lys Asn-(Trt) Ser-(tBu) His-(Trt) Leu Gln-(Trt) Ser-(tBu) Glu-(otBu) Ac
-Arg(Pbf)-Lys(Mmt)-Asn(Trt)-Ser(tBu)-His(Trt)-Leu-Gln(Trt)-Ser(tBu)-Glu(otBu)-Ac
Sieber
Amide
Resin
Ac. Acetic/TFE/DCM (1/2/7 v/v )
Mmt
-Arg(Pbf)-Lys-Asn(Trt)-Ser(tBu)-His(Trt)-Leu-Gln(Trt)-Ser(tBu)-Glu(otBu)-Ac
Sieber
Amide
Resin
NH2 1% TFA/DCM
NH2-Arg(Pbf)-Lys-Asn(Trt)-Ser(tBu)-His(Trt)-Leu-Gln(Trt)-Ser(tBu)-Glu(otBu)-Ac
NH2
HATU/DIEA pH 7-8
NH2
Arg-(Pbf) Lys- Asn-(Trt) Ser-(tBu) His-(Trt) Leu Gln-(Trt) Ser-(tBu) Glu-(otBu) Ac
NH2
NH
N NH
N
OOH O OH
Deuteroporphyrin IX
Mmt Deprotection
Resin Cleavage
fully protected mimochrome IV
Sieber Resin
Solid Phase Synthesis on Sieber Amide Resin
Coupling

34
Scheme 1: General synthetic procedure for the synthesis of Mimochrome IV
Fe(CH3COOH)2/TFE 6/4 v/v
N
N N
N
ON O N
Fe3+
ArgGluAsnNH
Arg
Lys
Asn
Ser
His
Gln
Ser
Glu
Ac
NH2
ArgLyAsnSerHisGlnSerGluAc
Arg
Lys
Asn
Ser
His
Gln
Ser
Glu
Ac
NH2
LeuLeu
FeIII
-Mimochrome IV
NH
N NH
N
ON O N
ArgGluAsnNH
Arg
Lys
Asn
Ser
His
Gln
Ser
Glu
Ac
NH2
ArgLyAsnSerHisGlnSerGluAc
Arg
Lys
Asn
Ser
His
Gln
Ser
Glu
Ac
NH2
LeuLeu
Mimochrome IV
fully protected mimochrome IV
95% TFA/EDT/TIS
Final Deprotection
Iron Insertion

35
O
NH
O
O
O
4.2 Peptides synthesis
The following peptides were synthesized:
Mimochrome IV : Ac-Glu1-Ser2-Gln3-Leu4-His5-Ser6-Asn7-Lys8-Arg9-NH2
Mimochrome IV 8Glu : Ac-Glu1-Glu2-Glu3-Leu4-His5-Glu6-Glu7-Lys8-Arg9-NH2
Mimochorme IV 8Lys : Ac-Glu1-Lys2-Lys3-Leu4-His5-Lys6-Lys7-Lys8-Arg9-NH2
The peptides synthesis protocol was:
1) Automatic peptide synthesis, characterized by the following steps:
• Deprotection of the α- Fmoc group
• α-carboxyl group Activation
• Coupling
2) Deprotection of the Lys ε-amino group
3) Cleavage from the resin
The most difficult step of the mimochrome synthesis was the preparation of the
nonapeptide fragment, protected at all functional groups except the ε-amino function of the
Lys8 residue.
The Sieber amide resin (shown in figure 4.2) was chosen for all three synthesized peptides,
because it allows the cleavage of the peptide from the resin while leaving all protecting
groups on the side-chains, as well as on the N-terminal residue, intact.
Figure 4.2: Sieber amide resin

36
O NH
O
COOH
NH
MeO
Another fundamental point was the choice of the protecting group on N-ε function of the
Lys8, since its removal conditions had to be different than for the other side chain
protecting groups. The Mmt protecting group (figure 4.3) was chosen, since it can be easily
removed by repeated treatments with a solution containing 10% acetic acid and 20%
trifluoroethanol (TFE) (v/v) in CH2Cl2, without affecting the other protecting groups.
Figure 4.3: Fmoc-Lys(Mmt)-OH
For the synthesis of the three peptides the following amino acids were used:
Mimochrome IV: Fmoc-Glu(OtBu)-OH, Fmoc-Ser(tBu)-OH, Fmoc-Gln(Trt), Fmoc-Leu-
OH, Fmoc-His(Trt)-OH, Fmoc-Asn(Trt)-OH, Fmoc-Lys(Mmt)-OH, Fmoc-Arg(Pbf)-OH
Mimochrome IV 8Glu : Fmoc-Glu(OtBu)-OH, Fmoc-Leu-OH, Fmoc-His(Trt)-OH, Fmoc-
Lys(Mmt)-OH, Fmoc-Arg(Pbf)-OH
Mimochrome IV 8Lys : Fmoc-Glu(OtBu)-OH, Fmoc-Lys(Boc)-OH, Fmoc-Leu-OH, Fmoc-
His(Trt)-OH, Fmoc-Lys(Mmt)-OH, Fmoc-Arg(Pbf)-OH
The three peptides were synthesized on a 0.25 mmol scale, using a 0.52 mmol/g resin
substitution. After cleavage of the resin, the products were purified to homogeneity by RP-
HPLC.
37
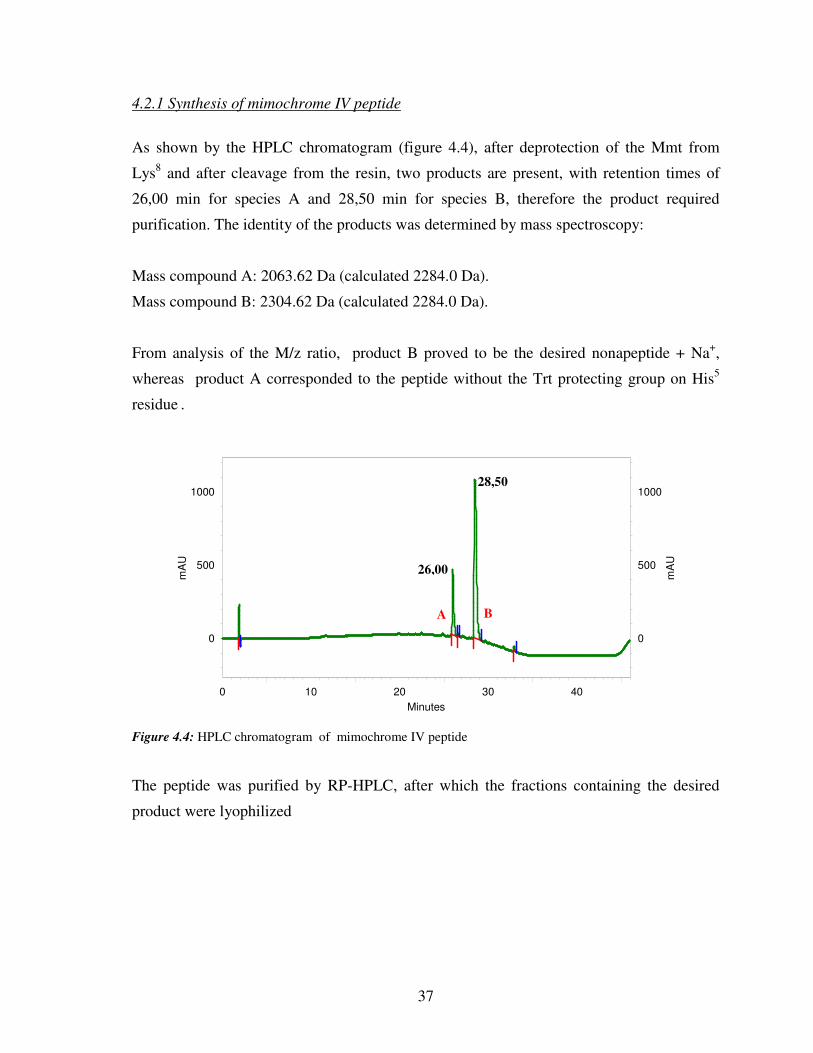
4.2.1 Synthesis of mimochrome IV peptide
As shown by the HPLC chromatogram (figure 4.4), after deprotection of the Mmt from
Lys8 and after cleavage from the resin, two products are present, with retention times of
26,00 min for species A and 28,50 min for species B, therefore the product required
purification. The identity of the products was determined by mass spectroscopy:
Mass compound A: 2063.62 Da (calculated 2284.0 Da).
Mass compound B: 2304.62 Da (calculated 2284.0 Da).
From analysis of the M/z ratio, product B proved to be the desired nonapeptide + Na+,
whereas product A corresponded to the peptide without the Trt protecting group on His5
residue .
Figure 4.4: HPLC chromatogram of mimochrome IV peptide
The peptide was purified by RP-HPLC, after which the fractions containing the desired
product were lyophilized
Minutes
0 10 20 30 40
mA
U
0
500
1000
mA
U
0
500
1000
A B
26,00
28,50

38
4.2.2 Synthesis of mimochrome IV 8Glu peptide
As shown by the HPLC chromatogram (figure 4.5), after deprotection of the Mmt from the
Lys8 and after cleavage from the resin, there are two main products with retention times of
13,40 min for species A and 19,34 for species B, therefore also in this case the product
required purification. As for mimochrome IV, the identity of the products was determined
by mass spectroscopy:
Mass compound A: 1793 (calculated 2014.0 Da).
Mass compound B: 2036 Da (calculated 2014.0 Da).
From the analysis of M/z ratio, product B, as expected, was the fully protected nonapeptide,
+ Na+ , with only Lys8 residue deprotected. Product A, again, corresponded to the fully
protected nonapeptide + Na+, except for the His5 and Lys8 residue.
Figure 4.5: HPLC chromatogram of mimochrome IV 8Glu peptide
The product was purified by RP-HPLC, after which the fractions containing the desired
product were lyophilized.
B A
19,34
13,40
Minutes
0 10 20 30 40
mA
U
-250
0
250
500
mA
U
-250
0
250
500

39
Minutes
0 10 20 30 40
mA
U
-200
0
200
mA
U
-200
0
200
4.2.3 Synthesis of mimochrome 8Lys peptide
As shown by the HPLC chromatogram (figure 4.6), after deprotection of the Mmt from
Lys8 and after cleavage from the resin, there is one main product, with a retention time of
25,90 min. The identity of the products was determined by mass spectroscopy. No further
purification was required.
Mass compound A: 2211 Da (calculated 2190 Da).
From the analysis of M/z ratio, product A, as expected, was the fully protected nonapeptide
+ Na+, with only Lys8 residue deprotected.
Figure 4.6: HPLC chromatogram of mimochrome IV 8Lys peptide
A
25,90

40
4.3 Peptide-deuteroporphyrin coupling
The purified fully protected nonapeptides were coupled in solution to the deuteroporphyrin
ring. In order to favour the formation of the bis sostituited deuteroporphyrin IX, the mixture
of activated porphyrin was slowly added to the nonapeptide solution. This approach has
lead to a good average yield for all mimochromes.
4.3.1 Coupling of mimochrome IV
As shown by the HPLC chromatogram (figure 4.7), after the coupling reaction and the
subsequent complete deprotection of the side chain protecting groups, there is one main
product with retention time of 20,03 min.
The identity of the product was checked by mass spectroscopy (figure 4.8), which
confirmed the product to be mimochrome IV (mass: 2753,26, calculated 2753,57).
Mimochrome IV was purified by HPLC. The pooled fractions containing the desired
product were lyophilized
Figure 4.7: HPLC chromatogram of pure mimochrome IV free base
21,18
Minutes 10 15 20 25 30 35 40 45
mA
U
0
25
50
75
20,03

41
Minutes
10 20 30 40
mA
U
-50
0
50
100
2402 2650 2898 3146
Mass (m/z)
0
2.4E+4
2154
20
40
60
80
100
% In
ten
sit
y
2753
Figure 4.8: Mass spectrum of mimochrome IV free base
4.3.2 Coupling mimochrome IV 8Glu
As for mimochrome IV, after coupling and deprotection by protecting groups, the HPLC
chromatogram (figure 4.9) confirmed the presence of a main peak with a retention time of
21,94 min. Mass spectroscopy (figure 4.10) confirmed the product to be mimochrome IV
8Glu (mass: 2953 Da, calculated 2953 Da).
Mimochrome IV 8Glu was purified with HPLC, the pooled fractions containing the desired
product were lyophilized.
Figure 4.9: HPLC chromatogram of pure mimochrome IV 8Glu free base
21,94

42
Minutes
10 20 30 40
mA
U
0
50
100
2953
1635.0 2271.8 2908.6 3545.4 4182.2
Mass (m/z)
0
7491.5
20
40
60
80
100
% In
ten
sit
y
Figure 4.10: Mass spectrum of mimochrome IV 8Glu free base
4.3.3 Coupling mimochrome IV 8Lys
The same coupling procedure was also applied to Mimochrome IV 8Lys, which produced
the same positive results as the others mimochromes. The HPLC chromatogram after
deprotection (figure 4.11) of the side chain protecting groups showed one main peak, with
retention time of 19,90 min. The identity of mimochrome IV 8Lys was confirmed by mass
spectroscopy (mass 2948.26 Da, calculated 2948 Da) (figure 4.12). The product was
purified by HPLC and lyophilized.
Figure 4.11: HPLC chromatogram of pure mimochrome IV 8Lys free base
19,90

43
Mass (m/z)
2082.0 2476.4 2870.8 3265.2 3659.60
2659.8
20
40
60
80
100
% In
ten
sit
y
Figure 4.12: Mass spectrum of mimochrome IV 8Lys free base
4.4 Iron insertion into mimochromes
Basically, the reaction between the metal ion and a porphyrinic compound consists of a) the
formation of the equatorial MN4 plane; and b) the completion of the axial coordination
sphere. However, certain considerations have to be made concerning the metalation
procedure:
1. The solvent for the reaction should be able to dissolve the porphyrin as well as the
metal compound, but without coordinating the metal ion with high affinity in order
to avoid competition with the porphyrin.
2. The porphyrin has to be deprotonated in order to produce the negative P2- ion that is
present in the metal-porphyrin complex. The presence of strong acids in the reaction
media will impede or even reverse metalation by shifting the protonation/
deprotonation equilibrium to the left.
3. To be able to react with the porphyrin macrocycle, the metal compound which
carries the metal ion should dissociate, yielding an active (coordinatively
unsaturated) species. Therefore, the metal complex should not be too stable
2945
H4(P)2+
H3(P)+ H2(P) H(P)
– (P)
2–

44
otherwise it will not react with the porphyrin present in the reaction mixture. Other
considerations are the availability, ease of handling, and solubility of the metal
complexes in organic solvents.
4. After the incorporation of a metal ion with a positive charge greater than +2, it will
bind one or more anions from the reaction medium to form a neutral species. Some
metal ions prefer certain defined geometries, which require the addition of a neutral
ligand (solvent, H2O, O2) to complete their coordination sphere.
The methods commonly used for the insertion of metal ions in the porphyrin macrocycle
are listed below. The systems are characterized either by the solvent or the metal carrier
used, depending on the more essential component. Since metalloporphyrins have
characteristic UV-VIS properties, the reaction is usually monitored by spectrophotometry.
The acetate method
Zn(OAc)2.xH2O + H2P Zn(P) + 2 HOAc + 2 H2O
The acetate method includes all metalation reactions in which the protons of the porphyrin
are transferred to acetate or propionate ions of the metal acetates/propionates. The solvents
can be glacial acetic acid, or mixtures of CHCl3/MeOH. This method can be applied to all
divalent metals, except those which are unstable in acetic acid, and to some tri- and
tetravalent metal ions. Often sodium acetate is added to further buffer the solution and to
enhance deprotonation of the porphyrins. This method is considered the method of choice
for the synthesis of manganese-porphyrin complexes.
The pyridine method
Mg(ClO4)2 + H2P + 4 Py Mg(P)Py2 + 2 [PyH][ClO4]
In those cases where the metalloporphyrin is very labile towards acids, the basic solvent
pyridine is used for divalent metal ions. Pyridine is capable of dissolving the porphyrins as
well as the metal salts, and the good complexing properties of pyridine allow the direct
isolation of metalloporphyrin pyridinates. The same properties, however, impede the
HOAc 50 ºC
Py

45
incorporation of metal ions with higher charges by forming pyridine complexes with the
metal carrier, thus retarding the dissociation of the metal ion.
The dimethylformamide method
4 CrCl4 + 4 H2P + O2 4 Cr(P)Cl + 2 H2O + 4 HCl
Weakly coordinating, high boiling oxygen-donor solvents such as dimethylformamide,
tetramethylurea and sulfolan are excellent solvents for the metal carriers and porphyrins.
The best results have been obtained with anhydrous metal chlorides (although they can be
difficult to obtain and to handle), as the high boiling temperature forces the formed HCl to
escape.
The metal carbonyl method
Re2(CO)10 + H2P [Re(CO)3]2(P) + H2 + 4 CO
In metal carbonyls some of the CO groups may be eliminated, resulting in a coordinatively
unsaturated species. This species acts as a Lewis acid, attacking the lone pairs of the
porphyrin nitrogen atoms. This method is especially useful for the preparation of
porphyrins containing the metals of groups VI to VIII.
For the insertion of iron into mimochrome, the acetate method was used. The reaction took
place in a 60/40 (v/v) solution of acetic acid and TFE, using iron(II) acetate as metal
carrier. Upon insertion of the metal in the porphyrin ring, the Fe(II) ion was oxidized to
Fe(III). During the reaction, the colour of the reaction mixture changed from red to brown,
indicating the formation of the Fe(III) porphyrin complex. The reaction was monitored by
HPLC and UV-vis spectroscopy.
DMF 153 ºC
decalin 195 ºC

46
2262.0 2482.8 2703.6 2924.4 3145.2 3366.0
Mass (m/z)
0
2144.8
20
40
60
80
100
% In
ten
sit
y
4.4.1 Synthesis of Fe(III) mimochrome IV
After two hours the reaction mixture turned slowly brown, and the HPLC chromatogram
showed the presence of a new peak at 19.79 min with the characteristic UV spectrum of
Fe(III) mimochrome (figure 4.13). The mass spectrum confirmed (figure 4.14) the identity
of the desired product: 2805 Da (calculated 2806.0 Da).
Figure 4.13: HPLC chromatogram and UV-vis spectra, at pH ≈ 1, of mimochrome IV free base (a) and
Fe(III) mimochrome IV (b).
Figure 4.14: Mass spectrum of Fe(III) mimochrome IV
Minutes
λ/nm 300 400 500 600
0
50
100
150
450 550 650
0
7,5
λ/nm
mA
U
mA
U 387
19,79
19,0 19,5 20,0 20,5 21,0 21,5
0
100
200
mA
U
=210nm =400nm
20,03 (a)
18 19 20 21 22
mAU
0
100
200
mA
U
=210nm =387nm
19,79
Minutes
(b)
(b)
λ/nm 300 400 500 600
0
100
200
500 600
0
20 20,01 min
550 λ/nm
mA
U
mA
U 400
(a)
2808

47
2313.0 2603.8 2890.6 3127.4 3462.2 3750.0
Mass (m/z)
0
2161.9
20
40
60
80
100
% In
ten
sit
y
3006
4.4.2 Synthesis of Fe(III) mimochrome IV 8Glu
The formation of the Fe(III)-complex of mimochrome 8Glu was analogue to the synthesis
of Fe(III) mimochrome IV. The same colour change was observed and the HPLC
chromatogram showed the presence of a new peak at 21,20 min with the characteristic UV
spectrum of Fe(III) mimochrome (figure 4.15). The identity of the desired product was
confirmed by mass spectroscopy. (mass: 3008 Da; calculated; 3008 Da ) (figure 4.16).
Figure 4.15: HPLC chromatogram and UV-vis spectra, at pH ≈ 1, of mimochrome IV 8Glu free base (a) and
Fe(III) mimochrome IV 8Glu (b)
Figure 4.16: Mass spectrum of Fe(III) mimochrome IV 8Glu
20,0 21,0 22,0 23,0
mAU
0
200
400
Minutes
mA
U
=210nm =387nm
21,20 (b)
Minutes
21,0 22,0 23,0 24,0
mAU
0
20
40
60
mA
U
=210nm =400nm
21,94 (a)
λ/nm 450 650
0
15
300 400 500
0
200
400
λ/nm
500
mA
U
mA
U
387 (b)
300 400 500 600
0
100
200
λ/nm
0
10
500 550 600 λ/nm m
AU
mA
U 400 (a)
48
2313.0 2617.8 2922.6 3227.4 3532.2 3837.0 Mass (m/z)
0
1.1E+4
20
40
60
80
100
% In
ten
sit
y
2998
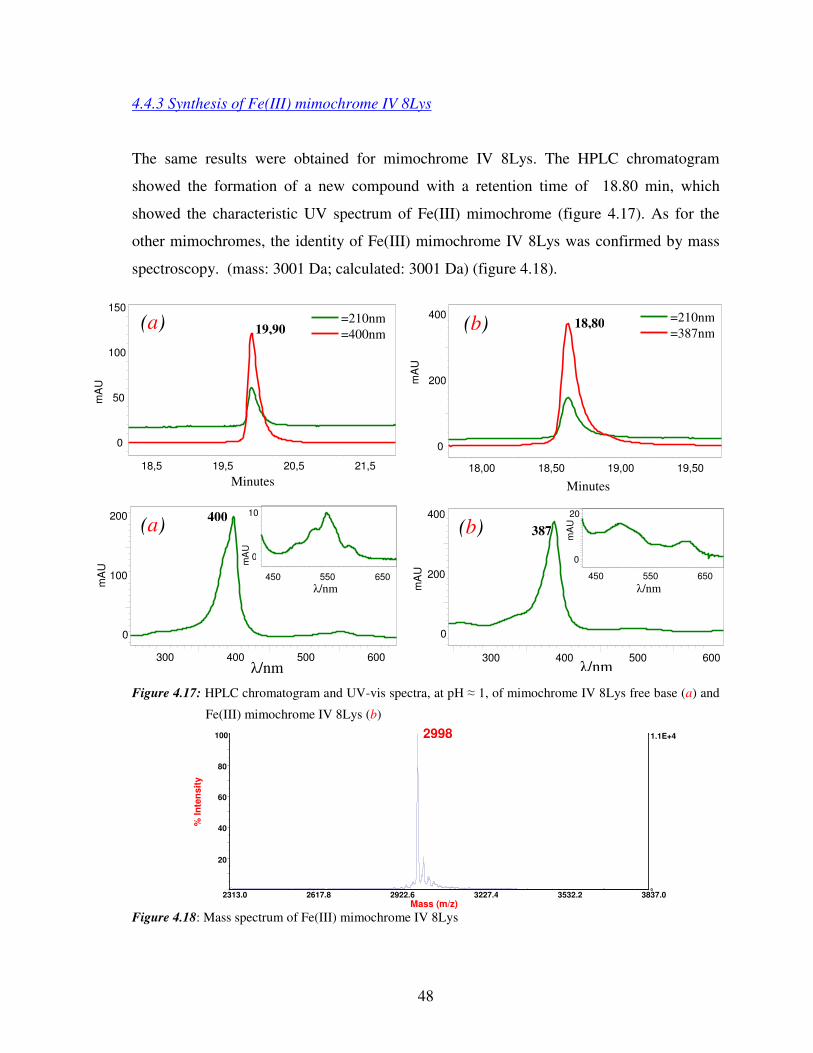
4.4.3 Synthesis of Fe(III) mimochrome IV 8Lys
The same results were obtained for mimochrome IV 8Lys. The HPLC chromatogram
showed the formation of a new compound with a retention time of 18.80 min, which
showed the characteristic UV spectrum of Fe(III) mimochrome (figure 4.17). As for the
other mimochromes, the identity of Fe(III) mimochrome IV 8Lys was confirmed by mass
spectroscopy. (mass: 3001 Da; calculated: 3001 Da) (figure 4.18).
Figure 4.17: HPLC chromatogram and UV-vis spectra, at pH ≈ 1, of mimochrome IV 8Lys free base (a) and
Fe(III) mimochrome IV 8Lys (b)
Figure 4.18: Mass spectrum of Fe(III) mimochrome IV 8Lys
Minutes 18,5 19,5 20,5 21,5
0
50
100
150
mA
U
=210nm =400nm 19,90 (a)
300 400 500 600
0
100
200
450 550 650 0
10
λ/nm
λ/nm mA
U
mA
U
400 (a)
300 400 500 600
0
200
400
450 550 650
0
20
λ/nm
λ/nm
mA
U
mA
U
387 (b)
Minutes 18,00 18,50 19,00 19,50
mAU
0
200
400 1: 210 nm, 8 nm
mA
U
=210nm =387nm
18,80 (b)

49
Chapter 5: Spectroscopic characterization of mimochromes
5.1 UV-vis spectroscopy of mimochromes
UV-vis spectroscopy was used to verify the metal insertion into the porphyrin ring, and to
determine the coordination geometry of the metal ion in both Fe(III) mimochrome IV 8Glu
and Fe(III) mimochrome IV 8Lys.
5.1.1 UV-vis spectroscopy of Fe(III) mimochrome IV 8Glu
Figure 5.1a and 5.1b shows the UV-vis spectrum of 3.05 x 10⁻⁵ M mimochrome IV 8Glu
free base, and 6.76 x 10⁻⁶ M Fe(III) mimochrome IV 8Glu, in 10 mM phosphate buffer
solution at pH 7, respectively. The observed spectral changes in both the Soret and visible
regions, upon reaction of the free-deuteroporphyrin peptide conjugate with the metal ions,
clearly denoted metal insertion into mimochrome IV 8Glu. The position and the relative
intensities of the Soret, β and α bands give useful information on the metal ion coordination
state76,95. The iron derivative at pH 7, is characterized by a band at 401 (ε = 9.67 x 10⁴
M-1cm-1), by a band at 522 nm (ε = 6.18 x 10³ M-1cm-1) and a shoulder at 560 nm. This is
an indication of a ferric low-spin state, with a bis-His axial coordination76, 95. All the
spectral data are very similar to those found for Fe(III) mimochrome IV110.
Table 5.1 reports the typical UV-vis parameters of Fe(III) mimochrome IV 8Glu and Fe(III)
mimochrome IV.
Table 5.1: Parameters are derived from the experimental UV-vis spectra recorded under the conditions
indicated in the experimental section. (a), Data taken from ref.110.
ε(Soret) M-1
cm-1
Soret (nm) ε(β) M-1
cm-1
β and α (nm) Fe(III)-mimochromeIV 8Glu 9.60 x 10⁴ 401 6.60 x 10³ 522 -560 Fe(III)-mimochrome IV
a 1.03 x 10⁵ 401 6.18 x 10³ 522 -560

50
Figure 5.1a: UV-vis spectrum of 3.05 x 10⁻⁵ M mimochrome IV 8Glu free base, in 10 mM phosphate buffer
at pH 7.
Figure 5.1b: UV-vis spectrum of 8.90 x 10⁻⁶ M Fe(III) mimochrome IV 8Glu, in 10 mM phosphate buffer
at pH 7.
Fe(III) mimochrome IV 8Glu
522
ε M
-1 c
m-1
x 1
0-3
ε
M-1
cm
-1x
10
-3 401
mimochrome IV 8Glu free base
396
ε M
-1 c
m-1
x 1
0-3
ε
M-1
cm
-1x
10
-3 396

51
5.1.2 UV-vis Fe(III) mimochrome IV 8Glu pH titrations
The pH effect on the properties of Fe(III) mimochrome IV 8Glu was examined in aqueous
solution by UV-vis spectroscopy. Figure 5.2 shows selected UV-vis spectra of Fe(III)
mimochrome IV 8Glu at different pH (from pH 2 to 8). At pH ≈ 2 the spectrum is
characterized by absorption maxima at 388, 494, 613 nm, for the Soret, β and α bands,
respectively. This spectrum is in agreement with a high spin state for Fe(III) axially
coordinated by two weak ligands (i.e., water molecules)95. In the pH range from 2 to 6 the
Soret band is red shifted from 388 to 401 nm, while the visible bands at 522 and 560 nm
appears with a simultaneous disappearance of the bands at 494 and 613 nm. At pH ≈ 8 the
spectrum is characterized by absorption maxima at 401, 522, 560 nm, thus indicating the
formation of a strong ligand field on the iron porphyrin, typical of a bis-His coordination.
The absence of an isosbestic point suggests that more species are involved in the
equilibrium.
Figure 5.2: UV-vis spectrum of 3.76 x 10⁻⁶ M Fe(III) mimochrome IV 8Glu, in the Soret and visible region,
at different pH (2-8).
401 388
ε M
-1 c
m-1
x 1
0-3
ε
M-1
cm
-1x
10
-3
494 522
560 613
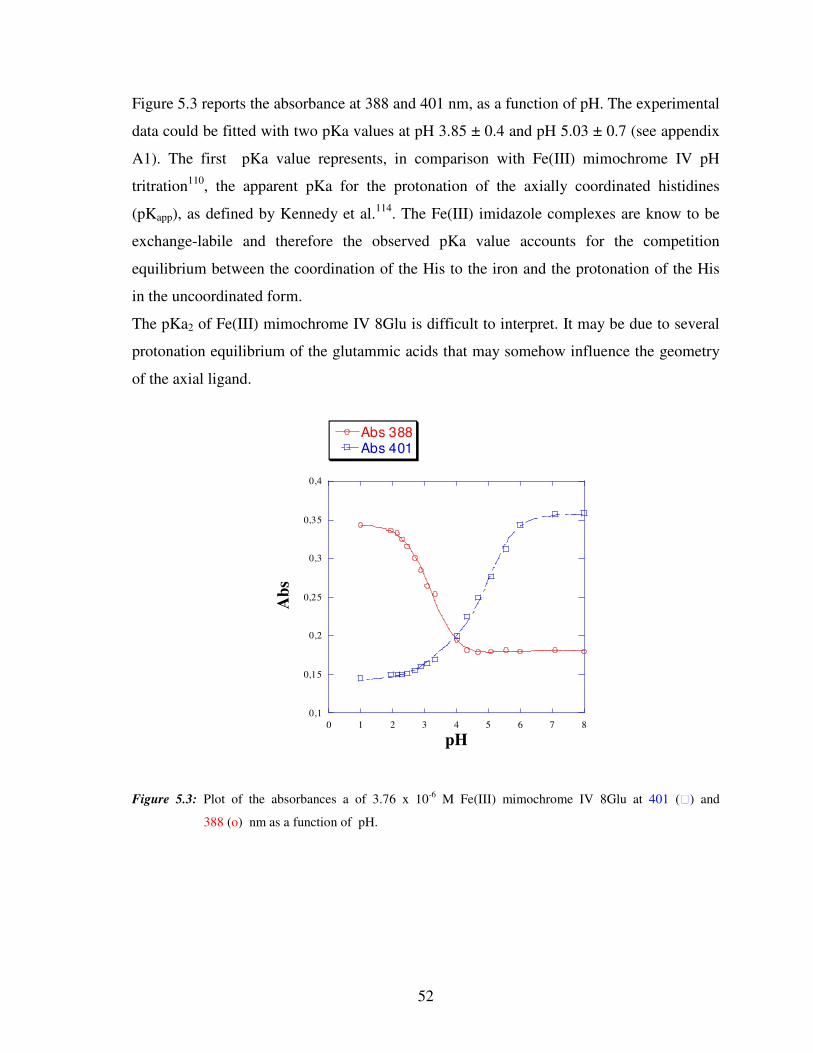
52
0,1
0,15
0,2
0,25
0,3
0,35
0,4
0 1 2 3 4 5 6 7 8
Abs 388Abs 401
Ab
s
pH
Figure 5.3 reports the absorbance at 388 and 401 nm, as a function of pH. The experimental
data could be fitted with two pKa values at pH 3.85 ± 0.4 and pH 5.03 ± 0.7 (see appendix
A1). The first pKa value represents, in comparison with Fe(III) mimochrome IV pH
tritration110, the apparent pKa for the protonation of the axially coordinated histidines
(pKapp), as defined by Kennedy et al.114. The Fe(III) imidazole complexes are know to be
exchange-labile and therefore the observed pKa value accounts for the competition
equilibrium between the coordination of the His to the iron and the protonation of the His
in the uncoordinated form.
The pKa2 of Fe(III) mimochrome IV 8Glu is difficult to interpret. It may be due to several
protonation equilibrium of the glutammic acids that may somehow influence the geometry
of the axial ligand.
Figure 5.3: Plot of the absorbances a of 3.76 x 10⁻⁶ M Fe(III) mimochrome IV 8Glu at 401 () and
388 (o) nm as a function of pH.

53
5.1.3 UV-vis spectroscopy of Fe(III) mimochrome IV 8Lys
Figure 5.4a and 5.4b shows the UV-vis spectrum of 2.23 x 10⁻⁵ M mimochrome IV 8Lys
free base and the UV-vis spectrum of 8.25 x 10⁻⁶ M Fe(III) mimochrome IV 8Lys, in
10 mM phosphate buffer solution at pH 7, respectively. The observed spectral changes in
both the Soret and visible regions, upon reaction of the free-deuteroporphyrin peptide
conjugate with the metal ions, clearly denoted metal insertion into mimochrome IV 8Lys.
The iron derivative at pH 7, is characterized by a band at 402 (ε = 1.01 x 10⁵ M-1cm-1), by a
band at 522 nm (ε = 6.60 x 10³ M-1cm-1) and a shoulder at 560 nm. This is an indication of
a ferric low-spin state, with a bis-His axial coordination76,95. All the spectral data are very
similar to those found for Fe(III) mimochrome IV110.
Table 5.2 reports the typical UV-vis parameters of Fe(III) mimochrome IV 8Lys and
Fe(III) mimochrome IV110.
Table 5.2: Parameters are derived from the experimental UV-vis spectra recorded under the conditions
indicated in the experimental section. (a), Data taken from ref.110.
ε(Soret) M-1
cm-1
Soret (nm) ε(β-band) M-1
cm-1
β and α (nm) Fe(III)-mimochromeIV 8Lys 1.01 x 10⁵ 402 6.60 x 10³ 522 -560 Fe(III)-mimochrome IV
a 1.03 x 10⁵ 401 6.18 x 10³ 522 -560

54
Figure 5.4a: UV-vis spectrum of 2.23 x 10⁻⁵ M mimochrome IV 8Lys free base, in 10 mM phosphate buffer
at pH 7.
Figure 5.4b: UV-vis spectrum of 8.25 x 10⁻⁶ M Fe(III) mimochrome IV 8Lys, in 10 mM phosphate buffer at
pH 7.
Fe(III) mimochrome IV 8Lys
402
ε M
-1 c
m-1
x 1
0-3
522
ε
M-1
cm
-1x
10
-3
mimochrome IV 8Lys free base
397
ε
M-1
cm
-1x
10
-3
ε M
-1 c
m-1
x 1
0-3
397
ε
M-1
cm
-1x
10
-3
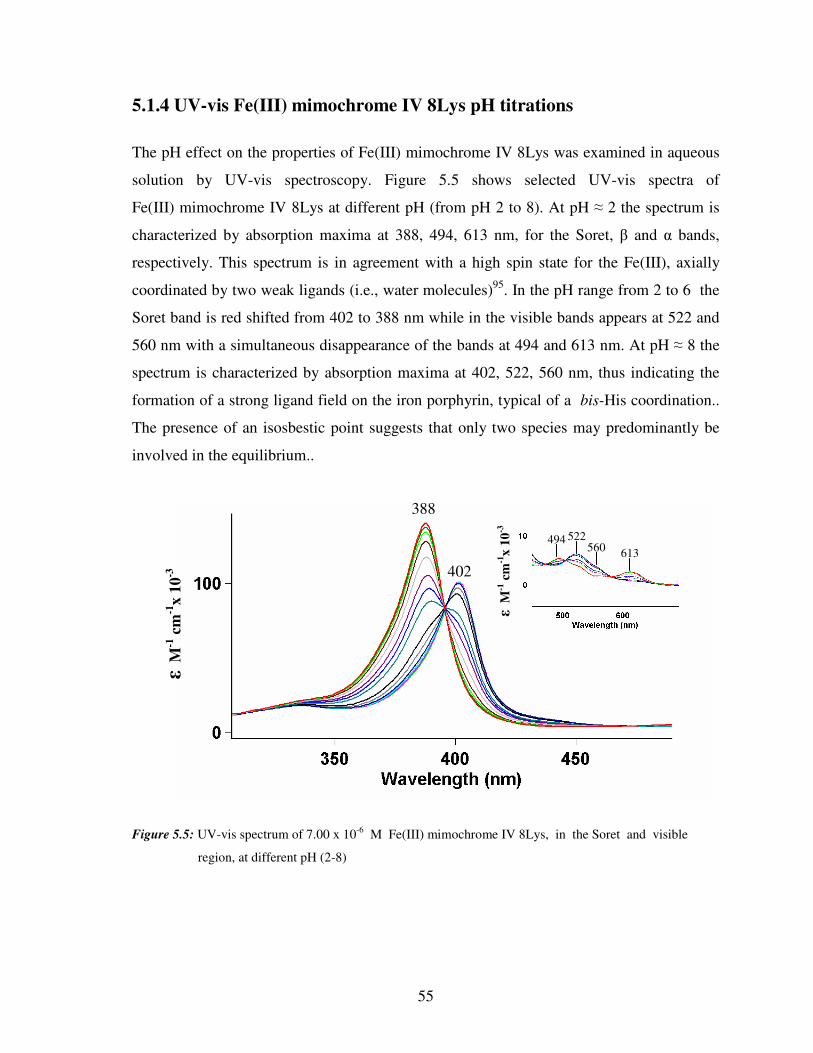
55
5.1.4 UV-vis Fe(III) mimochrome IV 8Lys pH titrations
The pH effect on the properties of Fe(III) mimochrome IV 8Lys was examined in aqueous
solution by UV-vis spectroscopy. Figure 5.5 shows selected UV-vis spectra of
Fe(III) mimochrome IV 8Lys at different pH (from pH 2 to 8). At pH ≈ 2 the spectrum is
characterized by absorption maxima at 388, 494, 613 nm, for the Soret, β and α bands,
respectively. This spectrum is in agreement with a high spin state for the Fe(III), axially
coordinated by two weak ligands (i.e., water molecules)95. In the pH range from 2 to 6 the
Soret band is red shifted from 402 to 388 nm while in the visible bands appears at 522 and
560 nm with a simultaneous disappearance of the bands at 494 and 613 nm. At pH ≈ 8 the
spectrum is characterized by absorption maxima at 402, 522, 560 nm, thus indicating the
formation of a strong ligand field on the iron porphyrin, typical of a bis-His coordination..
The presence of an isosbestic point suggests that only two species may predominantly be
involved in the equilibrium..
Figure 5.5: UV-vis spectrum of 7.00 x 10⁻⁶ M Fe(III) mimochrome IV 8Lys, in the Soret and visible
region, at different pH (2-8)
ε M
-1 c
m-1
x 1
0-3
ε
M-1
cm
-1x
10
-3
494 522 560 613
402
388

56
0,2
0,4
0,6
0,8
1
1,5 2 2,5 3 3,5 4 4,5
Abs 402nmAbs 388nm
Ab
s
pH
Figure 5.6 reports the absorbance values at 402 and 388 nm, as a function of pH. Both
titration curves exhibit one midpoint at pH 2.63 ± 0.03 (see appendix A2). The pKa value
represents, in comparation with Fe(III) mimochrome IV pH titration110, the apparent pKa
for the protonation of the axially coordinated histidines (pKapp), as defined by Kennedy et
al.114, similarly to what found for the first pKa of Fe(III) mimochrome IV 8Glu
Figure 5.6: plot of the absorbance of 7.00 x 10⁻⁶ M Fe(III) mimochrome IV 8Lys, at 402 () and
388 (o) nm, as a function of the pH.

57
5.2 Circular dichroism spectroscopy of mimochromes
CD measurements in both the UV and Soret regions gave preliminary structural
information on Fe(III) mimochrome IV 8Glu and Fe(III) mimochrome IV 8Lys. CD spectra
for all the mimochromes were recorded in both far-UV and Soret regions, using a
trifluoroethanol (TFE) /water solution as solvent.
5.2.1 Circular dichroism spectroscopy of Fe(III) mimochrome IV 8Glu
The 190–260 nm spectrum of Fe(III) mimochrome IV 8Glu in 10mM phosphate buffer at
pH 7 (solid red line in figure 5.7) is characterized by double minima at 222 and 203 nm and
a maximum below 190 nm. The [θ] value at 222 nm, the [θ]ratio and the λο indicate the
presence of a low helical content.
Figure 5.7: CD spectra of 5.36 x 10⁻⁶ M Fe(III) mimochrome IV 8Glu in the far-UV region, phosphate buffer
(10 mM, pH 7.0) with 0%, 15%, 30% TFE content.
-20
20
-10
0
10
260 200 220 240
Wavelenght [nm]
[θ[θ [θ[θ]
/ d
eg c
m2 d
mol-1
res
-1
x 1
0-3
0% TFE
30% TFE
15% TFE

58
2
3
4
5
6
7
0 10 20 30 40 50
-(θθ θθ
) 22
2/deg c
m2 d
mol-1
res
-1 x
10
-3
%TFE
The addition of the structure inducing solvent TFE results in an small increase of the helical
content for both species as expected.
Figure 5.8: Plot of the [θ] value at 222 nm for Fe(III) mimochrome IV 8Glu as a function of the TFE
concentration .
Table 5.3: CD parameters of Fe(III) mimochrome IV 8Glu and Fe(III) mimochrome IV, in 30%
TFE/phosphate buffer (10mM, pH 7.0). [a], [θ] are expressed as mean residue ellipticities
(deg cm2dmol-1 res-1) in the UV region; λ is expressed in nm; [θ]min represents the ellipticity at
the shorter wavelength minimum; [θ]ratio represents the ratio of the ellipticity at 222 nm to that
at the shorter wavelength minimum. [b] Data taken from ref.110.
Species
[θ]min x10-3(a)
(λ, nm)
[θ]222 x10-3
[θ]ratio(a) λ0(nm)
Fe(III)-Mimochrome IVb -11,20 (207) -9,54 0,85 200,1
Fe(III)-Mimochrome IV 8Glu -16,55 (204) -5,76 0,35 195,8

59
-30
14
0
5
10
360 440380 400 420
[θ[θ [θ[θ]
/ d
eg c
m2 d
mol-1
x 1
0-3
Wavelength [nm]
The CD spectrum of Fe(III) mimochrome IV 8Glu was also recorded in the Soret region
(Figure 5.9). It is characterized by the presence of a positive Cotton effect in the Soret
region, with a maximum at 395 nm. We hypothesize that Fe(III) mimochrome IV 8Glu
adopts a Λ configuration on the basis of the CD spectrum of Fe(III) mimochrome IV110.
Figure 5.9: CD spectrum of 5.36 x 10⁻⁶ M Fe(III) mimochrome IV 8Glu in the Soret region (phosphate
buffer 10 mM, pH 7.0).

60
5.2.2 Circular dichroism pH titration of Fe(III) mimochrome IV 8Glu
We studied the effect of pH (from 2 to 8) on the secondary structure of Fe(III) mimochrome
IV 8Glu (see figure 5.10). Figure 5.11 reports the plot of the 222 nm band intensity as a
function of pH. The intensity of the [θ] value at 222 nm increases by raising the pH, with a
midpoint transition at pH 5.6. This value is close to the second midpoint transition
observed in the UV-vis titration (pKa2= 5.03).
Figure 5.10 : CD spectra of 6,82 x10⁻⁶ M Fe(III) mimochrome IV 8Glu in the far-UV region at pH 7.80
(solid red line) and pH 3.60 (solid green line).
-30
30
-20
0
20
260 200 220 240
pH 7,80
pH 3,60
10
-10
[θ[θ [θ[θ]
/ d
eg c
m2 d
mol-1
res
-1
x 1
0-3
Wavelenght [nm]

61
6
7
8
9
10
11
2 3 4 5 6 7 8
−(θ
)−
(θ)
−(θ
)−
(θ)
222/d
eg c
m-2
dm
ol-1
res
-1 x
10
-3
pH
Figure 5.11: Plot of the [θ] value at 222 nm, for 6,82 x10⁻⁶ M Fe(III) mimochrome IV 8Glu, as a function of
the pH.
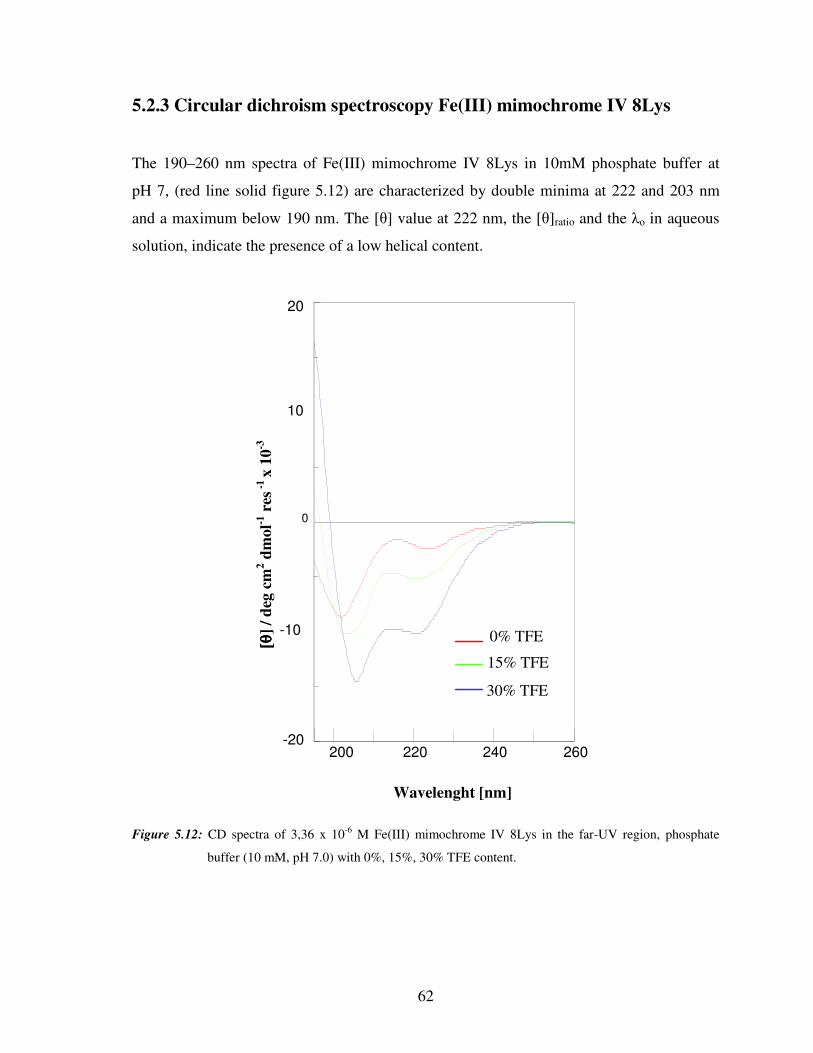
62
5.2.3 Circular dichroism spectroscopy Fe(III) mimochrome IV 8Lys
The 190–260 nm spectra of Fe(III) mimochrome IV 8Lys in 10mM phosphate buffer at
pH 7, (red line solid figure 5.12) are characterized by double minima at 222 and 203 nm
and a maximum below 190 nm. The [θ] value at 222 nm, the [θ]ratio and the λο in aqueous
solution, indicate the presence of a low helical content.
Figure 5.12: CD spectra of 3,36 x 10⁻⁶ M Fe(III) mimochrome IV 8Lys in the far-UV region, phosphate
buffer (10 mM, pH 7.0) with 0%, 15%, 30% TFE content.
-20
20
-10
0
10
260 200 220 240
Wavelenght [nm]
[θ[θ [θ[θ]
/ d
eg c
m2 d
mol-1
res
-1
x 1
0-3
0% TFE
30% TFE
15% TFE
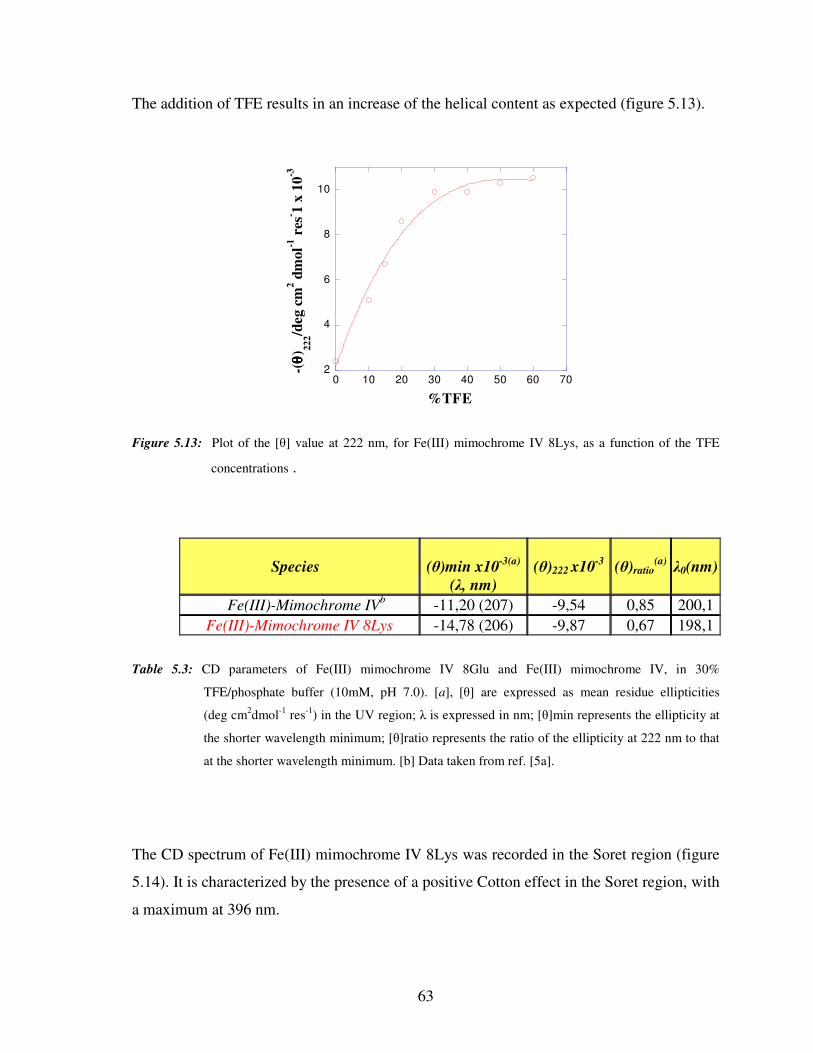
63
2
4
6
8
10
0 10 20 30 40 50 60 70
-(θθ θθ
) 22
2/d
eg
cm
2 d
mo
l-1 r
es- 1
x 1
0-3
%TFE
The addition of TFE results in an increase of the helical content as expected (figure 5.13).
Figure 5.13: Plot of the [θ] value at 222 nm, for Fe(III) mimochrome IV 8Lys, as a function of the TFE
concentrations .
Table 5.3: CD parameters of Fe(III) mimochrome IV 8Glu and Fe(III) mimochrome IV, in 30%
TFE/phosphate buffer (10mM, pH 7.0). [a], [θ] are expressed as mean residue ellipticities
(deg cm2dmol-1 res-1) in the UV region; λ is expressed in nm; [θ]min represents the ellipticity at
the shorter wavelength minimum; [θ]ratio represents the ratio of the ellipticity at 222 nm to that
at the shorter wavelength minimum. [b] Data taken from ref. [5a].
The CD spectrum of Fe(III) mimochrome IV 8Lys was recorded in the Soret region (figure
5.14). It is characterized by the presence of a positive Cotton effect in the Soret region, with
a maximum at 396 nm.
Species
(θ)min x10-3(a)
(λ, nm)
(θ)222 x10-3
(θ)ratio(a) λ0(nm)
Fe(III)-Mimochrome IVb -11,20 (207) -9,54 0,85 200,1
Fe(III)-Mimochrome IV 8Lys -14,78 (206) -9,87 0,67 198,1

64
Wavelenght [nm]
27
0
10
20
360
380 400 420
[θ[θ [θ[θ]
/ d
eg c
m2 d
mol-1
10
-3
We hypothesize that Fe(III) mimochrome IV 8Glu adopts a Λ configuration on the basis of
the CD spectrum Fe(III) mimochrome IV110.
Figure 5.14: CD spectrum of 3.36 x 10⁻⁶ M Fe(III) mimochrome IV 8Glu in the Soret region. (phosphate
buffer 10 mM, pH 7.0).
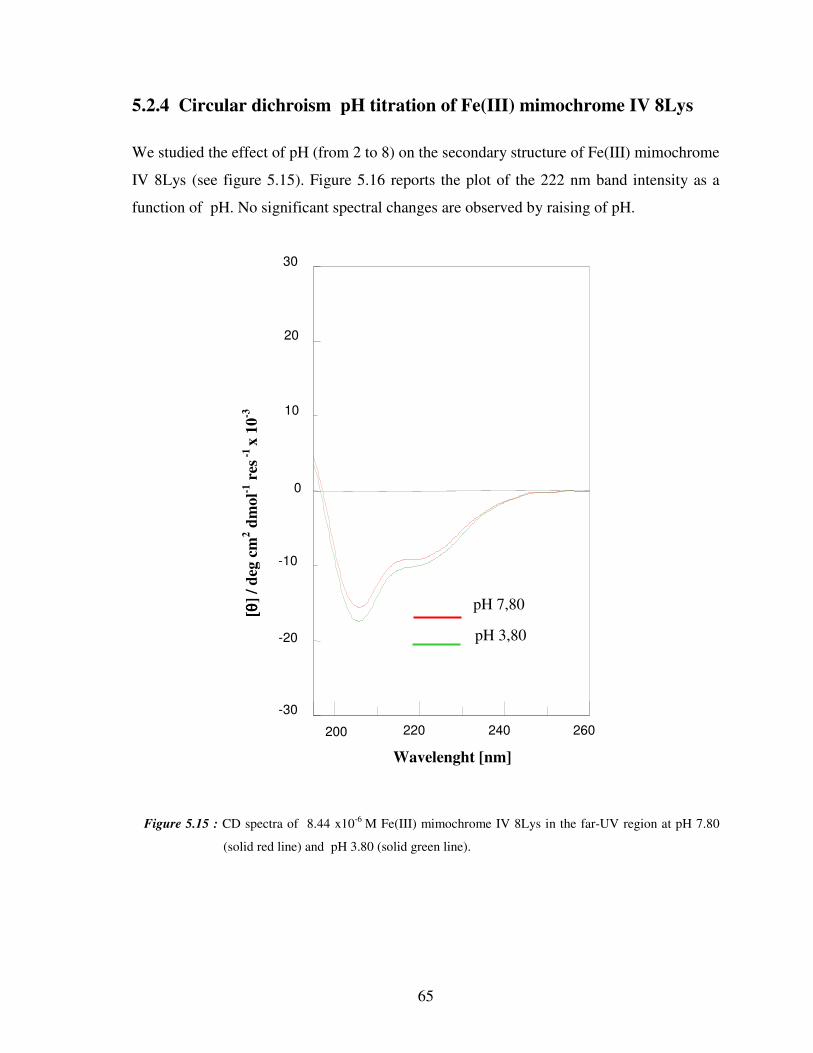
65
5.2.4 Circular dichroism pH titration of Fe(III) mimochrome IV 8Lys
We studied the effect of pH (from 2 to 8) on the secondary structure of Fe(III) mimochrome
IV 8Lys (see figure 5.15). Figure 5.16 reports the plot of the 222 nm band intensity as a
function of pH. No significant spectral changes are observed by raising of pH.
Figure 5.15 : CD spectra of 8.44 x10⁻⁶ M Fe(III) mimochrome IV 8Lys in the far-UV region at pH 7.80
(solid red line) and pH 3.80 (solid green line).
-30
30
-20
0
20
260 200 220 240
pH 7,80
pH 3,80
10
-10
[θ[θ [θ[θ]
/ d
eg c
m2 d
mol-1
res
-1
x 1
0-3
Wavelenght [nm]

66
Figure 5.16 : Plot of the 222 nm band intensity, for 8.44 x 10⁻⁶ M Fe(III) mimochrome IV 8Lys, as a
function of the pH
6
7
8
9
10
11
2 3 4 5 6 7 8-(θθ θθ
) 222/
deg c
m2 d
mo
l-1 r
es-1
x 1
0-3
pH
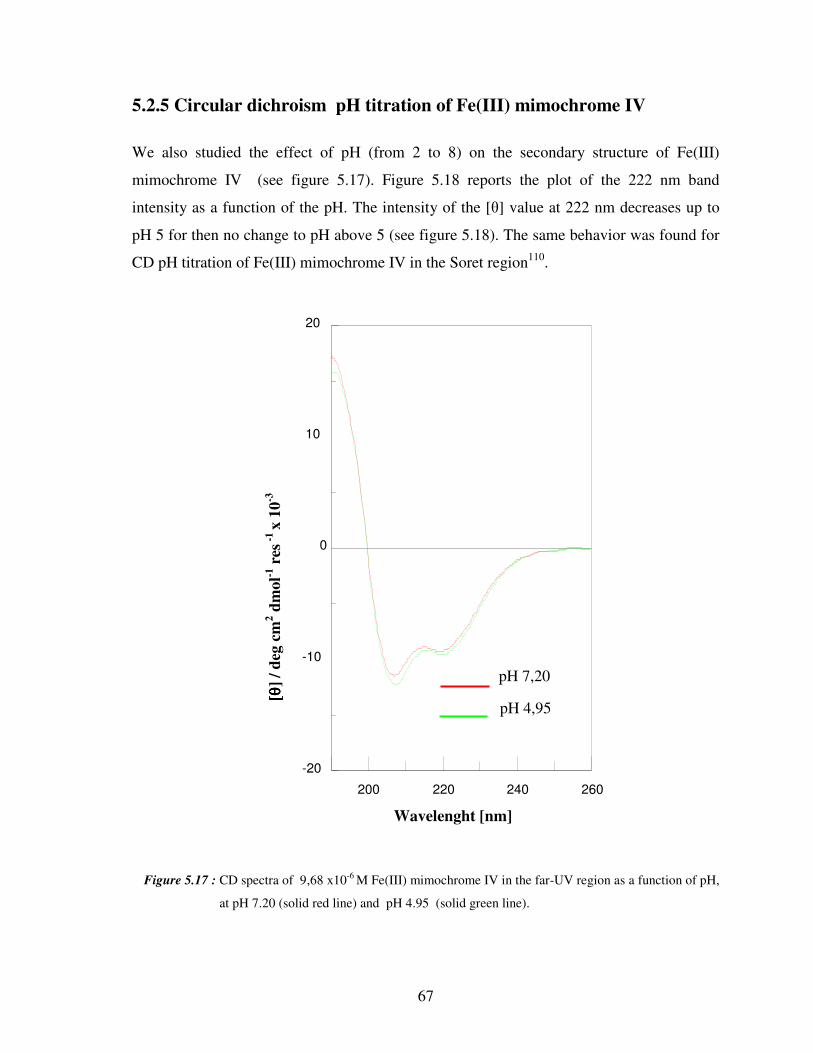
67
5.2.5 Circular dichroism pH titration of Fe(III) mimochrome IV
We also studied the effect of pH (from 2 to 8) on the secondary structure of Fe(III)
mimochrome IV (see figure 5.17). Figure 5.18 reports the plot of the 222 nm band
intensity as a function of the pH. The intensity of the [θ] value at 222 nm decreases up to
pH 5 for then no change to pH above 5 (see figure 5.18). The same behavior was found for
CD pH titration of Fe(III) mimochrome IV in the Soret region110.
Figure 5.17 : CD spectra of 9,68 x10⁻⁶ M Fe(III) mimochrome IV in the far-UV region as a function of pH,
at pH 7.20 (solid red line) and pH 4.95 (solid green line).
-20
20
-10
0
10
260 200 220 240
[θ[θ [θ[θ]
/ d
eg c
m2 d
mol-1
res
-1
x 1
0-3
Wavelenght [nm]
pH 7,20
pH 4,95

68
4
5
6
7
8
9
10
1 2 3 4 5 6 7 8 9
-(θθ θθ
) 22
2/
deg c
m-2
dm
ol-1
res
-1x10
-3
pH
Figure 5.18: Plot of the 222 nm band intensity, for 9.68 x 10⁻⁶ M Fe(III) mimochrome IV, as a function of
the pH.
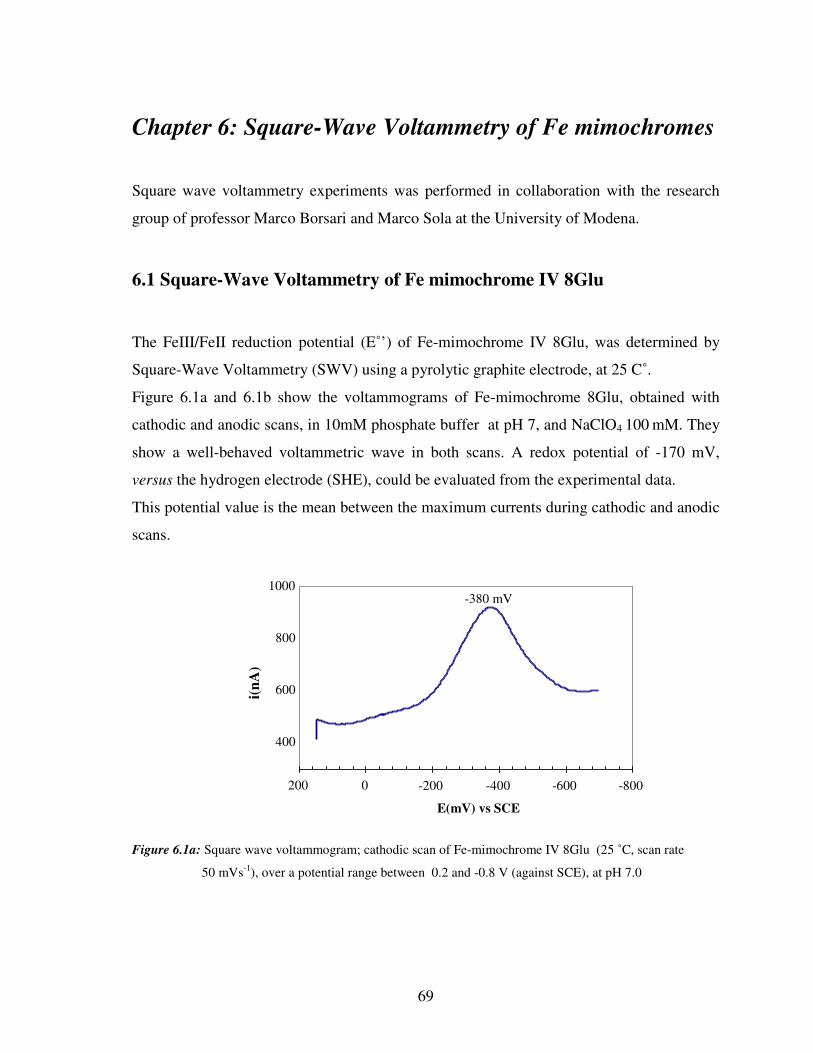
69
Chapter 6: Square-Wave Voltammetry of Fe mimochromes
Square wave voltammetry experiments was performed in collaboration with the research
group of professor Marco Borsari and Marco Sola at the University of Modena.
6.1 Square-Wave Voltammetry of Fe mimochrome IV 8Glu
The FeIII/FeII reduction potential (E˚’) of Fe-mimochrome IV 8Glu, was determined by
Square-Wave Voltammetry (SWV) using a pyrolytic graphite electrode, at 25 C˚.
Figure 6.1a and 6.1b show the voltammograms of Fe-mimochrome 8Glu, obtained with
cathodic and anodic scans, in 10mM phosphate buffer at pH 7, and NaClO4 100 mM. They
show a well-behaved voltammetric wave in both scans. A redox potential of -170 mV,
versus the hydrogen electrode (SHE), could be evaluated from the experimental data.
This potential value is the mean between the maximum currents during cathodic and anodic
scans.
Figure 6.1a: Square wave voltammogram; cathodic scan of Fe-mimochrome IV 8Glu (25 ˚C, scan rate
50 mVs-1), over a potential range between 0.2 and -0.8 V (against SCE), at pH 7.0
-380 mV
400
600
800
1000
-800 -600 -400-200 0 200
E(mV) vs SCE
i(n
A)

70
Figure 6.1b: Square wave voltammogram; anodic scan of Fe-mimochrome IV 8Glu (25 ˚C, scan rate
50 mVs-1), over a potential range between 0.2 and -0.8 V (against SCE), at pH 7.0
-440 mV
-800
-700
-600
-500
-750-600 -450 -300-1500 150
E(mV) vs SCE
i (n
A)

71
6.2 Square-Wave Voltammetry of Fe mimochrome IV 8Lys
The FeIII/FeII reduction potential (E˚’) of Fe-mimochromes IV 8Lys, was determined by
Square-Wave Voltammetry (SWV) using a pyrolytic graphite electrode, at 25 C˚.
Figure 6.2a and 6.2b show the voltammograms of Fe-mimochrome 8Lys obtained with
cathodic and anodic scans in 10mM phosphate buffer at pH 7, and NaClO4 100 mM. They
show a well-behaved voltammetric wave in both scan. A redox potential of -48 mV, versus
hydrogen electrode (SHE), could be evaluated from the experimental data.
This potential was the mean values between the maximum currents during cathodic and
anodic scans.
Figure 6.2a: Square wave voltammogram; catodic scan of Fe-mimochrome IV 8Lys (25 ˚C, scan rate
50 mVs-1), over a potential range between 0.2 and -0.8 V (against SCE), at pH 7.0
Figure 6.2b: Square wave voltammogram; anodic scan of Fe-mimochrome IV 8Lys (25 ˚C, scan rate
50 mVs-1), over a potential range between 0.2 and -0.8 V(against SCE), at pH 7.0
-264 mV
-318 mV
-800
-700
-600
-500
-400-800 -600-400-200 0200
E(mV) vs SCE
i(µ
A)
500
700
900
1100
-800-600 -400 -200 0200
E(mV) vs SCE
i(µ
A)

72
6.3 Square-Wave Voltammetry of Fe mimochrome IV
The FeIII/FeII reduction potential (E˚’) of Fe-mimochrome IV, was determined by
Square-Wave Voltammetry (SWV) using a pyrolytic graphite electrode, at 25 C˚.
Figure 6.3a and 6.3b shows the voltammograms, in cathodic and anodic scan, of
Fe-mimochrome IV in 10mM phosphate buffer at pH 7, and NaClO4 100 mM. They show
two peaks for both scans. These peaks are characterized by differences in the maximum of
current intensities that occur at quite different potentials. Usually the contribution of faradic
current of adsorbed species is lower then that of the free specie in solution. Therefore the
redox potential was determined on the first peak. By taking the mean currents by cathodic
and anodic scan we have found a potential of -58 mV, versus hydrogen electrode (SHE),
was calculated as the mean value of the cathodic and anodic scans.
Figur 6.3a: Square wave voltammogram; cathodic scan of Fe-mimochrome IV (25 ˚C, scan rate 50 mVs-1),
over a potential range between 0.2 and -0.8 V against SCE, at pH 7.0.
I,-332 mV
II.-460 mV
300
500
700
900
1100
-800-600-400-200 0 200
E(mV) vs SCE
i(µ
A)

73
Figur 6.3b: Square wave voltammogram; catodic scan of Fe-mimochrome IV (25 ˚C, scan rate 50 mVs-1),
over a potential range between 0.2 and -0.8 V against SCE, at pH 7.0.
I
II, -456 mV
I, -320mV -750
-650
-550
-450
-800 -600-400-2000200
E(mV) vs SCE
i(µ
A)

74
N
N N
N
OR O R
Fe
Chapter 7: Discussion
Several strategies were conceived to obtain metalloprotein models95,115,116. For heme-
protein models, the use of two parts that associate around the heme, to give folded covalent
or non-covalent self-assembled dimers was particularly successful95,117. Numerous models
are homo-dimers with C2 symmetry related components. The use of the symmetry is quite
advantageous, on one hand, because it simplifies the design, the synthesis and the structural
characterization, but, on the other hand it may lead to diastereomeric forms108. This
problem was encountered in the study of mimochromes91,92. In fact, stable Λ and ∆ isomers
of Co(III) mimochrome I were unpredicted, but experimentally observed. One possible
solution to this problem came from the study of mimochrome IV. It contains a modified
sequence of mimochrome I: Leu1 and Leu9 were substituted with Glu and Arg residues at
position 1 and 9, respectively. This strategy was successful in stabilizing the sandwich
structure and in favouring the formation of the Λ isomer only110. On the basis of this result
two new mimochromes were developed. Fe(III) mimochrome IV 8Glu and Fe(III)
mimochrome IV 8Lys are characterized by a sequence containing eight Glu residues and
eight Lys residues, respectively (see figure 7.1). This new compounds allowed us to
correlate the different charge distributions with the redox properties of metal centre.
R=R1; Peptide mimchromes
Figure 7.1: Structure of Fe-mimochromes
Mimochrome Sequence
8Glu Ac-Glu-Glu-Glu-Leu-His-Glu-Glu-Lys-Arg-NH2
8Lys Ac-Glu-Lys-Lys-Leu-His-Lys-Lys-Lys-Arg-NH2
IV Ac-Glu-Ser-Gln-Leu-His-Ser-Asn-Lys-Arg-NH2
75
First we studied the overall structure of both compounds in solution by UV-vis and circular
dichroism spectroscopy with different experimental conditions.. The UV-vis spectra of both
Fe(III) mimochrome IV 8Glu (Figure 5.1a and 5.1b) and Fe(III) mimochrome IV 8Lys
(figure 5.4a and 5.4b), at pH 7, are typical of octahedral bis-His low spin complexes, in
good agreement with the spectral features previously observed for Fe(III) mimochrome I
and Fe(III) mimochrome IV. Bis-His coordination occurs for Fe(III) mimochrome IV 8Lys
even at very acidic conditions. Both imidazoles of the axially coordinating His residues
display a pKapp=2.67, indicating that the bis-His coordination to the iron represents over
90% of the population at pH > 3.85 (Figure 5.6). The low pKa value of the axially
coordinating His (with values very close to what observed in several myoglobins,
hemoglobins and cytochromes in the oxidized and reduced forms) strongly supports the
designed sandwich structure as for Fe(III) mimochrome IV complex119,120. For Fe(III)
mimochrome IV 8Glu, in the pH range 2-8, a different behavior was observed. Two
simultaneous equilibria (figure 5.2) were observed. The pKa1 (3.85) is attributed to the
protonation of the His in the uncoordinated form, as already seen for the other
mimochromes, the second pKa (5.03) is more difficult to interpret. It may be due to several
protonation equilibrium of the glutammic acids that may somehow influence the geometry
of the axial ligand.
pH titrations also were followed by CD spectroscopy in the UV region, in order to
determine the effect of the overall charge distribution on the secondary structure. No
significant changes are observed in secondary structure in the pH range from 5 to 8, for
Fe(III) mimochrome IV (figure 5.17) and Fe(III) mimochrome IV 8Lys (figure 5.15). This
result is consistent with no substantial charge distribution changes during the titration for
both species. For Fe(III) mimochrome IV at pH values below 5, protonation of the His side
chain takes place110(figure 5.18), as a consequence, the helical content decreases.
Conversely no significant changes in the secondary structure are observed for Fe(III)
mimochrome IV 8Lys at pH values below 5 (figure 5.16).
The CD spectroscopic pH titrations of Fe(III) mimochrome IV 8Glu (figure 5.10) show that
the [θ] value at 222 nm increases from pH 2 to 8. This behavior may be attributed to
deprotonation of the glutamate side chains. This may imply fewer inter and/or intra-chain
unfavourable charge interactions, and as a consequence the helical content increases. The

76
mid-point value was observed at pH 5.8. A similar value was also derived from the Pka2 of
UV-vis pH titration of Fe(III) mimochrome IV 8Glu, this finding could indicate that both
the Pka of CD and UV-vis spectroscopy pH titration refer to the same phenomenon.
CD measurements in both the UV and Soret regions gave preliminary structural
information on Fe(III) mimochrome IV 8Glu (see figure 5.7) and Fe(III) mimochrome IV
8Lys (see figure 5.12). Analysis of the UV region indicates the peptides to be in helical
conformation, in both Fe(III) mimochrome IV 8Glu and Fe(III) mimochrome IV 8Lys
complexes at pH 7. The helical content increases upon TFE addition for Fe(III)
mimochrome IV 8 Lys (Figure 5.12), reaching a maximum at 30% TFE quite similar to that
observed for Fe(III) mimochrome IV110. The helical content increases only slightly upon
TFE addition for Fe(III) mimochrome IV 8Glu (figure 5.7). The helical content is lower
then that observed for Fe(III) mimochrome IV 8Lys and Fe(III) mimochrome IV.
The CD spectra in the Soret region are very interesting, in order to correlate the sign of the
Cotton effect with the configuration around the metal ion. Both Fe(III) mimochrome IV
8Glu (figure 5.8) and Fe(III) mimochrome IV 8Lys (figure 5.14) exhibit positive Cotton
effects. This finding, similarly to what found for Fe(III) mimochrome IV indicates that both
systems adopt a Λ configuration110. The single positive Cotton effect gives a further
indication on inter-helical interactions that reinforce the sandwich structure and drive the
peptide chains to fold in a unique topology around the deuteroheme.
The effect of the charge distributions on redox properties of metal centre, was determined
by experiments of square wave voltammetry. The deuteroheme redox potential of
Fe-mimochromes, at pH 7, are the following:
Fe-mimochrome IV 8Glu: -170 mV vs SHE
Fe-mimochrome IV: -58 mV vs SHE
Fe-mimochrome IV 8Lys: -48 mV vs SHE
E°’Fe-mimohrome IV8glu < E°’Fe-mimochrome IV < E°’ Fe-mimochrome IV 8 Lys
The square wave voltammograms, in cathodic and anodic scans, show for Fe-mimochrome
IV 8Glu (figure 6.1a and 6.1b), Fe-mimochrome IV 8Lys (figure 6.2a and 6.2b) and

77
Fe-mimochrome IV (figure 6.3a and 6.3b), a well-behaved voltammetric wave in both
scans. Fe-mimochrome IV voltammograms show the presence of a second peak, probably
due to the electronic transfer of an adsorbed specie on the electrode. However a second
species can not be ruled out.
The redox potential of -170 mV for Fe-mimochrome IV 8Glu and -48 mV for Fe-
mimochrome IV 8Lys demonstrate that negatively charged residues, as for Fe-mimochrome
IV 8Glu, around the molecular core, stabilize the ferric deuteroheme, while the positively
charged residue of Fe-mimochrome IV 8Lys stabilize the ferrous deuteroheme. This
hypothesis was further confirmed from the redox potential of the parent Mimochrome IV
(-58 mV), that is intermediate between that Fe-mimochrome IV 8Glu and Fe-mimochrome
IV 8Lys.
The small difference in the redox potential between Fe mimochrome IV and Fe
mimochrome IV 8Lys may be due to the presence of organized phosphate ions around the
molecule. Phosphate ions are know to interact with the superficial lysines of cytochrome,
even at low phosphate concentrations120,121. Therefore the net charge on Fe mimochrome
IV 8Lys is partially neutralized by specific phosphate ion interactions. It will be interesting
to estimate, the changes in the redox potentials due to different buffers and ionic strength.
These redox potential values of mimochromes are significantly more positive than the
reduction potential of bis-imidazole-ligated heme, as Fe(protoporphyrin IX)(Im)2, -235
mV vs SHE, or Fe(mesoporphyrin IX)(Im)2, -285 mV vs SHE. This result would suggest
that the sandwich structure of mimochromes decreases solvent exposure, thus lead ions to
positive shifts of the reduction potential.
In summary, Fe-mimochrome IV 8Glu and Fe-mimochrome IV 8Lys are a simple,
structurally defined deuteroheme protein model, which may provide an excellent
opportunity for exploring the subtle mechanisms that control the redox properties of the
heme in natural proteins.

78
Experimental Section
79
Chapter 8: Experimental section
8.1 Design
Molecular design was performed on a Silicon Graphic 2 workstation. The program package
Insight/Discover with Exstensible Systematic Force Field (ESFF), was used for energy
minimization and restrained molecular dynamic (RMD) simulation. The NMR structure of
Co(III) mimochrome IV were used as template for modelling the mimochrome IV 8Glu and
mimochrome IV 8Lys molecules.
8.2 Equipment and materials
All amino acids, the Sieber amide resin, HATU, HOBt and HBTU were purchased from
Nova Biochem; piperidine, and scavengers were from Fluka. DIEA and TFA from Applied
Biosystems. All solvents used in the peptide synthesis and purification were anhydrous and
HPLC grade respectively, and were supplied by LabScan Analytica. Deuteroporphyrin IX
was from Porphyrin Products. Iron(II) acetate and tetramethylsilane were from Aldrich.
Solvent mixtures are indicated in the respective sections.
8.3 Synthesis of Mimochrome peptides
Mimochrome IV, mimochrome IV 8Glu, and mimochrome IV 8Lys peptides were
synthesized using Fmoc solid phase peptide synthesis (SPPS) on ABI 433 automatic
peptide synthesizer on a 0.25 mmol scale. The used resin was the super acid labile Sieber
Amide (100-200 mesh, 1% DVB, substitution level 0.52 mmol/g). For the synthesis of the
three peptides the following amino acids were used:
Mimochrome IV: Fmoc-Glu(OtBu)-OH, Fmoc-Ser(tBu)-OH, Fmoc-Gln(Trt)-OH, Fmoc-
Leu-OH, Fmoc-His(Trt)-OH, Fmoc-Asn(Trt)-OH , Fmoc-Lys(Mmt)- OH, Fmoc-Arg(Pbf)-
OH

80
Mimochrome IV 8Glu: Fmoc-Glu(OtBu)-OH, Fmoc-Leu-OH, Fmoc-His(Trt)-OH, Fmoc-
Glu(OtBu)-OH, Fmoc-Lys(Mmt)-OH, Fmoc-Arg(Pbf)-OH
Mimochrome IV 8Lys : Fmoc-Glu(OtBu)-OH, Fmoc-Lys(Boc)-OH, Fmoc-Leu-OH,
Fmoc-His(Trt)-OH, Fmoc-Lys(Mmt)-OH, Fmoc-Arg(Pbf)-OH
For all peptides the same synthetic procedures were used (see scheme 1 pages 31 and 32).
The first step was the synthesis of the fully protected peptides. This synthesis were
achieved on a ABI 433 peptide synthesizer, with the Fmoc-chemistry. The synthetic
procedure can be summarized as follow.
The α- Fmoc group, is removed at the beginning of every cycle with a 20% piperidine
solution. After deprotection, the resin is washed with NMP to remove the piperidine. The
peptide resin is then ready for coupling. All amino acids were coupled using a 0.45
M HBTU/HOBT solution in DMF. In the coupling step, the activated Fmoc aminoacid
reacts with the amino-terminal of the growing peptide chain to form a peptide bond.
Deprotection and coupling steps are repeated with each subsequent amino acid, until the
chain assembly has been completed When the coupling is complete, the resin is washed
with NMP. Mimochrome peptide N-terminal amino groups were acetylated with acid acetic
(1mmol, 57 µl).
After the final assembly on the resin, the N-ε Mmt protecting group of the Lys8 residue was
removed with repeated treatments of a solution containing 10% acetic acid and 20%
trifluoroethanol (TFE) in CH2Cl2 (10 ml) for 15min. Each step was repeated until no yellow
or red trityl cations were detected in eluent . The product thus obtained, was transferred
into a reactor, to cleavage the resin from the peptide. Therefore was added 1%TFA in
DCM (20 ml) at the protected peptide. The mixture acid was shake for 2 minutes doing
bubbling nitrogen. The solution was filtered, applying nitrogen pressure, into a flask
containing 10% pyridine in methanol (2ml). The reaction was followed by TLC, each step
was repeated until no product was detected. The side chain protecting groups were found to
be stable in both deprotection reactions

81
8.4 Purification of mimochrome peptides
Mimochrome IV and mimochrome IV 8Glu peptide crude materials were purified by RP-
HPLC (Shimadzu LC-8A, equipped with a SPD-M10 AV detector), on a Vydac C18 column
(5 x 25 cm; 10 µm), eluted with water-acetonitrile (both containing 0.1 % v/v TFA) linear
gradient:
• from 50 % to 90% acetonitrile concentration in 58 min; flow rate 120 ml/min
The pooled fractions containing the desired products were lyophilized. The peptides were
found to be homogeneous by analytical RP-HPLC (Shimadzu LC-10 AD, equipped with a
SPD-M10 AV detector and a SIL-10A Auto Sampler; Vydac C18 column 0.46 x 15 mm,
5µm), showing the following retention times:
mimochrome IV peptide: 28,50 min (figure 3.4),
mimochrome IV 8Glu peptide: 19,34 min (figure 3.6),
The purified compounds were analyzed by MALDI mass spectrometry (MALDI/MS) using
a Voyager DE instrument (Perkin Elmer), operating at the Centro di Metodologie Chimico-
Fisiche, University Federico II of Napoli. The α-cyano-4-hydroxycinnamic acid matrix was
recrystallized from EtOH on a Kromasil C18 column. The analysis of mass spectroscopy
confirmed the expected molecular weight
From analytical RP-HPLC analysis the mimochrome IV 8Lys peptide (figure 3.7) was pure
and did not require further purification. The peptide mixture was evaporated to dryness
and the mass spectroscopy confirmed the expected molecular weight. Mimochrome IV
8Lys peptide showing a retention time of 25,90 minutes.
The yield of reaction are the followings:
mimochrome IV: 538 mg of pure product (94%)
mimochrome IV 8Glu: 315 mg of pure product (63%)
mimochrome IV 8Lys: 494 mg of pure product (90%)

82
NH2
Arg-(Pbf) Lys- Asn-(Trt) Ser-(tBu) His-(Trt) Leu Gln-(Trt) Ser-(tBu) Glu-(otBu) Ac
NH2
NH
N NH
N
OOH O OH
8.5 Coupling of mimochromes
Peptide synthesis protocols usually employ activants such as PyBop, DCC, HOBt, HATU,
or HBTU in the presence of DIEA, to activate the free carboxyl groups and perform the
coupling reaction to the next amino acid. The coupling reaction between the carboxyl
groups of the porphyrin scaffols and the free ε amino groups of Lys8 was achieved by using
HATU as activant.
Figure 8.1: schematic representation of mimochrome coupling. The figure refers to the coupling of
mimochrome IV.
The coupling was done in DMF at room temperature, at concentration of 6.6 x 10⁻³ M, and
it was effected in the same conditions for the three mimochromes .
The first step was the deuteroporphyrin activation (Figure 8.2). The solid deuteroporphyrin
IX dihydrocloride (1 equivalent, M.W., 583.5 g/mol), was dissolved in a small volume of
DMF and DIEA (2 equivalents, M.W., 129,24 g/mol; density, 0.742 g/mL). At this solution
were added 2 equivalents of HATU (M.W., 380.23 g/mol) and other 2 equivalents of
DIEA, and this mixture was allowed to react for 15 min (figure 8.2).
In a following step, the activated deutheroporphyrin was added to a solution containing the
peptide (3 equivalents; M.W. mimochrome IV, 2284 g/mol; M.W. mimochrome IV 8Glu,
Mimochrome IV peptide
Deuterophorphyrin IX
+ DIEA/DMF
HATU NH
N NH
N
O ON N
NH2
Arg-(Pbf) -Lys Asn-(Trt) Ser-(tBu) His-(Trt) Leu Gln-(Trt) Ser-(tBu) Glu-(otBu) Ac
NH2
Arg-(Pbf) Lys- Asn-(Trt) Ser-(tBu) His-(Trt) Leu Gln-(Trt) Ser-(tBu) Glu-(otBu) Ac
Mimochrome IV free base

83
2014 g/mol; M.W. mimochrome IV 8Lys, 2190 g/mol) in DMF and DIEA (3 equivalents),
to form mimochromes. Other DIEA was added till pH ~ 7/8.
Figure 8.2: Schematic representation of deutheroporphyrin IX activation
In order to favour the formation of the bis substituted deutheroporphyrin IX, the mixture of
the activated porphyrin was slowly added to the solution of the nonapeptide. This approach
gave a good average yield for all mimochromes. The table 8.1 reports the amounts of each
reagents used in the coupling reaction.
Table 8.1: kinds and quantity of reagents used in the coupling reaction
The proceeding of the reaction was followed by RP-HPLC on a Vydac C18 column
(5 x 25 cm; 10 µm). After completion of the reaction, usually after 24 hours, the mixture
was evaporated to dryness and extracted with chloroform and acid water (using citric acid
Reaction coupling Deuteroporphyrin
dihydroclhoride, 1eq Peptide, 3eq HATU, 2eq DMF
mimochrome IV 9.10 x 10⁻³g,
1.56 x 10⁻⁵mol
0.100 g,
4.70 x 10⁻⁵mol
1.19 x 10⁻²g,
3.12 x 10⁻⁵mol 2.35 ml
mimochrome IV 8Glu 1.17 x 10⁻²g,
2.00 x 10⁻⁵mol
0.120 g,
6.00 x 10⁻⁵mol
1.52 x 10⁻²g,
4.00 x 10⁻⁵mol 3.00 ml
mimochrome IV 8Lys 1.59 x 10⁻²g,
2.73 x 10⁻⁵mol
0.180 g,
8.20 x 10⁻⁵mol
1.69 x 10⁻²g,
4.46 x 10⁻⁵mol 4.10 ml
NH
N NH
N
O O
PF
O
N
N+O
N+
N
PF6
-PF6
-
NH
N NH
N
OOH O OH
N
N
NN
O
N
N+
PFPF6
-
deutheroporphyrin IX
HATU
1 eq 2 eq + 4eq DIEA
Active
Product
DMF
84
10% p/v) to eliminate the reagents (DIEA, HATU and the peptide). After completion of the
extraction, the chloroform phase was evaporated. The next step was the deprotection of the
protecting groups. It was achieved at room temperature in the following mixture:
9.40 ml trifluoroacetic acid (TFA)
0.25 ml ethanedithiol (EDT)
0.25 ml water
0.10 ml triisopropylsilane (TIS)
The thiol-based scavengers were added to avoid any side reactions that might occur when
the protecting groups were removed from the peptide side chains. For all compounds, the
deprotection was usually complete in 2 h. After completion of the reaction, the solvent that
contained the crude product was evaporated under reduced pressure to 5% of the volume.
Ice-cold diethyl ether added to the residue and the mixture was cooled on ice to aid
precipitation of the crude product. It was isolated from the remaining part of the scavengers
by centrifuges with diethyl ether, and it was further purified by HPLC. (Shimadzu LC-8A,
equipped with a SPD-M10 AV detector), on a Vydac C18 column (2.2 x 25 cm; 10 µm),
eluted with water-acetonitrile (both containing 0.1 % v/v of TFA) linear gradient:
• from 5 % to 90% acetonitrile concentration in 66 min; flow rate 22 ml/min
The pooled fractions containing the desired products were lyophilized to obtain:
mimochrome IV: 35 mg of pure product (53%)
mimochrome IV 8Glu: 52 mg of pure product (63%)
mimochrome IV 8Lys: 54 mg of pure product (40%)
The purified compounds were analyzed by MALDI mass spectrometry (MALDI/MS) using
a Voyager DE instrument (Perkin Elmer), operating at the Centro di Metodologie Chimico-
Fisiche, University Federico II of Napoli. The α-cyano-4-hydroxycinnamic acid was
recrystallized from EtOH on a Kromasil C18 column.

85
8.6 Insertion of Iron in Mimochromes
For the insertion of iron acetate method was used .
Fe(OAc)2.xH2O + H2P Fe(P) + 2 HOAc + 2 H2O
Iron II acetate (10 equivalent, M.W. 173,94) was added to a solution of pure mimochrome
(M.W. mimochrome IV, 2753 g/mol, M.W. mimochrome IV 8Glu, 2953 g/mol; M.W.
mimochrome IV 8Lys, 2945 g/mol) in acetic acid/TFE (6:4) for a final concentration of
2 x 10⁻⁴ M (figure 8.3). The reaction mixture was heated under reflux for 2 h at 45 °C.
Table 8.2: iron insertion stecheometry; (a), molecular weight of TFA salt
Upon insertion of the metal in the porphyrin ring, the FeII ion was oxidized to FeIII. During
the reaction the colour of the reaction mixture changed from purple rose to brown,
indicating the formation of the iron (III) porphyrin complex. The reaction was monitored
by RP-HPLC and UV-VIS, where the characteristic FeIII-porphyrin spectrum became
dominant. The desired product was purified to homogeneity by Gel fitration with pre-
packed PD-10 columns of the GE Healthcare Bio-Science AB (SephadexTM G-25M
contains 0.15% Kathon CG as preservative). MALDI/MS confirmed the expected
molecular weight (cap 3.1). The pooled fractions containing the desired products were
lyophilized to obtain:
mimochrome IV : 26mg of product pure (55%)
mimochrome IV 8Glu: 12 mg of product pure (10%)
mimochrome IV 8Lys: 18 mg of product pure (72%)
M.W.a
(g/mol)
mol number
(mol)
Iron (II)
Acetate (mol)
Volume
(L)
mimochrome IV 3209 1.8 x 10⁻⁵ 1.8 x10⁻⁴ 9.0 x 10⁻²
mimochrome IV 8Glu 3409 5.8 x 10⁻⁶ 5.8 x 10⁻⁵ 3.4 x 10⁻²
mimochrome IV 8Lys 4313 7.0 x 10⁻⁶ 7.0 x 10⁻⁵ 3.5 x 10⁻²

86
Figure 8.3 : Schematic representation of insertion of iron in mimochrome; (R), represents mimochrome
peptide
N
N N
N
OR O R
Fe
NH
N NH
N
OR O R
Fe(CH3COOH)2 CH3COOH/TFE
Mimochrome free base Fe(III) Mimochrome

87
8.7 Analytical methods
Total metal-reconstituted mimochrome IV concentrations were determined on the basis of
the metal content, derived from flame atomic absorption spectrometry. Standard
procedures, on a Varian Spectra AA 220 atomic absorption spectrometer, equipped with a
MK7 burner, were used122. Solutions containing approximately 350 mgL-1 of Fe(III)
mimochrome IV 8Glu and Fe(III) mimochrome IV 8Lys in ultra pure metal-free water were
directly aspired into an air-acetylene flame with no prior treatment. Concentrations were
obtained both by comparison with calibration curve and by standard addition. No
differences, which overcome experimental uncertainty, were observed. Fe(III)
mimochrome IV 8Glu and Fe(III) mimochrome IV 8Lys stock solutions, analyzed for metal
contents, were appropriately diluted and used for determining the extinction coefficients at
the Soret band maximum wavelength.
8.8 UV/Vis spectroscopy:
UV/Vis spectroscopy: UV/Vis spectra were recorded on a Cary Varian 5000 UV
Spectrophotometer with 1 cm path length cells. Wavelength scans were performed at 25˚C
from 200 to 700 nm, with a 300 nm min-1 scan speed. Fe(III) mimochrome IV 8Glu and
Fe(III) mimochrome IV 8Lys extinction coefficients at the Soret band maximum
wavelength were determined in phosphate buffered solutions (pH 7; final phosphate
concentration 1.0 x 10⁻²M), using a concentrations range from 1.0 x 10⁻⁶ M to 1.0 x 10⁻⁵ M.
Fe(III) mimochrome IV 8Glu and Fe(III) mimochrome IV 8Lys pH titration were
performed in aqueous solution, using HCl solution (0,37% and 3,7%) to lower pH. The
concentrations of Fe(III) mimochrome IV 8Glu and of Fe(III) mimochrome IV 8Lys were
3.76 x 10⁻⁶ M and 7.00 x 10⁻⁶ M, respectively.

88
8.9 Circular dichroism spectroscopy
CD spectra were obtained at 25˚C on a Jasco J-715 dichrograph. Data were collected at 0.2
nm intervals with a 5 nm min-1 scan speed, a 2 nm bandwidth and a 16 s response, from 260
to 190 nm in the far-UV region. The spectra in the Soret region were collected at 0.2 nm
intervals with a 10 nm min-1 scan speed, a 2 nm bandwidth and a 16 s response, collected
from 470 to 360 nm. Cuvette path length of 1 cm was used for all spectral regions. Sample
solutions at different TFE/aqueous phosphate ratio (from 0 to 50% TFE) were prepared for
both Fe(III) mimochrome IV 8Glu (4.02 x 10⁻⁶M) and Fe(III) mimochrome IV 8Lys (3.36 x
10-6 M). CD intensities in the far UV region are expressed as mean residue ellipticities (deg
cm2dmol-1res-1); intensities in the Soret region are reported as total molar ellipticities (deg
cm2 dmol-1).
8.10 Square wave voltammetry
Square wave voltammetry experiments were carried out under argon with a
Potentiostat/Galvanostat PAR mod. 273A, using a cell designed for small volume samples
(Vmin=0.8 ml). Scan rate, 0.01 Vs-1 ; frequency, 5 Hz; pulse amplitude, 0.050 V. an edge-
cleaved pyrolitic graphite (PGE) disc were used as working electrodes for the. A Pt sheet
and a saturated calomel electrode (SCE) acted as counter and reference electrode,
respectively. The electric contact between the SCE and the working solution was obtained
with a Vycor set. Potentials were calibrated against the MV+2/ MV+ couple (MV =
methylviologen). The cleaning procedure of PGE electrode consisted in a treatment with
anhydrous ethanol for 5 min, followed by polishing with an alumina (BDH, particle size of
about 0.015 µm) water slurry on cotton wool for 3 min and a final immersion in an
ultrasonic pool for about 5 min. All measurements were made in 0.01 M phosphate buffer
pH 7 and NaClO4 0.1 M, at 25˚C. All mimochromes were freshly prepared before use.
Equilibrium reduction potentials (E˚΄) were calculated from the peak potential Ep of the
square-wave voltammograms using the Parry–Osteryoung equation123.
All reduction potentials reported in this paper are referred to the standard hydrogen
electrode (SHE). For each species, the experiments were performed at least two times.

89
Appendix
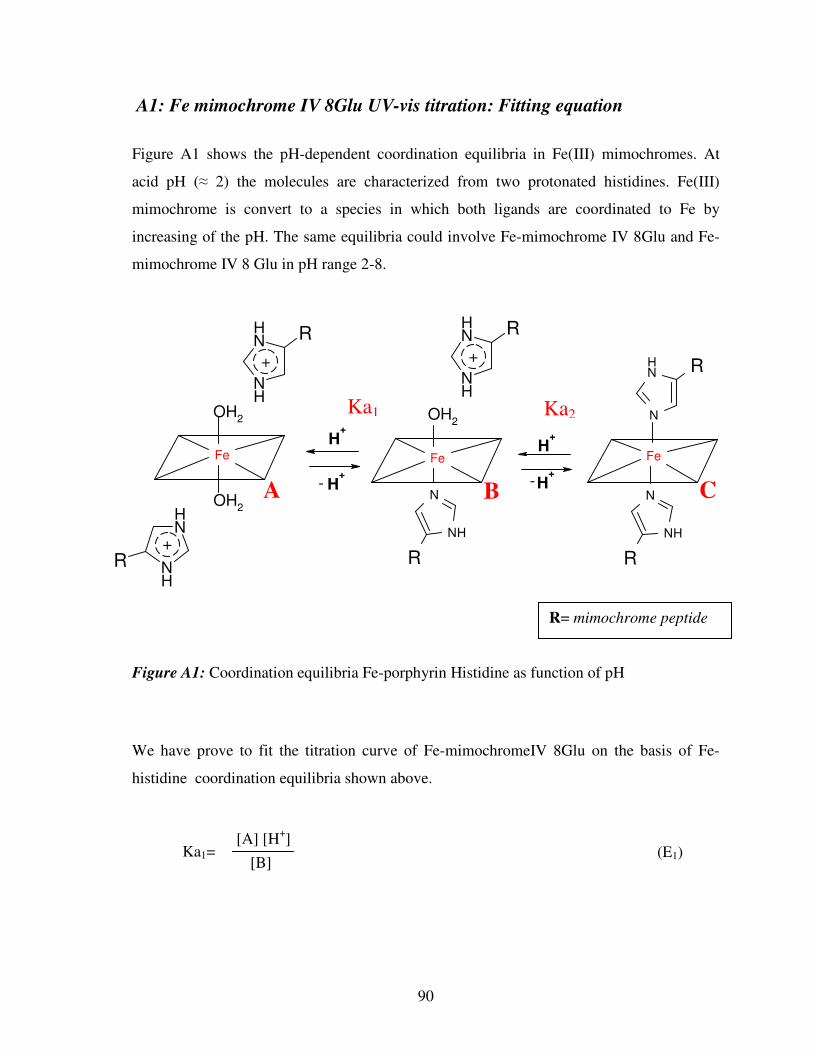
90
RNH
N
R
NH
N
Fe
R
NH
N
Fe
OH2
FeH
+
H+
H+
H+
OH2
OH2
RNH
NH
RNH
NH
R NH
NH
- -
A1: Fe mimochrome IV 8Glu UV-vis titration: Fitting equation
Figure A1 shows the pH-dependent coordination equilibria in Fe(III) mimochromes. At
acid pH (≈ 2) the molecules are characterized from two protonated histidines. Fe(III)
mimochrome is convert to a species in which both ligands are coordinated to Fe by
increasing of the pH. The same equilibria could involve Fe-mimochrome IV 8Glu and Fe-
mimochrome IV 8 Glu in pH range 2-8.
Figure A1: Coordination equilibria Fe-porphyrin Histidine as function of pH
We have prove to fit the titration curve of Fe-mimochromeIV 8Glu on the basis of Fe-
histidine coordination equilibria shown above.
[A] [H+]
[B] (E1)
R= mimochrome peptide
Ka1=
A B C
Ka1 Ka2
+
+
+

91
Ct = [A] + [B] +[C];
A= [A]εA +[B]εB +[C]εC
The total concentration of iron porphyrin is given by eq. E3 and the absorbance is given by
eq. E4, where εx is the molar extinction coefficient of each species:
The total concentration can be also write how depicted in the equation T1
(XA +XB +XC)= 1
Therefore inserting equation T1, into absorbance equation (E4) and into equation of the first
and second acids constant (E1 and E2), we have:
Ka1= = Ka2= = From equation T4 and T5 can be determinate XA and XC; XA = XC =
[B][H+]
[A]
XB [H+]
XA
[C][H+]
[B]
XC[H+] XB
XB Ka2
[H+]
A= Ct (XA εA +XB εB +XC ε C )
XB [H+] Ka1
(E3)
(E4)
(T1)
(T2)
(T3)
(T4)
(T5)
(T6)
(T7)
Ct= Ct (XA +XB +XC);

92
The equations T4 and T5 replace XA and XB into absorbance equation (T3), to give:
The equation T6 and T7 replaced XA and XC into eq.T2 to calculate XB, how shown by the
equations T9 and T10
In final step equation T10 replace DH into adsorbance equation T8 to obtain: This equation was used to fit the curve derivate by UV-vis Fe-mimochrome IV 8Glu pH
titration
XB = [H
+]2+ Ka1[H+] + Ka1Ka2
Ka1[H+]
A= Ct XB [H+] εA
Ka1 + XBεB +
XB Ka2 εC [H+]
A= Ct [H+]2 εA + Ka1[H
+]εB + Ka1Ka2 εC
[H+]2+ Ka1[H
+] + Ka1Ka2
XB [H+]
Ka1
XB Ka2
[H+] + XB + = 1;
(T8)
(T9)
(T10)
(T11)

93
A2: Fe mimochrome IV 8Lys UV-vis titration: Fitting equation
For Fe-Mimochrome IV 8Lys it seen that only one equilibrium being present. This
indicates that the two pKa are quite similar, therefore we can consider a single equilibrium:
The total concentration of iron porphyrin is given by eq. E1 and the absorbance is given by eq. E2, where εx is the molar extinction coefficient of each species: The total concentration can be also write how depicted in the equation M1
Therefore replacing equation M1 into absorbance equation (E2) we have:
Considering that The Ka equation can be written: On the basis of equation M1, Ka equation become:
Ct = [A] +[C];
A= [A]εA +[C]εC;
Ct= Ct (XA +XC);
(XA +XC) = 1
Ka1 ≈ Ka2 ≈ Ka
Ka2 = [H+]2 [C]
[A]
A= Ct (XA εA +XC ε C )
(M1)
[H+]2 XC
XA Ka2 =
(E1)
(E2)
(M2)
(M3)
(M4)
(M5)
[A] +2[H+] [C]

94
Which gives eq.M6 Replacing eq M6 into eq M3 and eq M2 XA can be calculate by equation M8 for give
In final step equation M9 replace XA into adsorbance equation M7 to obtain the equation
(M10) that we used to fit the curve derivate by UV-vis Fe-mimochrome IV 8Lys pH
titration
XC = Ka2 XA
[H+]2
A= Ct Ka2 ε C
Ka2 [H+]2
[H+]2 εA +
A= Ct XA εA + ε C [H+]2
Ka2 XA
Ka2 [H+]2
[H+]2 XA =
(M6)
(M7)
(M8)
(M9)
(M10)
XA + Ka2 XA = 1 [H+]2

95
Acknowledgement
We wish to thank Profs. Sola M. and Borsari M. (University of Modena) for assistance in
square wave voltammetry experiments, and Dr. Marco Trifuoggi for metal content analysis.

96
References
1. Lippard, S. J.; Berg, J. M. Principles of Bioinorganic Chemistry; University Science
Books: Mill Valley, 1994; p 349.
2. Holm, R. H.; Kennepohl, P.; Solomon, E. I. Chem. Rev. 1996, 96, 2239.
3. The Porphyrins; Dolphin, D., Ed.; Academic Press: New York, 1979; Vol. 7.
4. Bertini, I.; Luchinat, C. Curr. Opin. Chem. Biol. 1999, 3, 145.
5. Perutz, M. F.; Wilkinson, A. J.; Paoli, M.; Dodson, G. G. Annu. Rev. Biophys.
Biomol. Struct. 1998, 27, 1.
6. Peterson, J. A.; Graham, S. E. Structure 1998, 6, 1079.
7. Loew, G. H.; Harris, D. L. Chem. Rev. 2000, 100, 407.
8. Li, H.; Poulos, T. L. Structure 1994, 2, 461.
9. Wong, L. L. Curr. Opin. Chem. Biol. 1998, 2, 263.
10. Smith, A. T.; Veitch, N. C. Curr. Opin. Chem. Biol. 1998, 2, 269.
11. Banci, L. J. Biotechnol. 1997, 53, 253.
12. Sono, M.; Roach, M. P.; Coulter, E. D.; Dawson, J. H. Chem. Rev. 1996, 96, 2841.
13. Barker, P. D.; Ferguson, S. J. Structure 1999, 7, R281.
14. Poulos, T. L.; Li, H.; Raman, C. S. Curr. Opin. Chem. Biol. 1999, 3, 131.
15. Michel, H.; Behr, J.; Harrenga, A.; Kannt, A. Annu. Rev. Biophys.Biomol. Struct.
1998, 27, 329.
16. Lederer, F. Biochimie 1994, 76, 674.
17. Fischer, H.; Zeile, K. Justus Liebigs Ann. Chem. 1929, 468, 98.
18. Sellers, V. M.; Wu, C. K.; Dailey, T. A.; Dailey, H. A. Biochemistry 2001, 40,
9821.
19. Wu, C. K.; Dailey, H. A.; Rose, J. P.; Burden, A.; Sellers, V. M.; Wang, B. C.
Nat. Struct. Biol. 2001, 8, 156.
20. Moore, G. R.; Pettigrew, G. W. Cytochromes c: Evolutionary, Structural and
Physiochemical Aspects; Springer-Verlag: New York, 1990.
21. Drygas, M. E.; Lambowitz, A. M.; Nargang, F. E. J. Biol. Chem. 1989, 264, 17897.
22. O’Brian, M. R.; Thony-Meyer, L. Adv. Microb. Physiol. 2002, 46, 257.
23. Mogi, T.; Saiki, K.; Anraku, Y. Mol. Microbiol. 1994, 14, 391.

97
24. Brown, K. R.; Allan, B. A.; Do, P.; Hegg, E. L. Biochemistry 2002, 41, 10906.
25. Vainshtein, B. K.; Melikadamyan, W. R.; Barynin, V. V.; Vagin, A. A.; Grebenko,
A. I.; Borisov, V. V.; Bartels, K. S.; Fita, I.; Rossmann, M. G. J. Mol. Biol. 1986,
188, 49.
26. Igarashi, N.; Moriyama, H.; Fujiwara, T.; Fukumori, Y.; Tanaka, N. Nat. Struct.
Biol. 1997, 4, 276.
27. Crane, B. R.; Siegel, L. M.; Getzoff, E. D. Science 1995, 270, 59.
28. Lemberg, R.; Falk, J. E. Biochem. J. 1951, 49, 6
29. Tainer, J. A.; Roberts, V. A.; Getzoff, E. D. Curr. Opin. Biotechnol. 1992, 3, 378-
387.
30. Cytochrome c: Evolutionary, Structural and Physiological Aspects; Moore, G. R.;
Pettigrew, G. W., Eds.; Springer-Verlag: Berlin, 1990.
31. Scott, R. A.; Mauk, A. G. Cytochrome c: A Multidisciplinary Approach; University
Science Books: Sausalito, CA, 1996.
32. Turano, P.; Lu, Y. In Handbaook on Metalloproteins; Bertini, I., Sigel, H., Sigel,
A., Eds.; Marcel Dekker: New York, 2001; pp 269-356.
33. Goodin, D. B. J. Biol. Inorg. Chem. 1996, 1, 360-363.
34. Banci, L.; Rosato, A.; Turano, P. J. Biol. Inorg. Chem. 1996, 1, 364-367.
35. Gross, Z. J. Biol. Inorg. Chem. 1996, 1, 368-371.
36. Rietjens, I. M. C. M.; Osman, A. M.; Veeger, C.; Zakharieva, O.; Antony, J.;
Grodzicki, M.; Trautwein, A. X. J. Biol. Inorg. Chem. 1996, 1, 372-376.
37. Weiss, R.; Mandon, D.; Wolter, T.; Trautwein, A. X.; Muther, M.; Bill, E.; Gold,
A.; Jayaraj, K.; Terner, J. J. Biol. Inorg. Chem. 1996, 1, 377-383.
38. Martinez, S. E.; Huang, D.; Szczepaniak, A.; Cramer, W. A.; Smith, J. L. Structure
1994, 2, 95-105.
39. Lanzilotta, W. N.; Schuller, D. J.; Thorsteinsson, M. V.; Kerby, R. L.; Roberts, G.
P.; Poulos, T. L. Nat. Struct. Biol. 2000, 7,876-880.
40. Tezcan, F. A.; Winkler, J. R.; Gray, H. B. J. Am. Chem. Soc. 1998, 120, 13383.
41. Mauk, A. G.; Moore, G. R. J. Biol. Inorg. Chem. 1997, 2, 119.
42. Gunner, M. R.; Alexov, E.; Torres, E.; Lipovaca, S. J. Biol. Inorg. Chem. 1997, 2,
126.

98
43. Naray-Szabo’, G. J. Biol. Inorg. Chem. 1997, 2, 135.
44. Wuttke, D. S.; Gray, H. B. Curr. Opin. Struct. Biol. 1993, 3, 555.
45. Gray, H. B.; Winkler, J. R. Annu. Rev. Biochem. 1996, 65, 537.
46. Nastri, F.; Lombardi, A.; D’Andrea, L. D.; Sanseverino M.; Maglio, O.; Pavone, V.
Biopolymers 1998, 47, 5
47. Traylor, T. G. Acc. Chem. Res. 1981, 14, 102.
48. Traylor, T. G.; Chang, C. K.; Geibel, J.; Berzinis, A.; Mincey, T.;Cannon, J. J. Am.
Chem. Soc. 1979, 101, 6716.
49. Collman, J. P. Inorg. Chem. 1997, 36, 5145.
50. Momenteau, M.; Reed, C. A. Chem. Rev. 1994, 94, 659.
51. Mansuy, D.; Battioni, P. Bioinorganic Catalysis; Marcel Dekker: New York, 1993;
p 395.
52. Mansuy, D. Coord. Chem. Rev. 1993, 125, 129.
53. Meunier, B. Chem. Rev. 1992, 92, 1411.
54. Collman, J. P.; Zhang, X.; Lee, V. J.; Uffelman, E. S.; Brauman, J. I. Science 1993,
261, 1404.
55. Bruice, T. C., Zipplies, M. F. & Lee, W. A. 1986 Proc. Natl. Acad. Sci. 83, 4646–
4649.
56. Mortimer, D. N. & Lindsay Smith, J. R. 1985 J. Chem. Soc. Perkin Trans. 2,
1139–1149.
57. Hellinga, H. W. Curr. Opin. Biotechnol. 1996, 7, 437.
58. Hellinga, H. W. Folding Des. 1998, 3, R1.
59. DeGrado, W. F.; Summa, C. M.; Pavone, V.; Nastri, F.; Lombardi, A. Annu. Rev.
Biochem. 1999, 68, 779.
60. Regan, L. Trends Biochem. Sci. 1995, 20, 280.
61. Lu, Y.; Valentine, J. S. Curr. Opin. Struct. Biol. 1997, 7, 495.
62. Baltzer, L. Topics Curr. Chem. 1999, 202, 39.
63. Richardson, J. S.; Richardson, D. C.; Tweedy, N. B.; Gernert, K. M.; Quinn, T. P.;
Hecht, M. H.; Erickson, B. W.; Yan, Y.; McClain, R. D.; Donlan, M. E.; et al.
Biophys. J. 1992, 63, 1185.

99
64. Bryson, J. W.; Betz, S. F.; Lu, H. S.; Suich, D. J.; Zhou, H. X.; O’Neil, K. T.;
DeGrado, W. F. Science 1995, 270, 935.
65. Betz, S. F.; Raleigh, D. P.; DeGrado, W. F. Curr. Opin. Struct.Biol. 1993, 3, 601.
66. Beasley, J. R.; Hecht, M. H. J. Biol. Chem. 1997, 272, 2031.
67. Balaram, P. J. Pept. Res. 1999, 54, 195.
68. Imperiali, B.; Ottesen, J. J. Biopolymers 1998, 47, 23.
69. Tuchscherer, G.; Scheibler, L.; Dumy, P.; Mutter, M. Biopolymers 1998, 47, 63.
70. Street, A. G.; Mayo, S. L. Structure 1999, 7, R105.
71. Desjarlais, J. R.; Handel, T. M. Protein Sci. 1995, 4, 2006.
72. Desjarlais, J. R.; Clarke, N. D. Curr. Opin. Struct. Biol. 1998, 8, 471.
73. Gouterman, M. The Porphyrins; Academic Press. New York, 1978; Vol. 3, p 1.
74. Adar, F. The Porphyrins; Academic Press: New York, 1978; Vol. 3, p 167.
75. Eaton, W. A.; Hofrichter, J. Methods Enzymol. 1981, vol. 76, p 175.
76. Buchler J. W. The Porphyrins; Academic Press.: New York, 1979; Vol. 1, p 389.
77. Bullock, P. A.; Myer, Y. P. Biochemistry 1978, 17, 3084.
78. Babcock, G. T.; Widger, W. R.; Cramer, W. A.; Oertling, W. A.; Metz, J. G.
Biochemistry 1985, 24, 3638.
79. Sugiyama, T.; Miura, R.; Yamano, T.; Shiga, K.; Watari, H. Biochem. Biophys. Res.
Commun. 1980, 97, 22.
80. Dawson, J. H.; Andersson, L. A.; Masanori, S. J. Biol. Chem. 1982, 257, 3606.
81. Spee, J. H., Boersma, M. G., Veeger, C., Samyn, B., Van Beeumen, J., Warmerdam,
G., Canters, G. W., Van Dogen, W. M. A. M. & Rietjens, I. M. C. M. 1996 Eur. J.
Biochem. 241, 215–220.
82. Othman, S., Le Lirzin, A. & Desbois, A. 1993 Biochemistry 32, 9781–9791.
83. Sasaki, T. & Kaiser, E. T. 1989 J. Am. Chem. Soc. 111, 380–381.
84. Akerfeldt, K. S., Kim, R. M., Camac, D., Groves, J. T., Lear, J. D. & DeGrado, W.
F. 1992 J. Am. Chem. Soc. 114, 9656–9657.
85. Benson, D. R., Hart, B. R., Zhu, X. & Doughty, M. B. 1995 J. Am. Chem. Soc. 117,
8502–8510.
86. Arnold, P. A., Shelton, W. R. & Benson, D. R.1997 J. Am. Chem. Soc. 119, 3181–
3182

100
87. Wang, M., Kennedy, M. L., Hart, B. R. & Benson, D. R. 1997 Chem. Commun.
883–884.
88. Sakamoto, S., Sakurai, S., Ueno, A. & Mihara, H. 1997 Chem. Commun. 1221–
1222.
89. Nastri, F.; Lombardi, A.; Morelli, G.; Maglio, O.; D’Auria, G.; Pedone, C.; Pavone,
V. Chem. Eur. J. 1997, 3, 340.
90. D’Auria, G.; Maglio, O.; Nastri, F.; Lombardi, A.; Mazzeo, M.; Morelli, G.
Paolillo, L.; Pedone, C.; Pavone, V. Chem. Eur. J. 1997, 3, 350.
91. Lombardi, A.; Nastri, F.; Sanseverino, M.; Maglio, O.; Pedone, C.; Pavone, V.
Inorg. Chim. Acta 1998, 275-276, 301.
92. Nastri, F.; Lombardi, A.; Morelli, G.; Pedone, C.; Pavone, V.; Chottard, G.;
Battioni, P.; Mansuy, D. J. Biol. Inorg. Chem. 1998, 3, 671.
93. D’Andrea, L. D.; Nastri, F.; Lombardi, A.; Maglio, O.; Pavone,V.; Miniaturized
Hemoproteins: A Covalent Asymmetric Peptide- Porphyrin System. In Peptides 98;
Bajusz, S., Hudecz, F., Eds.; Akade´mia Kiado´: Budapest, Hungary, 1999; pp 304-
305;
94. D. A. Moffet, M. H. Hecht, Chem. Rev. 2001, 101, 3191 - 3203.
95. Lombardi, F. Nastri, V. Pavone, Chem. Rev. 2001, 101, 3165 – 3189;
96. S. Sakamoto, A. Ueno, H. Mihara, J.Chem. Soc. Perkin Trans. 2 1998, 2395 - 2404;
97. S. Sakamoto, I. Obataya, A. Ueno, H. Mihara, J. Chem. Soc. Perkin Trans. 2 1999,
2059 - 2069;
98. M. M. Rosenblatt, D. L. Huffman, X. Wang, H. A. Remmer, K. S. Suslick, J. Am.
Chem. Soc. 2002, 124, 12 394 -12 395;
99. H. K. Rau, W. Haehnel, J. Am. Chem. Soc. 1998, 120, 468 - 476;
100. H. K. Rau, N. DeJonge, W. Haehnel, Proc. Natl. Acad. Sci. USA 1998, 95, 11526 -
11531;
101. H. K. Rau, N. DeJonge, W. Haehnel, Angew. Chem. 2000, 112, 256 - 259; Angew.
Chem. Int. Ed. 2000, 39, 250 – 253;
102. D. E. Robertson, R. S. Farid, C. C. Moser, J. L. Urbauer, S. E.Mulholland, R.
Pidikiti, J. D. Lear, A. J. Wand, W. F. DeGrado, P. L. Dutton, Nature 1994, 368,
425 - 432;

101
103. J. M. Shifman, C. C. Moser, W. A. Kalsbeck, D. F. Bocian, P. L. Dutton,
Biochemistry 1998, 37, 16815 -16827;
104. J. M. Shifman, B. R. Gibney, R. E. Sharp, P. L. Dutton, Biochemistry 2000, 39,
14813 - 14821
105. B. R. Gibney, P. L. Dutton, Protein Sci. 1999, 8, 1888 -1898.
106. Perutz, M. F., Hasnain, S. S., Duke, P. J., Sessler, 660–663. J. L. & Hahn, J. E. 1982
Nature 295, 535–538.
107. Lombardi, A.; Summa, C.; Geremia, S.; Randaccio, L.; Pavone, V.; DeGrado, W. F.
Proc. Natl. Acad. Sci. 2000, 97, 6298.
108. Lombardi, A.; Marasco, D.; Maglio, O.; Di Costanzo, L.; Nastri, F.; Pavone, V.
Proc. Natl. Acad. Sci. 2000, 97, 11922.
109. W. F. DeGrado, C. M. Summa, V. Pavone, F. Nastri, A. Lombardi, Annu. Rev.
Biochem. 1999, 68, 779 – 819
110. Lombardi, F. Nastri, D. Marasco, O. Maglio, G. De Sanctis, F. Sinibaldi, R.
Santucci, M. Coletta, and V. Pavone Chem. Eur. J. 2003, 9, 5643 – 5654
111. V. Palaniappan, D. F. Bocian, Biochemistry 1994, 33, 14264 -14274
112. M. Coletta, H. Costa, G. De Sanctis, F. Neri, G. Smulevich, D. L. Turner, H.
Santos, J. Biol. Chem. 1997, 272, 24800 - 24804.
113. W.C. Chart, P.D. White, J. Beythien and R. Steinauer. J. Chem. Sot. Chem.
Commun. 1995 589-592.
114. M. L. Kennedy, S. Silchenko, N. Houndonougbo, B. R. Gibney, P. L. Dutton, K. R.
Rodgers, D. R. Benson, J. Am. Chem. Soc. 2001, 123, 4635 - 4636.
115. K. D. Karlin, Science 1993, 261, 701 - 708
116. Y. Lu, S. M. Berry, T. D. Pfisterand, Chem. Rev. 2001, 101, 3047 - 3080.
117. D. A. Moffet, M. H. Hecht, Chem. Rev. 2001, 101, 3191 - 3203.
118. V. Palaniappan, D. F. Bocian, Biochemistry 1994, 33, 14264 - 14274
119. M. Coletta, H. Costa, G. De Sanctis, F. Neri, G. Smulevich, D. L. Turner, H.
Santos, J. Biol. Chem. 1997, 272, 24800 - 24804.
120. G. Battistuzzi, M. Borsari, M. Sola, Eur. J. Inorg. Chem. 2001, 2989-3004;
121. N. Osheroff, D. L. Brautigantt, And E. Margollasht, Proc. Natl Acad. Sci. USA
1980, 77, 4439-4443

102
122. J. D. Winefordner, A Practical Guide to Graphite Furnace Atomic Absorption
Spectrometry, Chemical Analysis, Vol. 149, Wiley, NY, 1998
123. Parry E, Osteryoung R 1965 Anal Chem 37:1634–1637