synoptic scale disturbances of the indian summer monsoon ... · synoptic scale disturbances of the...
TRANSCRIPT

Vol. 5: 243-258, 1995 CLIMATE RESEARCH
Clim Res Published December 7
Synoptic scale disturbances of the Indian summer monsoon as simulated in a
high resolution climate model
' Deutsches Klimarechenzentrum GmbH, BundesstraBe 55, D-20146 Hamburg, Germany * Max-Planck-Institut fiir Meteorologie, BundesstraBe 55, D-20146 Hamburg, Germany
ABSTRACT: The Hamburg atmospheric general circulation model ECHAM3 at T106 resolution (1.125' lat.Aon.) has considerable skill in reproducing the observed seasonal reversal of mean sea level pressure, the location of the summer heat low as well as the position of the monsoon trough over the Indian subcontinent. The present-day climate and its seasonal cycle are realistically simulated by the model over this region. The model simulates the structure, intensity, frequency, movement and lifetime of monsoon depressions remarkably well. The number of monsoon depressions/storms simulated by the model in a year ranged from 5 to 12 with an average frequency of 8.4 yr-', not significantly differ- ent from the observed climatology. The model also simulates the interannual variability in the forma- tion of depressions over the north Bay of Bengal during the summer monsoon season. In the warmer atmosphere under doubled CO2 conditions, the number of monsoon depressions/cyclonic storms form- ing in Indian seas in a year ranged from 5 to 11 with an average frequency of 7.6 yr-', not significantly different from those inferred in the control run of the model. However, under doubled CO2 conditions, fewer depressions formed in the month of June. Neither the lowest central pressure nor the maximum wind speed changes appreciably in monsoon depressions identified under simulated enhanced green- house conditions. The analysis suggests there will be no significant changes in the number and inten- sity of monsoon depressions in a warmer atmosphere.
KEY WORDS: High resolution climate models . Indian summer monsoon . Monsoon depressions/ storms . Global warming . Climate change
INTRODUCTION
The Asian summer monsoon represents the most spectacular manifestation of regional anomalies in the general circulation of the atmosphere resulting from land-sea thermal contrasts and orographic features. Regional peculiarities assume a dominant role with respect to the monsoonal features over India and its neighbouring areas. The thermal structure of the adjoining sea areas -the Arabian Sea, the Bay of Ben- gal and the south Indian Ocean - and its temporal variations appear to have a modulating influence on the monsoon activity. The summer monsoon circula-
'Visiting scientist; permanent affiliation is with the Centre for Atmospheric Sciences, Indian Institute of Technology, New Delhi-110016, India. E-mail: [email protected]
tion over the Indian subcontinent is established towards the end of May and continues until the end of September. It accounts for over 75% of the annual rainfall over most of India. Much of the monsoon rain- fall over the central plains of India is associated with the low pressure systems which develop over the north Bay of Bengal and move onto the subcontinent along a northwesterly track. It still remains a challenging task to realistically simulate these low pressure systems and the associated interannual and intraseasonal variabili- ties in monsoon rainfall in many climate models. This also limits our confidence in scenarios for likely climate change over the region due to an enhanced green- house effect.
Considerable inlprovement in the ability of climate models to simulate the present-day climate on regional scales has taken place in recent years with the intro-
0 Inter-Research 1995
Clim Res 5: 243-258, 1995
duction of flner horizontal resolution and improved parameterization of physical processes. Apart from a reference control experiment, a doubled-CO2 green- house forcing experiment has recently been carried out at the Max Planck Institute for Meteorology (MPIM), Germany, using a climate model at T106 hor- izontal resolution (1.125" 1at.Aon.). Bengtsson et al. (1995a, b) have demonstrated the capability of this model experiment to realistically simulate the tropical vortices. In this paper, we first examine the ability of this high resolution climate model to simulate the development and movement of monsoon low pressure vortices in Indian Seas in a control experiment, and then assess a plausible climate change scenario for the region based on simulation of enhanced greenhouse conditions.
THE MODEL
The present study is based on an analysis of data generated in experiments performed with the ECHAM3 model. ECHAM3 is the third generation General Circulation Model (GCM) used for global cli- mate modelling investigations at the MPIM. The prog- nostic variables include vorticity, divergence, tempera- ture, log surface pressure, water vapour and cloud water. The model has 19 layers in a vertical hybrid coordinate system. The integration is performed fol- lowing a semi-implicit scheme with a leapfrog time fil- ter at 12 min intervals. The physical parameterization used in ECHAM3 at T106 resolution has been devel- oped and validated at T42 resolution (Roeckner et al. 1.992, Gleckler et al. 1994). The only modification undertaken for the high resolution model run was to change the horizontal diffusion by introducing a C4 smoothing operator for wave numbers shorter than 30 instead of applying a wave-number-dependent smoothing operator from wave number 15 as done for the T42 resolution model.
The parameterization of sub-grid-scale physical processes is formulated in a simplified parametric form. The radiation scheme uses a broad band formu- lation of the radiative transfer equations with 6 spectral intervals in the infrared spectrum and 4 in the solar spectrum (Hense et al. 1982, Rockel et al. 1991). Gaseous absorption due to water vapour, carbon diox- ide and ozone is taken into account as well as scatter- ing and absorption due to aerosols and clouds. The cloud optlcal properties are parameterized in terms of cloud water content, which is an explicit variable of the model.
The vertical turbulent transfer of momentum, heat, water vapour and cloud water is based upon the Monin-Obukhov similarity theory for the surface layer
and the eddy diffusivity approach, above the surface layer (Louis 1979). The drag and heat transfer coeffi- cients depend on roughness length and the Richardson number, and the eddy diffusion coefficients depend on wind stress, mixing length and Richardson number which has been reformulated in terms of cloud conser- vative variables (Bnnkop 1991). The effect of oro- graphically excited gravity waves on the momentum budget is parameterized on the basis of linear theory and dimensional considerations (Palmer et al. 1986, Miller et al. 1989).
The parameterization of cumulus convection is based on the concept of mass flux and comprises the effect of deep, shallow as well as mid-level convection on the heat, water vapour and momentum budgets (Tiedtke 1989). Stratiform clouds are predicted per se in accordance with a cloud water equation that in- cludes sources and sinks due to condensation/evapo- ration and precipitation form.ation both by coalescence of cloud droplets and sedimentation of ice crystals (Sundqvist 1978, Roeckner et al. 1991). Sub-grid-scale condensation and cloud formation are taken into account by specifying appropriate thresholds for rela- tive humidity depending on altitude and static stabil- ity.
The land surface scheme considers the heat and water budgets in the soil, snow cover and land and the heat budget of permanent land and sea ice (Diimenil & Todini 1992). For further details on the ECHAM3 model, see Deutsches Klimarechenzentrum GmbH Technical Report No. 6 (DKRZ 1992). A detailed dis- cussion of the global scale performance of this model is given in Arpe et al. (1994).
THE EXPERIMENT, REGION OF INTEREST AND DATA ANALYSIS
The findings reported in this paper are based on the data generated by the ECHAM3 global climate model described above in two 5 yr runs at T3.06 resolution. In the first (control) experiment, climatological sea sur- face temperatures averaged for the period 1979 to 1988 were prescribed as the boundary condition for simula- tion of the present-day climate. In addition to realistic simulation of present-day global climatology, this experiment demonstrated remarkably good agree- ment with the observed distribution of vortices in the tropical ocean and its typical annual variability (Bengtsson et al. 1995a). In the second experiment, sea surface temperatures, at the time of doubling of atmos- pheric COz, inferred from a transient coupled ocean- atmosphere model run at a coarser resolution (Cubasch et al. 1992) were used as the surface bound- ary condition. Also, the concentration of atmospheric
Lal et al.: Simulated disturbanc es of the Indian summer lnonsoon 245
CO2 was doubled for calculation of radiative fluxes in the model atmosphere. These two experiments have provided valuable insights into the feasibility of simu- lating hurricane-like tropical vortices in a high resolu- tion GCM and the possible changes in their frequency and intensity in a warmer atmosphere.
The availability of standard archived data records consisting of all the basic and additionally derived climatological parameters at 12 h intervals prompted us to examine the performance of the ECHAM3 model in simulating monsoon circulation at very high resolu- tion. We were also interested in exploring whether the cyclonic vortices developing over the Bay of Bengal during the peak summer monsoon activity over India are realistically simulated by the model.
The geographic region of interest for our data analy- sis was mainly confined to the area bounded within 5" to 30" N and 65" to 95" E. The total number of model grid points for this region was 672 (318 land points). Various diagnostics have been performed on the data to examine the skill of the model in simulating the sum- mer monsoon circulation. These will be discussed in the following section ('Validation of regional climatology').
The monsoon depression, which is the most impor- tant synoptic-scale disturbance along the monsoon trough, is known to play a vital role in the spatial and temporal distribution of Indian monsoon rainfall. The cyclonic vorticity in the north Bay of Bengal, horizontal convergence in the lower levels and uvward motion within the moist monsoon current lead to cloud build- up, heavy precipitation and release of latent heat, which are responsible for the development and mainte- nance of these monsoon depressions. We analysed the twice-daily data produced in the model simulation for the period from June to September (summer monsoon season) to identify these monsoon lows and depressions based on appropriate dynamical and physical criteria. A detailed outline of these criteria as well as the find- ings of our analysis will be presented below ('Simula- tion of synoptic-scale disturbances').
Validation of regional climatology
The south Asian summer monsoon circulation arises due to land-ocean temperature contrasts during sum- mer and winter. The annual cycle of surface pressure has the largest amplitude over the Asian continent. Over northwest India and adjoining Pakistan, the lowest pressure occurs in July. The axis of this low surface pressure is oriented from the northwest to the southeast such that the elongated zone of low pres- sure, called the monsoon trough, lies along the Indo- Gangetic plains of north-central India. The western end of the trough merges with the heat low over
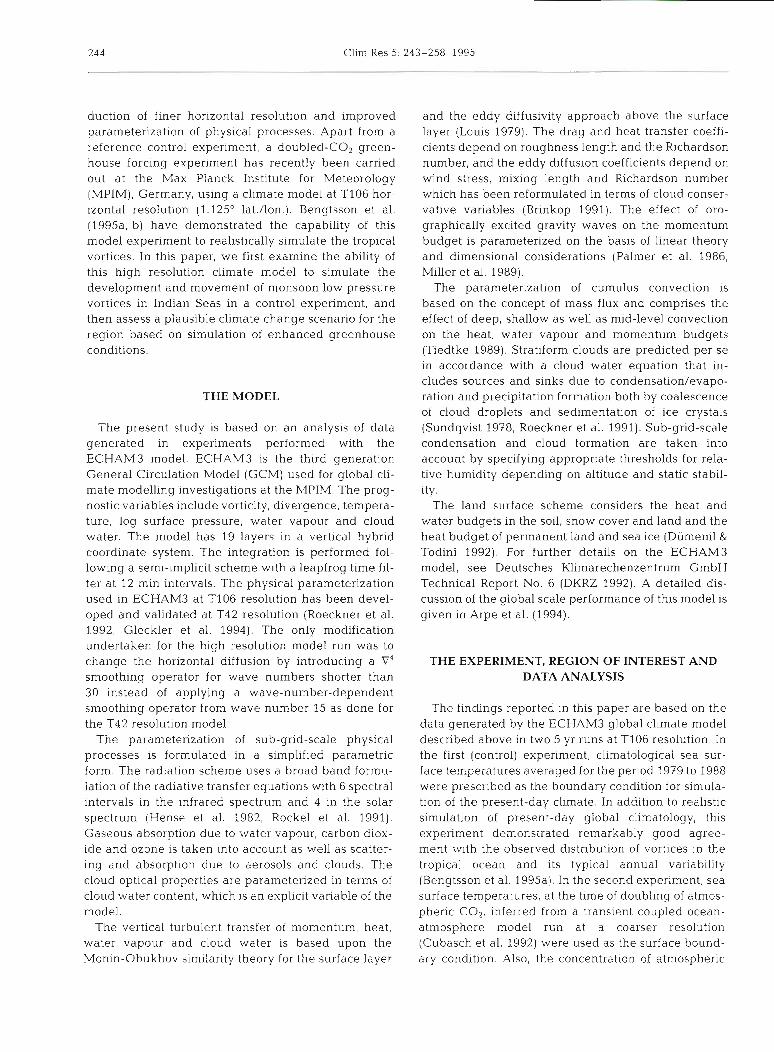
Pakistan whereas the ea.stern end extends to the Bay of Bengal, where a series of monsoon depressions forms. The spatial patterns in these features of model- simulated mean sea level pressure distribution during January, April, July and October, representing the winter, pre-monsoon, monsoon and post-monsoon seasons respectively, are compared with the observed climatology in Fig. 1. It is evident from Fig. 1 that the ECHAM3 model at T106 resolution has considerable skill in reproducing the observed seasonal reversal of surface pressure, the location of the summer heat low as well as the position of the monsoon trough over the region. A further indication of how the model performs in simulating the seasonal mean sea level pressure can be obtained by correlating the model-simulated and observed spatial patterns of mean sea level pressure over the region. The correlation coefficients between the observed mean sea level pressure patterns, based on data sets for the period 1985 to 1990 analysed and compiled by the European Centre for Medium Range Weather Forecasts (ECMWF 1993) and the model- simulated mean sea level pressure patterns during winter and summer are 0.61 and 0.63 respectively. Considering that reasonable doubt exists about observed climatology over north and northeast India due to the scantness of observations from higher eleva- tions in the Himalayas, the root mean square errors (RMSE) of 2.9 and 4.8 between the observed and model-simulated mean sea level pressure patterns in winter and summer, respectively, are considerably low.
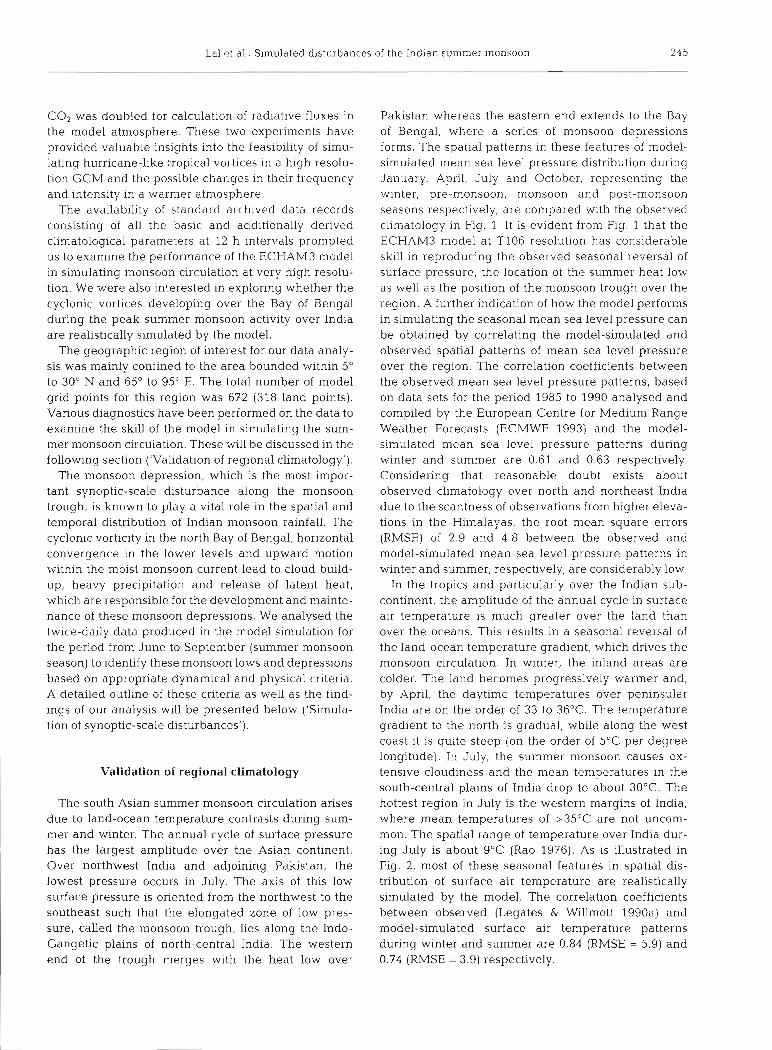
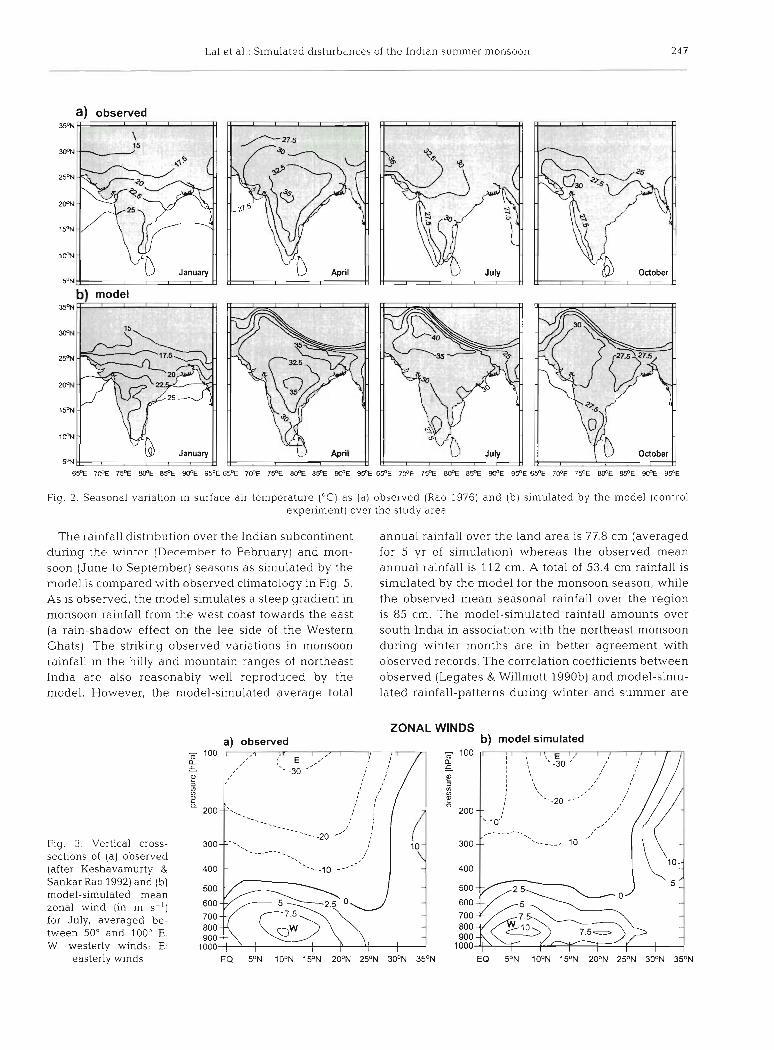
In the tropics and particularly over the Indian sub- continent, the amplitude of the annual cycle in surface air temperature is much greater over the land than over the oceans. This results in a seasonal reversal of the land-ocean temperature gradient, which drives the monsoon circulation. In winter, the inland areas are colder. The land becomes progressively warmer and, by April, the daytime temperatures over peninsular India are on the order of 33 to 36°C. The temperature gradient to the north is gradual, while along the west coast it is quite steep (on the order of 5°C per degree longitude). In July, the summer monsoon causes ex- tensive cloudiness and the mean temperatures in the south-central plains of India drop to about 30°C. The hottest region in July is the western margins of India, where mean temperatures of >35"C are not uncom- mon. The spatial range of temperature over India dur- ing July is about 9°C (Rao 1976). As is illustrated in Fig. 2, most of these seasonal features in spatial dis- tribution of surface air temperature are realistically simulated by the model. The correlation coefficients between observed (Legates & Willmott 1990a) and model-simulated surface air temperature patterns during winter and summer are 0.84 (RMSE = 5.9) and 0.74 (RMSE = 3.9) respectively.
246 Clim Res 5: 243-258, 1995
a ) observed b) model
Fig. 1. Spatial distribution of mean sea level pressure (hPa) as (a) ob- served (Rao 1976) and (b) simulated by the model (control experiment), during January, April, July and October, representing the winter, pre- monsoon, monsoon and post-monsoon seasons, respectively, over the
study area
During the monsoon season, surface winds are southwesterly over peninsular India, the Bay of Bengal and the Arabian Sea and are northeasterly in winter months (Rao 1976). In the upper troposphere, the west- erly jet stream over north India shifts further north dur- ing the monsoon season and is replaced by the easterly jet stream over central and south India. A comparison of simulated mean winds for January and July over
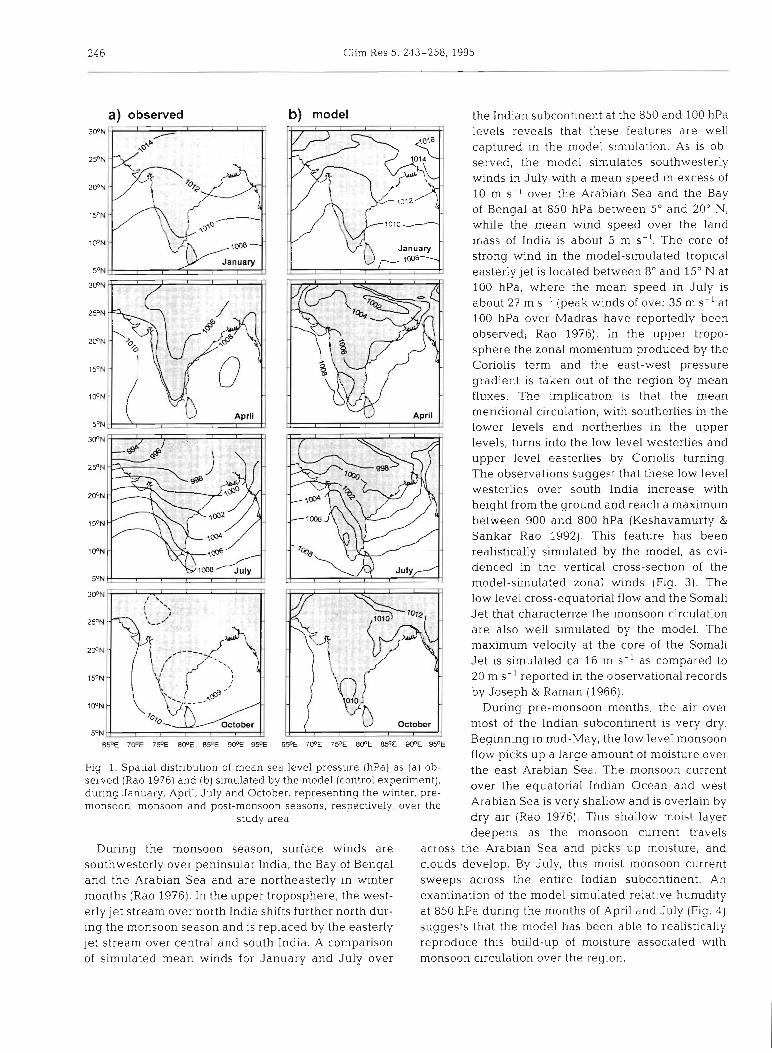
the Indian subcontinent at the 850 and 100 hPa levels reveals that these features are well captured in the model ssmulation. As is ob- served, the model simulates southwesterly winds in July with a mean speed in excess of 10 m S - l over the Arabian Sea and the Bay of Bengal at 850 hPa between 5" and 20" N, whlle the mean wind speed over the land mass of India is about 5 m S-'. The core of strong wind in the model-simulated tropical easterly jet is located between 8" and 15" N at 100 hPa, where the mean speed in July is about 27 m S-' (peak winds of over 35 m S-' at 100 hPa over Madras have reportedly been observed; Rao 1976). In the upper tropo- sphere the zonal momentum produced by the Coriolis term and the east-west pressure gradient is taken out of the region by mean fluxes. The implication is that the mean meridional circulation, with southerlies in the lower levels and northerlies in the upper levels, turns into the low level westerlies and upper level easterlies by Coriolis turning The observations suggest that these low level westerlies over south India increase with height from the ground and reach a maximum between 900 and 800 hPa (Keshavamurty & Sankar Rao 1992). This feature has been realistically simulated by the model, as evi- denced in the vertical cross-section of the model-simulated zonal winds (Flg. 3). The low level cross-equatorial flow and the Somali Jet that characterize the monsoon circulation are also well simulated by the model. The maximum velocity at the core of the Somali Jet is simulated ca 16 m S- ' as compared to 20 m S- ' reported in the observational records by Joseph & Raman (1966).
During pre-monsoon months, the air over most of the Indian subcontinent is very dry. Beginning in mid-May, the low level rnonsoon flow picks up a large amount of moisture over the east Arabian Sea. The monsoon current over the equatorial Indian Ocean and west Arabian Sea is very shallow and is overlain by dry air (Rao 1976). This shallow moist layer deepens as the monsoon current travels
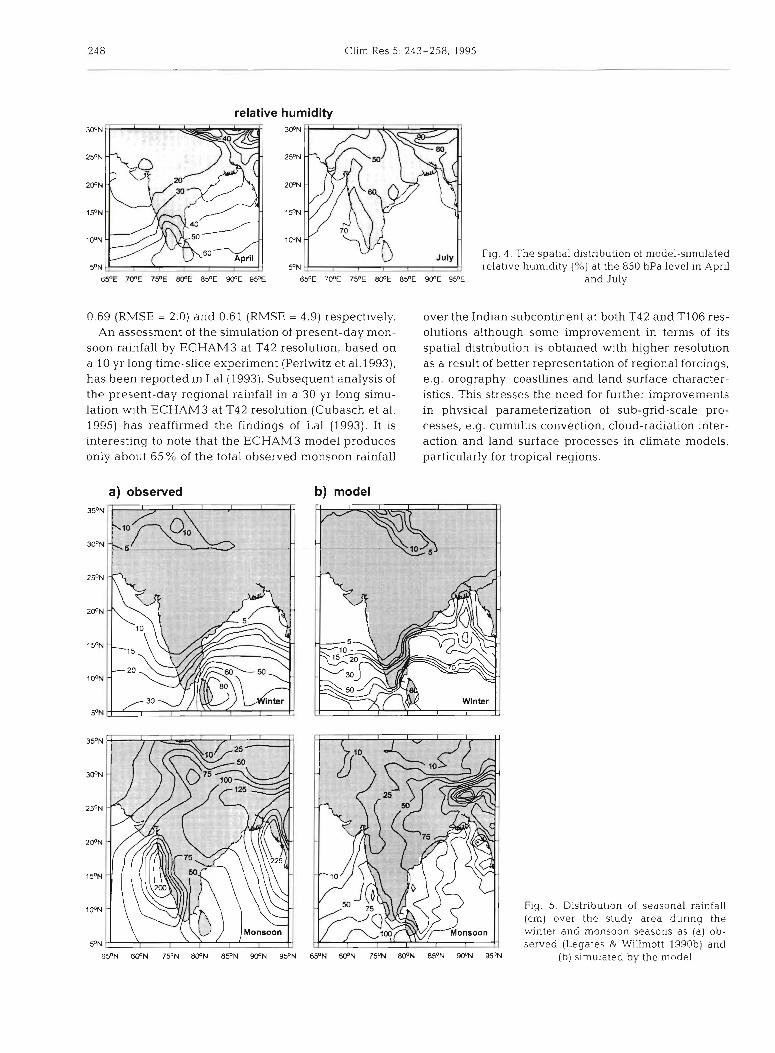
across the Arabian Sea and picks up moisture, and clouds develop. By July, thss moist monsoon current sweeps across the entire Indian subcontinent. An examination of the model-simulated relative humidity at 850 hPa during the months of April and July (Fig. 4 ) suggests that the model has been able to realistically reproduce this b d d - u p of moisture associated with monsoon circulation over the region.
La1 et al.: S~mulated disturbances of the Ind~an summer monsoon
a) observed
bl model
Fig. 2. Seasonal variation in surface air temperature ("C) as (a) observed (Rao 1976) and (b) simulated by the model (control experiment) over the study urea
The rainfall distribution over the Indian subcontinent during the winter ( D e r ~ m h e r to February) and mon- soon (June to September) seasons as simulated by the model is compared with observed climatology in Fig. 5. As is observed, the model simulates a steep gradient in monsoon rainfall from the west coast towards the east (a rain-shadow effect on the lee side of the Western Ghats). The striking observed variations in monsoon rainfall in the hilly and mountain ranges of northeast India are also reasonably well reproduced by the model. However, the model-simulated average total
Fig. 3. Vertical cross- sections of (a) observed (after Keshavamurty & Sankar Rao 1992) and (b) model-simulated mean zonal wind (in m ss1) for July, averaged be- tween 50" and 100" E. W: westerly winds; E:
annual rainfall over the land area is 77.8 cm (averaged for 5 yr of simulation) whereas the observed mean annual rainfall is 112 cm. A total of 53.4 cm rainfall is simulated by the model for the monsoon season, while the observed mean seasonal rainfall over the region is 85 cm. The model-simulated rainfall amounts over south India in association with the northeast monsoon during winter months are in better agreement with observed records. The correlation coefficients between observed (Legates & Willmott 1990b) and model-simu- lated rainfall-patterns during winter and summer are
ZONAL a\ observed
WINDS b) model simulated
easterly winds EQ 5ON 10°N 15'N 20°N 2S0N 30°N 35ON EQ 5ON 10°N 15ON 20°N 25ON 30°N 35ON
Clim Res 5: 243-258, 1995
relative humidity
Fig. 4. The spatial distnbution of model-simulated relative humidity (%) at the 850 hPa level in Apnl
659 705 7 9 E 8(PE 85"E W E 95OE 65'E 70°E 7S0E 80°E 85"E 90°E 9S0E and July
0.69 (RMSE = 2.0) and 0.61 (RMSE = 4.9) respectively. An assessment of the simulation of present-day mon-
soon rainfall by ECHAM3 at T42 resolution, based on a 10 yr long time-slice experiment (Perlwitz et a1.1993), has been reported in La1 (1993). Subsequent analysis of the present-day regional rainfall in a 30 yr long simu- lation with ECHAM3 at T42 resolution (Cubasch et al. 1995) has reaffirmed the findings of La1 (1993). It is interesting to note that the ECHAM3 model produces only about 65 % of the total observed monsoon rainfall
a) obsenred b) model
over the Indian subcontinent at both T42 and T106 res- olutions although some improvement in terms of its spatial distribution is obtained with higher resolution as a result of better representation of regional forcings, e.g. orography, coastlines and land surface character- istics. This stresses the need for further improvements in physical parameterization of sub-grid-scale pro- cesses, e.g. cumulus convection, cloud-radiation inter- action and land surface processes in climate models, particularly for tropical regons.
Fig. 5. Distribution of seasonal rainfall (cm) over the study area dunng the winter and monsoon seasons as (a] ob- served (Legates & Willmott 1990b) and
6S0N @N 7S0N BOON 850N W N 9S0N 850N @N 7S0N BOON 85ON 9CPN 95ON (b) simulated by the model
La1 et a1 : Sin~ulated disturbances of the lndian summer monsoon
Table 1. Number of observed monsoon depressions (D) and cyclonic storms (S) in Indian seas from 1891 to 197 0
Location June July August September Total no. of storms in D S D S D S D S monsoon season
Bay of Bengal 71 35 107 38 132 26 141 32 582 Arabian Sea 18 15 9 3 2 2 9 5 63 Land 12 1 39 1 42 - 2 1 1 117 Total 101 51 155 42 176 28 '71 38 762 Depression/storms 1.3 0.6 1.9 0.5 2.2 0.4 1.1 0.5 per year
9.5
Simulation of synoptic-scale disturbances
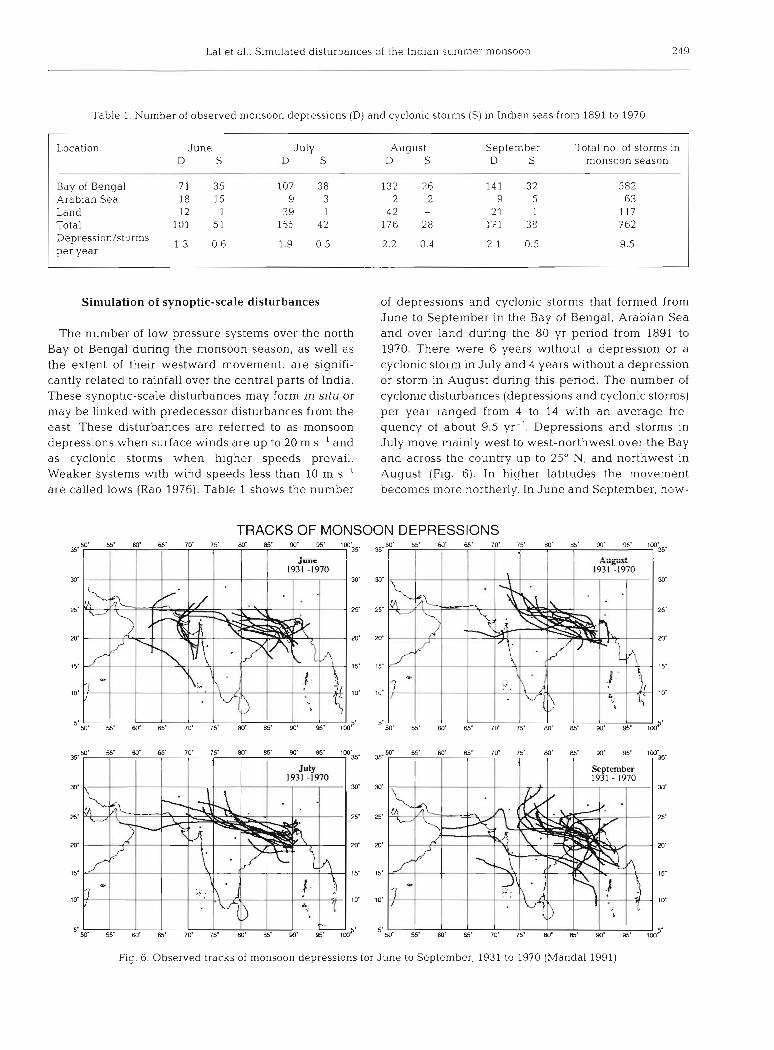
The number of low pressure systems over the north Bay of Bengal during the monsoon season, as well as the extent of their westward movement, are signifi- cantly related to rainfall over the central parts of India. These synoptic-scale disturbances may form in situ or may be linked with predecessor disturbances from the east. These disturbances are referred to as monsoon depressions when surface winds are up to 20 m S-' and as cyclonic storms when higher speeds prevail. Weaker systems with wind speeds less than 10 m S-' are called lows (Rao 1976). Table 1 shows the number
of depressions and cyclonic storms that formed from June to September in the Bay of Bengal, Arabian Sea and over land during the 80 yr period from 1891 to 1970. There were 6 years without a depression or a cyclonic storm in July and 4 years without a depression or storm in August during this period. The number of cyclonic disturbances (depressions and cyclonic storms) per year ranged from 4 to 14 with an average fre- quency of about 9.5 yr-'. Depressions and storms in July move mainly west to west-northwest over the Bay and across the country up to 25' N, and northwest in August (Fig. 6). In higher latitudes the movement becomes more northerly. In June and September, how-
TRACKS OF MONSOON DEPRESSIONS
55' W 6s 7 r 75- W as W 85' 1%
l September 1931 - 1970
Fig. 6 . Observed tracks of monsoon depressions for June to September, 1931 to 1970 (Mandal 19911

Clim Res 5: 243-258, 1995
ever, the movement is more evenly distributed, show- Table 2 lists the number of simulated cyclonic ing for example the change to a northerly course at vortices by season and month for the period of simu- lower latitudes, recurvature and a north or northeast lation. The total number of depressions/cyclonic storms course. The tangential and radial wind structure of forming in Indian Seas as simulated by the model over composited monsoon depressions from 1966 to 1970 the 5 yr during the period from June to September was (Sikka & Paul 1975) suggests cyclonic circulation up to 41. The number of monsoon depressions/storms in a 1000 km in the horizontal and up to 9 km in the verti- year ranged from as low as 5 to as many as 12 with an cal, with anticyclonic flow aloft. The inflow is observed average frequency of 8.4 yr-', not significantly dif- from the surface to 5 km and maximum outflow occurs ferent from the observed climatology. The tracks of at around 10 to 11 km. Over the northeast Arabian Sea, these monsoon depressions as simulated by the model a cyclonic circulation within the layer from 700 to in its control experiment are illustrated in Fig. 7. It 500 hPa with only a trough in the southwesterly cur- was encouraging to see that almost all of the model- rent is sometimes observed (Miller & Keshavamurty simulated depressions developing in July and August 1968). These systems, with maximum vorticity in the had a northwesterly track while the depressions middle troposphere rather than in the surface layers, forming in June and September had a tendency for are referred to as mid-tropospheric cyclones. northerly movement as well as recurvature, features
The criteria for identifying development of synoptic- also seen in observed storm tracks. scale monsoon vortices over the Bay of Bengal and Ara- In order to examine the detailed structure of simu- bian Sea as well as over the land region in the 5 yr of the lated monsoon depressions, we selected 1 case each in ECHAM3 control simulation at T106 resolution were: June and July of Years 2 and 5 respectively, as well as
2 cases in August (Years 1 and 4). The 2 storms of July (1) Relative vorticity at 850 hPa > 2.0 X 10⁻⁵ S-'. (Year 1) and August (Year 5) were the most intense (2) Wind speed of between 15 and 20 m S- ' for land monsoon vortices that developed in the 5 yr of model
depressions and >20 m S- ' for depressions/cyclo- simulation. The June storm (Year 2) formed at 15.2" N, nic storms over sea areas and a surface pressure 96.2" E on Day 4 at 12:OO h UTC with a min~rnum cen- of 5998 hPa within a 5 X 5 grid point area which tral pressure of 966 hPa and peak surface winds of 29.9 fulfilled condition 1. m S- ' . It dissipated after 9.5 d at 26.4" N, 94.5" E (the
(3) Minimum event duration of 2 d for a land depres- longest duration of any model-simulated monsoon sionlmid-tropospheric cyclone and 3.5 d for a sea depression was 13 d while the longest observed lifes- depression/cyclonic storm. pan of monsoon depressions/storms developing over
(4) Along the west coast of India over the northeast the north Bay of Bengal in 90 yr has been reported to Arabian Sea, if minimum surface pressure was be 16 d; Mandal 1991). The July storm (Year 5) formed 51000 hPa, but wind speed was > l 5 m S-' and at 23.06" N, 90.8' E (on land) on Day 4 at 12:OO h UTC relative vorticity at 850 hPa was 22.0 X 10⁻⁵ S-' with a minimum central pressure of 948 hPa and peak with a peak maximum between 700 and 500 hPa surface winds of 28.6 m S-'. It dissipated after 9 d at for a minimum duration of 2 d , the system was 26.6" N, 70.9" E. The August depression of Year 1 was identified as a mid-tropospheric cyclone. first detected at 19.13" N, 89.44" E on 28 July at 12:OO h
(5) The minimum in surface pressure was identified UTC. It moved in a west northwest direction towards as the centre of the depression/cyclonic storm. the east coast of India. On August 1 at 00:OO h UTC, it Mean values were calculated within a 5 X 5 grid struck the east coast of India with a maximum sur- point area around the point of minimum pressure. face wind of 23.8 m S' ' and with its centre located at
Table 2. Frequency of low pressure systems during the summer monsoon season in Indian seas as simulated in the ECHAM3 T106 control experiment. (Numbers in parentheses indicate the number of depressions which intensified into cyclonic storms)
Year June July August September Total no. of storms per season
1 4 + l a + l b (3) 3 (3) 2 (1) 1 (1) 12 (8)
2 2 (1) 2 (1) 1 (1) 1 (1) 7 (5) 3 2 ( lb ) 3 (3) 3 (3) 1 (1) 9 (8) 4 - 3 (2) - 2 (-1 5 (2) 5 1 (11 4 (2+lb) 3 (2) 2 (2) 10 181
Total no. of storms 11 (6) 15 (12) 9 (7) 7 (5) 42 (30) Mean per year 2.5 (1.5) 3 (2.5) 1 8 (1.4) 1.2 (0.8) 8.4 (6)
"Mid-tropospheric cyclone over the Arabian Sea; bdepression over the Arabian Sea
La1 et a1 : Simulated disturbances of the Indian summer monsoon 251
- -- -
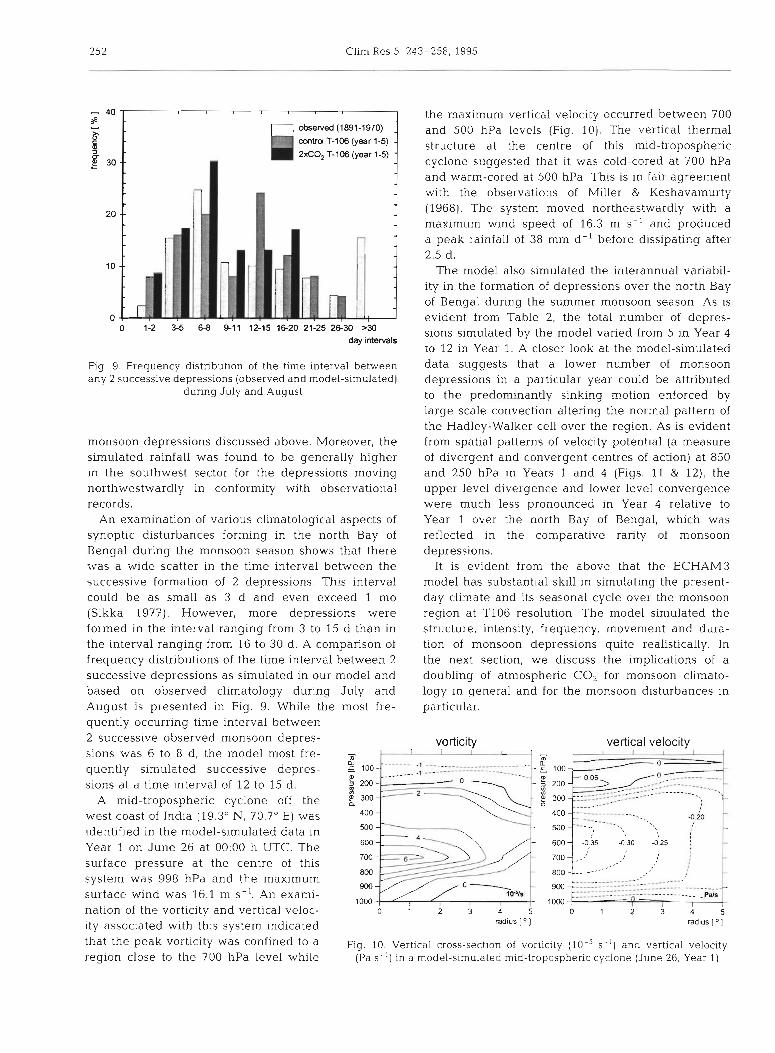
Y e a r l - 5 Number of Events: 41 1
TRACKS OF MONSOON DEPRESSIONS (ECHAM3 T-106) CTL ' 6 0 6 5 7 75' 80' 85' 90' 95' 100'
35' -
55 I I
' 60' 65' 70' 75' 80' 85' 90' 95' 100'
June - July - A u g w - - - September - - -
Fig. 7 Tracks of monsoon depressions for June to September simulated by the model dunnq Years 1 to 5 of control
experiment
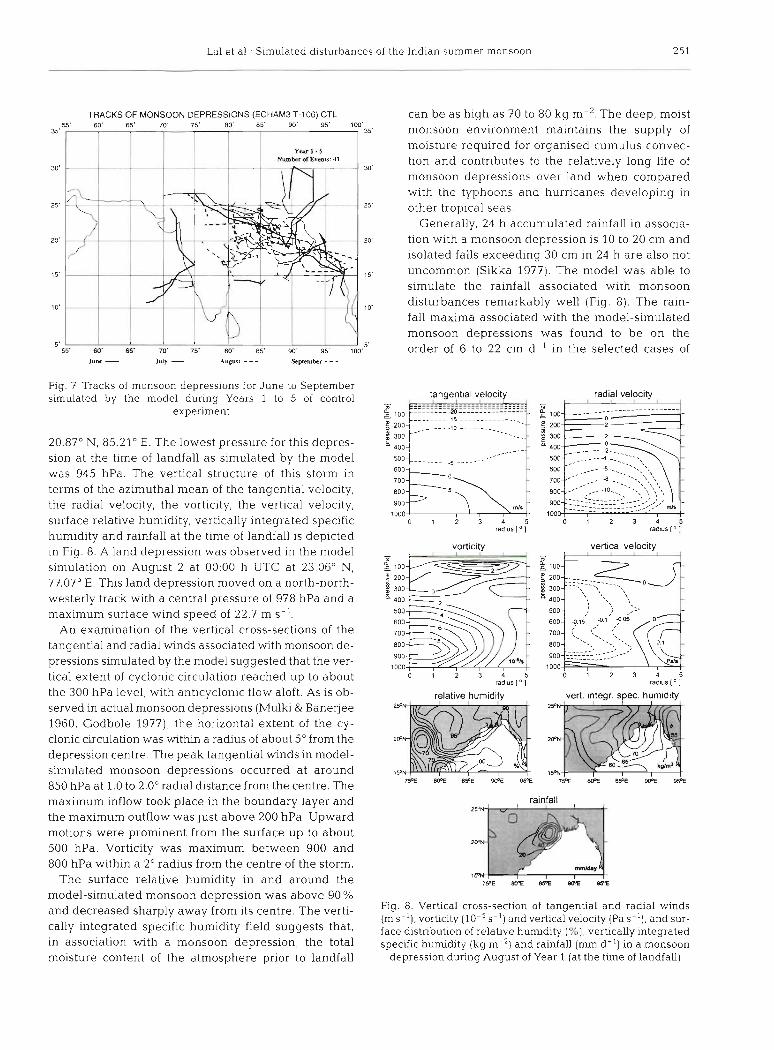
20.87' N, 85.21' E. The lowest pressure for this depres- sion at the time of landfall as simulated by the model was 945 hPa. The vertical structure of this storm in terms of the azimuthal mean of the tangential velocity, the radial velocity, the vorticity, the vertical velocity, surface relative humidity, vertically integrated specific humidity and rainfall at the time of landfall is depicted in Fig. 8. A land depression was observed in the model simulation on August 2 at 00:OO h UTC at 23.06' N, 77.07' E. This land depression moved on a north-north- westerly track with a central pressure of 978 hPa and a maximum surface wind speed of 22.7 m s-I.
An examination of the vertical cross-sections of the tangential and radial winds associated with monsoon de- pressions simulated by the model suggested that the ver- tical extent of cyclonic circulation reached up to about the 300 hPa level, with anticyclonic flow aloft. As is ob- served in actual monsoon depressions (Mulki & Banerjee 1960, Godbole 1977), the horizontal extent of the cy- clonic circulation was within a radius of about 5' from the depression centre. The peak tangential winds in model- simulated monsoon depressions occurred at around 850 hPa at 1.0 to 2.0Â radial distance from the centre. The maximum inflow took place in the boundary layer and the maximum outflow was just above 200 hPa. Upward n~otions were prominent from the surface up to about 500 hPa. Vorticity was maximum between 900 and 800 hPa within a 2' radius from the centre of the storm.
The surface relative humidity in and around the model-simulated monsoon depression was above 90 YO and decreased sharply away from its centre. The verti- cally integrated specific humidity field suggests that, in association with a monsoon depression, the total moisture content of the atmosphere prior to landfall
can be as high as 70 to 80 kg m 2 . The deep, moist monsoon environment maintains the supply of moisture required for organised cun~ulus convec- tion and contributes to the relatively long life of monsoon depressions over land when compared with the typhoons and hurricanes developing in other tropical seas.
Generally, 24 h accumulated rainfall in associa- tion with a monsoon depression is 10 to 20 cm and isolated falls exceeding 30 cm in 24 h are also not uncommon (Sikka 1977). The model was able to simulate the rainfall associated with monsoon disturbances remarkably well (Fig. 8) . The rain- fall maxima associated with the model-simulated monsoon depressions was found to be on the order of 6 to 22 cm d l in the selected cases of
tanoential velocity radial velocity
0 1 2 3 4 5 0 1 2 3 4 5 radius 1 ] radius 1' 1
vorticity
:::b>yi 700
800
900
1000 10%
0 1 2 3 4 5 radius [ ' 1
vertical velocity
0 1 2 3 4 5 radius [ ' ]
relative humidity vert. inteqr. spec. humidity
rainfall
Fig. 8. Vertical cross-section of tangential and radial winds (m s ' ) , vorticity ( l o 5 s l ) and vertical velocity ( P a s 1 ) , and sur- face distribution of relative humidity (%), vertically integrated specific humidity (kg m 2 ) and rainfall (mm d l ) in a monsoon
depression during August of Year 1 (at the time of landfall)
252 Clim Res 5: 243-258, 1995
control T-106 (year 1-5)
8 30 X02 T-106 (year 1-5)
20
10
0
the maximum vertical velocity occurred between 700 and 500 hPa levels (Fig. 10). The vertical thermal structure at the centre of this mid-tropospheric cyclone suggested that it was cold-cored at 700 hPa and warm-cored at 500 hPa. This is in fair agreement with the observations of Miller & Keshavamurty (1968). The system moved northeastwardly with a maximum wind speed of 16.3 m S - ' and produced a peak rainfall of 38 mm d-' before dissipating after 2.5 d.
The model also simulated the interannual variabil- ity in the formation of depressions over the north Bay of Bengal during the summer monsoon season. As is evident from Table 2, the total number of d e ~ r e s -
0 1-2 3-5 64 9-11 12-1516-2021-2526-30 >30 sions simulated by the model varied from 5 in Year 4 day intervals
to 12 in Year 1. A closer look at the model-simulated Fig. 9 Frequency distribution of the time interval between data suggests that a lower number of monsoon any 2 successive depressions (observed and model-simulated) depressions in a particular year could be attributed
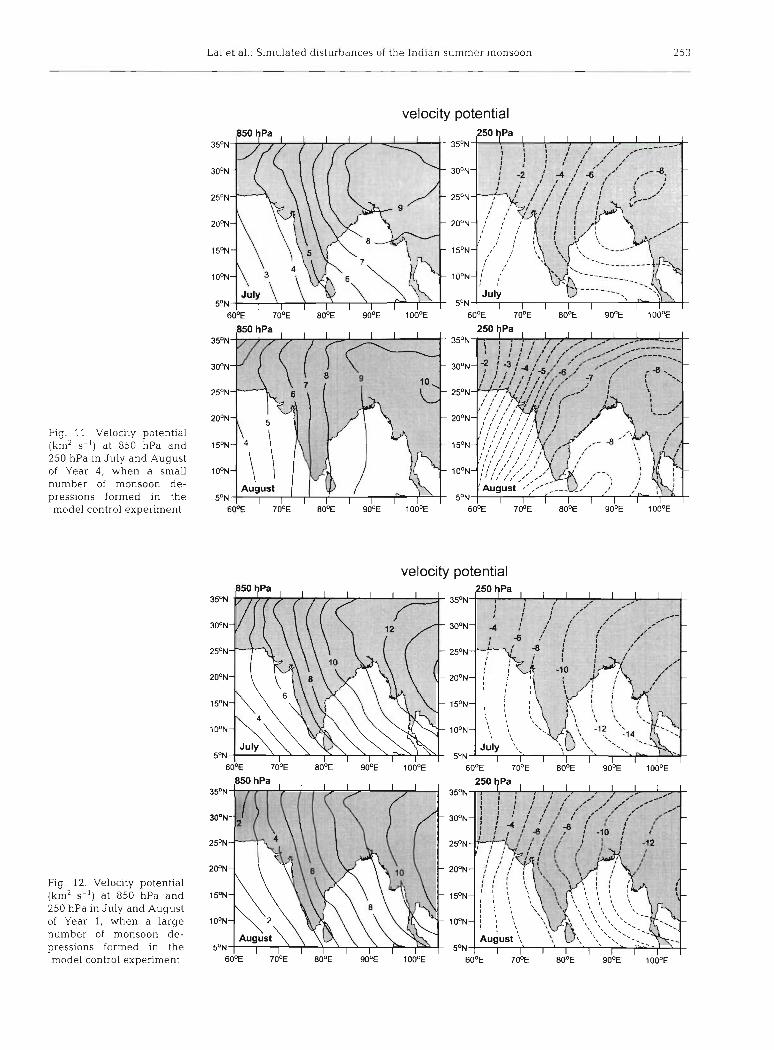
during July and August to the predominantly sinking motion e~forced by large scale convection altering the normal pattern of the Hadley-Walker cell over the region. As is evident
monsoon depressions discussed above. Moreover, the from spatial patterns of velocity potential (a measure simulated rainfall was found to be generally higher of divergent and convergent centres of action) at 850 in the southwest sector for the depressions moving and 250 hPa in Years 1 and 4 (Figs. 11 & 12), the northwestwardly in conformity with observational upper level divergence and lower level convergence records. were much less pronounced in Year 4 relative to
An examination of various climatological aspects of Year 1 over the north Bay of Bengal, which was synoptic disturbances forming in the north Bay of reflected in the comparative rarity of monsoon Bengal during the monsoon season shows that there depressions. was a wide scatter in the time interval between the It is evident from the above that the ECHAM3 successive formation of 2 depressions. This interval model has substantial skill in simulating the present- could be as small as 3 d and even exceed 1 mo day climate and its seasonal cycle over the monsoon (Sikka 1977). However, more depressions were region at T106 resolution. The model simulated the formed in the interval ranging from 3 to 15 d than in structure, intensity, frequency, movement and dura- the interval ranging from 16 to 30 d. A comparison of tion of monsoon depressions quite realistically. In frequency distributions of the time interval between 2 the next section, we discuss the implications of a successive depressions as simulated in our model and doubling of atmospheric CO2 for monsoon climato- based on observed climatology during J u l y and logy in general and for the monsoon disturbances In August is presented in Fig. 9. While the most fre- particular. quently occurring time interval between 2 successive observed monsoon depres- vorticity vertical velocity sions was 6 to 8 d , the model most fre- - I I I I
h quently simulated successive depres- c loo-. ,A.....-.-.--....--.. - 2 loo-- -1
____..-- - - o L I
203 -- sions at a time interval of 12 to 15 d. - A mid-tropospheric cyclone off the g 300--Z Q
west coast of India (19.3" N, 70.7" E) was 400 - --..
530 -l identified in the model-simulated data in Year 1 on June 26 at 00:OO h UTC. The surface pressure at the centre of this
803 -- 800 -...---- --.- system was 998 hPa and the maximum
900- 0- -...--.. - - - surface wind was 16.1 m S-'. An exami- -/ / I PIS .-.--. I I I 1000 -
nation of the vorticitv and vertical veloc- 0 1 2 3 4 5 0 1 2 3 4 5
ity associated with this system indicated radius [ O ] radlus [ O ]
that the peak v O r t i c i t ~ was to a Fig. 10. Vert~cal cross-sectlon of vorticity ( I O - ~ S") and vertlcal veloc~ty region close to the 700 hPa level while (Pa S - ' ) in a model-simulated mid-tropospheric cyclone (June 26, Year 1)
La1 et al.: Simulated disturbances of the Indian summer monsoon 253
velocity potential
Fig. 11 Velocity potential (km' S- ') at 850 hPa and 250 hPa in July and August of Year 4 , when a small number of monsoon de- pressions formed in the model control experiment
Fig. 12. Velocity potential (km2 S-') at 850 hPa and 250 hPa in July and August of Year 1, when a large number of monsoon de- pressions formed in the model control experiment
I I I I I I I I I I 6- 70°E 80°E 90°E 100°E
I I I I I I I I I I 60°E 700E 80°E 90°E 100°E
velocity potential
30°N
2S0N
20°N
1 SON
l DON
5'N 6- 70°E 80°E 90°E 100°E 60°E 700E 80°E 90°E 100°E
Clim Res 5: 243-258, 1995
Climate change scenario: doubled CO2 experiment
The ECHAM3 model at T106 resolution simulates a rise in global mean surface air temperature lS°C on an annual mean basis under doubled CO2 condi- tions. This is marginally higher (by O.lf°C) than the surface air temperature change simulated by the cou- pled atmosphere-ocean climate model (ECHAMl+ LSG) in a transient experiment using the 'Business As Usual' CO2 scenario of the IPCC at the time of CO2 doubling (cf. Cubasch et al. 1992). The annual mean global rise in surface temperature over land regions only is 2.3OC. The greenhouse-gas-induced annual mean surface air temperature increase for the monsoon region under study is l.f°C, slightly more than the global mean temperature rise. The annual mean surface air temperature increase over land regions of the Indian subcontinent is 2.0°C, margin- ally lower than the global mean surface warming. Under doubled CO2 conditions the surface air tem- perature increase over the Indian subcontinent is most pronounced in winter months, when it reaches about 2.50C, During the monsoon season, the Fig. 14. Spatial pattern of change in surface air temperature
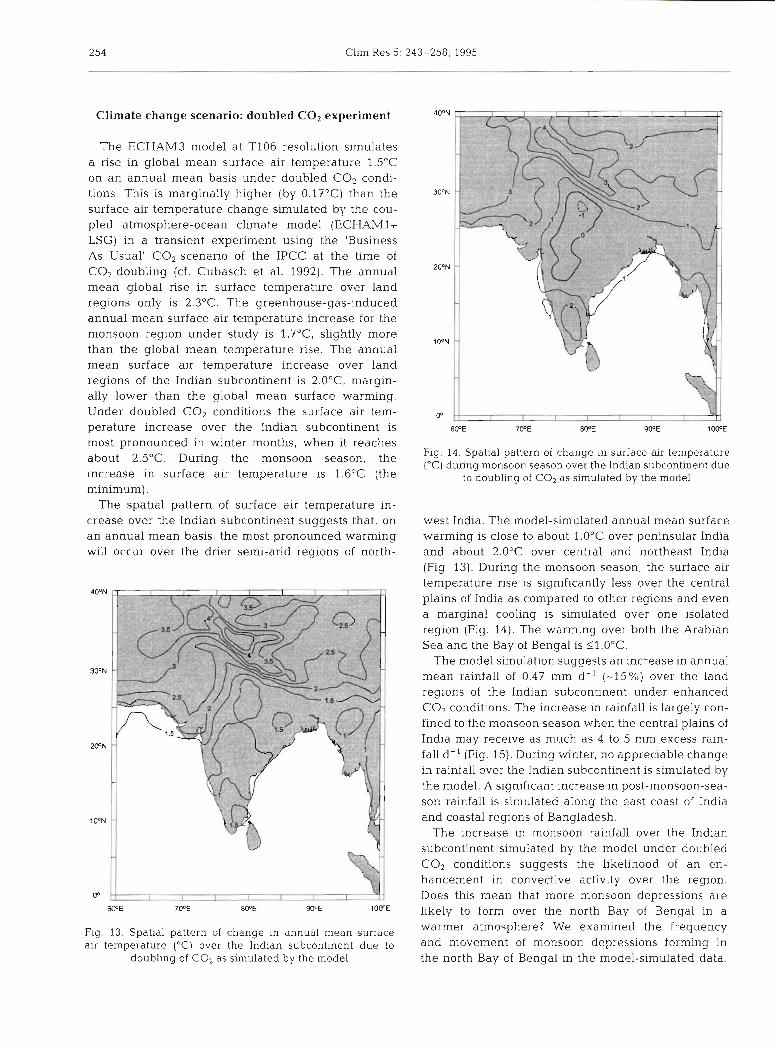
("C) during monsoon season over the Indian subcontinent due increase in surface air temperature is 1.6"C (the to doubl~ng of CO2 as simulated by the model minimum).
The spatial pattern of surface air temperature in- crease over the Indian subcontinent suggests that, on west India. The model-simulated annual mean surface an annual mean basis, the most pronounced warming warming is close to about l.O°C over peninsular India will occur over the drier semi-arid regions of north- and about 2.0°C over central and northeast India
(Fig. 13). During the monsoon season, the surface air temperature rise is significantly less over the central
40°N I I I I L I I P plains of India as compared to other regions and even a marginal cooling is simulated over one isolated region (Fig. 14). The warming over both the Arabian Sea and the Bay of Bengal is ll.O°C.
The model simulation suggests an increase in annual 300N -
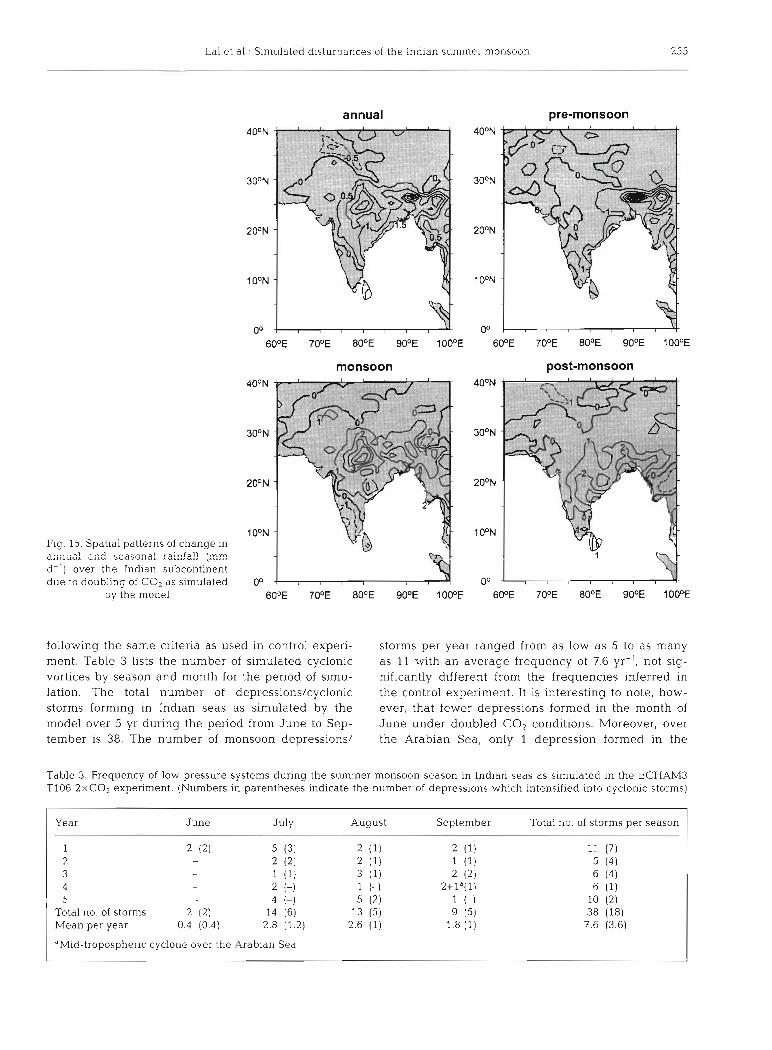
mean rainfall of 0.47 mm d-l (-15%) over the land regions of the Indian subcontinent under enhanced CO2 conditions. The increase in rainfall is largely con-
4 fined to the monsoon season when the central plains of
2CPN - India may receive as much as 4 to 5 mm excess rain- : '? fall d-l (Fig. 15). During winter, no appreciable change in rainfall over the Indian subcontinent is simulated by the model. A significant increase in post-monsoon-sea- son rainfall is simulated along the east coast of India
IWN and coastal regions of Bangladesh. The increase in monsoon rainfall over the Indian
subcontinent simulated by the model under doubled CO2 conditions suggests the likelihood of an en- hancement in convective activity over the region.
00 1 1 1 Does this mean that more monsoon depressions are WE 7 0 0 ~ WE WOE likely to form over the north Bay of Bengal in a
Fig. 13. Spatial pattern of change in annual mean surface warmer We examined the frequency
air temperature ("C) over the Indian subcontinent due to and movement of monsoon depressions forming in doubling of CO2 as simulated by the model the north Bay of Bengal in the model-simulated data,
La1 et al.: Simulated disturbances of the Indian summer monsoon
annual pre-monsoon
Fig. 15. Spatial patterns of change in and ..,.="" "Ã rainfa!! (mm
d l ) over the Indian subcontinent due to doubling of C 0 2 as simulated
by the model
monsoon post-monsoon
following the same criteria as used in control experi- storms per year ranged from as low as 5 to as many ment. Table 3 lists the number of simulated cyclonic as 11 with an average frequency of 7.6 y r ' , not sig- vortices by season and month for the period of simu- nificantly different from the frequencies inferred in lation. The total number of depressions/cyclonic the control experiment. It is interesting to note, how- storms forming in Indian seas as simulated by the ever, that fewer depressions formed in the month of model over 5 yr during the period from June to Sep- June under doubled CO, conditions. Moreover, over tember is 38. The number of monsoon depressions/ the Arabian Sea, only 1 depression formed in the
Table 3. Frequency of low pressure systems during the summer monsoon season in Indian seas as simulated in the ECHAM3 TI06 2xC02 experiment. (Numbers in parentheses indicate the number of depressions which intensified into cyclonic storms)
Year June July August September Total no. of storms per season
1 2 (2) 5 (3) 2 - 2 (2) 3 - 1 (1) 4 - 2 (-) 5 - 4 (-)
Total no. of storms 2 (2) 14 (6) Mean per year 0.4 (0.4) 2.8 (1.2)
"Mid-tropospheric cyclone over the Arabian Sea

256 Clim Res 5: 243-2518, 1995
TRACKS OF MONSOON DEPRESSIONS (ECHAM3 T-106) 2 X CO, ticular region is related to the sea surface tem- 55' 60' 65' 70' 75' 80' 85' 90' 95' 100'
35. perature. However, the upper troposphere is expected to warm more than the surface, partic- ularly in the moist tropical atmosphere, due to
m greenhouse forcing as a consequence of lapse rate- temperature feedback, among other physi-
2s cal processes. Fig. 17 illustrates that the CO2- induced warming over the north Bay of Bengal
m is most pronounced from 300 to 200 hPa during the monsoon season. This should enhance the stability of the moist tropical troposphere in a
15' doubled CO2 atmosphere, thus prohibiting stronger convection and hence intense cyclonic
10' disturbances. Over Indian seas, there is no change in sur-
S face evaporation in a doubled CO2 atmosphere.
55' 60' 65' 70' 75' 80' 85' 90' 95' 100'
June - July - A u p 3 - - - Scpltmber - - - The vertical wind shear already present over the region in the control simulation during the
Fig. 16. Tracks of rnonsoon depressions for June to September a s monsoon season (which prohibits the intensifi- simulated by the model during Years 1 to 5 of the doubled CO2 cation of monsoon depressions to hurricanes)
experiment also is not found to change considerably in the doubled CO2 experiment. A comparison of the vertical thermal structure for the control and
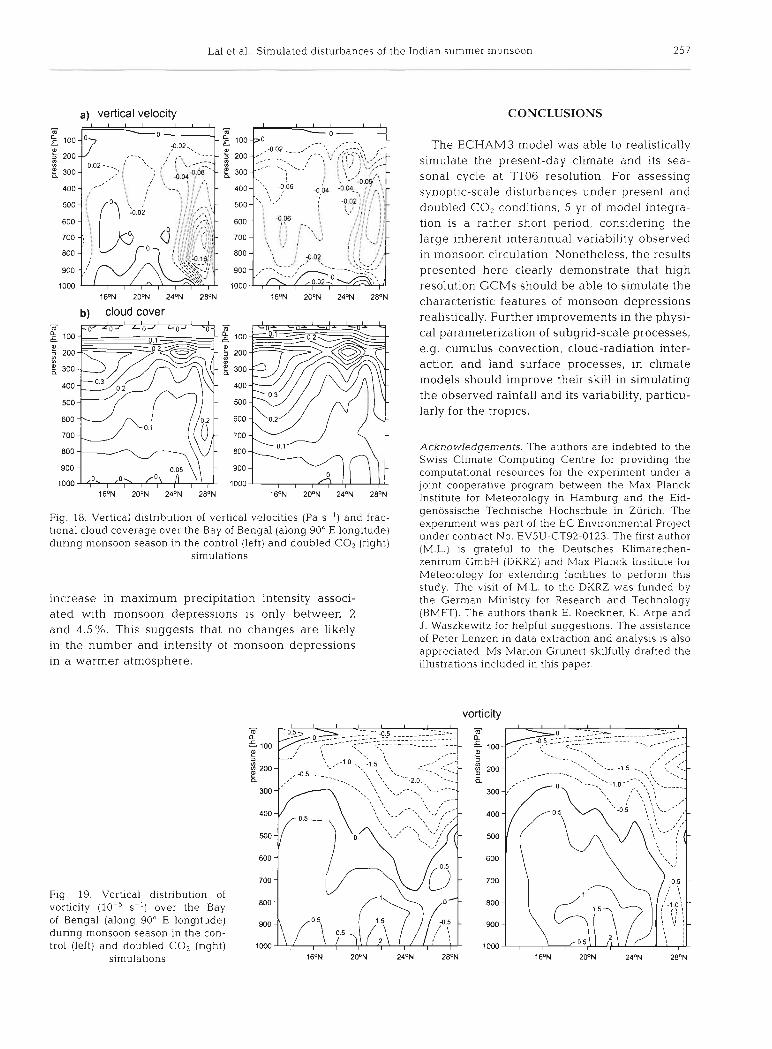
doubled CO2 experiment, as opposed to 3 in the con- doubled CO2 experiments suggests that the tropo- trol experiment. Nonetheless, considering the large pause shifts up to a higher level under enhanced interannual variability in the distribution of depres- CO2 conditions over the Bay of Bengal. This is sup- sions over the Arabian Sea, 5 yr of model integration ported by the stronger vertical velocities and denser are insufficient to draw a firm inference. The tracks upper tropospheric clouds over the region observed of these monsoon depressions as simulated by the under doubled CO2 conditions (Fig. 18). However, model in the doubled CO2 experiment are illustrated there is no significant change in the vertical structure in Fig. 16. Almost all the depressions developing in of vorticity over the region (Fig. 19). The average July and August followed a northwesterly track
sure or maximum wind speed were observed for the depressions developing in the 2 X CO2 experiment relative to the control experiment. Also, fewer depressions intensified into cyclonic storms in the doubled CO2 experiment as compared to the control experiment. However, the average duration of mon- soon depressions in July and August increased by 0.9 and 1.2 d , respectively, in the doubled CO2 simula- tion. This could be attributed to an increased source of energy at the warmer and wetter land surface and the higher water-holding capacity of a warmer atmo- spere.
Upon first consideration it is reasonable to assume that global warming could induce higher sea surface temperatures, which m ~ g h t favour a higher frequency of cyclonic vortices in susceptible locations including the Indian seas. Emanuel (1988), using the concept of the Carnot engine, provided a convincing argument that the maximum possible hurricane intensity in a par-
while those in September had a tendency to be more variable in their path of movement, as noticed for the temperature change [ O C ]
Fig. 17. Change in thermal structure of the atmosphere over the Bay of Bengal (along 90" E longitude) during monsoon
season due to doubling of CO,
disturbances developing in the control simulation. No - significant changes in either the lowest central pres- E
l l I I l I I I [ ~----_____._____----- l
La1 et al. Simulated disturbances of the Indlan summer monsoon 257
-
a) vertical velocity CONCLUSIONS
b) cloud cover
Fig. 18. Vertical distribution of vertical velocities (Pa S - ' ) and frac- tlonal cloud coverage over the Bay of Bengal (along 90" E longitude) during monsoon season In the control (left) and doubled CO2 (right)
simulations
increase in maximum precipitation intensity associ- ated with monsoon depressions is only between 2 and 4 . 5 % . This suggests that no changes are likely in the number and intensity of monsoon depressions in a warmer atmosphere.
Fig. 19. Verhcal distribution of vorhcity (10-5 S- ' ) over the Bay of Bengal (along 90" E longitude) during monsoon season in the con- trol (left) and doubled CO2 (nght)
simulations
The ECHAM3 model was able to realistically simulate the present-day climate and its sea- sonal cycle at T106 resolution. For assessing synoptic-scale disturbances under present and doubled CO2 conditions, 5 yr of model integra- tlon is a rather short period, considering the large inherent interannual variability observed in monsoon circulation. Nonetheless, the results presented here clearly demonstrate that high resolution GCMs should be able to simulate the characteristic features of monsoon depressions realistically. Further improvements in the physi- cal parameterization of subgrid-scale processes, e.g. cumulus convection, cloud-radiation inter- action and land surface processes, in climate models should improve their skill in simulating the observed rainfall and its variability, particu- larly for the tropics.
Acknowledgements The authors are Indebted to the SWISS Climate Computing Centre for providing the computational resources for the experiment under a jolnt cooperative program between the hdax Planck Institute for Meteorology In Hamburg and the Eid- genossische Technische Hochschule In Zunch The experiment was part of the EC Environmental Project under contract No EV5U-CT92-0123 The first author (M L ) 1s grateful to the Deutsches Kllmarechen- zenrrum GmbH (DXiiZj dnci ividx P i d r ~ ~ k ~ I I ~ L I L U L ~ I U I
Meteorology for extending faclhties to perform thls study The visit of M L to the DKRZ was funded by the German Mlnistry for Research and Technology (BMFT) The authors thank E Roeckner, K Arpe and J Waszkewitz for helpful suggestions The asslstance of Peter Lenzen in data extraction and analys~s IS also appreciated MS Marion Grunert skilfully drafted the illustrat~ons included In this paper
vorticity

Clim Res 5: 243-258. 1995
LITERATURE CITED
Arpe K, Bengtsson L, Diimenil L, Roeckner E 11994) The hydrological cycle in the ECHAM3 simulations of the atmospheric circulation. In: Desbois M, Desalmond F (eds) Global precipitation and climate change NATO AS1 Series 26(1):361-377
Bengtsson L, Botzet M, Esch M (1995a) Hurricane-type vor- tices in a general circulation model. Tellus 47A:175-196
Bengtsson L, Botzet M, Esch M (1995b) Will greenhouse gas- induced warming over the next 50 years lead to higher frequency and greater ~ntensity of hurricanes? Tellus (in press)
Brinkop S (1991) Inclusion of cloud processes in the ECHAM PBL parameterization. Met Inst Univ. Hamburg, Large Scale Atmospheric Modelling Rep No 9 2 - 14
Cubasch U, Hasselmann K, Hock H, Maier-Reimer E, Miko- lajewicz U, Santer BD, Sausen R (1992) Time-dependent greenhouse warming computations with a coupled ocean- atmosphere model. Clim Dyn 8:55-69
Cubasch U, Waszkewitz J , Hegerl G, Perlwitz J (1995) Regional climate changes as simulated In time-slice ex- periments. Max Planck Institute. Hamburg, Rep No 153
DKRZ (1992) The ECHAM3 atmospheric general circulation model. Deutsches Klimarechenzentrum, Hamburg, Tech Rep No 6
Dumenil L, Todini E (1992) A rainfall-runoff scheme for use in Hamburg GCM. Eur Geophys Soc Ser hydrolog Sci 1: 129- 157
ECMWF (1993) The description of the ECMWF/WCRP Level 111-A global atmosphere data archive. Technical Attachment of European Centre for Medium Range Weather Forecasts, Shinfield Park, Reading, Berks RG2 9AX, UK
Emanuel KA (1988) Towards a general theory of hurricanes. Am Sci 371 -379
Gleckler PJ, Randall DA, Boer G, Colmann R. Dix M, Galin V. Helfand M, IOehl J, k t o h A, Lau W, Liang X, Lykossov V, McAvaney B, Miyakoda K, Planton S (1994) Cloud- radiative effects on implied oceanic energy transports as simulated by atmospheric general circulation models. PCMDI Rep No 15, PCMDI/LLNL, Llvermore, CA
Godbole RV (1977) The composite structure of the monsoon depression. Tellus 29:25-40
Hense A, Kerschgens M. Raschke E (1982) An economical method for computing radiative transfer in general circu- lation models. Q J R Meteorol Soc 108:231-252
Joseph PV, Raman PL (1966) Existence of low level westerly let stream over peninsular India dunng July. Ind J Met Geophys 1.7:40?-410
Keshavamurty RN, Sankar Rao M (1992) The physics of monsoons. Allied Publishers Ltd, New Delhi
La1 M (1993) Simulation of present-day monsoon rainfall climatology with ECHAM model: impact of physical parameterisation and resolution. In: Boer GJ (ed) WMO/ CAS-WGNE Rep No 18, Research activities In atmospheric and oceanic modelling. WMO-TD No 533. 4 18-4.20
Legates DR. Willmott CJ (1990a) Mean seasonal and spatial
Editor: C. Esser, GieOen, Germany
variability in global surface air temperature. Theor appl Climatol41:ll-21
Legates DR, Willmott CJ (1990b) Mean seasonal and spatial variability in gauge-corrected global precipitation. J CLimatol 10~111- 127
Louis JF (1979) A parametric model of vertical eddy fluxes in the atmosphere. Bound Layer Meteorol 17:187 -202
Mandal GS (1991) Tropical cyclones and their forecasting and warning systems in the north Indian ocean. WMO Tropical cyclone ~rogramme Rep No TCP-28, WMO-TD No 430, p 430
Miller PR, Keshavamurthy RN (1968) Structure of an Arabian Sea summer monsoon system. Meteorological Mono- graph, East-West Centre Press, Hawaii
Miller MJ, Palmer TN, Swinbank R (1989) Parameterization and influence of sub-grid scale orography in general cir- culation and numerical weather prediction models. Met Atmos Phys 40234 - 109
Mulh G, Banerjee AK (1960) The mean upper wind circula- tion around monsoon depress~ons in India. J Meteorol 17: 8-14
Palmer TN, Shutts GJ, Swinbank R (1986) Alleviation of a sys- tematic westerly bias in general circulation and numerical weather prediction models through an orographic gravity wave drag parameterization. Q J R Meteorol Soc 112: 1001-1031
Perlwitz J , Cubasch U, Roeckner E (1993) Time-slice climate change experiments. In: Boer GJ (ed) WMO/CAS-WGNE Rep No 18, Research Act~vities in Atmospheric and Oceanic Modelling. WMO-TD No 533, 9.9
Rao YP (1976) Southwest monsoon. Meteorological Mono- graph No 1, India Meteorological Department, New Delhi
Rockel B, Raschke E, Weynes B (1991) A parameterization of broad band radiative transfer properties of water, ice and mixed clouds. Beitr Phys Atmos 64:l- 12
Roeckner E, Arpe K, Bengtsson L, Brinkop S, Dumenil L, Esch M, Kirk E, Lunkeit F, Ponater M, Rockel B, Sausen R, Schlese U, Schubert S, Windelband M (1992) Simulation of the present-day climate with the ECHAM model: impact of model physics and resolution. Max Planck Insti- tute, Hamburg, Rep No 93
Roeckner E , heland M, Keup E (1991) M o d e h g of cloud and radiation in the ECHAM model. Proc ECMWF/WCRP Workshop on Clouds, Radiative Transfer and Hydro- logical Cycle, Nov 12-15, 1990. ECMWF, Reading, p 199-222
Sikka DR (1977) Some aspects of the life history, structure and movement of monsoon depressions. Pure appl Geophys 3 15:1501- 1529
Sikka DR, Paul DK (1975) A d~agnostic study on the structure of monsoon depression. Proc Geophysical Fluld Dyna- mics Workshop, Indian Institute of Science, Bangalore. p 136-182
Sundqvist H (1978) A parameterization scheme for non- convective condensation including prediction of cloud water content. Q J R Meteorol Soc 104~677-690
Tiedtke IM (1989) A comprehensive mass flux scheme for cum.ulus pararneterization in 1.arge sca1.e models. Mon Weather Rev 117:1779- 1800
Manuscript first received: February 9, 1995 Revised version accepted: May 22, 1995