synoptic meteorology i - university of...
TRANSCRIPT

Synoptic Meteorology I
Surface Analysis
Surface Plotting
1. obtain METAR reports
2. decode METAR
3. plot METAR

Surface PlottingKIRK 270853Z 20013KT 9SM –RA OVC040 28/17 A2991 RMK A02 SLP129 8/5// T02780172 57020=
82
639
129-20••

Surface Plotting
ddVV ww
TT
TdTdCL
CM
CH
NPPPppp a
fffRRR
N = sky conditions
TT = temperature
TdTd = dew point temp.
dd = wind direction
fff= wind speed
VV = visibility
ww = weather type
CH = prevailing cloud genus in high etage
CM = prevailing cloud genus in middle etage
CL = prevailing cloud genus in low etage
PPP = abbreviated sea level pressure
ppp = pressure change
a = symbol for pressure tendency
RRR = precipitation since last report
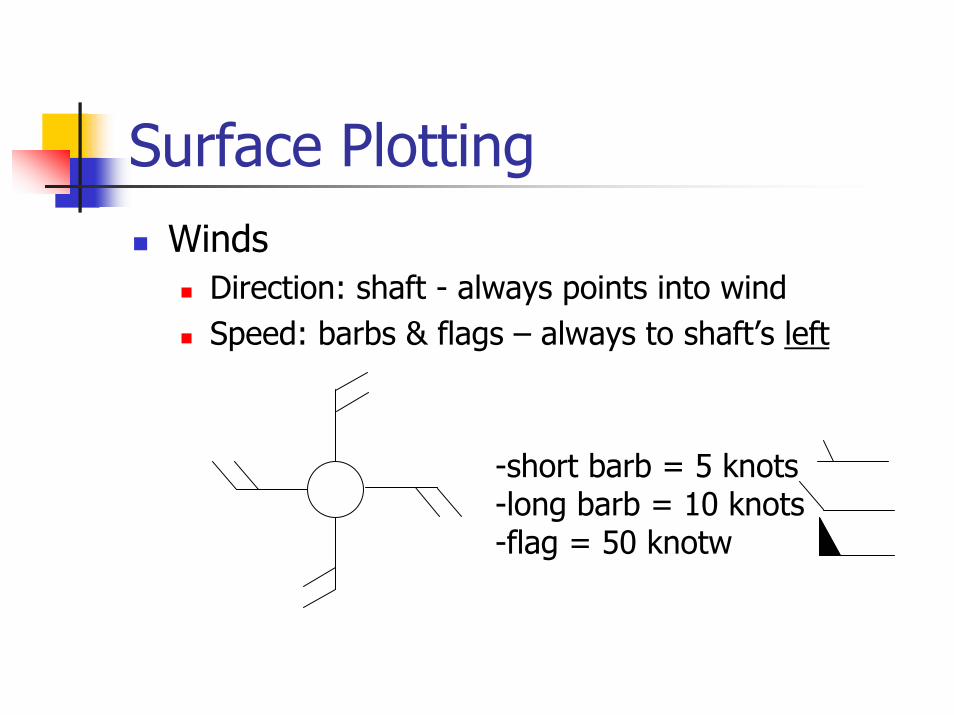
Surface PlottingWinds
Direction: shaft - always points into windSpeed: barbs & flags – always to shaft’s left
-short barb = 5 knots-long barb = 10 knots-flag = 50 knotw
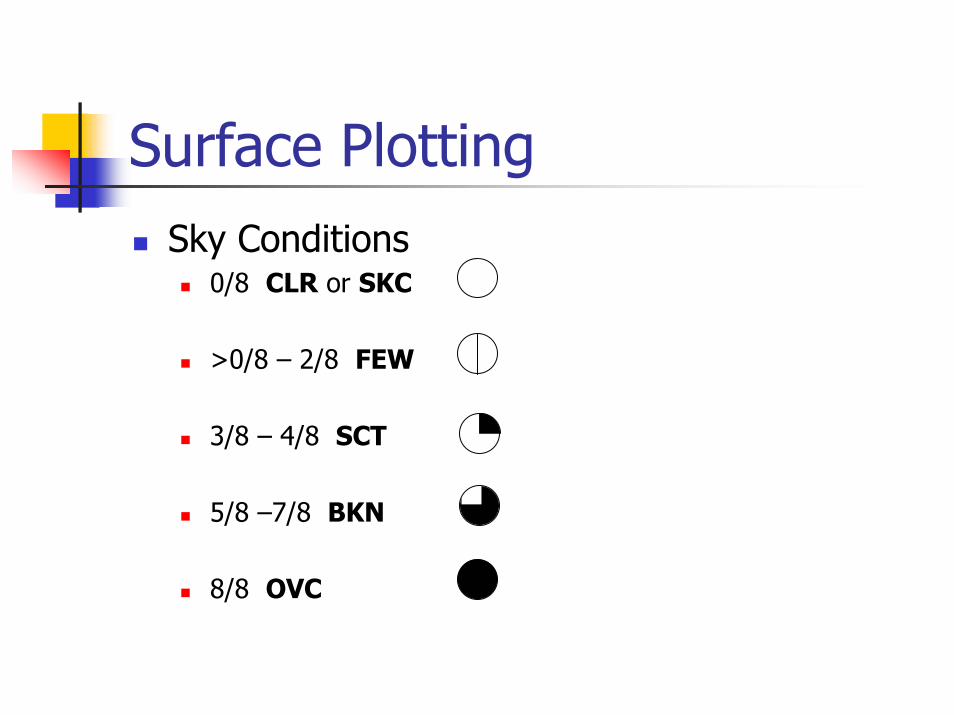
Surface PlottingSky Conditions
0/8 CLR or SKC
>0/8 – 2/8 FEW
3/8 – 4/8 SCT
5/8 –7/8 BKN
8/8 OVC

Surface Plotting
TemperaturesConvert 0C to 0F in the U.S.Use T group in RMK section of METAR
If T group is unavailable, convert METAR body oC to oF and round to the nearest degree.
< 88.5 = 88> 88.5 = 89
Surface Plotting
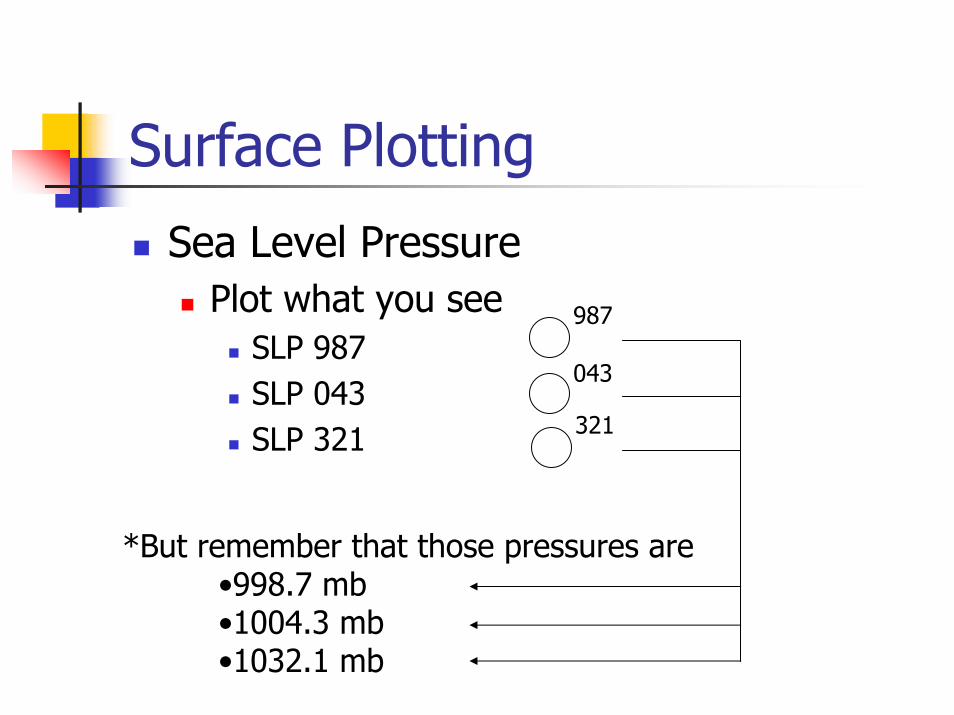
Sea Level PressurePlot what you see
SLP 987SLP 043SLP 321
987
043
321
*But remember that those pressures are•998.7 mb•1004.3 mb•1032.1 mb
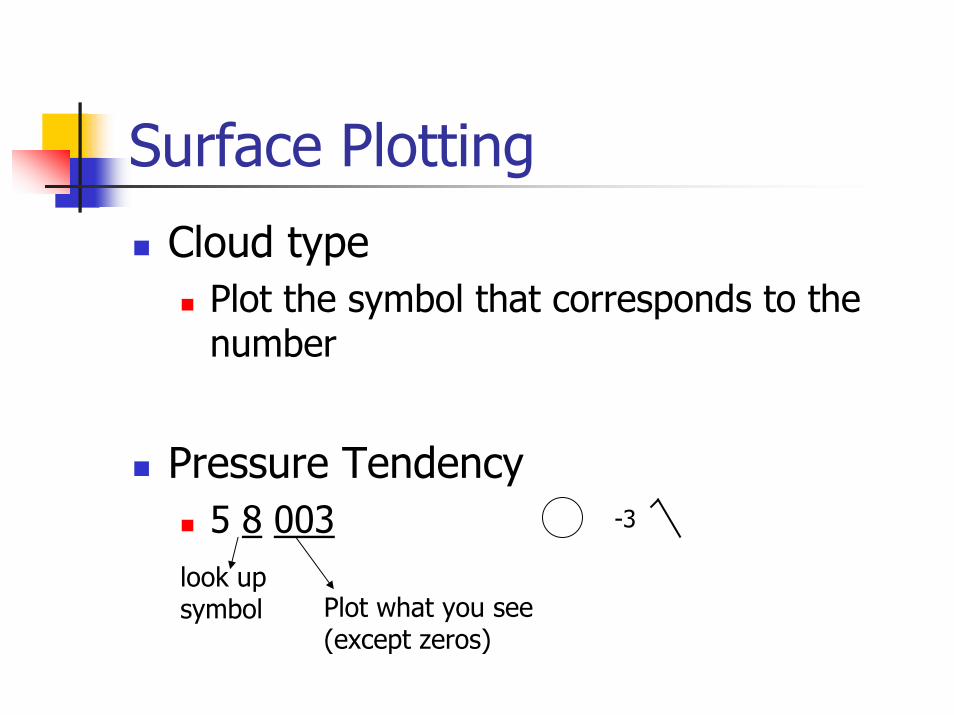
Surface Plotting
Cloud typePlot the symbol that corresponds to the number
Pressure Tendency5 8 003
look upsymbol Plot what you see
(except zeros)
-3
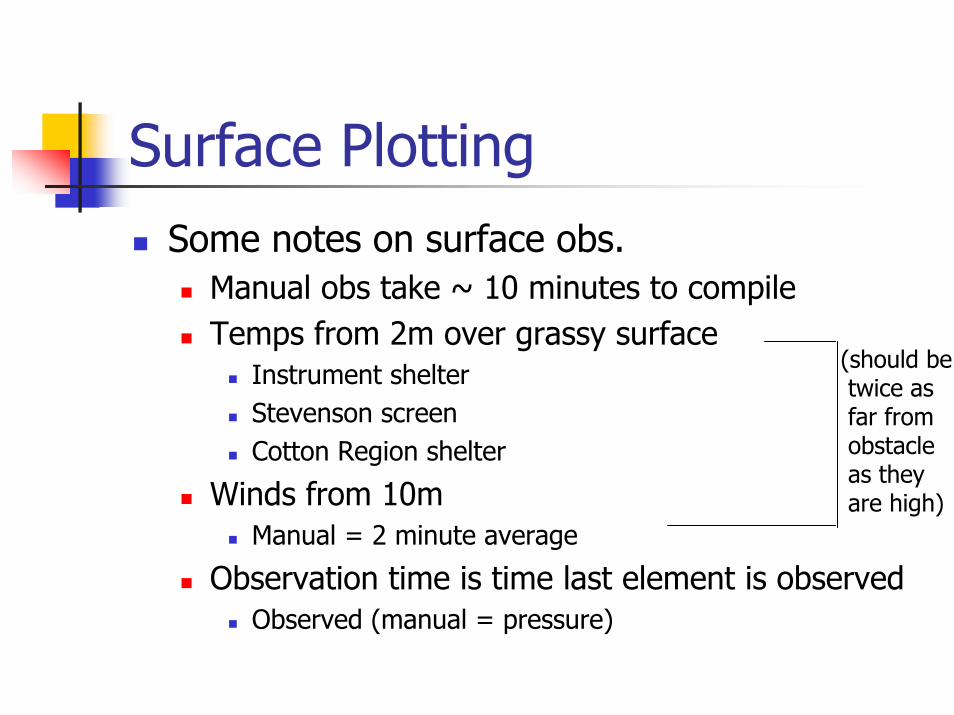
Surface PlottingSome notes on surface obs.
Manual obs take ~ 10 minutes to compileTemps from 2m over grassy surface
Instrument shelterStevenson screen Cotton Region shelter
Winds from 10mManual = 2 minute average
Observation time is time last element is observedObserved (manual = pressure)
(should be twice as far from obstacleas they are high)
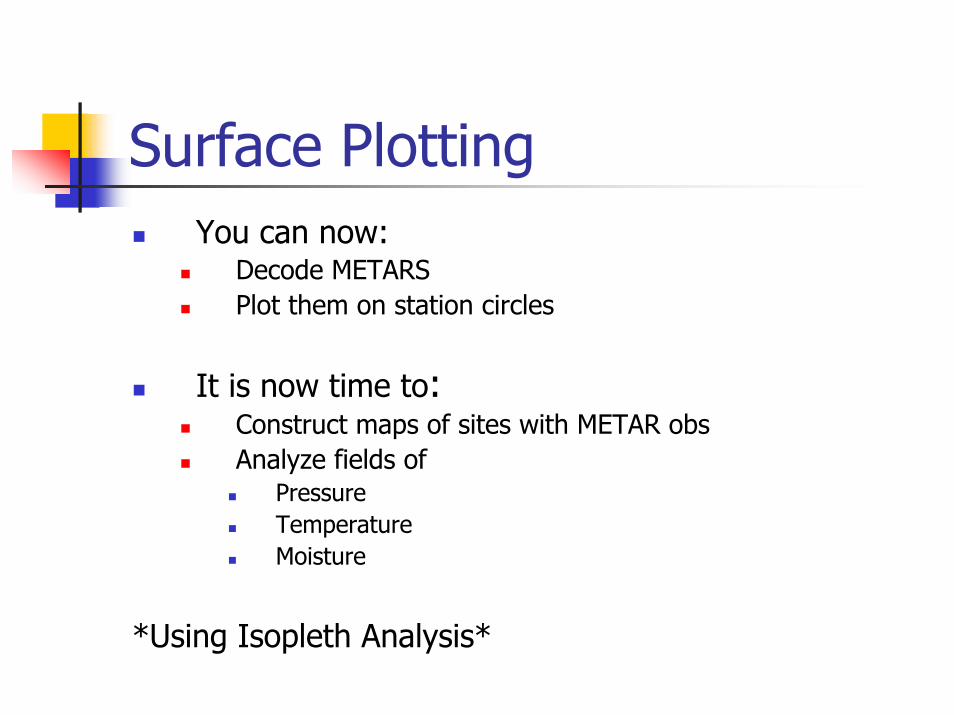
Surface PlottingYou can now:
Decode METARSPlot them on station circles
It is now time to:Construct maps of sites with METAR obsAnalyze fields of
PressureTemperatureMoisture
*Using Isopleth Analysis*
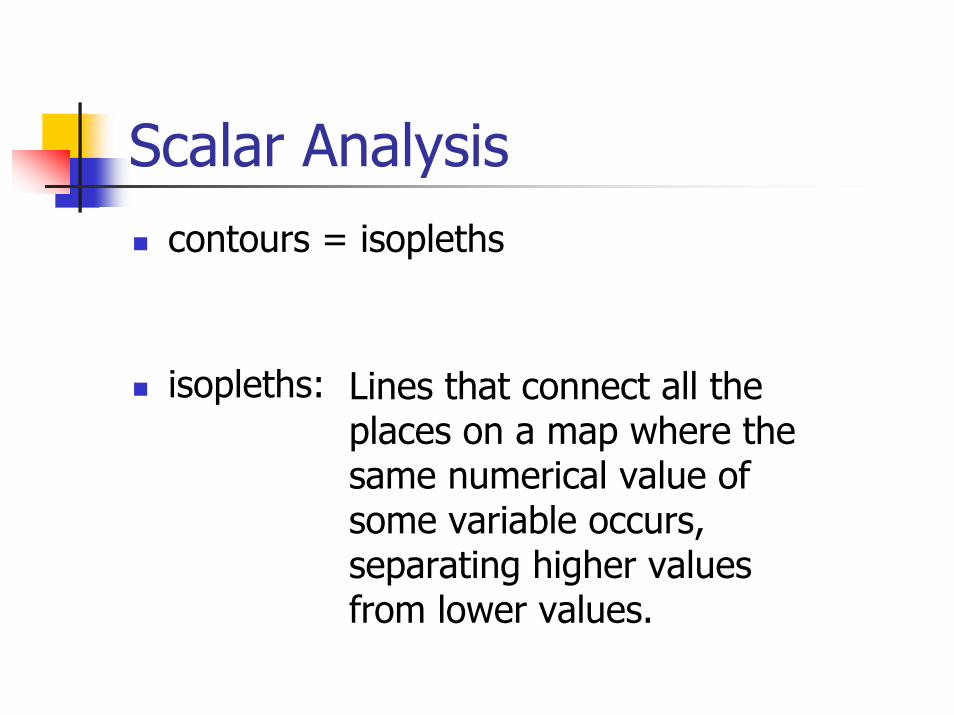
Scalar Analysiscontours = isopleths
isopleths: Lines that connect all the places on a map where the same numerical value of some variable occurs, separating higher values from lower values.
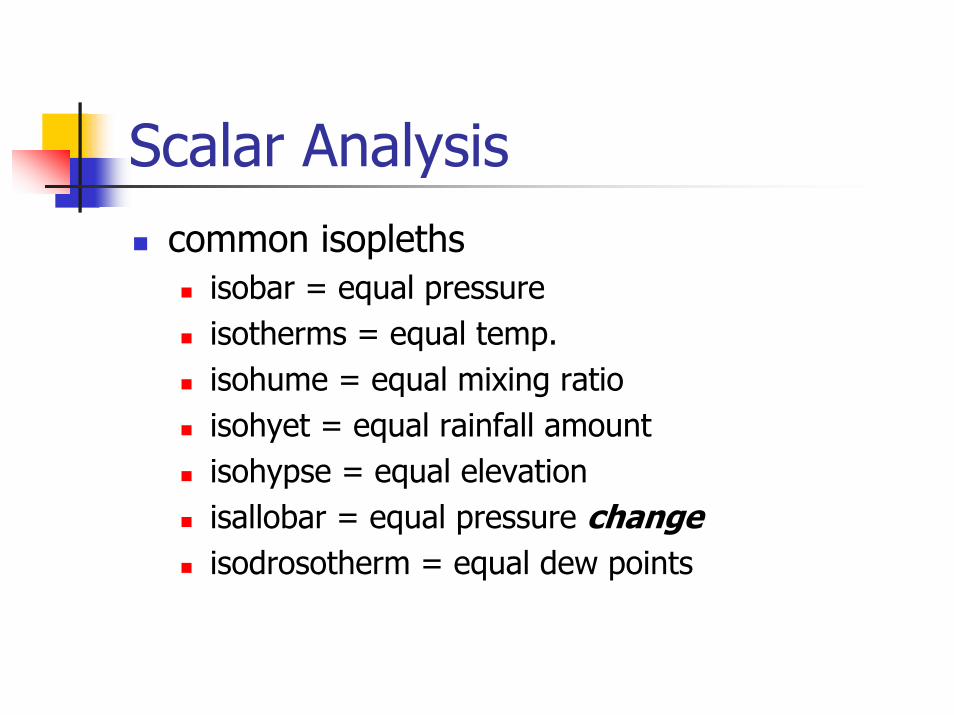
Scalar Analysiscommon isopleths
isobar = equal pressureisotherms = equal temp.isohume = equal mixing ratioisohyet = equal rainfall amountisohypse = equal elevationisallobar = equal pressure changeisodrosotherm = equal dew points
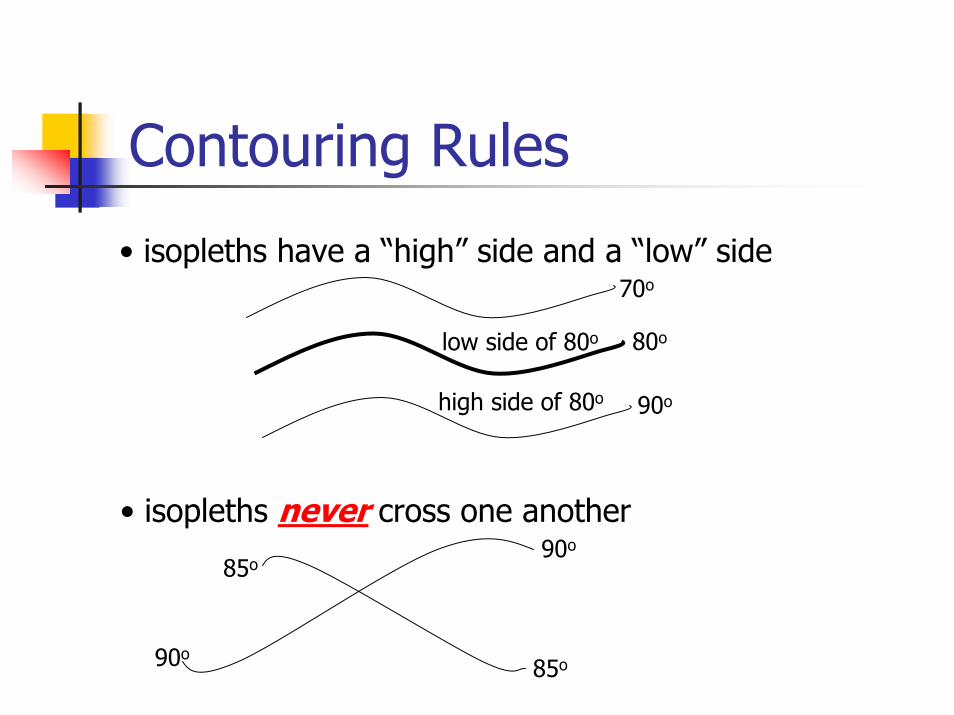
Contouring Rules
• isopleths have a “high” side and a “low” side
low side of 80o
70o
80o
high side of 80o 90o
• isopleths never cross one another
90o
85o
85o
90o
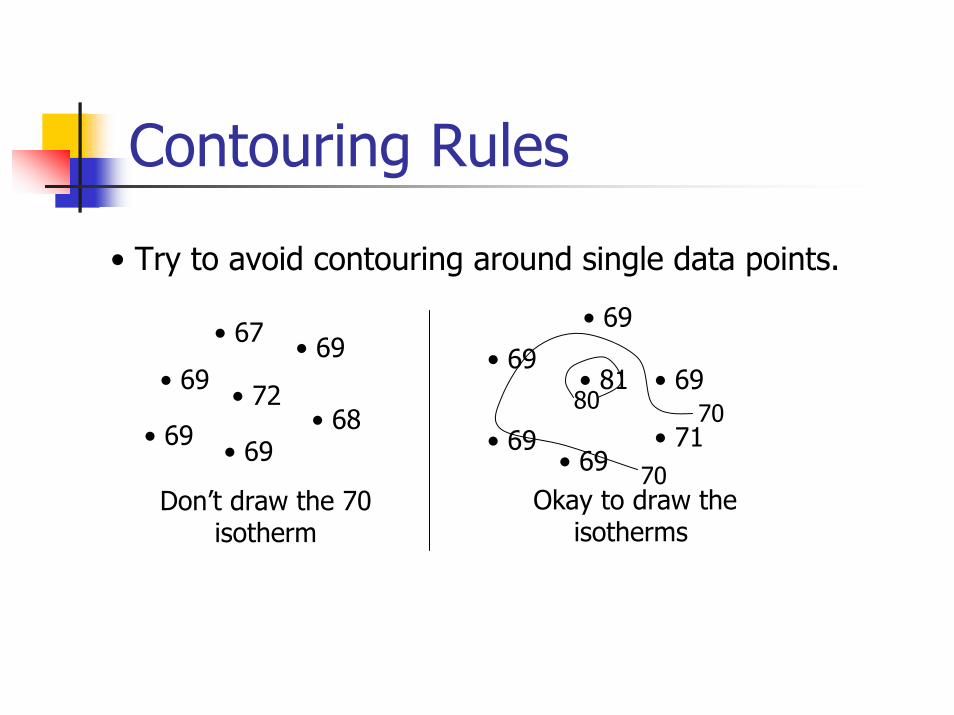
Contouring Rules
• Try to avoid contouring around single data points.
• 69
• 69
• 69
• 69
• 69• 71
• 8180 70
70Okay to draw the
isotherms
• 67
• 69
• 69 • 69• 68
• 69
• 72
Don’t draw the 70isotherm
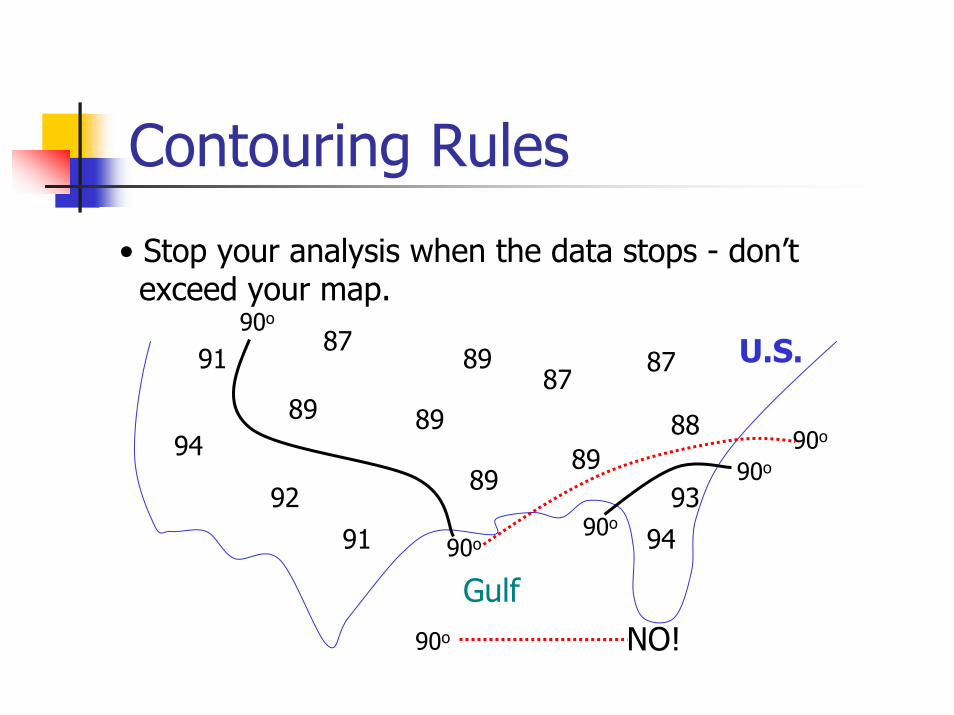
Contouring Rules
• Stop your analysis when the data stops - don’t exceed your map.
94
87
92
91
91
89 8787
89
89 88
94
93
89
90o
90o
90o
90o90o
90o NO!
89
U.S.
Gulf
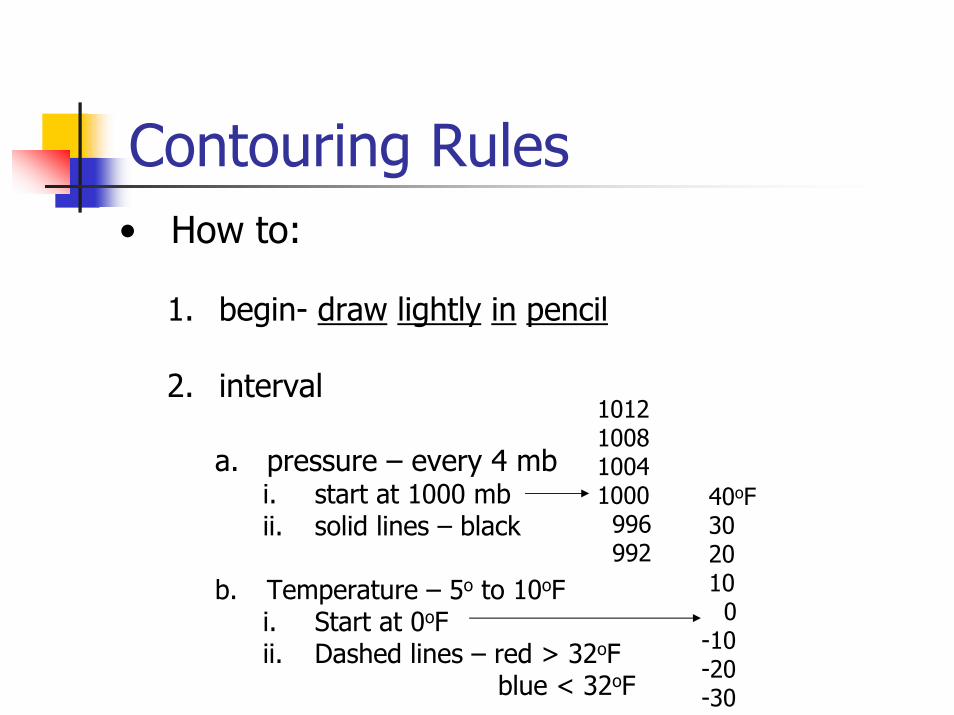
Contouring Rules• How to:
1. begin- draw lightly in pencil
2. interval
a. pressure – every 4 mbi. start at 1000 mbii. solid lines – black
b. Temperature – 5o to 10oFi. Start at 0oFii. Dashed lines – red > 32oF
blue < 32oF
40oF302010
0-10-20-30
1012100810041000
996992
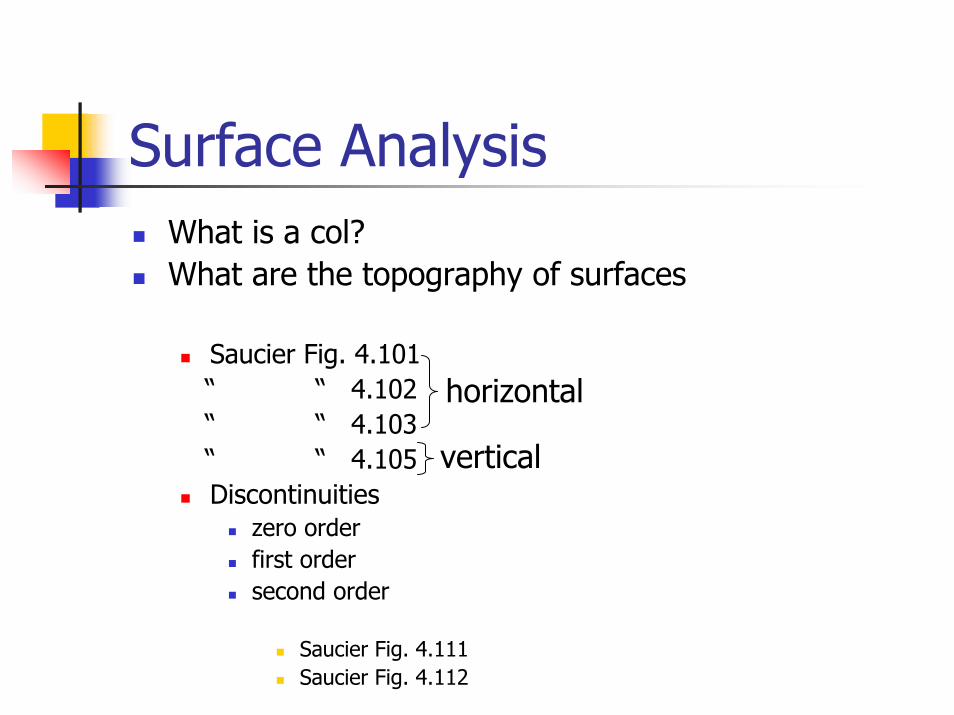
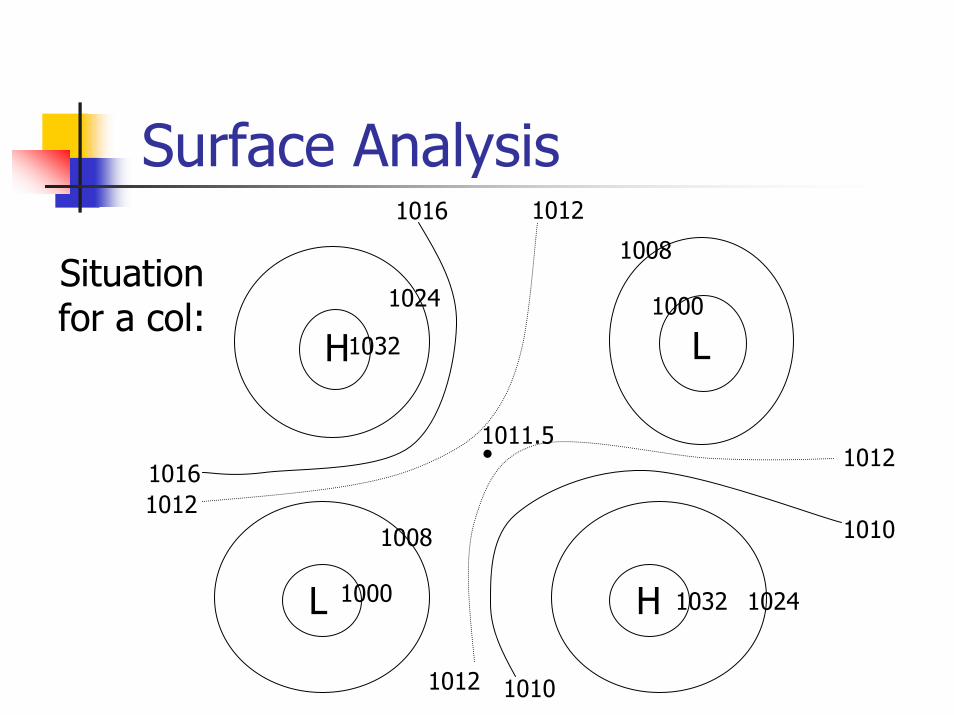
Surface AnalysisWhat is a col?What are the topography of surfaces
Saucier Fig. 4.101“ “ 4.102“ “ 4.103“ “ 4.105Discontinuities
zero orderfirst ordersecond order
Saucier Fig. 4.111Saucier Fig. 4.112
horizontal
vertical
Surface Analysis
H
H
L
L
•1011.5
1032
1024
1016 1012
10161012
1000
1008
1012
1010
10241032
1012 1010
1008
1000
Situation for a col:
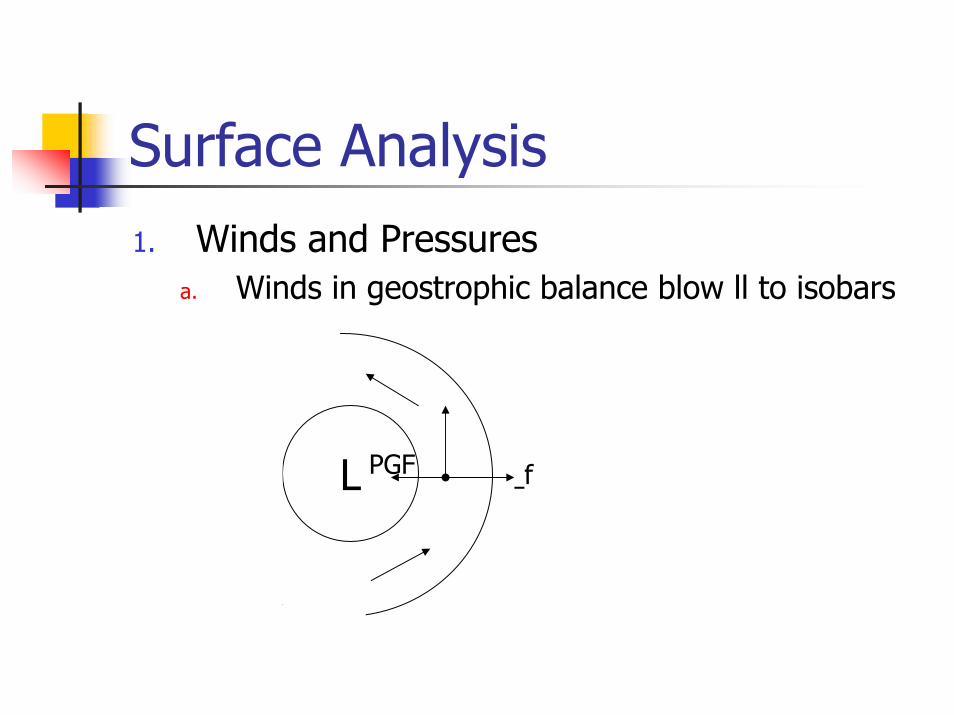
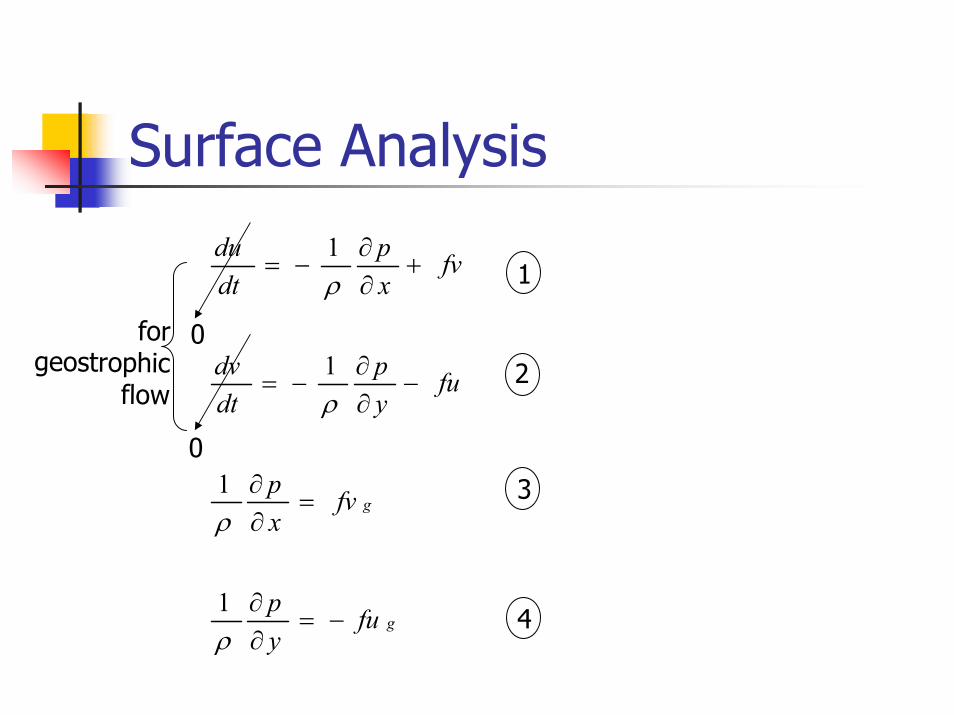
Surface Analysis 1. Winds and Pressures
a. Winds in geostrophic balance blow ll to isobars
L PGF f
Surface Analysis
g
g
fuyp
fvxp
fuyp
dtdv
fvxp
dtdu
−=∂∂
=∂∂
−∂∂
−=
+∂∂
−=
ρ
ρ
ρ
ρ
1
1
1
1
0
0
forgeostrophic
flow
1
2
3
4
Surface Analysis1. Winds and Pressures cont.
a. Isobaric spacing should change gradually from one location to the next.
b. Sharp change (and increased winds) may suggest a front.
c. True warm sector of ETC is barotropic (isobars ~ straight; ll to 500 mb contours)Φ
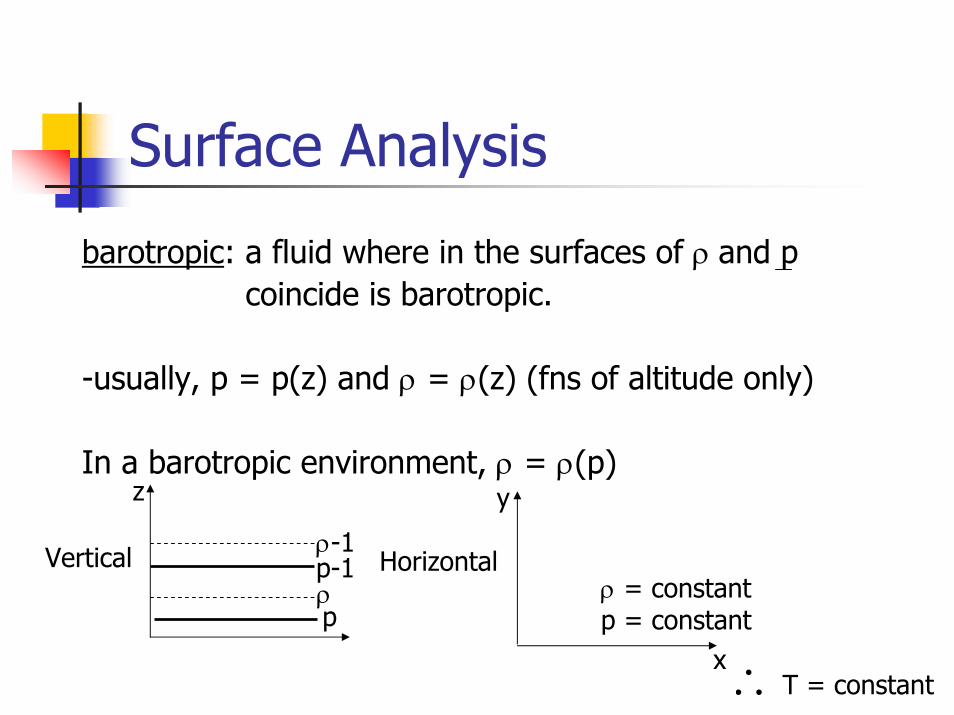
Surface Analysis
barotropic: a fluid where in the surfaces of ρ and p coincide is barotropic.
-usually, p = p(z) and ρ = ρ(z) (fns of altitude only)
In a barotropic environment, ρ = ρ(p)z y
ρ
ρ-1
p
p-1Vertical Horizontalρ = constantp = constant
x ∴T = constant
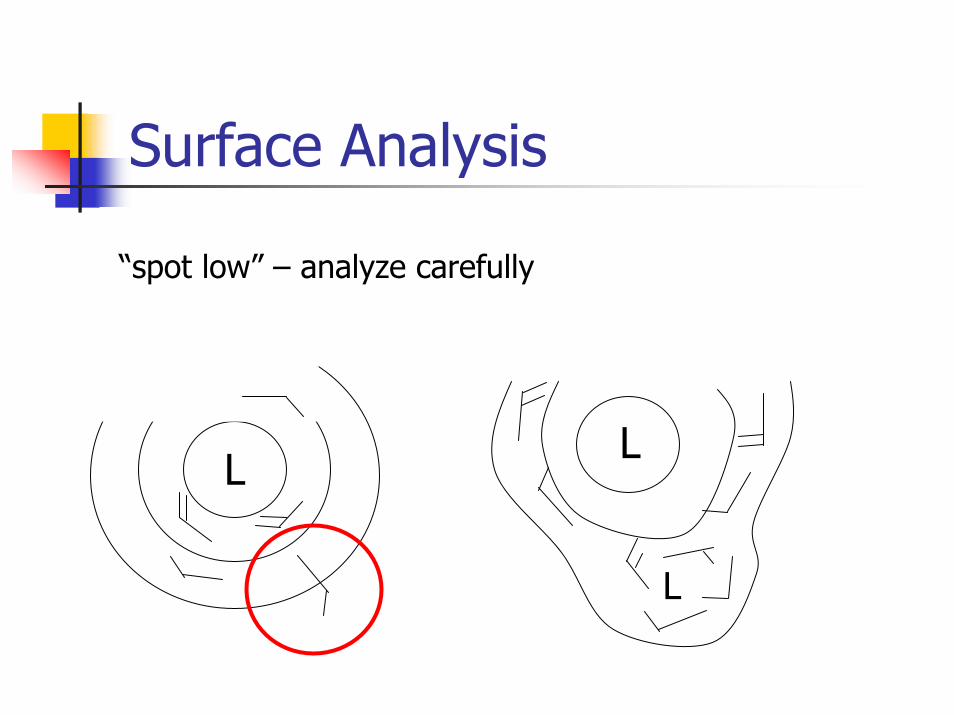
Surface Analysis
“spot low” – analyze carefully
LL
L
Surface Analysis
Pressure TendenciesBeware of stations with pressure tendencies +/- 0.3 mbNot every “check” tendency indicates a front Not all fronts are followed by a pressure increasePressure may fall behind an occlusion
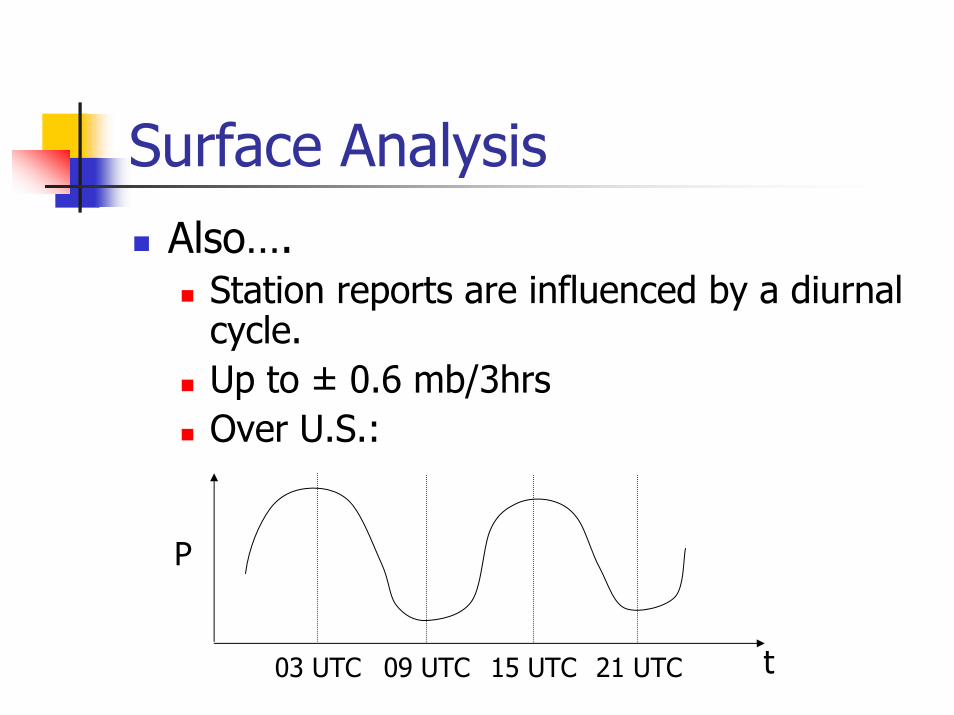
Surface AnalysisAlso….
Station reports are influenced by a diurnal cycle.Up to ± 0.6 mb/3hrsOver U.S.:
t
P
03 UTC 09 UTC 15 UTC 21 UTC
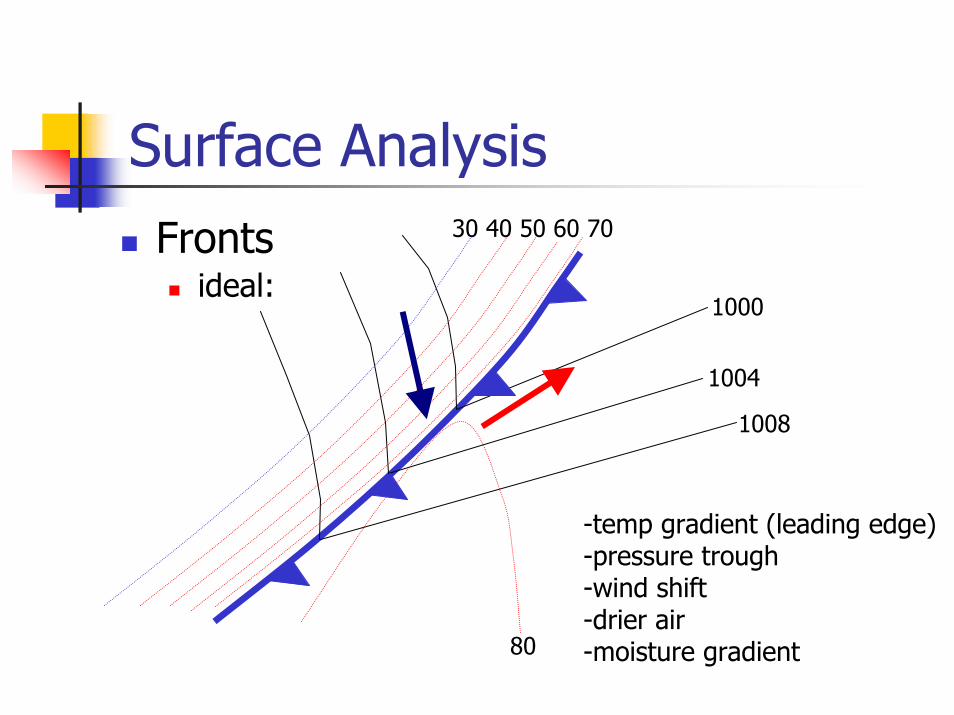
Surface AnalysisFronts
ideal:
30 40 50 60 70
80
1000
1004
1008
-temp gradient (leading edge)-pressure trough-wind shift-drier air-moisture gradient
Surface AnalysisFront: a zone of transition between
different air masses
Found by:1. Changes is temperature2. Changes in moisture3. Changes in wind direction/speed4. Changes in pressure5. Changes in clouds precipitation
Surface Analysis
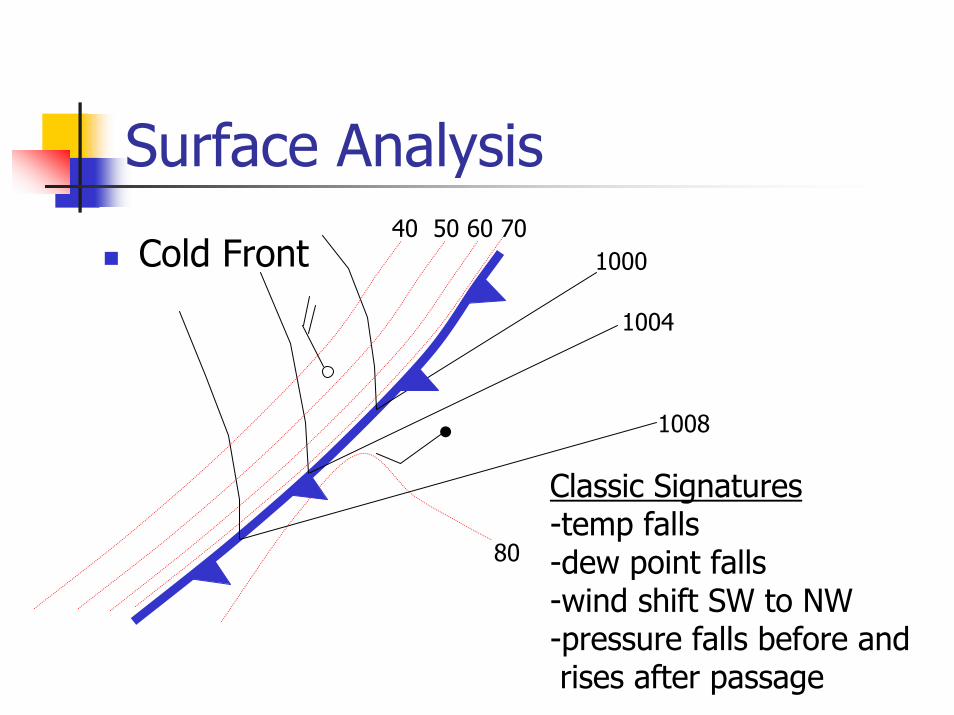
Cold Front40 50 60 70
1000
1004
1008
80
•
Classic Signatures-temp falls-dew point falls-wind shift SW to NW-pressure falls before and rises after passage
Surface Analysis
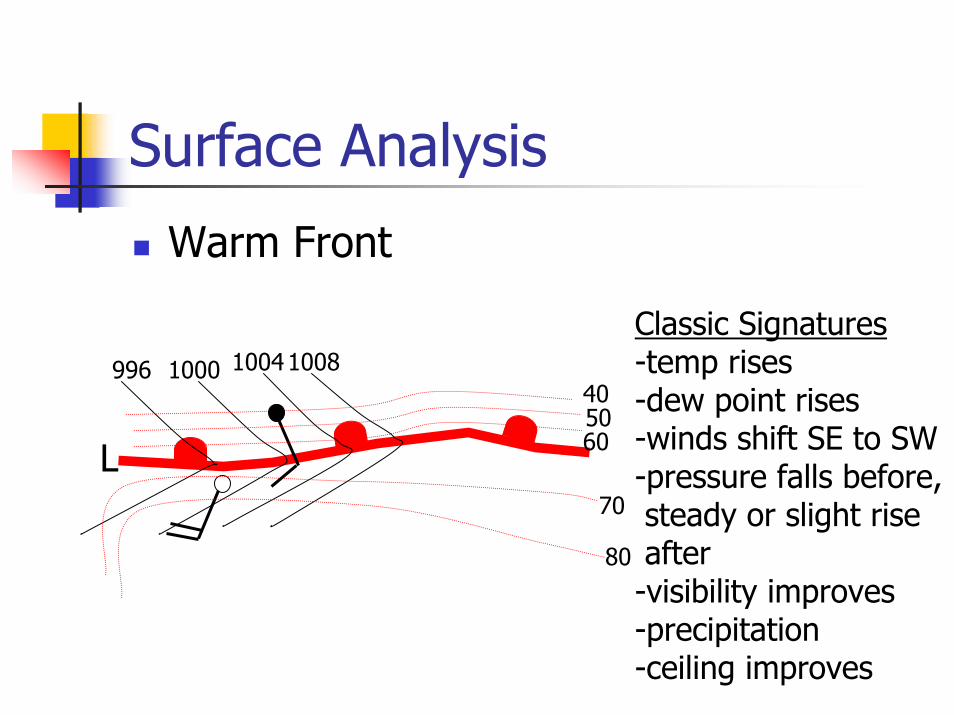
Warm Front
L
996 1000 10041008
80
70
405060
Classic Signatures-temp rises-dew point rises-winds shift SE to SW-pressure falls before,steady or slight riseafter-visibility improves-precipitation-ceiling improves
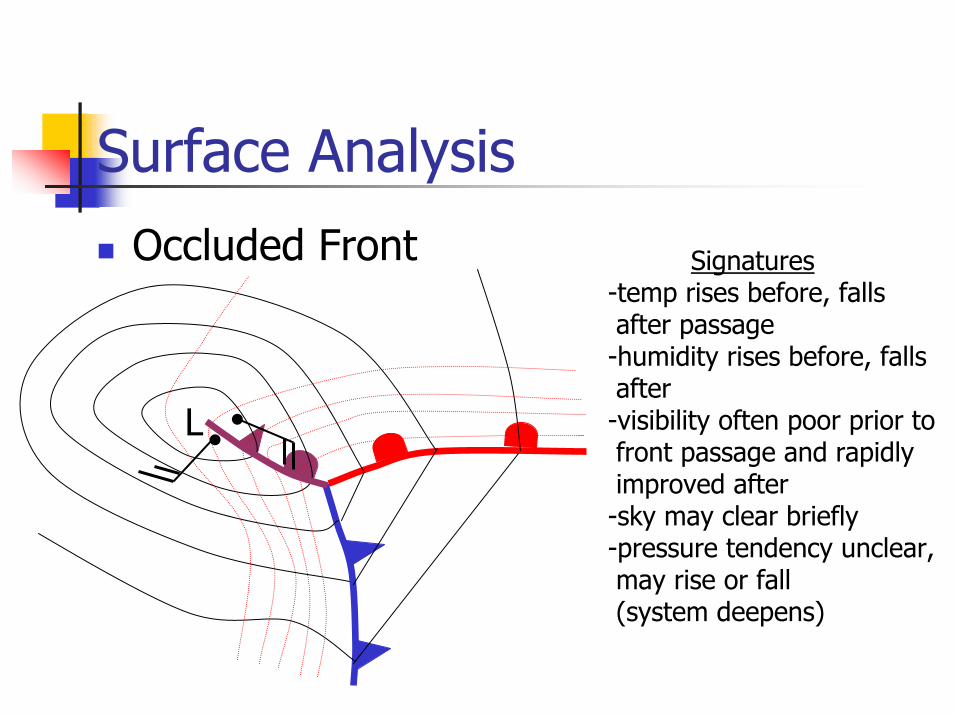
Surface AnalysisOccluded Front Signatures
-temp rises before, fallsafter passage-humidity rises before, fallsafter-visibility often poor prior to front passage and rapidlyimproved after-sky may clear briefly-pressure tendency unclear,may rise or fall (system deepens)
L ••