symptom profile and asthma control in school-aged children
TRANSCRIPT

Symptom profile and asthma control inschool-aged childrenPerla A. Vargas, PhD*; Pippa M. Simpson, PhD*; Margo Bushmiaer, MNSc, RNP, NCSN†;Rajiv Goel, MS*; Craig A. Jones, MD‡; James S. Magee, MD*; Charles R. Feild, MD, MPH*; andStacie M. Jones, MD*
Background: Children with poorly controlled asthma are at high risk of airway remodeling, sleep disruption, schoolabsenteeism, and limited participation in activities.
Objective: To determine asthma prevalence and characterize disease severity and burden in school-aged children.Method: A case-finding study was conducted via a multiple-choice questionnaire and asthma algorithm. Items used for
analysis include physician diagnosis of asthma, symptom severity, and health care utilization. The �2 test was used to determinethe significance of differences among cases. Logistic regression was used to evaluate the association of patient factors and asthmaindicators.
Results: Of the 5,417 children surveyed, 1,341 (25%) were classified as being at risk of asthma. Of these asthma cases, 55%were positive by diagnosis and algorithm (active), 10% were positive per algorithm alone (suspected), and 35% were positiveper diagnosis alone (nonactive). Only 14% of all asthma cases reported experiencing no respiratory symptoms (�1% active, 2%suspected, and 40% nonactive) compared with 75% of noncases. Also, 75% of noncases reported never missing school comparedwith 19%, 33%, and 54% of active, suspected, and nonactive asthma cases. African American race, Medicaid enrollment, andmale sex were independent predictors of asthma risk. Similarly, African American race, Medicaid enrollment, age, and persistentasthma were independent predictors of emergency department use among asthma cases.
Discussion: Prevalence of active symptoms suggestive of poor asthma control was extremely high among urban, minoritychildren enrolled in Arkansas’ largest public school district. Poor asthma control greatly affects quality of life, including schoolattendance and performance. Interventions should raise expectations and emphasize the importance of achieving asthma control.
Ann Allergy Asthma Immunol. 2006;96:787–793.
INTRODUCTIONAsthma is the most common cause of pediatric hospitaliza-tion, the primary diagnosis for one third of all pediatricemergency department (ED) visits, and the fourth most fre-quent reason for visits to pediatricians.1 Asthma morbidity isgreatly affected by poor ambulatory care2–4 and poor accessto medical services.2,5–9 Failures in asthma management arethe result of patient or physician factors or both. The evidencesuggests that in school-aged children asthma is frequentlyundertreated and underdiagnosed.10–21 Screening studiesevaluating asthma-like symptoms and diagnosed asthma es-timate that underdiagnosis of asthma ranges from 4% to17%.10,12,13,16–21 Siersted and collaborators10 found cough to bethe most common asthma symptom among adolescents withundiagnosed asthma. They also found that one third of thesepatients never mentioned their symptoms to a physician.
Results from the Global Asthma Insights and Reality Sur-veys22 documented suboptimal asthma control worldwide.Researchers also found that 39% to 70% of patients withmoderate symptoms believed their symptoms were well orcompletely controlled. Similarly, in a cross-sectional study,the American Lung Association23 found that most parents ofchildren with asthma (82%) consider it very or somewhateasy to manage asthma and 42% reported that it was easy orsomewhat easy to control it. However, the concept of “con-trol” included a high tolerance for recurring asthma symp-toms, lifestyle accommodations, and negative family impact.On the other hand, Martinez et al24 observed that childrenwith persistent wheezing had a significantly lower lung func-tion by 6 years of age compared with children without wheez-ing episodes. These data suggest that suboptimal asthmacontrol in young children with asthma might be associatedwith loss of pulmonary function. Children with poorly con-trolled asthma are also at higher risk of sleep disruption,school absenteeism, and limited participation in activities.25–30
These findings stress the importance of addressing uncon-trolled asthma among pediatric patients.
It is largely accepted that inner-city minority populationshave a higher burden of asthma.31 However, although asthmaamong inner-city patients has been widely studied, little isknown about the asthma-related needs of other low-incomeminority patients. Furthermore, variations in prevalence and
* University of Arkansas for Medical Sciences and Arkansas Children’sHospital, Little Rock, Arkansas.† Little Rock School District. Little Rock, Arkansas.‡ University of Southern California, Los Angeles, California.This study received partial funding from National Heart, Lung, and BloodInstitute grant N01-HO-99230, the Arkansas Biosciences Institute, and theUniversity of Arkansas for Medical Sciences Dean’s Children’s UniversityMedical Group Research Development Award.Received for publication July 6, 2005.Accepted for publication in revised form August 8, 2005.
VOLUME 96, JUNE, 2006 787

morbidity are not based on true surveillance across geo-graphic areas. Little Rock is a small urban area in the centerof a rural, medically underserved state.32 Thus, the sociode-mographic conditions of the population are significantly dif-ferent from the typical inner-city urban population. The cur-rent study was designed to test the hypothesis that children inthe Little Rock School District (LRSD) present a symptomprofile similar to that reported for inner-city populations buthave lower rates of physician-diagnosed asthma. The specificaims were 2-fold: (1) to evaluate the prevalence of physician-diagnosed asthma and (2) to characterize the symptoms pro-file, asthma control, and disease burden of this school-agedpopulation in the largest school district in Arkansas.
METHODSWe conducted an asthma case-finding study in 16 participat-ing schools in the LRSD using a modified version of theUniversity of Southern California (USC) survey question-naire and scoring algorithm developed by Jones and col-leagues.33 We surveyed parents of children enrolled in the2002 to 2003 school cycle using an asthma screening surveythat consisted of 11 multiple-choice questions that assessedasthma symptoms and health care utilization. A questionregarding physician diagnosis of asthma was added to thesurvey (ie, has a medical provider ever told you that yourchild has asthma?). The University of Arkansas for MedicalSciences Human Research Advisory Committee approved thestudy, no personal identifiers were provided to the researchteam, and the informed consent was waived.
SurveyThe survey procedure was coordinated by the LRSD healthcoordinator. School nurses were instructed to follow the
distribution process used to collect other health information atschools. A packet was prepared for every classroom (prekin-dergarten through grade 8) at all schools in the LRSD. Eachparent received a cover letter stapled to the survey form. Thisletter explained the nature of the survey and informed parentsof the LRSD’s plan for the information. Letters and asthmasurveys were available in English and Spanish. The schoolnurses distributed a survey packet to each child with instruc-tions to take the packet home, have a parent complete theform, and return the packet to the school nurse. Completedsurveys were returned to the school nurses and collectedby the health coordinator. Surveys were entered into anACCESS database with drop-down menus and inbuiltrange and consistency data checks.
Case DefinitionAsthma cases were defined as those with asthma diagnosedby a physician and/or identified by the USC algorithm as atrisk of asthma.33 In a validation study, the scoring algorithmcorrectly identified children with asthma (�80% probability)with a sensitivity of 87%, a specificity of 84%, and a mis-classification rate of 14%.33 The survey demonstrated agreater sensitivity for detecting persistent vs intermittentasthma and showed greater specificity for females, youngerchildren, and African Americans.33 In our study, childrenclassified as at risk by the asthma scoring algorithm reporteda combination of asthma symptoms, activity limitations, EDuse, and medication use. The algorithm included 7 differentscoring models (models A through G) applied in descendingorder of predictive validity. Responses were dichotomizedinto ever and never categories. The stepwise scoring algo-rithm and assignment distribution by model in the LRSDpopulation are presented in Table 1. Questions used for the
Table 1. Prediction Models Used by the Asthma Algorithm for Case Identification by Group*
Model
At risk, No. (%) Not at risk, No. (%) Total,No. (%)
(n � 5,417)†Active cases
(n � 743)Suspected cases
(n � 130)Nonactive cases
(n � 468)Noncases(n � 4,076)
A (asthma episodes, trouble breathing, chesttightness, activity limitation)
405 (54.5) 27 (20.8) 364 (77.8) 3,773 (92.6) 4,569 (84.3)
B (asthma episodes, chest tightness, activitylimitation, daytime symptoms)
35 (4.7) 2 (1.5) 6 (1.3) 14 (0.3) 57 (1.1)
C (asthma episodes, trouble breathing, activitylimitation, daytime symptoms)
72 (9.7) 1 (0.8) 2 (0.4) 11 (0.3) 86 (1.6)
D (asthma episodes, trouble breathing, chesttightness, daytime symptoms)
3 (0.4) 0 (0.0) 2 (0.4) 17 (0.4) 22 (0.4)
E (trouble breathing, chest tightness, ED visit�s�,activity limitation, daytime symptoms)
7 (0.9) 7 (5.4) 2 (0.4) 5 (0.1) 21 (0.4)
F (ED visit[s], school missed, activity limitation,daytime symptoms)
195 (26.2) 89 (68.5) 91 (19.4) 230 (5.6) 605 (11.2)
G (Each survey item considered in order ofdiscriminatory ability)
26 (3.5) 4 (3.1) 1 (0.2) 26 (0.6) 57 (1.1)
Abbreviation: ED, emergency department.*Survey questions previously published by Jones and collaborators.1
†Totals might not add up to 100% because of rounding error.
788 ANNALS OF ALLERGY, ASTHMA & IMMUNOLOGY

models are included in Figure 1. Four groups of cases weredefined: (1) cases with active disease are children with aphysician diagnosis of asthma and classified by the algorithmas at risk of asthma, (2) suspected cases are children withouta physician diagnosis of asthma but classified by the algo-rithm as at risk of asthma, (3) cases with nonactive diseaseare children with a physician diagnosis of asthma but notclassified by the algorithm as at risk of asthma, and (4)noncases are children with no asthma diagnosis and not atrisk of asthma by the algorithm.
Severity ClassificationAssignment of asthma severity was conducted by applyingthe National Heart, Lung, and Blood Institute (NHLBI) se-verity classification to parents’ self-reported asthma features(ie, activity limitation, daytime symptoms, nighttime symp-toms, and use of rescue medication). Per the NHLBI guide-lines, individuals were assigned to the most severe grade inwhich any feature occurred.34 Asthma control was defined perthe NHLBI guidelines as the absence of all asthma features inthe previous 4 weeks.34
Statistical AnalysesData were analyzed using the SPSS35 and StatXact536 statis-tical software packages. The �2 test was used to determine thesignificance of the differences among the 4 defined groups ofcases: active disease, suspected, nonactive disease, and non-cases.
Multivariate backward logistic regression analysis was per-formed to establish which demographic factors (ie, sex, age,race, socioeconomic status) were independently related toasthma risk as defined by the algorithm. The same approachwas followed to establish factors related to ED use amongcases, adjusting for asthma severity (ie, intermittent vs per-sistent). Results were verified by forward stepwise regres-sion. Variables with P � .10 in the univariate analyses wereincluded in multiple logistic regression. Results of the regres-sion analyses are reported as odds ratios (ORs) and 95%confidence intervals (CIs). Race was grouped as AfricanAmerican or non–African American, and insurance type wasused as a proxy for socioeconomic status (Medicaid vs non-Medicaid).
RESULTSSurveys were distributed to all children in 36 schools in theLRSD. Surveys from schools with a response rate of 50% orless were excluded (n � 247); 5,788 children from 16 schoolscompleted the case-finding survey, with a response rate of86%. Three hundred seventy-one surveys were excluded be-cause of missing data. Using data from 1,629 children fromschools with a 80% or greater response rate (not shown), weobtained prevalence and case distributions within 1% ofestimates shown herein. Analysis of schools excludedshowed that the mean enrollment was higher than in the 16schools used in this report (mean enrollment � 326 vs 284).Using eligibility for free or reduced lunch as a proxy forincome, we found no significant difference between schoolswith poor response rate and schools with a greater than 50%response rate in the proportion of students receiving free orreduced lunch (72% vs 68%). Five thousand four hundredseventeen surveys had sufficient information to be used formost data analyses; 3,632 surveys were from elementaryschools (prekindergarten through fifth grade) and 1,785 frommiddle schools (sixth grade through eighth grade). The 2questions most frequently missed were reporting insurancecoverage (n � 1,191) and race (n � 158).
Population CharacteristicsThe sampled population matches the racial composition (69%African American) of the school district: 69% African Amer-ican, followed by 23% white, and only 8% of other ethnicgroups combined, including American Indian, Asian Ameri-can, and Hispanic. The mean age was 9 years (age range,4–16 years), and 45% were male. Using source of healthinsurance as a surrogate for income, 46% of the children wereenrolled in Medicaid (133% below the poverty level), 9%were in the state children’s health insurance program (200%
University of Southern California Asthma Survey
1. During the last 2 years, has your child had re-peated episodes of asthma?
2. During the last 2 years, has your child had re-peated episodes of trouble breathing?
3. During the last 2 years, has your child had re-peated episodes of chest tightness?
4. During the last 2 years, has your child beentreated in an emergency room or hospital forepisodes of cough, chest tightness, trouble breath-ing, or wheezing?
5. How often does your child miss school becauseof cough, chest tightness, trouble breathing, orwheezing?
6. Does your child have episodes of cough, chesttightness, trouble breathing, or wheezing whenthey play or exercise?
7. In the past 4 weeks, how often has your childused a medicine to treat episodes of cough, chesttightness, trouble breathing, or wheezing?
8. In the past 4 weeks, how often has your child hadepisodes of cough, chest tightness, trouble breath-ing, or wheezing in the morning or during thedaytime?
9. During the past 4 weeks, how often has your childhad cough, chest tightness, trouble breathing, orwheezing at night or while sleeping?
10. Has a medical provider ever told you that yourchild had asthma?
Figure 1. University of Southern California asthma survey.
VOLUME 96, JUNE, 2006 789

below the poverty level), 39% had private insurance, and 6%were uninsured.
PrevalenceAsthma cases identified by either physician diagnosis oractive symptoms amounted to 25%. The asthma prevalenceby algorithm alone (ie, active and suspected cases) was 16%(95% CI, 14%–18%). Cumulative prevalence based on phy-sician diagnosis of asthma was 22%. Nine percent of thechildren with an asthma diagnosis did not report the combi-nation of active symptoms and health care utilization used todefined asthma risk by the algorithm (ie, nonactive cases).Two percent of the children with no physician diagnosis ofasthma who reported active symptoms and/or health careutilization were identified as suspected cases by algorithmalone.
Racial DifferencesThere were 3 significant differences among racial groups.The most important one was the proportion of cases amongAfrican American, white, and other ethnic groups (P � .001),with African Americans having the most cases (27%) com-pared with 19% for whites and 21% of other racial groupscombined. A significant difference (P � .001) regarding theracial distribution among cases was in the higher proportionof active cases among African Americans (16%), followed by12% and 8% of others and whites, respectively. Also, use ofthe ED was significantly higher (P � .001) among AfricanAmericans (61%) compared with whites (30%) and others(44%). Finally, a significantly greater (P � .001) proportionof African American cases were Medicaid recipients (54%)compared with whites (20%) and others (44%).
Table 2 depicts adjusted ORs, 95% CIs, and P values fromlogistic regression analyses. First, asthma risk was positivelyassociated with African American race (P � .001), Medicaidenrollment (P � .001), and male sex (P � .048). AfricanAmerican (OR, 1.57; 95% CI, 1.29–1.91) race and Medicaidenrollment (OR, 1.51; 95% CI, 1.27–1.79) were associatedwith an approximately 50% increased risk of asthma. Con-
sistent with the literature, males had a 20% increased risk ofasthma (OR, 1.18; 95% CI, 1.01–1.39). Results from thelogistic regression model developed to predict ED use amongasthma cases showed a positive association of ED use withAfrican American race, Medicaid enrollment, and asthmaseverity. Children with persistent symptoms were 5-foldmore likely to have used the ED. Also, the odds of ED useincreased approximately 2-fold for African American (OR,2.15; 95% CI, 1.49–3.11) and Medicaid recipients (OR, 1.82;95% CI, 1.37–2.43). The odds of going to the ED decreasedas children aged (OR, 0.94; 95% CI, 0.89–0.99).
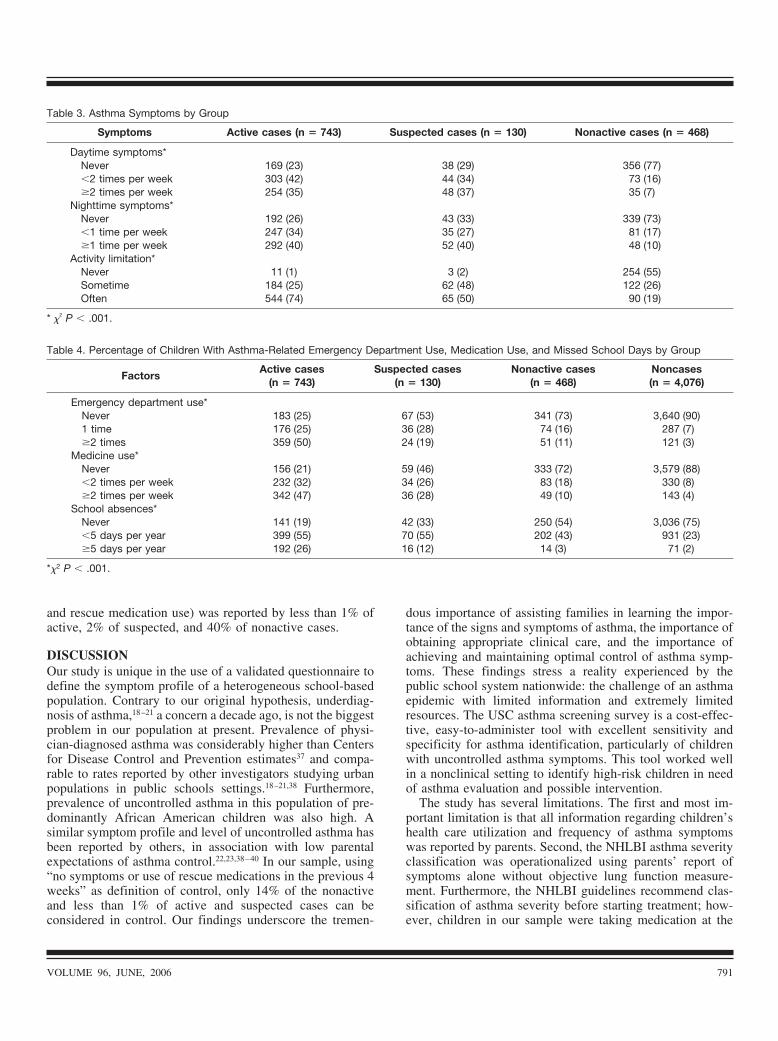
Symptom Profile and Disease BurdenAsthma cases with active symptoms and/or asthma diagnosisare significantly different from noncases (P � .001) (Tables3 to 4). Active cases reported significantly more morbidity,followed by suspected and nonactive cases. Seventy-fivepercent of the noncases experienced no respiratory symptomsin the past 4 weeks compared with 14% of all asthma casescombined: 1% active, 2% suspected, and 40% nonactive (P �.001). The NHLBI recommends classifying asthma severityat the time of first diagnosis without medication. In this study,however, asthma severity was assigned without consideringcontroller medication use or lung function measurements.Since use of controller medication was not considered,asthma symptoms and severity might be underestimated.Classifying asthma severity based on symptoms alone mightreflect disease activity as opposed to underlying severity.Almost half of the active (335/743 [46%]) and suspected(61/130 [47%]) cases presented symptoms consistent withmoderate to severe asthma, whereas only 57 (13%) of 468 ofthe nonactive cases presented with moderate to severe symp-toms. In response to the question regarding treatment forepisodes of cough, chest tightness, trouble breathing, orwheezing at the ED or hospital in the past 2 years, 50% of theactive cases have been treated 2 or more times at the ED inthe past 2 years compared with 19% of the suspected and11% of the nonactive cases. Finally, 19% of active cases havenever missed school in the past year compared with 33% ofthe suspected, 54% of the nonactive, and 75% of noncases. Asimilar trend was observed regarding medication use, withonly 156 (21%) of active cases reporting no use of rescuemedications compared with 59 (46%) of suspected and 333(72%) of nonactive cases (Table 4). The �2 statistics werecalculated to evaluate asthma morbidity differences amonggroups and were all statistically significant (P � .001).
All asthma cases reported significant burden (ie, schooldays missed, activity limitation, and sleep disruption) of therespiratory symptoms on the children’s life. Of the 1,341cases, 52% reported activity limitation often, 29% reportednighttime symptoms at least once a week, 25% daytimesymptoms at least 2 times per week (Table 3), and 17%reported missing 5 or more school days per year due toasthma (Table 4). Overall, asthma control (ie, absence ofasthma features, including symptoms, activity limitations,
Table 2. Adjusted Odds Ratios for Demographic Risk Factors,Asthma Risk, and Emergency Department Use for the TotalPopulation and for Cases Only
Factors OR (95% CI)
Asthma risk (N � 5,417)African American race 1.57 (1.29–1.91)*Medicaid 1.51 (1.27–1.79)*Male sex 1.18 (1.01–1.39)†
Emergency department use (n � 1,341)African American race 2.15 (1.49–3.11)*Medicaid 1.82 (1.37–2.43)*Age 0.94 (0.89–0.99)†Persistent asthma 5.29 (3.52–7.96)*
Abbreviations: CI, confidence interval; OR, odds ratio.* P � .001.† P � .05.
790 ANNALS OF ALLERGY, ASTHMA & IMMUNOLOGY
and rescue medication use) was reported by less than 1% ofactive, 2% of suspected, and 40% of nonactive cases.
DISCUSSIONOur study is unique in the use of a validated questionnaire todefine the symptom profile of a heterogeneous school-basedpopulation. Contrary to our original hypothesis, underdiag-nosis of asthma,18–21 a concern a decade ago, is not the biggestproblem in our population at present. Prevalence of physi-cian-diagnosed asthma was considerably higher than Centersfor Disease Control and Prevention estimates37 and compa-rable to rates reported by other investigators studying urbanpopulations in public schools settings.18–21,38 Furthermore,prevalence of uncontrolled asthma in this population of pre-dominantly African American children was also high. Asimilar symptom profile and level of uncontrolled asthma hasbeen reported by others, in association with low parentalexpectations of asthma control.22,23,38–40 In our sample, using“no symptoms or use of rescue medications in the previous 4weeks” as definition of control, only 14% of the nonactiveand less than 1% of active and suspected cases can beconsidered in control. Our findings underscore the tremen-
dous importance of assisting families in learning the impor-tance of the signs and symptoms of asthma, the importance ofobtaining appropriate clinical care, and the importance ofachieving and maintaining optimal control of asthma symp-toms. These findings stress a reality experienced by thepublic school system nationwide: the challenge of an asthmaepidemic with limited information and extremely limitedresources. The USC asthma screening survey is a cost-effec-tive, easy-to-administer tool with excellent sensitivity andspecificity for asthma identification, particularly of childrenwith uncontrolled asthma symptoms. This tool worked wellin a nonclinical setting to identify high-risk children in needof asthma evaluation and possible intervention.
The study has several limitations. The first and most im-portant limitation is that all information regarding children’shealth care utilization and frequency of asthma symptomswas reported by parents. Second, the NHLBI asthma severityclassification was operationalized using parents’ report ofsymptoms alone without objective lung function measure-ment. Furthermore, the NHLBI guidelines recommend clas-sification of asthma severity before starting treatment; how-ever, children in our sample were taking medication at the
Table 3. Asthma Symptoms by Group
Symptoms Active cases (n � 743) Suspected cases (n � 130) Nonactive cases (n � 468)
Daytime symptoms*Never 169 (23) 38 (29) 356 (77)�2 times per week 303 (42) 44 (34) 73 (16)�2 times per week 254 (35) 48 (37) 35 (7)
Nighttime symptoms*Never 192 (26) 43 (33) 339 (73)�1 time per week 247 (34) 35 (27) 81 (17)�1 time per week 292 (40) 52 (40) 48 (10)
Activity limitation*Never 11 (1) 3 (2) 254 (55)Sometime 184 (25) 62 (48) 122 (26)Often 544 (74) 65 (50) 90 (19)
* �2 P � .001.
Table 4. Percentage of Children With Asthma-Related Emergency Department Use, Medication Use, and Missed School Days by Group
FactorsActive cases
(n � 743)Suspected cases
(n � 130)Nonactive cases
(n � 468)Noncases(n � 4,076)
Emergency department use*Never 183 (25) 67 (53) 341 (73) 3,640 (90)1 time 176 (25) 36 (28) 74 (16) 287 (7)�2 times 359 (50) 24 (19) 51 (11) 121 (3)
Medicine use*Never 156 (21) 59 (46) 333 (72) 3,579 (88)�2 times per week 232 (32) 34 (26) 83 (18) 330 (8)�2 times per week 342 (47) 36 (28) 49 (10) 143 (4)
School absences*Never 141 (19) 42 (33) 250 (54) 3,036 (75)�5 days per year 399 (55) 70 (55) 202 (43) 931 (23)�5 days per year 192 (26) 16 (12) 14 (3) 71 (2)
*�2 P � .001.
VOLUME 96, JUNE, 2006 791

time of the survey. The third limitation has to do with casedefinition. Asthma cases were defined using a combination ofactive asthma symptoms and nonactive diagnosis of asthma.Children labeled as “nonactive cases” might have had theircondition misdiagnosed or they could have mild disease orwell-controlled asthma. Lastly, there is always the possibilitythat patient self-selection might have biased estimates ofasthma prevalence.
In summary, prevalence of diagnosed asthma and activeasthma symptoms among children enrolled in the largestschool district in Arkansas is comparable to rates for inner-city children19,41,42 and higher than national estimates.43 Alarge proportion of the children reported active symptoms,reflecting poor asthma control. Further research to identifythe modifiable factors that determine this high level of recur-ring symptoms is warranted. Asthma interventions shouldemphasis the importance of achieving adequate asthma con-trol.
ACKNOWLEDGMENTSWe appreciate the help of Sarah Robins, Jerry Stalnaker,Stevie Cherepski, RN, CSN, and the nurses and parents of theschools in the LRSD. We also thank Anne Parat for herinvaluable editorial comments.
REFERENCES1. US Vital Statistics. Hyattsville, MD: National Center for Health
Statistics; 1996.2. Halfon N, Newacheck PW. Childhood asthma and poverty:
differential impacts and utilization of health services. Pediat-rics. 1993;91:56–61.
3. Lahdensuo A, Haahtela T, Herrala J, et al. Randomised com-parison of guided self management and traditional treatment ofasthma over one year. BMJ. 1996;312:748–752.
4. Billings J, Zeitel L, Lukomnik J, et al. Impact of socioeconomicstatus on hospital use in New York City. Health Aff (Millwood).1993;12:162–173.
5. Homer CJ, Szilagyi P, Rodewald L, et al. Does quality of careaffect rates of hospitalization for childhood asthma? Pediatrics.1996;98:18–23.
6. Lang DM, Sherman MS, Polansky M. Guidelines and realitiesof asthma management: the Philadelphia story. Arch InternMed. 1997;157:1193–2000.
7. Legorreta AP, Christian-Herman J, O’Connor RD, et al. Com-pliance with national asthma management guidelines and spe-cialty care: a health maintenance organization experience [seecomments]. Arch Intern Med. 1998;158:457–464.
8. Gottlieb DJ, Beiser AS, O’Connor GT. Poverty, race, andmedication use are correlates of asthma hospitalization rates: asmall area analysis in Boston. Chest. 1995;108:28–35.
9. Bindman AB, Grumbach K, Osmond D, et al. Preventablehospitalizations and access to health care [see comments].JAMA. 1995;274:305–311.
10. Siersted HC, Boldsen J, Hansen HS, et al. Population basedstudy of risk factors for underdiagnosis of asthma inadolescence: Odense schoolchild study. BMJ. 1998;316:651–655.
11. Silver EJ, Crain EF, Weiss KB. Burden of wheezing illness
among U.S. children reported by parents not to have asthma. JAsthma. 1998;35:437–443.
12. Speight AN. Is childhood asthma being underdiagnosed andundertreated? BMJ. 1978;2:331–332.
13. Speight AN, Lee DA, Hey EN. Underdiagnosis and undertreat-ment of asthma in childhood. BMJ (Clin Res Ed). 1983;286:1253–1256.
14. Warman KL, Silver EJ, McCourt MP, Stein RE. How doeshome management of asthma exacerbations by parents of inner-city children differ from NHLBI guideline recommendations?National Heart, Lung and Blood Institute. Pediatrics. 1999;103:422–427.
15. Cuijpers CE, Wesseling GJ, Swaen GM, et al. Asthma-relatedsymptoms and lung function in primary school children. JAsthma. 1994;31:301–312.
16. Kaur B, Anderson HR, Austin J, et al. Prevalence of asthmasymptoms, diagnosis, and treatment in 12–14 year old childrenacross Great Britain (International Study of Asthma and Aller-gies in Childhood, ISAAC UK). BMJ. 1998;316:118–124.
17. Kuhni CE, Sennhauser FH. The Yentl syndrome in childhoodasthma: risk factors for undertreatment in Swiss children. Pe-diatr Pulmonol. 1995;19:156–160.
18. Clark NM, Brown R, Joseph CL, et al. Issues in identifyingasthma and estimating prevalence in an urban school popula-tion. J Clin Epidemiol. 2002;55:870–881.
19. Joseph CL, Foxman B, Leickly FE, et al. Prevalence of possibleundiagnosed asthma and associated morbidity among urbanschoolchildren. J Pediatr. 1996;129:735–742.
20. Yawn BP, Wollan P, Scanlon P, Kurland M. Are we ready foruniversal school-based asthma screening? an outcomes evalua-tion. Arch Pediatr Adolesc Med. 2002;156:1256–1262.
21. Yeatts K, Shy C, Sotir M, et al. Health consequences forchildren with undiagnosed asthma-like symptoms. Arch PediatrAdolesc Med. 2003;157:540–544.
22. Rabe KF, Adachi M, Lai CK, et al. Worldwide severity andcontrol of asthma in children and adults: the global asthmainsights and reality surveys. J Allergy Clin Immunol. 2004;114:40–47.
23. Executive Summary: The American Lung Association asthmasurvey. Available at: http://www.lungusa.org/asthma/merck_summary.html. Accessed 2003.
24. Martinez FD, Wright AL, Taussig LM, et al. Asthma andwheezing in the first six years of life: The Group HealthMedical Associates. N Engl J Med. 1995;332:133–138.
25. Anderson HR, Bailey PA, Cooper JS, et al. Morbidity andschool absence caused by asthma and wheezing illness. ArchDis Child. 1983;58:777–784.
26. Bener A, Abdulrazzaq YM, Debuse P, Abdin AH. Asthma andwheezing as the cause of school absence. J Asthma. 1994;31:93–98.
27. Braback L, Kalvesten L. Asthma in schoolchildren: factorsinfluencing morbidity in a Swedish survey. Acta PaediatrScand. 1988;77:826–830.
28. Bremberg SG, Kjellman NI. Children with asthma: how do theyget along at school? Acta Paediatr Scand. 1985;74:833–840.
29. Diette GB, Markson L, Skinner EA, et al. Nocturnal asthma inchildren affects school attendance, school performance, andparents’ work attendance. Arch Pediatr Adolesc Med. 2000;154:923–928.
30. Doull IJ, Williams AA, Freezer NJ, Holgate ST. Descriptivestudy of cough, wheeze and school absence in childhood. Tho-
792 ANNALS OF ALLERGY, ASTHMA & IMMUNOLOGY

rax. 1996;51:630–631.31. Grant EN, Alp H, Weiss KB. The challenge of inner-city asthma
[review]. Curr Opin Pulm Med. 1999;5:27–34.32. Arkansas Institute for Economic Advancement, Census Data
Center. Population and social/economic characteristics by cityand place: Little Rock, AR. Available at: http://www.aiea.ualr.edu/census/censusdata/census2000/Cities/1600541000.pdf. Accessed 2002.
33. Jones CA, Morphew T, Clement LT, et al. A school-based caseidentification process for identifying inner city children withasthma: the breathmobile program. Chest. 2004;125:924–934.
34. National Asthma Education and Prevention Program. ExpertPanel Report 2: Guidelines for the Diagnosis and Managementof Asthma. Bethesda, MD: National Institutes of Health; 1997.NIH publication 97-4051.
35. SPSS Inc. SPSS Base 12.0 for Windows User’s Guide. Chicago,IL: SPSS Inc; 2003.
36. StatXact5. Cambridge, MA: Cytel Software Corporation; 2002.37. Mannino DM, Homa DM, Pertowski CA, et al. Surveillance for
asthma–United States, 1960 –1995. MMWR CDC SurveillSumm. 1998;47:1–27.
38. Callery P, Milnes L, Verduyn C, Couriel J. Qualitative study ofyoung people’s and parents’ beliefs about childhood asthma.Br J Gen Pract. 2003;53:185–190.
39. Yoos HL, Kitzman H, McMullen A, Sidora K. Symptom per-ception in childhood asthma: how accurate are children and
their parents? J Asthma. 2003;40:27–39.40. Halterman JS, McConnochie KM, Conn KM, et al. A potential
pitfall in provider assessments of the quality of asthma control.Ambul Pediatr. 2003;3:102–105.
41. Crain EF, Weiss KB, Bijur PE, et al. An estimate of theprevalence of asthma and wheezing among inner-city children.Pediatrics. 1994;94:356–362.
42. Christiansen SC, Martin SB, Schleicher NC, et al. Currentprevalence of asthma-related symptoms in San Diego’s predom-inantly Hispanic inner-city children. J Asthma 1996;33:17–26.
43. Akinbami LJ, Schoendorf KC. Trends in childhood asthma:prevalence, health care utilization, and mortality. Pediatrics.2002;110(2 pt 1):315–322.
Requests for reprints should be addressed to:Perla A. Vargas, PhDUniversity of Arkansas for Medical Sciences and Arkansas Children’s
HospitalDepartment of PediatricsArkansas Children’s HospitalCenter for Applied Research and EvaluationSlot 512-26800 Marshall StLittle Rock, AR 72202-3591E-mail: [email protected]
VOLUME 96, JUNE, 2006 793