sydney soil model. ii: experimental validation
TRANSCRIPT

Sydney Soil Model. II: Experimental ValidationDavid W. Airey1; John P. Carter, M.ASCE2; and Martin D. Liu3
Abstract: This paper presents simulations of the mechanical behavior of reconstituted and natural soils using a new model presented in acompanion paper and referred to as the “Sydney soil model.” It is demonstrated that the performance of the proposed model is essentially thesame as that of modified Cam clay model when describing the behavior of clays in laboratory reconstituted states. The model has also beenemployed to simulate the drained and undrained behavior of structured clays and sands, including calcareous clay and sand. Five sets ofconventional triaxial tests and one set of true triaxial tests have been considered. It is demonstrated that the new model provides satisfactoryqualitative and quantitative modeling of many important features of the behavior of structured soils, particularly in capturing various patternsof the stress and strain behavior associated with soil type and structure. A general discussion of the model parameters is also included. It isconcluded that the Sydney soil model is suitable for representing the behavior of many soils if their ultimate state during shearing can bedefined by an intrinsic and constant stress ratio M� and a unique relationship between mean effective stress and voids ratio, i.e., a uniquep0 � e curve. DOI: 10.1061/(ASCE)GM.1943-5622.0000079. © 2011 American Society of Civil Engineers.
CE Database subject headings: Clays; Sand, soil type; Calcareous soils; Fabrics; Constitutive relations; Plasticity.
Author keywords: Clays; Sands; Calcareous soils; Fabric; Structure of soil; Constitutive relations; Plasticity.
Introduction
Soils are composed of particles with wide ranges of mineralogy,size, and shape, arranged to produce different fabrics, and withvariable bonding between the individual grains. As a consequence,the mechanical properties of materials of such huge diversity areinevitably complex, and the development of mechanical constitu-tive models has been necessarily a progressive process. For exam-ple, for the purpose of mechanical modeling, soils are commonlydivided into clays and sands, and conventionally the behavior ofthese two soil types has been modeled separately. For both clayand sand, individual models have been developed, initially todescribe the behavior of soil in an artificial state, the laboratoryreconstituted state, and more recently to describe natural soils thatpossess some fabric and structure. However, while much progresshas been made, most of these models are generally limited in therange of natural soil behaviors that can be simulated.
In part I of the paper, a new model, the Sydney soil model (SS),was formulated. In this model the behavior of soil is described interms of a reference state and a structured state. The behavior ofthe soil at the reference state is based on soil properties at criticalstates of deformation and the assumption of plastic volumetricdeformation-dependent hardening. The influence of soil structureis controlled by the difference in behavior between the natural soiland the soil at the corresponding reference state. The effects of
structure and destructuring on soil behavior are modeled by a hard-ening (or softening) process.
In this paper, the Sydney soil model is evaluated against exper-imental data. The model is used to simulate the behavior of sixdifferent soils, loaded in both drained and undrained situations.The soil types selected for simulation cover both clays and sands,including calcareous clays and sands. The samples evaluated covera wide range of densities, possess a variety of different structures,and have been subjected to a very wide range of stresses. Althoughthis validation process is not exhaustive, it is considered sufficientlyrepresentative of a wide range of natural soils and loading condi-tions to provide an adequate test of the validity and utility of theproposed model.
Model Parameters
The Sydney soil model is defined in terms of eight material param-eters, and the specification of three curves, one surface, and the soiltype. The eight parameters are the critical state friction angle φcm
and the parameter s� (used to describe the shape of the critical statefailure surface in the π plane), Poisson’s ratio ν�, parameter m fordescribing soil behavior within the yield locus, parameters n and γdefining shear destructuring, parameter μ defining the variation ofthe aspect ratio of the yield surface, and parameter ω used in theflow rule. The three curves are the critical state line in e� p0 space,the elastic volumetric deformation function of the soil Eeðp0Þ, andthe additional voids ratio sustained by the structure of the soilΔEðp0sÞ. The symbols e, p0, and p0s are used here to representthe voids ratio of the soil, the mean effective stress, and the sizeof the structural yield surface, i.e., its intercept on the p0 axis,respectively. The surface requiring definition is the initial structuralyield surface, defined by the isotropic yield stress (p0s) and its aspectratio. Soils are divided into clay and sand types. The only differencebetween the models for clay and sand types is that for sand-typesoils, additional equations are required to model the first loadingwithin the yield locus.
1School of Civil Engineering, The Univ. of Sydney, Sydney, NSW2006, Australia. E-mail: [email protected]
2Faculty of Engineering and Built Environment, Univ. of Newcastle,Newcastle, NSW 2308, Australia. E-mail: [email protected]
3Faculty of Engineering, Univ. of Wollongong, Wollongong, NSW2522, Australia (corresponding author). E-mail: [email protected]
Note. This manuscript was submitted on January 10, 2010; approved onJuly 18, 2010; published online on July 31, 2010. Discussion period openuntil November 1, 2011; separate discussions must be submitted for indi-vidual papers. This paper is part of the International Journal of Geome-chanics, Vol. 11, No. 3, June 1, 2011. ©ASCE, ISSN 1532-3641/2011/3-225–238/$25.00.
INTERNATIONAL JOURNAL OF GEOMECHANICS © ASCE / MAY/JUNE 2011 / 225
Int. J. Geomech. 2011.11:225-238.
Dow
nloa
ded
from
asc
elib
rary
.org
by
UN
IVE
RSI
TE
LA
VA
L o
n 07
/04/
14. C
opyr
ight
ASC
E. F
or p
erso
nal u
se o
nly;
all
righ
ts r
eser
ved.

The following methods have been used for identifying thevalues of the model parameters adopted in the computationsdescribed in the following.1. The soil type for all simulations is obtained from conventional
classification tests.2. The value of the critical state friction angle φcm has been
obtained directly from the test data.3. Parameters s�, μ, and ω have been taken as constants, indepen-
dent of the material type, with values s� ¼ 1, μ ¼ 0, andω ¼ 1, unless their values could be readily determined fromexperimental data to be otherwise.
4. Parameters ν�, n, and m could, in most cases, be determinedfrom the experimental data as explained in Part I (Liu andIndraratna 2011). Where there were insufficient data, theirvalues were assumed to be ν� ¼ 0:25, n ¼ 1, and m ¼ 1, asrecommended in part I.
5. Parameter γ for all the simulations was determined after thevalues of all other parameters had been identified. Its valuewas determined by curve fitting the theoretical simulationsto the experimental data for the distortional stress and strainrelationship.
6. Reliable identification of the three curves and one surface [theelastic volumetric deformation function Eeðp0Þ, the criticalstate line, the additional voids ratio sustained by the structureof the soil ΔEðp0sÞ, and the initial structural yield surface]requires a number of specially designed laboratory tests. Forexample, tests are required on undisturbed soils for the deter-mination of the additional voids ratio sustained by the structureof the soilΔEðp0sÞ and the initial structural yield surface. Whenthere were insufficient data for the accurate determination ofthese functions, the following techniques were used:a. The initial structural yield surface was assumed to be
elliptical with its aspect ratio equal to the critical state stressratio M�, enabling the surface to be determined from asingle yield point.
b. Where the Young’s modulus was independent of theconfining pressure, the elastic deformation function,EeðpÞ, was taken as linear in p0, and where the Young’smodulus increased linearly with p0, EeðpÞ was taken as lin-ear in ln p0.
c. The critical state line could be either linear in the e� p0space or linear in the e� ln p0 space. The form that gavethe best fit to the available data was adopted.
d. Where the mathematical form of ΔEðp0sÞ could not bedetermined directly from the data, the following expressionderived by Liu and Carter (1999, 2000a, 2003b) wasassumed:
ΔEðp0sÞ ¼ a
�p0y;ip0s
�bþ c ð1Þ
When there were insufficient data, the recommendations ofLiu and Carter (2000a) for the material parameters b and cwere assumed, i.e., b ¼ 1 and c ¼ 0. The symbol p0y;i repre-sents the size of the initial structural yield surface, definedby the intercept of this surface on the mean stress axis and
Δei is the additional voids ratio at p0s ¼ p0y;i where virginyielding commences.
In all computations described below the stress units adopted arekPa (kN=m2). In presenting the results of the computations, exper-imental data are represented in the figures of this paper by symbols,and the model simulations are represented by lines.
The tests simulated in this paper are conventional triaxialcompression and extension tests with the confining pressure heldconstant unless the stress path of the test is otherwise specified.
Validation
Reconstituted Clay
As a special case, the proposed model reduces essentially to thewell-known modified Cam clay (MCC) model developed for claysin a reconstituted state. The performance of the MCC model forlaboratory reconstituted clays has been extensively investigated,both for single element tests and for solving boundary value prob-lems, and it is widely accepted that the model captures well theessential features of the behavior of reconstituted clays (Houlsbyet al. 1982; Burland 1990; Potts and Zdravkovic 1999; Liu andCarter 2000b). Therefore the proposed SS model should alsodescribe reasonably well the behavior of most clays in a laboratoryreconstituted state.
For completeness, a summary of the basic constitutive equationsfor the two models is provided here. Further details of the formu-lation of the modified Cam clay model can be found in the text byMuir-Wood (1990). The symbols adopted here have the samemeanings as defined in part I.
For reconstituted clay it can be assumed that there are no effectsof structure so that in the Sydney soil model the additional voidsratio associated with structure will be zero, i.e.,Δe ¼ 0. In this casethe structural yield surface will have the same size as the equivalentyield surface for fully destructured soil, i.e., p0e ¼ p0s, and the aspectratio of the yield surface will be identical to the critical state shearstress ratio, i.e., M ¼ M�.
The SS model requires the equation of the critical state line ine� p0 space. To be consistent with the MCC model, the locus ofcritical states is given by
e ¼ e�cs � λ� ln p0 ð2ÞTo be consistent with the elastic linear e� ln p0 response, the
function controlling the recoverable change in voids ratio in theSS model is defined by
Eeðp0Þ ¼ κ� ln p0 ð3ÞThe constitutive equations for virgin yielding in both models
may be written as follows:
dεv ¼�
κ�
1þ e
�dp0
p0þ�λ� � κ�
1þ e
�dp0sp0s
dεd ¼2ð1þ ν�Þ9ð1� 2ν�Þ
�κ�
1þ e
�dqp0
þ A
�λ� � κ�
1þ e
�dp0sp0s
ð4Þ
For the MCC model
A ¼ 2η�M2 � η2
dp0s ¼ð2p0 � p0sÞ �M2dp0 þ 2qdq
p0 �M2 q ¼ 1ffiffi2
pffiffiffiffiffiffiffiffiffiffiffiffiffiffiffiffiffiffiffiffiffiffiffiffiffiffiffiffiffiffiffiffiffiffiffiffiffiffiffiffiffiffiffiffiffiffiffiffiffiffiffiffiffiffiffiffiffiffiffiffiffiffiffiffiffiffiffiffiffiffiffiffiffiffiffiffiffiffiffiffiffiffiffiffiffiffiffiffiffiffiffiffiffiffiffiffiffiffiffiffiffiffiffiffiffiffiffiffiffiffiffiffiffiffiffiffiffiffiffiffiffiffiffiffiffiffiffiffiffiffi½ðσ0
11 � σ022Þ2 þ ðσ0
22 � σ033Þ2 þ ðσ0
33 � σ011Þ2 þ 6ðσ02
12 þ σ0223 þ σ02
31Þ�p
η ¼ qp0
ð5Þ
226 / INTERNATIONAL JOURNAL OF GEOMECHANICS © ASCE / MAY/JUNE 2011
Int. J. Geomech. 2011.11:225-238.
Dow
nloa
ded
from
asc
elib
rary
.org
by
UN
IVE
RSI
TE
LA
VA
L o
n 07
/04/
14. C
opyr
ight
ASC
E. F
or p
erso
nal u
se o
nly;
all
righ
ts r
eser
ved.

σ0ij = Cartesian components of effective stress and dεv and
dεd = increments of volumetric and deviatoric strain, respectively.�M = value of the stress ratio η at critical state.
For the SS model
A ¼ ð3=2Þ ffiffiffiffiffiffiffiffiffiffiffiffiffiffiη∧=M�3
pj1� η∧=M�j dp0s ¼
ð2p0 � p0sÞM�2dp0 þ 2q∧dq∧p0M�2
q∧ ¼ η∧p0 η∧ ¼ 3½f 2 þffiffiffiffiffiffiffiffiffiffiffiffiffiffiffiffiffiffiffiffiffiffiffiffiffiffiffiffiffiffiffiffiffiffiffiffiffif 2ðf 2 þ 27� 15s�Þp �
f 2 þffiffiffiffiffiffiffiffiffiffiffiffiffiffiffiffiffiffiffiffiffiffiffiffiffiffiffiffiffiffiffiffiffiffiffiffiffif 2ðf 2 þ 27� 15s�Þp þ 4ð27� 15s�Þ
f 2 ¼ðσ0
11 þ σ022 þ σ0
33Þ½ðσ011 þ σ0
22 þ σ033Þ2� s�ðσ02
11 þ σ0222 þ σ02
33Þ�σ01σ0
2σ03
� 27þ 9s� ð6Þ
The generalized shear stress q∧ and the stress ratio η∧ were for-mulated to allow the possibility in the SS model of a noncircularsection of the failure surface in the π plane, and thus improvedmodel performance for loading along general stress paths. Conse-quently, different definitions for the shear stress (q and q∧), stressratio (η and η∧), and the critical state stress ratio ( �M and M�) arerequired. This distinction effectively disappears for large negativevalues of the parameter s�, and for practical purposes assumings� ¼ �50 will effectively recover the volumetric deformation ofthe MCC model. For distortional deformation, differences in pre-dictions arise because of the difference in the assumed flow rule.
In the SS model nonelastic deformations can occur within theyield locus; however, when a large value is assigned to the param-eter m, such as m > 10, the performance of the SS model is essen-tially elastic for loading within the yield locus and almost identicalto the MCC model.
A quantitative comparison of the performance of the two modelsis shown in Fig. 1. The values of model parameters used for thesecomputations are listed in Table 1. The size of the initial yieldsurface is 100 kPa and initial stress state is isotropic. The testssimulated are conventional drained triaxial compression tests withconstant confining pressures, for two overconsolidation ratios,OCR ¼ 1 and OCR ¼ 8. As expected, the simulations of thetwo constitutive models for reconstituted clay are essentially thesame, although use of the SS model results in slightly reduced peakstrength for highly overconsolidated clay, resulting in generally abetter match with reality (Schofield 1980; Muir-Wood et al. 1994;Liu and Carter 2000a).
Structured Soils
The Sydney soil model has been evaluated on the basis of compar-isons between the model simulations and the corresponding exper-imental data. The behaviors of six different soils are considered,viz., Nanticoke clay, Bass Strait carbonate sand, Fuji sand, a naturalcalcarenite, Emmerstad clay, and Toyoura sand. The six soils havebeen selected because each represents a special stress and strainbehavior pattern. Consequently, the capacity of the proposed modelto describe various behavior patterns of soils is demonstrated quali-tatively and quantitatively.
Values of the model parameters for the six soils identified,following the procedures described in section “Model Parameters,”are listed in Table 2.
Nanticoke ClayThe first set of simulations includes four drained triaxial compres-sion tests performed by Lo (1972) on samples from a naturaldeposit of stiff Nanticoke clay. Test specimens were cut from ablock of undisturbed soil. In addition to the information in Table 2the initial voids ratios needed to be estimated, and these were
calculated from the known water content of the clay, assumingGs ¼ 2:7, the specific gravity of soil particles. The calculatedvoids ratio of 0.7 was assigned to the soil at the stress state(p0 ¼ 552 kPa, q ¼ 0), and the voids ratios for the other three testswere calculated according to the elasticity relationship, since theinitial stress states were well below the structural yield surface.
A comparison of the simulations and the experimental data isshown in Fig. 2. Overall, it is seen that the proposed model givesa reasonably good description of the behavior of the natural stiffNanticoke clay. Three particular features of the behavior of thestructured clay are captured by the SS model that cannot be repro-duced by simpler models.1. Compressive volumetric deformations are predicted during
softening. This feature has been widely reported for naturalsoils (e.g., Bishop et al. 1965; Wong 1998; Carter et al. 2000).
2. The volumetric deformation is predicted to change fromvolumetric expansion to compression with or without initialcompression while the soil is softening. The consequencesof this feature have been observed in undrained tests (e.g.,Lacasse et al. 1985; Georgiannou et al. 1993; Vaughan 1994;Horpibulsuk et al. 2010).
Stre
ss r
atio
3(σ
' 1-σ'
3)/(
σ'1+
2σ' 3)
MCC
SS
OCR=1
0
0.5
1
1.5
2
Stre
ss r
atio
3(σ
' 1-σ'
3)/(
σ'1+
2σ' 3)
Deviatoric strain εd
MCC
SS
-0.04
0
0.04
0.08
0 0.1 0.2 0.3 0.4 0.5
0 0.1 0.2 0.3 0.4 0.5
Vol
umet
ric
stra
in ε
v
Deviatoric strain εd
MCC
SS
(b) Deviatoric and volumetric strain relationship
(a) Stress ratio and deviatoric strain relationship
OCR=1
OCR=8
OCR=8
OCR=1
Fig. 1. Comparison of the performance of the modified Cam clay andthe Sydney soil model
Table 1. Model Parameters
Parameter φcm s� λ� κ� e�cs ν� m
Value 30° �50 0.16 0.05 2.1 0.25 10
INTERNATIONAL JOURNAL OF GEOMECHANICS © ASCE / MAY/JUNE 2011 / 227
Int. J. Geomech. 2011.11:225-238.
Dow
nloa
ded
from
asc
elib
rary
.org
by
UN
IVE
RSI
TE
LA
VA
L o
n 07
/04/
14. C
opyr
ight
ASC
E. F
or p
erso
nal u
se o
nly;
all
righ
ts r
eser
ved.

3. Much greater compressive volumetric strains are predictedthan for reconstituted soils with similar apparent overconsoli-dation ratios. The greater compression and reduced stiffnessof natural clays during virgin shearing has been widely re-ported (e.g., Graham and Li 1985; Burland 1990; Lagioia andNova 1995).
Bass Strait Carbonate SandThe second set of simulations includes three drained triaxial com-pression tests performed by Poulos et al. (1982) on Bass Straitcarbonate sand. The specimens had been reconstituted in thelaboratory and loaded isotropically to the following states at thestart of shearing: (p0 ¼ 138 kPa, e ¼ 0:607), (p0 ¼ 276 kPa,e ¼ 0:636), and (p0 ¼ 414 kPa, e ¼ 0:597). It can be seen thatthe test with the intermediate confining pressure has the highestinitial voids ratio. In the SS model this is interpreted as beingthe result of differences in structure, and the term ΔEðp0sÞ willbe different for the three specimens. To determine these terms, ithas been assumed that the virgin ICL passes through the initialstates and a common point (p0 ¼ 20 MPa, e ¼ 0:4), an assumptionthat has been shown by Liu et al. (2000) to fit the data for manysoils. The additional voids ratio functions obtained are ΔE ¼�0:132� 2:7 × 10�6p0 for the test with σ0
3 ¼ 138 kPa, ΔE ¼�0:096� 5:7 × 10�6p0 for the test with σ0
3 ¼ 276 kPa, andΔE ¼ �0:13� 2:9 × 10�6p0 for the test with σ0
3 ¼ 414 kPa.A comparison of the simulations and the experimental data is
shown in Fig. 3. It is seen that the proposed model gives a gooddescription of the behavior of the Bass Strait carbonate sand. Two
Shea
r st
ress
(σ'
1-σ'
3) k
Pa
σσ'3=34.5 kPa
σ'3=172.5 kPa
σ'3=345 kPa
σ'3=552 kPa
σ'3=552 kPa
0
200
400
600
Shea
r st
ress
(σ'
1-σ'
3) k
Pa
Axial strain εa
(a) Shear stress and axial stain relationship
-0.01
0
0.01
0.02
0 0.025 0.05 0.075 0.1
0 0.025 0.05 0.075 0.1
Vol
umet
ric
stra
in ε
v
Axial strain εa
(b) Volumetric and axial stain relationship
σ'3=34.5 kPa
σ'3=34.5 kPa
σ'3=172.5 kPa
σ'3=172.5 kPa
σ'3=345 kPa
σ'3=345 kPa
σ'3=552 kPa
σ'3=552 kPa
Fig. 2. Behavior of natural Nanticoke clay (test data after Lo 1972)
Tab
le2.
Valuesof
Model
ParametersUsedin
Simulations
Soilandfig.
nos.
Soiltype
φ cm
s�ν�
mω
μn
γInitial
structural
yieldsurface
Elastic
deform
ation
Critical
statelin
eAdditional
voidsratio
Nanticokeclay
Fig.
2Clay
17°
10.3
31
00.2
1Elliptical,aspect
ratio
=M
� .p0 s;
i¼
2;200kP
a
Ee ðp
0 Þ¼
4×10
�5p0
e¼
0:722�8×10
�5p0
ΔE¼
0:015ðp0 s;
i=p0 sÞ
BassStraitcarbonate
sand
Fig.
3
Sand
45.5°
10.25
11
03
0.3
Initial
stress
states
on
theyieldsurface.
Ee ðp
0 Þ¼
2×10
�5p0
e¼
0:745�1×10
�4p0
ΔE¼
a 0�a 1p0 s
Fujisand
Figs.4–
9Sand
39.7°
�43:9
01
0.1
00.5
2.5
Elliptical,aspect
ratio
=M
� .p0 s;
i¼
98:1
kPa
Ee ðp
0 Þ¼
1×10
�4p0
e¼
0:85
�2:1×10
�4p0
ΔE¼
0:03
�1:95
×10
�4p0 s
Natural
calcarenite
Figs.10
–17
Clay
35.7°
10.13
103
02
0.5
Elliptical,aspect
ratio
=1.12.p0 s;
i¼
2;400kP
a
Ee ðp
0 Þ¼
2:89
×10
�5p0
e¼
2:14
�0:18
lnp0
ΔE¼
0:305þ1:44
×10
�5p0 s
�0:028
lnp0 s
þ0:15
ðp0 s;i=p0 sÞ3
0
Emmerstad
clay
Figs.18
and19
Clay
34°
1.12
0.25
21
00.25
0.005
Elliptical,aspect
ratio
=M
� .p0 s;
i¼
98kP
a
Ee ðp
0 Þ¼
0:006lnp0
Seetext
section
“Emmerstad
Clay”
ΔE¼
0:35
þ0:26
ð98=
p0 sÞ0:4
Toyourasand
Figs.20
–25
Sand
31°
10.25
1Seetext
section“Toyoura
Sand”
Ee ðp
0 Þ¼
5:0×10
�6p0
e¼
0:892�5:5×10
�5p0
þ0:04expð�3
×10
�3p0Þ
Seetext
section
“Toyoura
Sand”
228 / INTERNATIONAL JOURNAL OF GEOMECHANICS © ASCE / MAY/JUNE 2011
Int. J. Geomech. 2011.11:225-238.
Dow
nloa
ded
from
asc
elib
rary
.org
by
UN
IVE
RSI
TE
LA
VA
L o
n 07
/04/
14. C
opyr
ight
ASC
E. F
or p
erso
nal u
se o
nly;
all
righ
ts r
eser
ved.
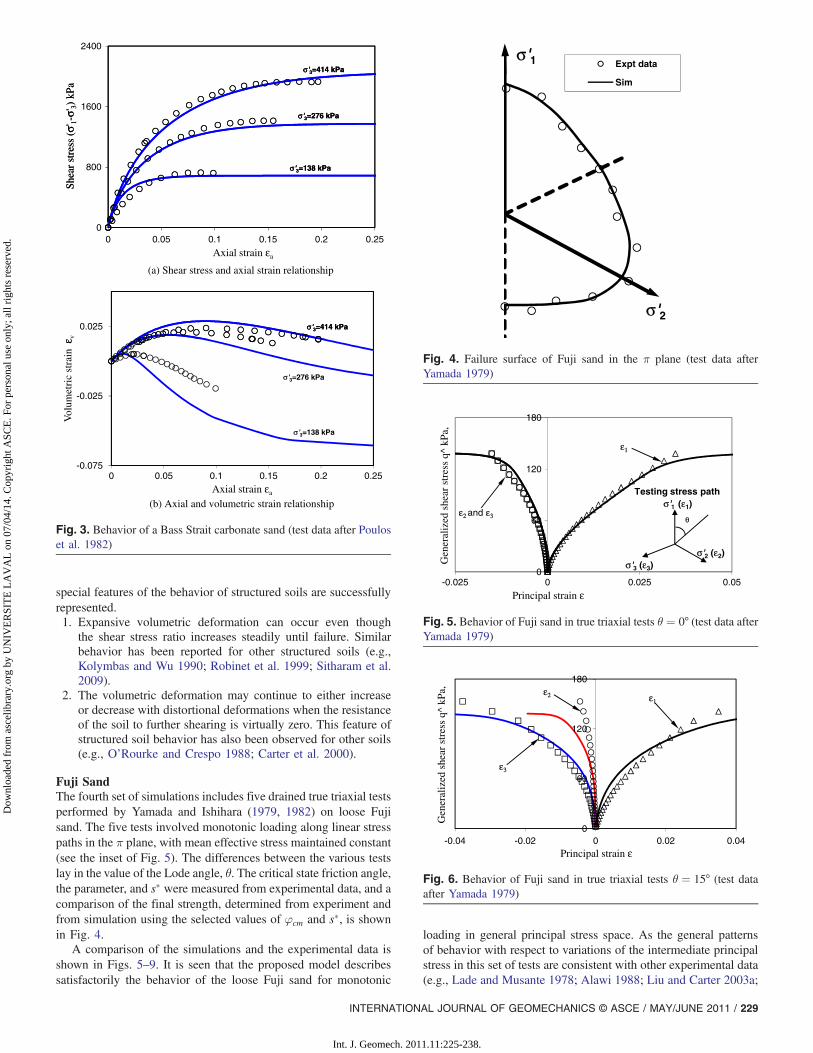
special features of the behavior of structured soils are successfullyrepresented.1. Expansive volumetric deformation can occur even though
the shear stress ratio increases steadily until failure. Similarbehavior has been reported for other structured soils (e.g.,Kolymbas and Wu 1990; Robinet et al. 1999; Sitharam et al.2009).
2. The volumetric deformation may continue to either increaseor decrease with distortional deformations when the resistanceof the soil to further shearing is virtually zero. This feature ofstructured soil behavior has also been observed for other soils(e.g., O’Rourke and Crespo 1988; Carter et al. 2000).
Fuji SandThe fourth set of simulations includes five drained true triaxial testsperformed by Yamada and Ishihara (1979, 1982) on loose Fujisand. The five tests involved monotonic loading along linear stresspaths in the π plane, with mean effective stress maintained constant(see the inset of Fig. 5). The differences between the various testslay in the value of the Lode angle, θ. The critical state friction angle,the parameter, and s� were measured from experimental data, and acomparison of the final strength, determined from experiment andfrom simulation using the selected values of φcm and s�, is shownin Fig. 4.
A comparison of the simulations and the experimental data isshown in Figs. 5–9. It is seen that the proposed model describessatisfactorily the behavior of the loose Fuji sand for monotonic
loading in general principal stress space. As the general patternsof behavior with respect to variations of the intermediate principalstress in this set of tests are consistent with other experimental data(e.g., Lade and Musante 1978; Alawi 1988; Liu and Carter 2003a;
Expt data
Sim
σσ'1
σ'2
Fig. 4. Failure surface of Fuji sand in the π plane (test data afterYamada 1979)
0
60
120
180
-0.025 0 0.025 0.05
Gen
eral
ized
she
ar s
tres
s q^
kPa
,
Principal strain ε
θθ
σ'3 (ε3)
σ'1 (ε1)
σ'2 (ε2)
Testing stress path
ε1
ε2 and ε3
Fig. 5. Behavior of Fuji sand in true triaxial tests θ ¼ 0° (test data afterYamada 1979)
0
60
120
180
-0.04 -0.02 0 0.02 0.04
Gen
eral
ized
she
ar s
tres
s q^
kPa
,
Principal strain ε
εε3
ε2 ε1
Fig. 6. Behavior of Fuji sand in true triaxial tests θ ¼ 15° (test dataafter Yamada 1979)
Shea
rst
ress
(σ' 1-
σ'3)
kPa
ε
σσ'3=138 kPa
σ'3=276 kPa
σ'3=414 kPa
σ'3=414 kPa
(a) Shear stress and axial strain relationship
(b) Axial and volumetric strain relationship
0
800
1600
2400
Shea
rst
ress
(σ' 1-
σ'3)
kPa
Axial strain εa
-0.075
-0.025
0.025
0 0.05 0.1 0.15 0.2 0.25
0 0.05 0.1 0.15 0.2 0.25
Vol
umet
ric
stra
in ε
v
Axial strain εa
σ'3=138 kPa
σ'3=138 kPa
σ'3=276 kPa
σ'3=414 kPa
σ'3=276 kPa
σ'3=414 kPa
Fig. 3. Behavior of a Bass Strait carbonate sand (test data after Pouloset al. 1982)
INTERNATIONAL JOURNAL OF GEOMECHANICS © ASCE / MAY/JUNE 2011 / 229
Int. J. Geomech. 2011.11:225-238.
Dow
nloa
ded
from
asc
elib
rary
.org
by
UN
IVE
RSI
TE
LA
VA
L o
n 07
/04/
14. C
opyr
ight
ASC
E. F
or p
erso
nal u
se o
nly;
all
righ
ts r
eser
ved.

Khalili and Liu 2008), it is believed that the SS model has thecapacity for representing well the influence of the immediateprincipal stress on soil behavior.
Soft Natural CalcareniteResults of six conventional drained triaxial compression testscarried out by Lagioia and Nova (1995) on a natural calcarenitehave been compared with the model simulations. The natural cal-carenite is a coarse-grained material with calcareous interparticlecement contributing significantly to the material’s structure. Thesoil was formed by marine deposition and has a high degree of
uniformity. All specimens tested were considered to possess thesame structure.
A comparison of the predicted isotropic compression and thecritical state lines with test data is shown in Fig. 10. The initial statefor the structured soil is defined by p0 ¼ 147 kPa and e ¼ 1:148.The initial voids ratios for all simulated tests were calculated fromthe predicted ICL. Based on the CSL and ICL, the function for theadditional voids ratio was determined. Based on the initial yieldpoints for the soil measured by Lagioia and Nova (1995), the initialstructural yield surface can be described by the followingexpression:
�p0 � 1;2001;200
�2þ�σ01 � σ0
3
1;344
�2� 1 ¼ 0 ð7Þ
A comparison of the initial structural yield surfaces given byEq. (7) and deduced from the experimental data is shown in Fig. 11.The initial structural yield surface in the p0 � ðσ0
1 � σ03Þ space is
elliptical with an aspect ratio of 1.12.The test results and the simulations are shown in Figs. 12–17.
Considering the wide range of initial stresses, it is seen that theproposed model gives a very successful simulation of the behaviorof this natural and highly structured calcarenite.
It is also observed in the simulations and in the experimentaldata (Figs. 14–16) that both the deviatoric and the volumetricstrains increase virtually at constant stress at the moment whenvirgin yielding commences, and that a large amount of plasticdeformation is accumulated at the end of this process. These sim-ulations are consistent with experimental observations of naturalsoil behavior where the soils have a very sensitive structure (e.g.,Westerberg 1995, from Rouainia and Muir Wood 2000; Arceset al. 1998).
0
60
120
180
-0.04 -0.02 0 0.02 0.04
Gen
eral
ized
she
ar s
tres
s q^
kPa
,
Principal strain ε
εε1ε2ε3
Fig. 9. Behavior of Fuji sand in true triaxial tests θ ¼ 60° (test dataafter Yamada 1979)
0
60
120
180
-0.04 -0.02 0 0.02 0.04
Gen
eral
ized
she
ar s
tres
s q^
kPa
,
Principal strain ε
εε1
ε2
ε3
Fig. 8. Behavior of Fuji sand in true triaxial tests θ ¼ 45° (test dataafter Yamada 1979)
0.5
0.7
0.9
1.1
100001000100
Voi
ds r
atio
e
Mean effective stress p'
Expt CSL
Expt ICL
Sim, CSL
Sim, ICL
Fig. 10. ICL and CSL for a natural calcarenite (test data after Lagioiaand Nova 1995)
0
500
1000
1500
0 500 1000 1500 2000 2500
Shea
r st
ress
(σ'
1-σ'
3) k
Pa
Mean effective stress p' (kPa)
Expt data
Sim
Fig. 11. Initial structural yield surface for a natural calcarenite (testdata after Lagioia and Nova 1995)
0
60
120
180
-0.04 -0.02 0 0.02 0.04
Gen
eral
ized
she
ar s
tres
s q^
kPa
,
Principal strain ε
εε1
ε3
ε2
Fig. 7. Behavior of Fuji sand in true triaxial tests θ ¼ 30° (test dataafter Yamada 1979)
230 / INTERNATIONAL JOURNAL OF GEOMECHANICS © ASCE / MAY/JUNE 2011
Int. J. Geomech. 2011.11:225-238.
Dow
nloa
ded
from
asc
elib
rary
.org
by
UN
IVE
RSI
TE
LA
VA
L o
n 07
/04/
14. C
opyr
ight
ASC
E. F
or p
erso
nal u
se o
nly;
all
righ
ts r
eser
ved.

For the test with σ03 ¼ 3;500 kPa, the initial stress state is much
larger than the size of the initial structural yield surface. Accordingto the proposed model, the structure of the soil at σ0
3 ¼ 3;500 kPa iseffectively completely destroyed because the soil has a very highdestructuring index, i.e., b ¼ 30. Thus the soil behaved essentiallyas a reconstituted material throughout this test. Destructuring of thissample was confirmed by Lagioia and Nova (1995).
Emmerstad ClayThe behavior of a natural sensitive (and therefore highly structured)Norwegian marine clay, Emmerstad clay, in undrained triaxialtests (Lacasse et al. 1985) has been compared with the modelpredictions.
Following the work by Burland (1990), the ICL� estimated forthis clay is
e� ¼ 0:879� 0:07 ln p0 þ 0:00016ðln p0Þ3 ð8ÞThe additional voids ratio sustained by soil structure has been
estimated from oedometer tests as
ΔEðp0sÞ ¼ 0:35þ 0:26ðp0s;i=p0sÞ0:4 ð9Þ
The initial state of the soil was defined by σ01 ¼ 41:5 kPa,
σ02 ¼ σ0
3 ¼ 23:5 kPa, and e ¼ 1:155. The initial structural yieldsurface was assumed to be an ellipse with the aspect ratio beingM�. The initial vertical yield stress measured from the oedometerdata is 110 kPa, which gives p0s;i ¼ 98 kPa, based on an empiricalexpression for Ko suggested by Liu and Carter (2002).
A comparison of the simulations and the experimental data forundrained triaxial shearing is shown in Figs. 18 and 19. Overall, it
nε v
Shea
r st
ress
(σ '
1-σ '
3) k
Pa
Expt data
Sim
σσ'3=400 kPa
0
0.05
0.1
0.15
57.05.052.00
Vol
umet
ric
stra
in ε
v
Axial strain εa
Expt data
Sim
(b) Volumetric and axial strain relationship
0
600
1200
1800
0 0.25 0.5 0.75
Shea
r st
ress
(σ '
1-σ '
3) k
Pa
Axial strain εa
Expt data
Sim
(a) Shear stress and axial strain relationship
σ'3=400 kPa
σ'3=400 kPa
Fig. 13. Shearing behavior of a natural calcarenite at σ03 ¼ 400 kPa
(test data after Lagioia and Nova 1995)
Shea
r st
ress
(σ '
1-σ'
3) k
Pa
Expt data
Sim
0
0.05
0.1
0.15
0.2
Vol
umet
ric
stra
in ε
v
Axial strain εa
Expt data
Sim
(b) Volumetric and axial strain relationship
0
1000
2000
3000
0 0.1 0.2 0.3 0.4 0.5
0 0.1 0.2 0.3 0.4 0.5
Shea
r st
ress
(σ '
1-σ'
3) k
Pa
Axial strain εa
Expt data
Sim
(a) Shear stress and axial strain relationship
σσ'3=900 kPa
σ'3=900 kPa
Fig. 14. Shearing behavior of a natural calcarenite at σ03 ¼ 900 kPa
(test data after Lagioia and Nova 1995)
0.1
v
Expt data
Sim
Shea
r st
ress
(σ'
1-σ'
3) k
PaExpt data
Sim
σσ'3=200 kPa
-0.05
0
0.05
0.1
0 0.1 0.2 0.3 0.4 0.5Vol
umet
ric
stra
in ε
v
Axial strain εa
Expt data
Sim
(b) Volumetric and axial strain relationship
0
500
1000
1500
0 0.1 0.2 0.3 0.4 0.5
Shea
r st
ress
(σ'
1-σ'
3) k
Pa
Axial strain εa
Expt data
Sim
(a) Shear stress and axial strain relationship
σ'3=200 kPa
σ'3=200 kPa
Fig. 12. Shearing behavior of a natural calcarenite at σ03 ¼ 200 kPa
(test data after Lagioia and Nova 1995)
INTERNATIONAL JOURNAL OF GEOMECHANICS © ASCE / MAY/JUNE 2011 / 231
Int. J. Geomech. 2011.11:225-238.
Dow
nloa
ded
from
asc
elib
rary
.org
by
UN
IVE
RSI
TE
LA
VA
L o
n 07
/04/
14. C
opyr
ight
ASC
E. F
or p
erso
nal u
se o
nly;
all
righ
ts r
eser
ved.

is seen that the proposed model gives a reasonably good descriptionof the behavior of the natural soft Emmerstad clay, which wassheared from an anisotropic stress state to failure. As seen inFig. 19, the stress and strain relationship of the soil up to εa ¼7% has been represented reasonably well. Lacasse et al. (1985)observed that Emmerstad clay is extremely sensitive, and the shearstrength of this soft soil continues to decrease with the increase ofshear deformation and finally becomes negligibly small at verylarge strain. This feature of the soil has been successfully predictedby the model, as seen from the undrained stress paths of the soil inFig. 18. However, unlike most very soft clays, Emmerstad clayexhibits a significant amount of negative excess pore pressure,which is usually a feature of stiff clay behavior (e.g., Vaughan1994), before it softens. The SS model is able to simulate thisbehavior satisfactorily. To achieve this, it was necessary for the soilto be much more sensitive to destructuring caused by increasingshear stress than by increasing mean stress.
Toyoura SandLarge amounts of experimental data are available for the mechani-cal properties of Toyoura sand, enabling the direct determination ofall the model parameters. Simulations are reported here for a seriesof experiments reported by Ishihara (1993). These involved con-ventional undrained triaxial compression tests at constant confiningpressures on specimens prepared by two different methods, drydeposition and moist placement. As reported by Ishihara (1993),the method of preparation had a significant influence on the behav-ior, and this was attributed to the different fabric, or structureresulting from the different preparation methods.
Shea
r st
ress
(σ'
1-σ '
3) k
Pa
Expt data
Sim
0
0.1
0.2
0.3
Vol
umet
ric
stra
in ε
vAxial strain εa
Expt data
Sim
(b) Volumetric and axial strain relationship
0
1500
3000
4500
6000
0 0.1 0.2 0.3 0.4 0.5
0 0.1 0.2 0.3 0.4 0.5
Shea
r st
ress
(σ'
1-σ '
3) k
Pa
Axial strain εa
Expt data
Sim
(a) Shear stress and axial strain relationship
σσ'3=2000 kPa
σ'3=2000 kPa
Fig. 16. Shearing behavior of a natural calcarenite at σ03 ¼ 2;000 kPa
(test data after Lagioia and Nova 1995)
She
ar s
tres
s (σ
' 1-σ'
3) k
Pa
Expt data
Sim
0
4000
8000
12000
She
ar s
tres
s (σ
' 1-σ'
3) k
Pa
Axial strain εa
Expt data
Sim
(a) Shear stress and axial strain relationship
0
0.05
0.1
0.15
0.2
0 0.1 0.2 0.3 0.4 0.5
0 0.1 0.2 0.3 0.4 0.5
Vol
umet
ric
stra
in ε
v
Axial strain εa
Expt data
Sim
(b) Volumetric and axial strain relationship
σσ'3=3500 kPa
σ'3=3500 kPa
Fig. 17. Shearing behavior of a natural calcarenite at σ03 ¼ 3;500 kPa
(test data after Lagioia and Nova 1995)
vSh
ear
stre
ss (
σ'1-
σ'3)
kPa
Expt data
Sim
0
0.05
0.1
0.15
0.2
0.25
Vol
umet
ric
stra
in ε
v
Axial strain εa
Expt data
Sim
(b) Volumetric and axial strain relationship
0
1000
2000
3000
4000
0 0.1 0.2 0.3 0.4 0.5
0 0.1 0.2 0.3 0.4 0.5
Shea
r st
ress
(σ'
1-σ'
3) k
Pa
Axial strain εa
Expt data
Sim
(a) Shear stress and axial strain relationship
σσ'3=1300 kPa
σ'3=1300 kPa
Fig. 15. Shearing behavior of a natural calcarenite at σ03 ¼ 1;300 kPa
(test data after Lagioia and Nova 1995)
232 / INTERNATIONAL JOURNAL OF GEOMECHANICS © ASCE / MAY/JUNE 2011
Int. J. Geomech. 2011.11:225-238.
Dow
nloa
ded
from
asc
elib
rary
.org
by
UN
IVE
RSI
TE
LA
VA
L o
n 07
/04/
14. C
opyr
ight
ASC
E. F
or p
erso
nal u
se o
nly;
all
righ
ts r
eser
ved.

The parameters describing the intrinsic properties of Toyourasand are listed in Table 2. The critical state friction angle was mea-sured from the experimental data, and the value of s� was estimatedfrom data presented by Matsuoka and Nakai (1982). The CSL forthe sand and the ICLs produced by both methods of sample prepa-ration were investigated by Ishihara (1993), who found a unique,intrinsic critical state line and a range of virgin isotropic compres-sion lines depending on the structure of the soil. It has been shownthat the CSL and ICLs can be described accurately by the followingequation (Liu et al. 2000):
e ¼ Γ� lp0 þ B expð�rp0Þ ð10Þ
where Γ, l, B, and r = material constants, and for the ICL these canbe related to the initial voids ratio ei of the sand at p0i ¼ 40 kPa by
Γ ¼ 0:9477þ 0:7194 ln ei l ¼ 2:34 × 10�5e3:6015i
B ¼ 0:419e2i � 0:5765ei þ 0:2174
r ¼ 0:0372e2i þ 0:0629ei � 0:0228
ð11Þ
The theoretical curves determined according to Eqs. (11) forfour isotropic compression tests are shown in Fig. 20 by solid lines.A good agreement between the simulations and the experimental
data is seen. A comparison of the CSL defined by the proposedequation and the experimental data and the initial states of the15 tests simulated in this study, which may be seen to be scatteredover a wide range of stress levels and voids ratios, are also shown inFig. 20. With the determination of the ICLs, the additional voidsratio ΔEðp0sÞ for Toyoura sand for a given initial state can bedefined.
For the samples prepared by dry deposition the functionΔEðp0sÞhas been determined to be
ΔE ¼ �0:029þ 1:47 × 10�5p0s þ 0:036 expð�0:00372p0sÞ� 0:04 expð�0:0015p0sÞ ð12Þ
This function is identical for tests A1, A2, A3, and A5 becausethese were carried out on initially identical samples, and it differsonly very slightly for test A4. The values of the model parametersdependent on the type of soil structure are listed in Table 3. A com-parison of the model simulations and the experimental data isshown in Fig. 21. It is seen that the Sydney soil model describesreasonably well the effective stress paths of the sand prepared bydry deposition. However, some discrepancy exists in the stress andstrain relationship.
The model parameters describing the shear destructuring wereselected to give the best fit over all the tests. However, better fitsfor individual simulations can be obtained with minor adjustmentsto the shear destructuring parameters. For example, by assumingn ¼ 5 and γ ¼ 0:2, the simulation for test A4 shown in Fig. 22 isobtained. For these samples the reduction of soil strength after thepeak is particularly sensitive to the model parameters.
A similar procedure was followed to identify the structure-related parameters for the 10 tests prepared by moist placement,and these are listed in Tables 3 and 4.
For comparison purposes, the model simulations and theexperimental data were divided into three groups. The first group
0.55
0.7
0.85
1
10 100 1000 10000
Voi
ds r
atio
e
Mean effective stress p' kPa
Expt ICL
Sim ICL
Expt CSL
Sim CSL
Soil state for test
Fig. 20. ICL and CSL of Toyoura sand and initial states for the tests(test data after Ishihara 1993)
Table 3. Structure Parameters for Toyoura Sand
Parameter n γ μ ω m p0s;i
Dry
deposition
10 0.1 �0:1 0.4 1 Virgin yielding
Moist
placement
0.5 1.0 0 1 1 1,200 kPa, the same
shape as the yield surface
-45
-35
-25
-15
-5
5
15
25
35
0 10 20 30 40 50 60
0.5(
σ'a-
σ'r)
kPa
0.5(σ'a+σ'r) kPa
Data (soil at 5.92m)
Data (soil at 4.11m)
CSL
Simulation
Initial state
Fig. 18. Stress paths of Emmerstad clay (test data after Lacasseet al. 1985)
-30
-20
-10
0
10
20
30
40
0 0.015 0.03 0.045 0.06 0.0750.5(
σ'a-
σ'r)
kPa
Axial strain εa
Data (soil at 5.92m)
Data (soil at 4.11)
Simulation
Initial state
Fig. 19. Stress and strain behavior of Emmerstad clay (test data afterLacasse et al. 1985)
INTERNATIONAL JOURNAL OF GEOMECHANICS © ASCE / MAY/JUNE 2011 / 233
Int. J. Geomech. 2011.11:225-238.
Dow
nloa
ded
from
asc
elib
rary
.org
by
UN
IVE
RSI
TE
LA
VA
L o
n 07
/04/
14. C
opyr
ight
ASC
E. F
or p
erso
nal u
se o
nly;
all
righ
ts r
eser
ved.
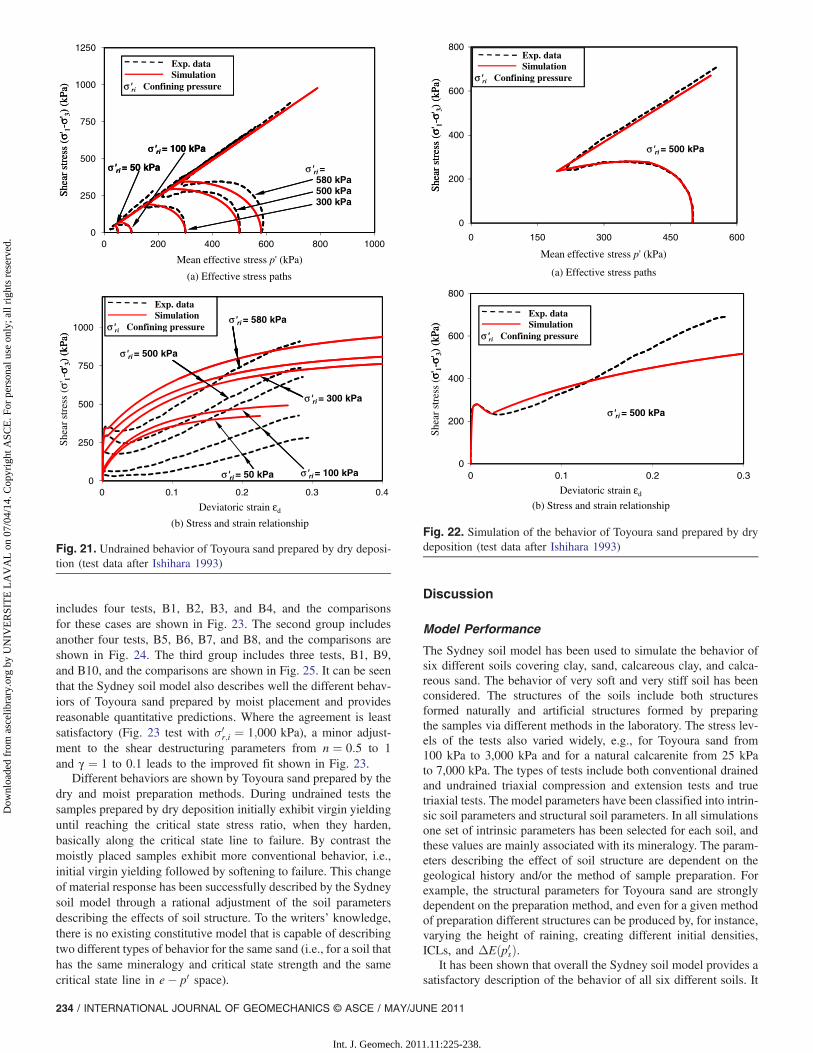
includes four tests, B1, B2, B3, and B4, and the comparisonsfor these cases are shown in Fig. 23. The second group includesanother four tests, B5, B6, B7, and B8, and the comparisons areshown in Fig. 24. The third group includes three tests, B1, B9,and B10, and the comparisons are shown in Fig. 25. It can be seenthat the Sydney soil model also describes well the different behav-iors of Toyoura sand prepared by moist placement and providesreasonable quantitative predictions. Where the agreement is leastsatisfactory (Fig. 23 test with σ0
r;i ¼ 1;000 kPa), a minor adjust-ment to the shear destructuring parameters from n ¼ 0:5 to 1and γ ¼ 1 to 0.1 leads to the improved fit shown in Fig. 23.
Different behaviors are shown by Toyoura sand prepared by thedry and moist preparation methods. During undrained tests thesamples prepared by dry deposition initially exhibit virgin yieldinguntil reaching the critical state stress ratio, when they harden,basically along the critical state line to failure. By contrast themoistly placed samples exhibit more conventional behavior, i.e.,initial virgin yielding followed by softening to failure. This changeof material response has been successfully described by the Sydneysoil model through a rational adjustment of the soil parametersdescribing the effects of soil structure. To the writers’ knowledge,there is no existing constitutive model that is capable of describingtwo different types of behavior for the same sand (i.e., for a soil thathas the same mineralogy and critical state strength and the samecritical state line in e� p0 space).
Discussion
Model Performance
The Sydney soil model has been used to simulate the behavior ofsix different soils covering clay, sand, calcareous clay, and calca-reous sand. The behavior of very soft and very stiff soil has beenconsidered. The structures of the soils include both structuresformed naturally and artificial structures formed by preparingthe samples via different methods in the laboratory. The stress lev-els of the tests also varied widely, e.g., for Toyoura sand from100 kPa to 3,000 kPa and for a natural calcarenite from 25 kPato 7,000 kPa. The types of tests include both conventional drainedand undrained triaxial compression and extension tests and truetriaxial tests. The model parameters have been classified into intrin-sic soil parameters and structural soil parameters. In all simulationsone set of intrinsic parameters has been selected for each soil, andthese values are mainly associated with its mineralogy. The param-eters describing the effect of soil structure are dependent on thegeological history and/or the method of sample preparation. Forexample, the structural parameters for Toyoura sand are stronglydependent on the preparation method, and even for a given methodof preparation different structures can be produced by, for instance,varying the height of raining, creating different initial densities,ICLs, and ΔEðp0sÞ.
It has been shown that overall the Sydney soil model provides asatisfactory description of the behavior of all six different soils. It
Shea
r st
ress
(σ'
1-σ'
3) (
kPa)
σ'1-
σ'3)
(kP
a)
Exp. dataSimulation
σσ'ri Confining pressure
Exp. dataSimulation
σ'ri Confining pressure
0
200
400
600
800
Shea
r st
ress
(σ'
1-σ'
3) (
kPa)
Mean effective stress p' (kPa)
0
200
400
600
800
0 150 300 450 600
0 0.1 0.2 0.3
Shea
r st
ress
(σ'
1-σ'
3) (
kPa)
Deviatoric strain εd
(b) Stress and strain relationship
(a) Effective stress paths
σ'ri = 500 kPa
σ'ri = 500 kPa
Exp. dataSimulation
σ'ri Confining pressure
Exp. dataSimulation
σ'ri Confining pressure
Fig. 22. Simulation of the behavior of Toyoura sand prepared by drydeposition (test data after Ishihara 1993)
She
ar s
tres
s (σ
' 1-σ'
3) (
kPa)
1σ'
3) (
kPa)
Exp. dataSimulation
σσ'ri Confining pressure
σ'ri = 100 kPa
σ'ri = 50 kPa
Exp. dataSimulation
σ'ri Confining pressure
0
250
500
750
1000
1250
She
ar s
tres
s (σ
' 1-σ'
3) (
kPa)
Mean effective stress p' (kPa)
0
250
500
750
1000
0 200 400 600 800 1000
0 0.1 0.2 0.3 0.4
She
ar s
tres
s (σ
' 1-σ'
3) (
kPa)
Deviatoric strain εd
(b) Stress and strain relationship
(a) Effective stress paths
σ'ri = 580 kPa500 kPa300 kPa
Exp. dataSimulation
σ'ri Confining pressure
σ'ri = 100 kPa
σ'ri = 50 kPa
σ'ri = 500 kPa
σ'ri = 580 kPa
σ'ri = 300 kPa
σ'ri = 50 kPa σ'ri = 100 kPa
Exp. dataSimulation
σ'ri Confining pressure
Fig. 21. Undrained behavior of Toyoura sand prepared by dry deposi-tion (test data after Ishihara 1993)
234 / INTERNATIONAL JOURNAL OF GEOMECHANICS © ASCE / MAY/JUNE 2011
Int. J. Geomech. 2011.11:225-238.
Dow
nloa
ded
from
asc
elib
rary
.org
by
UN
IVE
RSI
TE
LA
VA
L o
n 07
/04/
14. C
opyr
ight
ASC
E. F
or p
erso
nal u
se o
nly;
all
righ
ts r
eser
ved.

has also been shown that the following special features of thebehavior of structured soils can be successfully captured bythe model.1. The structured soil may exhibit monotonic volumetric
compression during softening, as observed in conventionaltriaxial tests.
2. During softening, the volumetric deformation of a structuredsoil may change from initial expansion to compression.
3. Structured soil may exhibit volumetric expansion when the soil“hardens” steadily from an isotropic stress state to failure at thecritical state of deformation.
4. Unlike the behavior of laboratory reconstituted clay, thevolumetric deformation for structured soils may continue toeither increase or decrease at distortional deformations wherethe resistance of the soil to further shearing is virtually zero.
5. For soils with a very sensitive structure the deviatoric and thevolumetric strains may be produced at nearly constant stressfrom the moment when virgin yielding occurs, and a largeamount of plastic deformation may be accumulated at theend of this process.
6. Soil samples of a given mineralogy may exhibit differentmaterial behavior depending on their initial structure.
7. Some discrepancy is observed in the model simulations of thesoftening behavior of geomaterials (e.g., Figs. 2 and 12). Partof the discrepancy may be attributed to a fundamental assump-tion of the theoretical framework that geomaterials are conti-nua. However, discontinuities exist in geomaterials both as aresult of geological history and from nonuniform deformations
Table 4. Initial States for Tests in the Second Group—Toyoura Sand
Test Initial state (p0, q, e) Additional voids ratio
B1 100 kPa, 0, 0.833 ΔE ¼ �0:077þ 1:8 × 10�5p0s þ 0:0277 expð�0:0038p0sÞ � 0:04 expð�0:0015p0sÞB2 1,000 kPa, 0, 0.833 ΔE ¼ �0:0459þ 1:59 × 10�5p0s þ 0:0327 expð�0:00377p0sÞ � 0:04 expð�0:0015p0sÞB3 2,000 kPa, 0, 0.833 ΔE ¼ �0:028þ 1:462 × 10�5p0s þ 0:0362 expð�0:00371p0sÞ � 0:04 expð�0:0015p0sÞB4 3,000 kPa, 0, 0.833 ΔE ¼ �0:008þ 1:3 × 10�5p0s þ 0:0407 expð�0:00361p0sÞ � 0:04 expð�0:0015p0sÞB5 100 kPa, 0, 0.911 ΔE ¼ �0:008þ 1:3 × 10�5p0s þ 0:0407 expð�0:00361p0sÞ � 0:04 expð�0:0015p0sÞB6 500 kPa, 0, 0.883 ΔE ¼ �0:007þ 1:29 × 10�5p0s þ 0:041 expð�0:0036p0sÞ � 0:04 expð�0:0015p0sÞB7 1,500 kPa, 0, 0.842 ΔE ¼ �0:027þ 1:45 × 10�5p0s þ 0:0365 expð�0:0037p0sÞ � 0:04 expð�0:0015p0sÞB8 3,000 kPa, 0, 0.787 ΔE ¼ �0:066þ 1:73 × 10�5p0s þ 0:0293 expð�0:00379p0sÞ � 0:04 expð�0:0015p0sÞB9 500 kPa, 0, 0.91 ΔE ¼ 0:019þ 1:05 × 10�5p0s þ 0:0479 expð�0:00338p0sÞ � 0:04 expð�0:0015p0sÞB10 1,000 kPa, 0, 0.899 ΔE ¼ 0:026þ 9:9 × 10�6p0s þ 0:05 expð�0:0033p0sÞ � 0:04 expð�0:0015p0sÞ
(σ' 1-
σ '3)
kPa
σσ'ri=3000 kPaσ'ri= 2000 kPa kPa
Shea
r st
ress
(σ'
1-σ'
3) k
Pa
Data
Simulation
Fitting
(b) Shear stress and axial strain relationship
0
400
800
1200
1600
2000
0 0.06 0.12 0.18 0.24 0.3
She
ar s
tres
s ( σ
' 1-σ '
3) k
Pa
Axial strain εa
DataSimulationFitting
σ'ri=3000 kPaσ'ri= 2000 kPa kPa
σ'ri=100 kPσ'ri= 1000 kPa kPa
0
500
1000
1500
2000
0 600 1200 1800 2400 3000
Shea
r st
ress
(σ'
1-σ'
3) k
Pa
Mean effective stress p' kPa
Data
Simulation
Fitting
σ'ri=3000 kPa
σ'ri=2000 kPaσ'ri=1000 kPaσ'ri=100 kPa
(a) Effective stress paths
Fitting
Fitting
Fig. 23. Undrained behavior of Toyoura sand prepared by moistureplacement (test data after Ishihara 1993)
Dev
iato
ric
stre
ss (
σ'1-
σ'3)
(kP
a)
σσ'ri = 500 kPa100 kPa
Exp. dataSimulation
σ'ri Confining pressure
σ'ri = 1500 kPa
σ'ri = 3000 kPa
(σ'
1-σ'
3) (
kPa)
σ'ri = 1500 kPa
Exp. dataSimulation
σ'r Confining pressure
σ'r = 3000 kPa
0
500
1000
1500
2000
2500
Dev
iato
ric
stre
ss (
σ'1-
σ'3)
(kP
a)
Mean effective stress p' (kPa)
(a) Effective stress paths
σ'ri = 500 kPa100 kPa
Exp. dataSimulation
σ'ri Confining pressure
σ'ri = 1500 kPa
σ'ri = 3000 kPa
0
500
1000
1500
2000
2500
0 1000 2000 3000 4000
0 0.1 0.2 0.3 0.4
Shea
r st
ress
(σ'
1-σ'
3) (
kPa)
Deviatoric strain εd
(b) Stress and strain relationship
σ'ri = 1500 kPa
σ'ri = 500 kPa
σ'ri = 100 kPa
Exp. dataSimulation
σ'r Confining pressure
σ'r = 3000 kPa
Fig. 24. Undrained behavior of Toyoura sand prepared by moistureplacement (test data after Ishihara 1993)
INTERNATIONAL JOURNAL OF GEOMECHANICS © ASCE / MAY/JUNE 2011 / 235
Int. J. Geomech. 2011.11:225-238.
Dow
nloa
ded
from
asc
elib
rary
.org
by
UN
IVE
RSI
TE
LA
VA
L o
n 07
/04/
14. C
opyr
ight
ASC
E. F
or p
erso
nal u
se o
nly;
all
righ
ts r
eser
ved.

occurring during loading and softening processes. These fea-tures have not been included in this model and can be repre-sented more accurately via models based on the disturbed stateconcept (e.g., Frantziskonis and Desai 1987; Desai 2001).Anisotropic nature of structure soil, which is not consideredin the current model, can also be a possible source of thediscrepancy (e.g., Jardine et al. 2004; Masin 2007; Yildiz et al.2009; Liu and Indraratna 2011).
Soil Properties
The Sydney soil model allows flexibility in specifying soil proper-ties. For example, in describing the elastic volumetric deformation,instead of assuming a linear e� ln p0 relationship, as adopted in theMCC model, any appropriate mathematical form can be adopted ifit better describes the soil behavior. Three functions describing thevolumetric behavior of the soil have to be specified. They are theequations describing Eeðp0Þ, the CSL, and ΔEðp0sÞ.Type and Degree of Soil Structure
The formation of soil structure is an extremely complicated pro-cess. There are many influencing factors that occur during the geo-logical histories of the soil. These are features that usually cannotbe traced accurately for most natural soils. However, in studyingnaturally occurring soils, it is seen that soil structure is character-ized by two features, the type and degree of structure. Comprehen-sive studies on the influence of various soil structures can be foundin works such as by Leroueil and Vaughan (1990) and Jardine et al.(2004). The type of soil structure is dependent on the mechanicaland chemical constraints imposed during the formation of the
structure, and the degree or magnitude of soil structure is dependenton the amount of deformation (and the amount of the chemicalreaction) that has occurred since its formation.
The modeling of soil structure may also be studied in terms ofthe type and degree of soil structure. Parameters used in the Sydneysoil model reflecting the influence of soil structure are n, γ, μ, ω, p0s;i(or the initial structural yield surface), ICL, and ΔEðp0sÞ. It appearsthat parameters n, γ, μ, and ω are mainly dependent on the type ofsoil structure. Parameters p0s;i, ICL, andΔEðp0sÞ depend on both thetype and degree of soil structure, while the mathematical forms ofthe initial structural yield surface, ICL, and ΔEðp0sÞ are dependenton the type of soil structure. The absolute magnitude of the yieldsurface, ICL, andΔEðp0sÞ are dependent on the degree of soil struc-ture. It is well known that the initial structural yield surfaces of soilsamples of similar mineralogy usually possess the same shape butmay have different sizes (e.g., Ladd et al. 1977; Diaz-Rodriguezet al. 1992; Desai et al. 1986; Liu and Carter 1999; Desai 2001;Liu et al. 2003). Therefore, it may be expected that natural soilsfrom the same deposit will generally possess the same type of struc-ture but of varying degrees.
Six sets of numerical simulations were presented in this paper.For five sets, the soil specimens in each set possessed more or lessthe same structure. They are natural Nanticoke clay, Bass Strait car-bonate sand, Fuji sand, a natural calcarenite, and Emmerstad clay. Itwas seen that the behavior of all five types of soil could be simu-lated successfully with one set of structure parameters describingthe type of structure (i.e., n, γ, μ, and ω), but with different valuesfor the different degrees of structure [i.e., p0s;i, ICL, and ΔEðp0sÞ].For Toyoura sand, two different structures were manufacturedin the laboratory by different means of sample preparation. Twoindependent sets of structure parameters were identified. Satisfac-tory numerical simulations were achieved when different sets ofsoil parameters were selected to represent the different methods ofsample preparation.
Based on the performances of the model in these simulations,the following conclusions may be tentatively drawn.1. The influence of soil structure on soil behavior can be modeled
sufficiently well through macroparameters that are determinedfrom the macroresponse of the soil to stress variations.
2. Soil structure may be characterized by its type and degree, andthe parameters in the SS model that reflect the influence ofstructure may be similarly categorized.
Identifying Parameter Values
A significant number of parameters are required to enable theSydney soil model to capture the many types of soil behaviorand the transitions between them. The patterns of soil behaviorin the model are dependent on many factors, such as the positionof the stress path, the elastic deformation properties, the position ofthe critical state line in e� p0 space, the additional voids ratio in thee� p0 space, and the destructuring function. Generally, there maynot be a one-to-one correspondence between the parameter valuesand the predicted soil response. Consequently, injudicious selectionof model parameters may result in large discrepancies betweentheoretical predictions and experimental data.
Experience with this model has revealed the following observa-tions in regard to parameter determination.1. There is generally no difficulty in assessing parameter values
provided sufficient experimental data are available. These datamust be sufficient to determine the critical state strength, M�,the position of the critical state line and virgin isotropiccompression lines in e� p0 space, from which the additionalvoids ratio function ΔE is determined, and an estimate of theinitial yield surface. Without good quality experimental data to
Shea
r st
ress
(σ'
1-σ'
3) (
kPa)
σσ'ri = 500 kPa
Exp. dataSimulation
σ'ri Confining pressure
σ'ri = 1000 kPa
σ'ri = 3000 kPa
σ'1-
σ'3)
(kP
a)
σ'ri = 3000 kPa
Exp. dataSimulation
σ'ri Confining pressure
0
500
1000
1500
2000
Shea
r st
ress
(σ'
1-σ'
3) (
kPa)
Mean effective stress p' (kPa)
(a) Effective stress paths
σ'ri = 500 kPa
Exp. dataSimulation
σ'ri Confining pressure
σ'ri = 1000 kPa
σ'ri = 3000 kPa
0
500
1000
1500
2000
0 1000 2000 3000 4000
0 0.1 0.2 0.3 0.4
Shea
r st
ress
(σ'
1-σ'
3) (
kPa)
Deviatoric strain εd
(b) Stress and strain relationship
σ'ri = 1000 kPa
σ'ri = 3000 kPa
σ'ri = 500 kPa
Exp. dataSimulation
σ'ri Confining pressure
Fig. 25. Undrained behavior of Toyoura sand prepared by moistureplacement (test data after Ishihara 1993)
236 / INTERNATIONAL JOURNAL OF GEOMECHANICS © ASCE / MAY/JUNE 2011
Int. J. Geomech. 2011.11:225-238.
Dow
nloa
ded
from
asc
elib
rary
.org
by
UN
IVE
RSI
TE
LA
VA
L o
n 07
/04/
14. C
opyr
ight
ASC
E. F
or p
erso
nal u
se o
nly;
all
righ
ts r
eser
ved.
identify these parameters, simulations made by the model arelikely to be of little value.
2. Generally, the more parameters that have to be determined bycurve fitting of simulations to experimental measurements, thegreater the difficulty in identifying their values accurately andreliably. This is a problem shared by many constitutive modelsfor soils: A one-to-one relationship between parameter valuesand model simulations is not guaranteed.
3. Obtaining parameters from fully drained loading is relativelysimple. However, for undrained loading small changes in therelationships between the four volumetric deformation compo-nents (i.e., the elastic component and the three plastic compo-nents arising from the intrinsic soil response and the effects ofmean stress and stress ratio change on plastic volume strain)can radically alter the stress path that must be followed in p0-q∧space in order to maintain constant volume deformation,making parameter identification difficult and simulation lessreliable. As stated in point (1), for predicting the behaviorof soils, the most important parameters are those definingthe CSL of the soil for both drained and undrained conditions.The initial void ratio and the mean effective stress of the soilare the two most important parameters describing the initialstatus of the soil.
4. Parameter γ for all six sets of simulations presented was de-termined by curve fitting. The determination of γ by fittingis feasible if all other parameters are known (or their rangeof variation is known), which is the case for the six sets ofsimulations. Generally speaking, it is suggested that parameterγ be determined last. For drained tests, it is suggested that theadjustment of the parameter be made by examining the volu-metric deformation during virgin yielding. For undrained tests,it is suggested that the adjustment of the parameter be made byexamining the p0-q∧ stress path during virgin yielding. As canbe seen in Eq. (25) in the first of this pair of papers, these twofeatures are directly dependent on the value of γ (Liu et al.2010). A reliable value of γ can be found provided that thevalues of all other parameters have been decided. γ ¼ 1may be used if its value cannot be determined conveniently.
5. For many applications constant values may be convenientlyassumed for three parameters, i.e., s� ¼ 1, μ ¼ 0, and ω ¼ 1.
6. Data for natural clays (e.g., Diaz-Rodriguez et al. 1992) showinitial structural yield surfaces that differ significantly from theshape of the assumed reference, unstructured, yield surface.Preliminary studies have shown that modification of the modelto allow for this can significantly improve the quantitative per-formance of the model, and this is the subject of ongoing work.
Conclusion
The ability of the Sydney soil model to represent many aspects ofthe behavior of reconstituted and natural soils has been demon-strated in this paper. It was shown that overall the Sydney soilmodel gives satisfactory descriptions of the behavior of six quitedifferent soils for a wide range of stress levels, stress paths, andsoil types, and it can provide satisfactory qualitative and quantita-tive modeling of many important features of the behavior ofstructured soils.
The central assumption of the Sydney soil model is the existenceof an ultimate critical state of deformation for soil when shearedsufficiently, a characteristic demonstrated by many natural soils.The model demonstrates that accurate allowance for the volumetricdeformation behavior is required to simulate the wide range of soilresponses. This is accommodated in the Sydney soil model by
using functions to capture more accurately this feature of the soilbehavior.
Acknowledgments
Some of the work described here formed part of the researchprogram of the Special Research Centre for Offshore FoundationSystems, established and supported under the Australian ResearchCouncil’s Research Centres Program. In addition, DiscoveryGrants from the Australian Research Council for research intostructured soil behavior are also gratefully acknowledged.
References
Alawi, M. M. (1988). “Experimental and analytical modelling of sandbehaviour under nonproportional loading.” Ph.D. thesis, Univ. ofColorado, Boulder.
Arces, M., Nocilla, N., Aversa, S., and Cicero, G. L. (1998). “Geologicaland geotechnical features of the Calcarenite di Marsala.” The geotech-nics of hard soils–soft rocks, A. Evangelista and L. Picarelli, eds.,Balkema, Rotterdam, Netherlands, 15–25.
Bishop, A. W., Webb, D. L., and Lewin, P. I. (1965). “Undisturbed samplesof London clay from the Ashford Common shaft: Strength-effectivestress relationship.” Géotechnique, 15(1), 1–13.
Burland, J. B. (1990). “On the compressibility and shear strength of naturalsoils.” Géotechnique, 40(3), 329–378.
Carter, J. P., Airey, D. W., and Fahey, M. (2000). “A review of laboratorytesting of calcareous soils.” Engineering for Calcareous Sediments,K. A. Al-Shafei, ed., Vol. 2, Balkema, Rotterdam, Netherlands,401–431.
Desai, C. S. (2001). Mechanics of materials and interfaces: The disturbedstate concept, CRC Press, Boca Raton, FL.
Desai, C. S., Somasundaram, S., and Frantziskonis, G. (1986). “A hierar-chical approach for constitutive modelling of geologic materials.” Int. J.Numer. Anal. Methods Geomech., 10, 225–257.
Diaz-Rodriguez, J. A., Leroueil, S., and Aleman, J. D. (1992). “Yielding ofMexico City clay and other natural clays.” J. Geotech. Eng., 118(7),981–995.
Frantziskonis, G., and Desai, C. S. (1987). “Constitutive model with strainsoftening.” Int. J. Solids Struct., 23(6), 733–750.
Georgiannou, V. N., Burland, J. B., and Hight, D. W. (1993). “The behav-iour of two hard clays in direct shear.”Geotechnical engineering of hardsoils–soft rocks, A. Anagnostopoulos, ed., Vol. 1, Balkema, Rotterdam,Netherlands, 501–507.
Graham, J., and Li, C. C. (1985). “Comparison of natural and remouldedplastic clay.” J. Geotech. Eng., 111(7), 865–881.
Horpibulsuk, S., Liu, M. D., Liyanapathirana, S., and Suebsook, J. (2010).“Behaviour of cemented clay simulated via the theoretical framework ofthe SCC model.” Comput. Geotech., 37(1), 1–9.
Houlsby, G. T., Wroth, C. P., and Wood, D. M. (1982). “Prediction ofthe results of laboratory tests on a clay using a critical state model.”Proc., Int. Workshop on Constitutive Behaviour of Soils, G. Gudehus,F. Darve, and I. Vardoulakis, eds., Balkema, Rotterdam, Netherlands,99–121.
Ishihara, K. (1993). “Liquefaction and flow failure during earthquakes.”Géotechnique, 43(3), 351–415.
Jardine, R. J., Gens, A., Hight, D. W., and Coop, M. R. (2004). “Develop-ment in understanding soil behaviour.” Advances in GeotechnicalEngineering: The Skempton Conference, R. J. Jardine, D. M. Potts,and K. G. Higgins, eds., Vol. 1, Thomas Telford, London, 103–248.
Khalili, N., and Liu, M. D. (2008). “On generalisation of constitutive mod-els from two dimensions to three dimensions.” Int. J. Numer. Anal.Methods Geomech., 32, 2045–2065.
Kolymbas, D., and Wu, W. (1990). “Recent results of triaxial tests withgranular materials.” Powder Technol., 60, 99–119.
Lacasse, S., Berre, T., and Lefebvre, G. (1985). “Block sampling of sensi-tive clays.” Proc., 11th Int. Conf. on Soil Mechanics and FoundationEngineering, Vol. 2, Taylor & Francis, London, 887–892.
INTERNATIONAL JOURNAL OF GEOMECHANICS © ASCE / MAY/JUNE 2011 / 237
Int. J. Geomech. 2011.11:225-238.
Dow
nloa
ded
from
asc
elib
rary
.org
by
UN
IVE
RSI
TE
LA
VA
L o
n 07
/04/
14. C
opyr
ight
ASC
E. F
or p
erso
nal u
se o
nly;
all
righ
ts r
eser
ved.

Ladd, C. C., Foott, R., Ishihara, K., Schlosser, F., and Poulos, H. G. (1977).“Stress-deformation and strength characteristics.” Proc., 9th Int. Conf.on Soil Mechanics and Foundation Engineering, Tokyo, Vol. 2,421–494.
Lade, P. V., and Musante, H. M. (1978). “Three-dimensional behaviour ofremoulded clay.” J. Geotech. Eng., 104(2), 193–209.
Lagioia, R., and Nova, R. (1995). “An experimental and theoretical study ofthe behaviour of a calcarenite in triaxial compression.” Géotechnique,45(4), 633–648.
Leroueil, S., and Vaughan, P. R. (1990). “The general and congruent effectsof structure in natural soils and weak rocks.” Géotechnique, 40(3),467–488.
Liu, M. D., and Carter, J. P. (1999). “Virgin compression of structuredsoils.” Géotechnique, 49(1), 43–57.
Liu, M. D., and Carter, J. P. (2000a). “Modelling the destructuring of soilsduring virgin compression.” Géotechnique, 50(4), 479–483.
Liu, M. D., and Carter, J. P. (2000b). “On the volumetric deformation ofreconstituted soils.” Int. J. Numer. Anal. Methods Geomech., 24(2),101–133.
Liu, M. D., and Carter, J. P. (2002). “Structured Cam clay model.” Can.Geotech. J., 39(6), 1313–1332.
Liu, M. D., and Carter, J. P. (2003a). “A general strength criterion forgeo-materials.” Int. J. Geomech., 3(2), 253–259.
Liu, M. D., and Carter, J. P. (2003b). “The volumetric deformation ofnatural clays.” Int. J. Geomech., 3(2), 236–252.
Liu, M. D., Carter, J. P., and Airey, D. W. (2011). “Sydney soil model. I:Theoretical formulation.” Int. J. Geomech., 11(3), 211–224.
Liu, M. D., Carter, J. P., and Desai, C. S. (2003). “Modelling thecompression behaviour of geo-materials.” Int. J. Geomech., 3(2),191–204.
Liu, M. D., Hull, T. S., and Carter, J. P. (2000). “Compression behaviourof sands.” Research Rep. No. 801, Sydney Univ., Sydney,Australia.
Liu, M. D., and Indraratna, B. N. (2011). “General strength criterion forgeomaterials including anisotropic effect.” Int. J. Geomech., 11(3),251–262.
Lo, K. Y. (1972). “An approach to the problem of progressive failure.” Can.Geotech. J., 9(4), 407–429.
Masin, D. (2007). “A hypoplastic constitutive model for clays with
meta-stable structure.” Can. Geotech. J., 44(3), 363–375.Matsuoka, H., and Nakai, T. (1982). “A new failure criterion for soils in
three dimensional stress.” Proc., IUTAM Conf. on Deformation andFailure of Granular Materials, Balkema, Rotterdam, Netherlands,253–263.
Muir-Wood, D. (1990). Soil behaviour and critical state soil mechanics,Cambridge University Press, Cambridge, UK.
Muir-Wood, D., Belkheir, K., and Liu, D. F. (1994). “Strain softeningand state parameter for sand modelling.” Géotechnique, 44(2),335–339.
O’Rourke, T. D., and Crespo, E. (1988). “Geotechnical properties ofcemented volcanic soil.” J. Geotech. Eng., 114(10), 1126–1147.
Potts, D. M., and Zdravkovic, L. (1999). Finite element analysis ingeotechnical engineering: Theory, Thomas Telford, London.
Poulos, H. G., Uesugi, M., and Young, G. S. (1982). “Strength and defor-mation properties of Bass Strait carbonate sands.” Geotech. Eng., 15,189–211.
Robinet, J. C., Pakzad, M., Jullien, A., and Plas, F. (1999). “A general mod-elling of expansive and non-expansive clays.” Int. J. Numer. Anal.Methods Geomech., 23, 1319–1335.
Rouainia, M., and Muir Wood, D. (2000). “A kinematic hardening modelfor natural clays with loss of structure.” Géotechnique, 50(2), 153–164.
Schofield, A. N. (1980). “Cambridge centrifuge operations.”Géotechnique,30(3), 227–268.
Sitharam, T. G., Vinod, J. S., and Ravishakar, B. V. (2009). “Post-liquefaction undrained monotonic behaviour of sands: Experimentsand DEM simulations.” Géotechnique, 59(9), 739–749.
Vaughan, P. R. (1994). “Assumption, prediction and reality in geotechnicalengineering.” Géotechnique, 44(4), 573–609.
Wong, R. C. K. (1998). “Swelling and softening behaviour of La Bicheshale.” Can. Geotech. J., 35, 206–221.
Yamada, Y. (1979). “Deformation characteristics of loose sand under threedimensional stress conditions.” Ph.D. thesis, Tokyo Univ., Tokyo.
Yamada, Y., and Ishihara, K. (1982). “Yielding of loose sand in threedimensional stress conditions.” Soils Found., 22(3), 15–31.
Yildiz, A., Karstunen, M., and Krenn, H. (2009). “Effect of anisotropy anddestructuration on behavior of Haarajoki test embankment.” Int. J.Geomech., 9(4), 153–168.
238 / INTERNATIONAL JOURNAL OF GEOMECHANICS © ASCE / MAY/JUNE 2011
Int. J. Geomech. 2011.11:225-238.
Dow
nloa
ded
from
asc
elib
rary
.org
by
UN
IVE
RSI
TE
LA
VA
L o
n 07
/04/
14. C
opyr
ight
ASC
E. F
or p
erso
nal u
se o
nly;
all
righ
ts r
eser
ved.