swiss re group third quarter 2012 report · 2018-07-13 · swiss re third quarter 2012 report 3...
TRANSCRIPT

Swiss Re GroupThird Quarter 2012 Report

USD millions, unless otherwise stated 2011 2012 Change in %
GroupNet income attributable to common shareholders 1 348 2 182 62Premiums earned and fee income 5 949 6 580 11Earnings per share in CHF 3.46 5.96Shareholders’ equity (31.12.2011/30.09.2012) 29 590 33 544 13Return on equity1 in % (annualised) 20.5 28.0Return on investments in % (annualised) 5.8 4.5Number of employees2 (31.12.2011/30.09.2012) 10 788 11 071
Property & Casualty ReinsuranceNet income attributable to common shareholders 731 1 030 41Premiums earned and fee income 2 878 3 296 15Combined ratio in % 81.5 69.3Return on equity1 in % (annualised) 31.2 36.6
Life & Health ReinsuranceNet income attributable to common shareholders 492 187 –62Premiums earned and fee income 2 136 2 265 6Benefit ratio in % 76.7 79.0Return on equity1 in % (annualised) 27.0 9.9
Corporate SolutionsNet income attributable to common shareholders 67 110 64Premiums earned and fee income 523 588 12Combined ratio in % 106.7 87.4Return on equity1 in % (annualised) 12.2 16.6
Admin Re®Net income attributable to common shareholders 195 823 322Premiums earned and fee income 410 427 4Return on equity1 in % (annualised) 12.1 48.9
1 Return on equity is calculated by dividing annualised net income attributable to common shareholders by average common shareholders’ equity.
2 Regular staff
Key information
Financial strength ratingsAs of 31 October 2012 S&P Moody’s A.M. Best
Rating AA– A1 A+Outlook stable positive stable
Share informationAs of 31 October 2012
Share price in CHF 64.35Market capitalisation in CHF millions 22 085
Share performancein % Year to 31 October 2012
Swiss Re –7.8 34.4Swiss Market Index –4.8 11.1STOXX Europe 600 Insurance Index –8.9 24.8
Financial highlights (unaudited)For the three months ended 30 September
Share price (CHF)
20
40
60
80
100
120
140
160
02011 20122010200920082007
Swiss Re Swiss Market Index STOXX Europe 600 Insurance Index
1 January 2007 – 31 October 2012 (p.a.)
Swiss Re Third Quarter 2012 Report 1
Swiss Re Ltd Swiss Re Ltd is the holding company of the Swiss Re Group. Its shares are listed on the SIX Swiss Exchange and trade under the symbol SREN.
Content
02 Letter to shareholders 04 Key events06 Group results08 Reinsurance08 Property & Casualty Reinsurance09 Life & Health Reinsurance10 Corporate Solutions11 Admin Re®12 Outlook
14 Financial statements14 Income statement 15 Statement of comprehensive
income 16 Balance sheet 18 Statement of equity20 Statement of cash flow
23 Notes to the Group financial statements
23 Note 1 Organisation and summary of significant accounting policies
25 Note 2 Investments31 Note 3 Fair value disclosures49 Note 4 Derivative financial
instruments54 Note 5 Deferred acquisition
costs (DAC) and acquired present value of future profits (PVFP)
56 Note 6 Acquisitions and disposals
58 Note 7 Debt and contingent capital instruments60 Note 8 Insurance information 69 Note 9 Premiums written 70 Note 10 Earnings per share71 Note 11 Benefit plans72 Note 12 Commitments and
contingent liabilities74 Note 13 Information on business
segments88 Note 14 Variable interest entities93 Note 15 Subsequent events
94 General information95 Note on risk factors102 Cautionary note on forward-
looking statements

2 Swiss Re Third Quarter 2012 Report
Letter to shareholders
Michel M. Liès Group CEO
A very strong quarter for Swiss Re.
Dear shareholders
We are pleased to present to you the results of a very strong third quarter in 2012, with a Group net income of USD 2.2 billion, an increase of 62% year-on-year. Our return on equity was an exceptional 28%, with a strong underlying performance boosted by one-time gains from the sale of Admin Re’s US business.
These results are a source of pride, all the more so for being earned in an uncertain market environment. While tension surrounding the eurozone diminished somewhat in the third quarter, the prospects for growth and stability are far from clear. European economic indicators stabilised in the third quarter, albeit at levels still consistent with lingering recession in many countries. In the US, economic indicators point to ongoing moderate growth. Meanwhile the Chinese economy, an engine of growth in recent years, shows ever more apparent signs of cooling.
These conditions inevitably colour the outlook for our industry. Low interest rates are a global challenge. Regulatory conditions are varied internationally, but virtually everywhere the signs are for more stringent capital requirements. Meanwhile natural catastrophes, while benign in the third quarter, remain an ever-present challenge, as we were reminded by Hurricane Sandy.
Given these challenges it is all the more imperative that we continually reaffirm our commitment to the financial targets we established in 2011. Achieving these three targets by 2015 remains our top priority. First, we aim for a return on equity of at least 7 percentage points above the average ‘risk-free’ rate. As of the end of September we are ahead of that target. We seek to grow earnings per share by an average of 10% per year over the five years from 2011 to 2015. We are ahead of that target as well. Finally, we aim to deliver an increase in shareholder value, defined on an economic basis, of 10% per year. Comparing the first half of 2012 to the first half of 2011, we are just slightly behind schedule. These targets are the best guideposts for prudently managing our business. We aim to maintain and grow our regular dividend with earnings going forward.
Our operational strengths give us every confidence that we can continue to make progress against this strategy. We uphold our long tradition of underwriting excellence through continuous research and development, sharing the benefits with clients, brokers and the broader public. The new Global Flood Zones application, for example, is helping to raise awareness and promote preparedness against the growing risk of floods. We continue to publish original research on shortfalls in mortality protection across countries, most recently in September for the US. Such activities underlie our ability to write profitable business and to build more resilient communities, notably in high growth markets such as China, India and Brazil. We aim to generate 20%—25% of our business in such markets by 2015, many of which remain underserved by re/insurance solutions.
Walter B. Kielholz Chairman of the Board of Directors

Swiss Re Third Quarter 2012 Report 3
Letter to shareholders
2.2 Group net incomeUSD billions
5.96Earnings per sharein CHF
28%Annualised return on equity(Group)
Walter B. Kielholz Michel M. LièsChairman of the Board of Directors Group CEO
Zurich, 8 November 2012
We also aim to actively create new and sustainable business opportunities. A few years ago, for example, we started to explore ways to transform risk management in the public sector. This October we marked the third renewal of a pioneering arrangement whereby the Mexican government transfers catastrophe risk to the capital markets. In September we became the official insurance provider for Solar Impulse, the world’s first purely solar powered airplane to fly through the night. Such forward thinking makes it clear why Swiss Re has been named the most sustainable company in the insurance sector for the fifth year in a row by Sustainable Asset Management (SAM) in one of the world’s leading corporate sustainability rankings. This puts us ahead of over 120 sector competitors in the 2012 Dow Jones Sustainability Index (DJSI) review, one of the most important sustainability benchmarks globally.
We are pleased to welcome two new members to our Group Executive Committee. John Dacey, Head Group Strategy & Strategic Investments, has been promoted to the Group Executive Committee and named Chairman of our Admin Re® business. And while we regret the departure of Group Chief Investment Officer David Blumer, who leaves a track record of excellent investment returns after more than four years with us, we are pleased to be able to fill the vacancy with an internal candidate, Guido Fürer. Guido has been with us for more than 15 years. His experience and expertise ensure that our very successful asset management strategy will continue to be implemented in a consistent and transparent manner.
Our thanks go out to the more than 11,000 employees of Swiss Re who have made these results possible. They are working closely with clients to build solutions that are relevant to society and that, taken together, will make good on the investment you have placed in us as our shareholders.
We thank you for your trust.

4 Swiss Re Third Quarter 2012 Report
Key events28 August 2012Corporate Solutions opens office in the NetherlandsSwiss Re Corporate Solutions announced the opening of an office in Amstelveen, the Netherlands, to reinforce its presence in the Benelux region. The office will provide insurance solutions to large and upper-middle market corporations domiciled in the region, offering a broad range of property, casualty and industry-specific products.
30 August 2012MiCRO and Fonkoze insurance payout helps Haitians rebuild businesses after Tropical Storm Isaac The reinsurance company Microinsurance Catastrophe Risk Organisation (MiCRO) announced that it would make a significant payout to Haiti’s largest microfinance institution Fonkoze following Tropical Storm Isaac. Fonkoze will use these funds to pay a fixed sum of Haitian Gourdes 5 000 (USD 125) to hundreds of female entrepreneurs who lost their homes or inventories due to the storm. MiCRO is a reinsurance company formed in March 2011 by Fonkoze and the global humanitarian agency Mercy Corps with the support of the UK’s Department for International Development (DFID) and Swiss Re.
4 September 2012Swiss Re completes the sale of Admin Re® US business to Jackson National Life InsuranceSwiss Re completed the sale of its Admin Re® US business to Jackson National Life Insurance Company. The transaction was announced on 31 May 2012.
6 September 2012Publication finds cost of floods has more than doubled in last ten yearsThe Swiss Re publication “Flood – an underestimated risk” finds that insured flood losses have increased significantly, from USD 1 billion–2 billion in 1970 to USD 15 billion in 2011.
Flood losses are increasing at an alarming rate, while the insurability of floods provides unique challenges for the industry, according to the report. No other natural catastrophe impacts as many people as flooding, with an estimated 500 million people affected every year. Recent flood events in Thailand, Australia and the Philippines have shown that floods now rival earthquakes and hurricanes in terms of economic losses.
10 September 2012Les Rendez-vous de Monte Carlo Swiss Re pointed to an increased focus on economic capital due to new solvency rules and rising pressure on investment returns from record-low interest rates as major factors driving re/insurance pricing. With prices expected to increase moderately, Swiss Re is prepared to support clients on a sustainable basis and to deploy more capital to those areas that it believes offer the most attractive returns.
While traditional markets will remain the mainstay of Swiss Re’s global business, selected high growth markets offer tangible opportunities for non-life and life solutions that can be seized through Swiss Re’s unique combination of Reinsurance, Corporate Solutions, Global Partnerships and Direct Investment expertise.
28 September 2012Swiss Re proposes election of Mary Francis to its Board of DirectorsSwiss Re’s Board of Directors will propose Mary Francis for election to the Board of Directors of Swiss Re Ltd at the next Annual General Meeting on 10 April 2013. If elected, she will join the Board of Directors as a new non-executive, independent member for a three-year term of office. Effective 1 October 2012, she joined the Board of Directors of Swiss Reinsurance Company Ltd (SRZ), the principal operating company for Swiss Re’s reinsurance business.
19 October 2012Swiss Re appoints two new members to its Group Executive CommitteeSwiss Re’s Board of Directors announced that Guido Fürer would be appointed Group Chief Investment Officer and Member of the Group Executive Committee, effective 1 November 2012. Additionally, John R. Dacey, Swiss Re’s Head Group Strategy & Strategic Investments, was named as a new Member of the Group Executive Committee, effective 1 November 2012. John R. Dacey will also become Chairman of Swiss Re’s Admin Re® business.

Swiss Re Third Quarter 2012 Report 5
This page intentionally left blank

6 Swiss Re Third Quarter 2012 Report
The very strong Group combined ratio of 72.0% in the third quarter of 2012, compared to 85.3% in the same period of the prior year, was driven by very low natural catastrophe losses, successful 2012 renewals and positive development of prior-year reserves.
Return on investments was 4.5%, compared to 5.8% for the same period in 2011, mainly driven by lower foreign exchange gains compared to the prior-year period. Return on investments excluding foreign exchange impacts was 4.6% in the reporting period compared to 3.4% in third quarter of 2011.
Shareholders’ equity increased USD 2.5 billion to USD 33.5 billion compared to 30 June 2012 driven by the net income for the third quarter of 2012. For the third quarter of 2012, annualised return on equity was 28.0%, compared to 9.6% for the full year 2011, and 20.5% (annualised) for the third quarter of 2011. During the third quarter of 2012 non-controlling interests decreased by USD 1.9 billion, reflecting the sale of Swiss Re Private Equity Partners AG and the acquisition of the ownership interest in New California Holdings, Inc.
Book value per common share was USD 94.47 or CHF 88.79 at the end of September 2012, compared to USD 87.03 or CHF 82.38 at the end of June 2012. Book value per common share is based on common shareholders’ equity and excludes non-controlling interests and the impact of contingent capital instruments.
For information on segment shareholders’ equity, please see pages 80 to 81.
Swiss Re reported a net income of USD 2.2 billion for the third quarter of 2012, compared to a net income of USD 1.3 billion in the prior-year period. Earnings per share were CHF 5.96 or USD 6.33, compared to CHF 3.46 or USD 3.94 in the third quarter of 2011.
The Group results in the third quarter of 2012 reflect a strong underlying performance supported by a very benign natural catastrophe experience in the quarter and prior-year reserve releases. In addition, the impact from the completion of the sale of the Admin Re® US holding company, including Reassure America Life Insurance Company (REALIC), to Jackson National Life Insurance Company as well as other realised gains on investments further contributed to the exceptionally positive Group net income.
Property & Casualty Reinsurance reported very strong net income of USD 1 030 million, benefiting from very low natural catastrophe losses, successful 2012 renewals and positive development of prior-year reserves. Life & Health Reinsurance delivered net income of USD 187 million compared to USD 492 million in the third quarter of 2011. The Life & Health Reinsurance result from the third quarter of 2011 included exceptionally large realised gains on investments, foreign exchange gains and favourable morbidity.
Corporate Solutions delivered net income of USD 110 million, reflecting lower natural catastrophe and man-made losses and continued premium growth.
Admin Re® reported net income of USD 823 million, which includes a gain of USD 639 million driven by the realisation of previously unrealised gains on the investments backing the insurance liabilities transferred to Jackson National Life Insurance Company. Excluding the impact of the sale, Admin Re® reported net income of USD 197 million during the third quarter.
Group results Third quarter 2012 operating performancePremiums earned increased 15% to USD 3.3 billion for Property & Casualty Reinsurance compared to the prior-year period. The increase reflects successful renewals in 2012 and continued earnings from large quota share treaties written in 2011. Life & Health Reinsurance premiums and fees increased 6%, driven by higher rates in the Americas and new health business in all regions. Corporate Solutions premiums earned increased 12% to USD 588 million, reflecting strong growth across all major lines of business.
The Group’s net investment income decreased slightly to USD 1.0 billion, compared to USD 1.1 billion in the same period of the prior year. The Group running yield was 3.1% in the reporting period, compared to 3.5% in the same period of the prior year. Lower yields on new purchases of government bonds were partly offset by higher returns on corporate bonds and income from private equity investments. In addition, the sale of the Admin Re® US business reduced the Group’s corporate bonds positions, negatively impacting the average yield of the Group’s investment portfolio.
The Group reported non-participating net realised investment gains of USD 1.2 billion in the third quarter of 2012, compared to gains of USD 1.0 billion in the same period of the prior year. Excluding the impacts from the sale of the Admin Re® US holding company to Jackson National Life Insurance Company, the realised investment gains were USD 0.6 billion. The third quarter of 2011 had benefited from large mark-to-market gains on trading assets and favourable foreign exchange impacts.
Property & Casualty Reinsurance claims expenses decreased by USD 0.2 billion compared to the same period of the prior year. The combined ratio of 69.3% reflects a very benign large loss experience and favourable net reserve development for prior years.

Swiss Re Third Quarter 2012 Report 7
Group results
The Corporate Solutions result reflects lower catastrophe and man-made losses and favourable net reserve development compared to the third quarter of 2011. The combined ratio in the reporting period was 87.4%, compared to 106.7% in the same period of the prior year.
Life & Health Reinsurance benefits increased 2% to USD 1.8 billion compared to the prior-year quarter, mainly due to higher cost of claims and adverse development in the pre-2004 US business. The benefit ratio increased to 79.0% in the third quarter of 2012, compared to 76.7% in the same period of 2011.
Returns credited to policyholders reflect the investment performance on the underlying assets, mainly backing unit-linked and with-
profit policies, which are passed through to policyholders. In the third quarter of 2012, an investment gain of USD 1.0 billion was passed through to policyholders compared to a loss of USD 2.2 billion in the prior-year period.
Acquisition costs for the Group increased 3% to USD 1.2 billion, reflecting higher business volumes across segments.
Administrative expenses were USD 820 million, 4% lower compared to the prior-year period which was impacted by various initiatives related to the implementation of the new Group structure. Other expenses increased USD 39 million to USD 108 million.
Interest expenses were USD 180 million, a decrease of 16% over 2011, mainly due to maturities of debt positions.
The Group reported a tax expense of USD 412 million on a pre-tax income of USD 2.6 billion in the third quarter of 2012, compared to an expense of USD 206 million on a pre-tax income of USD 1.6 billion for the same period in 2011. The results reflect an effective tax rate in the current and prior-year reporting periods of 15.7% and 12.5%, respectively. The gain recorded in the third quarter of 2012 on the sale of the Admin Re® US business was not taxable and led to a reduction in the Group’s effective tax rate. In addition the UK tax rate reduction improved the tax rate in the third quarter of 2012. The third quarter of 2011 benefited from a reserve release for an uncertain tax liability.
Income statementUSD millions, for the three months ended 30 September 2011 2012 Change in %
RevenuesPremiums earned 5 737 6 388 11Fee income from policyholders 212 192 –9Net investment income – non-participating 1 081 1 019 –6Net realised investment gains/losses – non-participating 952 1 163 22Net investment result – unit-linked and with-profit –2 344 969Other revenues 10 84Total revenues 5 648 9 815 74
ExpensesClaims and claim adjustment expenses –1 895 –1 660 –12Life and health benefits –2 045 –2 280 11Return credited to policyholders 2 193 –983Acquisition costs –1 115 –1 152 3Administrative expenses –855 –820 –4Other expenses –69 –108 57Interest expenses –214 –180 –16Total expenses –4 000 –7 183 80
Income before income tax expense 1 648 2 632 60Income tax expense –206 –412 100Net income before attribution of non-controlling interests 1 442 2 220 54
Income attributable to non-controlling interests –94 –20 –79Net income after attribution of non-controlling interests 1 348 2 200 63
Interest on contingent capital instruments1 0 –18Net income attributable to common shareholders 1 348 2 182 62
1 Please refer to Note 7 and Note 10 for details on the impact of the contingent capital instruments on earnings.

8 Swiss Re Third Quarter 2012 Report
Reinsurance The Reinsurance Business Unit reports the segments Property & Casualty Reinsurance and Life & Health Reinsurance.
Property & Casualty ReinsuranceNet income for the third quarter of 2012 increased to USD 1.0 billion, compared to USD 0.7 billion in the third quarter of 2011, reflecting the very benign natural catastrophe experience in the third quarter of 2012. Both reporting periods benefited from prior-year reserve releases.
Net premiums earned Net premiums earned increased 14.5% to USD 3.3 billion in the third quarter of 2012, compared to USD 2.9 billion in the same period of 2011, mainly driven by large capital relief quota shares written since the second half of 2011.
Combined ratioFollowing successful renewals in 2012, Property & Casualty Reinsurance reported a very strong combined ratio of 69.3% for the third quarter of 2012, compared to 81.5% in the prior-year period. The improvement was largely driven by the very benign natural catastrophe experience in the third quarter of 2012, as well as by favourable claims development from prior accident years.
The impact from natural catastrophes in the third quarter of 2012 was 10.3 percentage points below the expected level, and the favourable development of prior accident years improved the 2012 combined ratio by 12.5 percentage points.
Expense ratioThe expense ratio decreased to 11.3% in the third quarter of 2012 compared to 12.7% in the same period of 2011, mainly driven by premium growth year on year.
Lines of businessThe property combined ratio improved to 57.7% in the third quarter of 2012, compared to 73.3% in the third quarter of 2011, reflecting the more benign natural catastrophe experience in the reporting period.
The casualty combined ratio was 93.0% in the third quarter of 2012, compared to 111.9% in the third quarter of 2011. The improvement was mainly due to favourable net development of prior accident years in the third quarter of 2012, whereas the third quarter of the prior year saw net reserve additions.
The specialty combined ratio remained flat at 54.5% in the third quarter of 2012, compared to 54.0% in the same period of 2011. Both periods benefited from good claims experience in prior accident years.
Investment resultThe annualised return on investment increased to 3.6% in the third quarter of 2012, compared to 2.5% in the same period of 2011, mainly due to higher net investment income year on year, driven by favourable mark-to-market valuations on private equity investments in the third quarter of 2012.
Compared to the third quarter of 2011, net realised investment gains decreased USD 88 million to USD 82 million in the third quarter of 2012, mainly due to lower gains from government bond sales and increased volume of derivative-accounted natural catastrophe bonds.
Return on equity The annualised return on equity for the third quarter of 2012 was 36.6%. The exceptional performance was mainly due to the outstanding underwriting result, as well as to the continued good investment performance in a low-yield market environment.
OutlookWe expect to continue benefiting from growth in the Property & Casualty Reinsurance portfolio in an environment of moderately increasing reinsurance prices. Swiss Re is well positioned to support clients in both developed and high growth markets, leveraging its capacity, balance sheet strength and expertise in structuring large and bespoke transactions. The expiry of the quota share arrangement with Berkshire Hathaway at the end of this year will be a significant driver for premium growth in 2013.

Swiss Re Third Quarter 2012 Report 9
Reinsurance
Net income was USD 187 million in the third quarter of 2012, lifted by significant realised gains. This compared with a profit of USD 492 million in the same period of 2011. The Life & Health result from the third quarter of 2011 included exceptionally large realised gains on investments, foreign exchange gains and favourable morbidity.
Net realised gains in the third quarter of 2012 decreased by USD 277 million due to lower gains on sales of securities of USD 163 million and lower insurance-related derivative gains of USD 114 million. Investment income was lower by USD 124 million primarily due to cedent updates, lower yields, and the transfer of business from the Life & Health Reinsurance segment to the Admin Re® segment (effective 1 July 2012). The decrease in the health result is primarily due to favourable morbidity in the prior year attributable to a model adjustment in 2011 not repeated in the current year.
Net premiums earned Premiums earned and fee income increased 6.0% to USD 2.3 billion in the third quarter of 2012, compared to USD 2.1 billion in the third quarter of 2011. The increase was primarily a result of increased health premiums due to business growth in all regions.
Benefit ratio The benefit ratio was 79.0% in the third quarter of 2012 compared to 76.7% in the same period of the prior year. The increase was mainly due to favourable morbidity in the prior year attributable to a prior-year model adjustment not repeated in the current year and adverse results from the pre-2004 US business.
Expense ratioThe management expense ratio increased to 8.6% in the reporting period from 7.9% in the third quarter of 2011. The increase was primarily due to higher administrative costs.
Lines of businessA geographically diversified business mix and a continued disciplined pricing approach provided for a stable underlying business result; however, volatile financial markets and changes in the interest rate environment impacted both the life and the health individual segment results.
Operating income for traditional life business decreased to USD 60 million in the third quarter of 2012 from USD 93 million in the same period of 2011. The result was driven primarily by unfavourable variable annuity business, lower investment income, and unfavourable experience from pre-2004 US business, offset by gains from the B36 embedded derivatives primarily due to an increase in long-term risk-free interest rates and favourable mortality trends.
Operating income for the traditional health business decreased to USD 63 million in the third quarter of 2012, compared to USD 193 million in the third quarter of 2011. The result was driven by unfavourable morbidity experience, favourable morbidity in the prior year relating to the model adjustment not repeated in the current year, lower investment income and higher administrative expenses.
Investment resultThe return on investment was 5.8% in the third quarter of 2012. Realised investment gains were USD 288 million in the third quarter of 2012 compared to USD 451 million in the same period of 2011. The decrease in investment gains was primarily due to less favourable foreign exchange rate movements in the current year.
Return on equityThe annualised return on equity was 9.9% for the third quarter of 2012.
OutlookGrowth in the traditional life business is expected to be muted as cession rates are expected to decrease as primary insurers retain more risk. The low interest rate environment will also continue to have an unfavourable impact on the growth of long-term life business for our cedents. In this environment Life & Health Reinsurance aims to proactively manage the pre-2004 US business in order to improve profitability, write new business at attractive rates (including through large transactions) as well as diversifying into longevity risk. Furthermore, Swiss Re is planning to offer its solutions and services in several attractive, growing markets where major demographic and socio-economic trends are leading to increased demand for health insurance, including in Asia.
Life & Health Reinsurance

10 Swiss Re Third Quarter 2012 Report
Corporate SolutionsNet income reached USD 110 million in the third quarter of 2012, an increase of 64% compared to net income of USD 67 million in the same period of 2011.
The result was mainly attributable to the absence of material losses in the quarter, both natural catastrophe and man-made, combined with continued premium growth, compared to the same period of 2011.
Net income in the reporting period also benefited from some realised gains, as well as gains on insurance business written in derivative form.
Net premiums earnedNet premiums earned increased 12% to USD 588 million in the third quarter of 2012, compared to USD 523 million in the same period of 2011. This increase was driven by successful organic growth across all major lines of business.
Combined ratioThe combined ratio improved by 19.3 percentage points to 87.4% in the third quarter of 2012 from 106.7% in the same period of 2011. The drivers for this were the same as those mentioned above. The expense ratio increased to 36.1% in the third quarter of 2012, compared to 32.5% in the same period of 2011, due to continued investment in growth and a profit commission effect related to a reinsurance contract. The latter increased acquisition expenses by 1.3 percentage points.
Lines of businessThe property combined ratio improved 51.6 percentage points to 80.1% in the third quarter of 2012, reflecting prior-period positive development and lower natural catastrophe losses (eg Hurricane Irene) than experienced in the same period of 2011.
The casualty combined ratio improved 17.8 percentage points to 82.2% in the third quarter of 2012, mainly due to the positive prior-year reserve development and lack of large losses in 2012.
The credit combined ratio was 81.7% in the third quarter of 2012, compared to 60.4% in the same quarter of 2011, mainly driven by the profit commission effect mentioned above.
In other specialty, the combined ratio rose slightly to 106.1% in the third quarter of 2012, compared to 103.7% in the third quarter of 2011. Both periods were impacted by satellite losses.
Investment resultReturn on investments decreased to 3.0% in the third quarter of 2012 from 7.9% in the same period of 2011. While net investment income was flat year on year, significantly lower realised gains on asset sales led to an overall reduction. Realised insurance derivative gains, which are not included in return on investments, increased to USD 35 million in the third quarter of 2012, compared to USD 15 million in the same period of 2011. These contracts offer protection against weather perils and other risks related to insurance, but are accounted for as derivatives.
Return on equityAnnualised return on equity increased to 16.6% in the third quarter of 2012, compared to 3.7% at the end of 2011.
OutlookPricing trends for corporate insurance are starting to improve, though differences in quality between geographies and types of business continue to exist. The most pronounced price increases were again in North America. In Europe, concerns over credit standing of some competitors have increased, leading to a flight to quality by a growing number of corporations. Corporate Solutions believes it is well positioned to capture opportunities thanks to its value proposition, strong balance sheet and expanding geographic reach.

Swiss Re Third Quarter 2012 Report 11
Admin Re®Net income in the third quarter of 2012 amounted to USD 823 million. This includes USD 626 million related to the sale of Admin Re® US. Excluding this gain, net income was USD 197 million compared to USD 195 million in the prior-year period. The underlying net income is consistent between periods but both contain a number of non-recurring items, including reserve releases in 2012 and 2011, plus for 2011 a write-down in the present value of future profits and a one-time tax credit in the UK.
Swiss Re completed the sale of its Admin Re® US holding company, including Reassure America Life Insurance Company (REALIC), to Jackson National Life Insurance Company on 4 September 2012. The sale closed with Swiss Re receiving total cash proceeds of USD 859 million including a pre-close dividend, with a further estimated USD 74 million deferred until 2013. Net unrealised gains of USD 639 million were realised upon the close, which together with an additional loss of USD 13 million led to a cumulative loss on the disposal of USD 399 million. A loss of USD 1 025 million was already recognised in the second quarter of 2012. Admin Re® has retained certain blocks of its former US business, mainly corporate-owned life insurance and traditional life and health and annuity products reinsured through other Swiss Re entities.
Operating revenuesPremiums and fee income were USD 427 million in the third quarter of 2012, compared to USD 410 million in the prior-year period. The increase was mainly due to new business recognised in 2012 plus greater fee income for unit-linked business, partially offset by the impact of the Admin Re® US disposal.
Gross cash generationAdmin Re® generated gross cash of USD 1 065 million for the third quarter of 2012, compared to USD 75 million in the third quarter of 2011. The increase was mainly due to the cash proceeds and release of capital from the sale of the Admin Re® US business. Additional gross cash generation of USD 242 million came from the UK business, including statutory valuation updates and the completion of the legal transfer of the Alico UK business acquired in 2011.
Investment resultThe annualised investment return was 5.0% for the third quarter of 2012, consistent with the prior-year period return. The return on investment was driven by income from fixed income assets and realised gains on sales. Proprietary net investment income decreased to USD 362 million in the third quarter of 2012, compared to USD 393 million in the third quarter of 2011. The running yield on investments declined to 4.1% in 2012 from 4.5% in the third quarter of 2011. The annualised return does not include the gains recognised on the sale of the Admin Re® US business.
Expenses Administrative expenses were USD 122 million in the third quarter of 2012, a decrease of USD 17 million compared to the third quarter of 2011. The reduction reflects lower costs associated with corporate realignment compared to the prior-year period.
Return on equityThe annualised return on equity was 48.9%, driven by the gain recognised in the period related to the sale of Admin Re® US. Excluding the gain on disposal, the annualised return on equity was 11.7% for the third quarter of the year, 0.4 percentage points lower than in the prior-year period.
Shareholders’ equityShareholders’ equity, which excludes non-controlling interests, increased by USD 280 million to USD 6 870 million compared to 30 June 2012. The increase was mainly due to additional unrealised gains arising in the reporting period as a result of tighter credit spreads together with business shifts from the Reinsurance segment as part of a restructuring following the sale of Admin Re® US and acquisition of ownership interest in New California Holdings, Inc. The business shifts relate to certain lines of US life business previously reported in the Life & Health Reinsurance segment which have been transferred to Admin Re®. The increase was partially offset by the payment of a USD 881 million dividend on the close of the sale of Admin Re® US in the reporting period to Swiss Re Group. The realisation of formerly unrealised gains in the process of the disposal of Admin Re® US had no impact on shareholders’ equity.
OutlookAdmin Re® seeks to fully establish its franchise value in the UK and continental Europe and contribute to Swiss Re’s financial targets to deliver on its strategic aim of being a recognised force in the closed life book business. Admin Re® will therefore continue to explore new opportunities that meet Swiss Re’s investment criteria and hurdle rates. Admin Re® also has the option to involve third-party capital, such as by partnering in transactions or raising external funding.

12 Swiss Re Third Quarter 2012 Report
OutlookThe priority for the Swiss Re Group is to deliver on the 2011–2015 financial targets and to deliver to its shareholders a sustainable dividend, which it aims to increase in line with long-term earnings. The Group will look to deploy any remaining excess capital to those areas of its business where it sees profitable opportunities. If the Group is unable to find opportunities that meet its return expectations, it would consider further measures to distribute excess capital, such as a special dividend.

Swiss Re Third Quarter 2012 Report 13
This page intentionally left blank

14 Swiss Re Third Quarter 2012 Report
Financial statements
The accompanying notes are an integral part of the Group financial statements.
Income statement (unaudited)Three months ended 30
SeptemberNine months ended 30
SeptemberUSD millions Note 2011 2012 2011 2012
RevenuesPremiums earned 8 5 737 6 388 15 776 18 271Fee income from policyholders 8 212 192 662 643Net investment income – non-participating 2 1 081 1 019 3 572 3 463Net realised investment gains /losses – non-participating business (total impairments for the three months ended 30 September were 155 in 2011 and 53 in 2012, of which 77 and 37, respectively, were recognised in earnings)1 2 952 1 163 1 367 893Net investment result – unit-linked and with-profit 2 –2 344 969 –1 688 1 952Other revenues 10 84 35 184Total revenues 5 648 9 815 19 724 25 406
ExpensesClaims and claim adjustment expenses 8 –1 895 –1 660 –6 751 –5 500Life and health benefits 8 –2 045 –2 280 –6 154 –6 657Return credited to policyholders 2 193 –983 1 271 –2 183Acquisition costs 8 –1 115 –1 152 –3 009 –3 465Other expenses –924 –928 –2 232 –2 350Interest expenses –214 –180 –645 –554Total expenses –4 000 –7 183 –17 520 –20 709
Income before income tax expense 1 648 2 632 2 204 4 697Income tax expense –206 –412 –344 –1 112Net income before attribution of non-controlling interests 1 442 2 220 1 860 3 585
Income attributable to non-controlling interests –94 –20 –217 –140Net income after attribution of non-controlling interests 1 348 2 200 1 643 3 445
Interest on contingent capital instruments 0 –18 0 –39Net income attributable to common shareholders 1 348 2 182 1 643 3 406
Earnings per share in USDBasic 10 3.94 6.33 4.80 9.53Diluted 10 3.93 5.77 4.71 8.94Earnings per share in CHF2Basic 10 3.46 5.96 4.21 8.97Diluted 10 3.45 5.42 4.13 8.41
1 Total impairments for the nine months ended 30 September were USD 354 million in 2011 and USD 191 million in 2012, of which USD 193 million and USD 141 million, respectively, were recognised in earnings.
2 The translation from USD to CHF is shown for informational purposes only and has been calculated using the Group’s average exchange rates.

Swiss Re Third Quarter 2012 Report 15
Financial statements
Statement of comprehensive income (unaudited)
The accompanying notes are an integral part of the Group financial statements.
Three months ended 30 September
Nine months ended 30 September
USD millions 2011 2012 2011 2012
Net income before attribution of non-controlling interests 1 442 2 220 1 860 3 585Other comprehensive income, net of tax:
Change in unrealised gains /losses (tax: for the three months ended 30 September –1 009 in 2011 and –16 in 2012; for the nine months ended 30 September –1 007 in 2011 and –112 in 2012) 2 481 263 2 523 605Change in other-than-temporary impairment (tax: for the three months ended 30 September –10 in 2011 and –12 in 2012; for the nine months ended 30 September –14 in 2011 and –43 in 2012) 19 24 31 82Change in foreign currency translation (tax: for the three months ended 30 September –156 in 2011 and 10 in 2012; for the nine months ended 30 September 19 in 2011 and –53 in 2012) –568 211 –176 231Change in adjustment for pension benefits (tax: for the three months ended 30 September 133 in 2011 and 55 in 2012; for the nine months ended 30 September 130 in 2011 and 53 in 2012) –428 –165 –424 –155
Total comprehensive income before attribution of non-controlling interests 2 946 2 553 3 814 4 348
Interest on contingent capital instruments –18 –39Attribution of value to option on redeemable non-controlling interest1 –6 –132Comprehensive income attributable to non-controlling interests –94 –20 –217 –140Total comprehensive income attributable to common shareholders 2 852 2 509 3 597 4 037
1 In 2000, Swiss Re and the shareholders of New California Holdings, Inc. entered into a put /call agreement for the acquisition of New California Holdings, Inc. by Swiss Re. The put /call agreement was considered a redeemable non-controlling interest; however, a value was not assigned to this instrument as the exercise was contingent on several items occurring to complete the transaction. During the second quarter of 2012, the majority of the contingencies had been resolved and the exercise of the put /call at the predetermined price became probable. In accordance with US GAAP requirements, the difference between the carrying value of the minority interest and the redemption price, USD 132 million, was recorded against shareholders’ equity and as a reduction in the net income attributable to common shareholders for the purposes of calculating earnings per share. In August 2012, the option was exercised and New California Holdings Inc was acquired. Please refer to Note 6 “Acquisitions and Disposals” for further information.

16 Swiss Re Third Quarter 2012 Report
Financial statements
Assets
The accompanying notes are an integral part of the Group financial statements.
USD millions Note 31.12.2011 30.09.2012
Investments 2, 3, 4Fixed income securities:
Available-for-sale, at fair value (including 7 034 in 2011 and 11 466 in 2012 subject to securities lending and repurchase agreements) (amortised cost: 86 984 in 2011 and 80 765 in 2012) 93 770 87 419Trading (including 620 in 2011 and 237 in 2012 subject to securities lending and repurchase agreements) 3 453 1 910
Equity securities: Available-for-sale, at fair value (including 45 in 2011 and 0 in 2012 subject to securities lending and repurchase agreements) (cost: 1 907 in 2011 and 2 874 in 2012) 1 960 3 153Trading 571 659
Policy loans, mortgages and other loans 5 640 2 259Investment real estate 645 702Short-term investments, at amortised cost which approximates fair value (including 87 in 2011 and 1 626 in 2012 subject to securities lending and repurchase agreements) 13 660 16 532Other invested assets 20 176 18 010Investments for unit-linked and with-profit business (including fixed income securities trading: 4 095 in 2011 and 4 519 in 2012, equity securities trading: 16 182 in 2011 and 18 243 in 2012) 22 349 25 165Total investments 162 224 155 809
Cash and cash equivalents (including 36 in 2011 and 155 in 2012 subject to securities lending) 11 407 12 956Accrued investment income 1 220 1 028Premiums and other receivables 11 441 11 838Reinsurance recoverable on unpaid claims and policy benefits 11 837 10 128Funds held by ceding companies 9 064 13 652Deferred acquisition costs 5 3 923 3 979Acquired present value of future profits 5 4 226 3 498Goodwill 4 051 4 072Income taxes recoverable 720 661Other assets 5 786 7 189
Total assets 225 899 224 810
Balance sheet (unaudited)

Swiss Re Third Quarter 2012 Report 17
Financial statements
Liabilities and equity
The accompanying notes are an integral part of the Group financial statements.
USD millions Note 31.12.2011 30.09.2012
LiabilitiesUnpaid claims and claim adjustment expenses 64 878 63 206Liabilities for life and health policy benefits 3 39 044 36 615Policyholder account balances 34 162 29 025Unearned premiums 8 299 10 243Funds held under reinsurance treaties 2 436 3 854Reinsurance balances payable 3 962 3 872Income taxes payable 442 700Deferred and other non-current taxes 2 853 4 046Short-term debt 7 4 127 3 719Accrued expenses and other liabilities 17 868 20 433Long-term debt 7 16 541 15 529Total liabilities 194 612 191 242
EquityContingent capital instruments 0 1 102Common stock, CHF 0.10 par value
2011: 370 706 931; 2012: 370 706 931 shares authorised and issued1 35 35Additional paid-in capital 8 985 7 715Treasury shares, net of tax –1 096 –987
Accumulated other comprehensive income:Net unrealised investment gains /losses, net of tax 4 223 4 828Other-than-temporary impairment, net of tax –118 –36Cumulative translation adjustments, net of tax –3 941 –3 710Accumulated adjustment for pension and post-retirement benefits, net of tax –775 –930
Total accumulated other comprehensive income –611 152
Retained earnings 22 277 25 527Shareholders’ equity 29 590 33 544
Non-controlling interests 1 697 24Total equity 31 287 33 568
Total liabilities and equity 225 899 224 810
1 Please refer to Note 1 “Organisation and summary of significant accounting policies” and Note 10 “Earnings per share” for details on the number of shares authorised and issued.

18 Swiss Re Third Quarter 2012 Report
Financial statements
For the twelve months ended 31 December 2011 and the nine months ended 30 September 2012
Statement of equity (unaudited)
USD millions 2011 2012
Contingent capital instrumentsBalance as of 1 January 0 0Issued 1 102Balance as of period end 0 1 102
Common sharesBalance as of 1 January 35 35Issue of common sharesBalance as of period end 35 35
Additional paid-in capitalBalance as of 1 January 10 530 8 985Contingent capital instruments’ issuance costs –18Share-based compensation –87 –32Realised gains /losses on treasury shares –423 –86Dividends on common shares1 –1 035 –1 134Balance as of period end 8 985 7 715
Treasury shares, net of taxBalance as of 1 January –1 483 –1 096Purchase of treasury shares –261 –136Issuance of treasury shares, including share-based compensation to employees 648 245Balance as of period end –1 096 –987
Net unrealised gains /losses, net of taxBalance as of 1 January 1 042 4 223Other changes during the period 3 181 605Balance as of period end 4 223 4 828
Other-than-temporary impairment, net of taxBalance as of 1 January –169 –118Other changes during the period 51 82Balance as of period end –118 –36
Foreign currency translation, net of taxBalance as of 1 January –3 742 –3 941Other changes during the period –199 231Balance as of period end –3 941 –3 710
Adjustment for pension and other post-retirement benefits, net of taxBalance as of 1 January –522 –775Change during the period –253 –155Balance as of period end –775 –930
Retained earningsBalance as of 1 January 19 651 22 277Net income after attribution of non-controlling interests 2 626 3 445Interest on contingent capital instruments, net of tax –39Cumulative effect of adoption of ASU 2010-262, net of tax –24Attribution of value to option on redeemable non-controlling interest3 –132Balance as of period end 22 277 25 527
Shareholders’ equity 29 590 33 544Non-controlling interests
Balance as of 1 January 1 564 1 697Change during the period4 –39 –1 945Income attributable to non-controlling interests 172 140Attribution of value to option on redeemable non-controlling interest3 132Balance as of period end 1 697 24
Total equity 31 287 33 568

Swiss Re Third Quarter 2012 Report 19
Financial statements
1 Dividends to shareholders were paid in the form of a withholding tax-exempt repayment of legal reserves from capital contributions. 2 The Group adopted a new accounting guidance, ASU 2010-26 “Accounting for Costs Associated with Acquiring or Renewing Insurance Contracts” as of 1 January 2012,
which required the release of USD 24 million of deferred acquisition costs against retained earnings. Refer to Note 5 for more details on the adoption of ASU 2010-26.3 In 2000, Swiss Re and the shareholders of New California Holdings, Inc. entered into a put /call agreement for the acquisition of New California Holdings, Inc. by Swiss Re.
The put /call agreement was considered a redeemable non-controlling interest; however, a value was not assigned to this instrument as the exercise was contingent on several items occurring to complete the transaction. During the second quarter of 2012, the majority of the contingencies had been resolved and the exercise of the put /call at the predetermined price became probable. In accordance with US GAAP requirements, the difference between the carrying value of the minority interest and the redemption price, USD 132 million, was recorded against shareholders’ equity and as a reduction in the net income attributable to common shareholders for the purposes of calculating earnings per share. In August 2012, the option was exercised and New California Holdings Inc was acquired. Please refer to Note 6 “Acquisitions and Disposals” for further information.
4 Swiss Re Private Equity Partners AG, the management company of Swiss Re’s private equity fund-of-fund business, was sold to BlackRock, Inc. on 4 September 2012. The sale led to a reduction in non-controlling interests of USD 1 400 million. In addition, New California Holdings, Inc. was acquired in the third quarter of 2012 for USD 548 million in cash. After the acquisition, Swiss Re fully owns Aurora National Life Assurance Company and consequently no longer reports any non-controlling interest related to this subsidiary. Please refer to Note 6 “Acquisitions and disposals” for further information.
The accompanying notes are an integral part of the Group financial statements.

20 Swiss Re Third Quarter 2012 Report
Financial statements
Statement of cash flow (unaudited)For the nine months ended 30 September
Interest paid was USD 881 million and USD 689 million for the nine months ended 30 September 2011 and 2012, respectively. The Group has revised the disclosure on interest paid for the nine-month period ended 30 September 2011, to conform to the 2012 period. The change had no impact on net income, net equity or balance sheet classification of the Group.
Tax paid was USD 573 million and USD 139 million for the nine months ended 30 September 2011 and 2012, respectively.
The accompanying notes are an integral part of the Group financial statements.
USD millions 2011 2012
Cash flows from operating activitiesNet income attributable to common shareholders 1 643 3 406Add net income attributable to non-controlling interests 217 140
Adjustments to reconcile net income to net cash provided /used by operating activities:Depreciation, amortisation and other non-cash items 2 449 2 979Net realised investment gains /losses 958 –2 208Change in:
Technical provisions, net –2 715 –1 914Funds held by ceding companies and other reinsurance balances –1 669 –452Reinsurance recoverable on unpaid claims and policy benefits 241 278Other assets and liabilities, net –176 –468Income taxes payable /recoverable –228 1 146Income from equity-accounted investees, net of dividends received –225 –322Trading positions, net 2 788 –241Securities purchased /sold under agreement to resell /repurchase, net –2 248 2 360
Net cash provided /used by operating activities 1 035 4 704
Cash flows from investing activitiesFixed income securities:
Sales and maturities 105 246 92 203Purchases –107 067 –89 740Net purchase /sale /maturities of short-term investments 7 905 –2 934
Equity securities:Sales 2 169 1 080Purchases –2 993 –1 938
Cash paid /received for acquisitions /disposal and reinsurance transactions, net1 80 106Net purchases /sales /maturities of other investments –602 10Net cash provided /used by investing activities 4 738 –1 213
Cash flows from financing activitiesIssuance /repayment of long-term debt –297 144Issuance /repayment of short-term debt –8 767 –2 038Proceeds from the issuance of contingent capital instruments, net of issuance cost 1 084Purchase /sale of treasury shares –261 –122Dividends paid to shareholders –1 035 –1 134Net cash provided /used by financing activities –10 360 –2 066
Total net cash provided /used –4 587 1 425Effect of foreign currency translation –80 124Change in cash and cash equivalents –4 667 1 549Cash and cash equivalents as of 1 January 16 928 11 407Cash and cash equivalents as of 30 September 12 261 12 956
1 Swiss Re has closed the sale of the Admin Re® US business to Jackson National Life Insurance Co. The purchase price included a cash payment of USD 589 million. New California Holdings, Inc. was acquired for USD 548 million in cash. Swiss Re Private Equity Partners AG, Swiss Re’s private equity fund-of-fund business, has been sold to BlackRock, Inc. for USD 65 million in cash. Swiss Re continues to be invested as a limited partner in the funds. Please refer to Note 6 “Acquisitions and Disposals” for further information.

Swiss Re Third Quarter 2012 Report 21
Financial statements
This page intentionally left blank

22 Swiss Re Third Quarter 2012 Report
This page intentionally left blank

Swiss Re Third Quarter 2012 Report 23
Notes to the Group financial statements (unaudited)1 Organisation and summary of significant accounting policies
Nature of operationsThe Swiss Re Group, which is headquartered in Zurich, Switzerland, comprises Swiss Re Ltd (the parent company) and its subsidiaries (collectively, the “Swiss Re Group” or the “Group”). The Swiss Re Group is a wholesale provider of reinsurance, insurance and other insurance-based forms of risk transfer. Working through brokers and a network of more than 60 offices around the globe, the Group serves a client base made up of insurance companies, mid- to large-sized corporations and public sector clients.
Basis of presentationThe accompanying consolidated financial statements have been prepared in accordance with accounting principles generally accepted in the United States of America (US GAAP) and comply with Swiss law. All significant intra-group transactions and balances have been eliminated on consolidation. The year-end balance sheet data presented was derived from audited financial statements. These interim financial statements do not include all disclosures that US GAAP requires on an annual basis and therefore they should be read in conjunction with the Swiss Re Group’s audited financial statements for the year ended 31 December 2011.
These interim financial statements reflect the new structure announced by the Group on 17 February 2011 and which was fully implemented with effect from 1 January 2012. The segmental disclosures have been revised to reflect the way the Group now manages its business activities. The new Group reporting structure consists of the Reinsurance unit, with separate disclosure of the Property & Casualty Reinsurance and Life & Health Reinsurance reporting segments, the Corporate Solutions reporting segment and the Admin Re® reporting segment. The Group items reporting segment includes the Group’s holding company (Swiss Re Ltd), and certain treasury activities as well as the remaining non-core activities that have been in run-off since November 2007. The segmental disclosures for the comparative period have been restated to reflect the current structure. Please refer to Note 13 for further information. Additional details on segment results are included in Notes 5, 8 and 9.
As of 1 January 2012, the Group changed the presentation of its investments related to unit-linked and with-profit business in Life & Health Reinsurance and Admin Re®. These assets are presented in separate line items on the face of the income statement and balance sheet. Comparative periods have been revised and presented accordingly.
On 4 September 2012, the Group completed the sale of Admin Re® US to Jackson National Life Insurance Company (Jackson National). Subsequently, the subject business was deconsolidated as of that date. For more details on the transaction and its impact on the Swiss Re Group financial statements, please refer to Note 6.
On 4 September 2012, the sale of Swiss Re Private Equity Partners AG to BlackRock, Inc. was completed. The sale resulted in a reduction in non-controlling interests of USD 1 400 million related to private equity funds. The Group continues to be invested as a limited partner in the funds. Please refer to Note 6 for further information.
Use of estimates in the preparation of financial statementsThe preparation of financial statements requires management to make significant estimates and assumptions that affect the reported amounts of assets, liabilities, revenues and expenses as well as the related disclosure, including contingent assets and liabilities. The Swiss Re Group’s liabilities for unpaid claims and claim adjustment expenses and policy benefits for life and health include estimates for premium, claim and benefit data not received from ceding companies at the date of the financial statements. In addition, the Group uses certain financial instruments and invests in securities of certain entities for which exchange trading does not exist. The Group determines these estimates based on historical information, actuarial analyses, financial modelling and other analytical techniques. Actual results could differ significantly from the estimates described above.
Valuation of financial assetsThe fair value of the majority of the Group’s financial instruments is based on quoted prices in active markets or observable inputs. These instruments include government and agency securities, commercial paper, most investment-grade corporate debt, most high-yield debt securities, exchange-traded derivative instruments, most mortgage- and asset-backed securities and listed equity securities. In markets with reduced or no liquidity, spreads between bid and offer prices are normally wider compared to spreads in highly liquid markets. Such market conditions affect the valuation of certain asset classes of the Group, such as some asset-backed securities as well as certain derivative structures referencing such asset classes.
The Group considers both the credit risk of its counterparties and own risk of non-performance in the valuation of derivative instruments and other over-the-counter financial assets. In determining the fair value of these financial instruments, the assessment of the Group’s exposure

Notes to the Group financial statements (unaudited)
24 Swiss Re Third Quarter 2012 Report
to the credit risk of its counterparties incorporates consideration of existing collateral and netting arrangements entered into with each counterparty. The measure of the counterparty credit risk is estimated with incorporation of the observable credit spreads, where available, or credit spread estimates derived based on the benchmarking techniques where market data is not available. The impact of the Group’s own risk of non-performance is analysed in the manner consistent with the aforementioned approach, with consideration of the Group’s observable credit spreads. The value representing such risk is incorporated into the fair value of the financial instruments (primarily derivatives), in a liability position as of the measurement date. The change in this adjustment from period to period is reflected in realised gains and losses in the income statement.
For assets or derivative structures at fair value, the Group uses market prices or inputs derived from market prices. A separate internal price verification process, independent of the trading function, provides an additional control over the market prices or market input used to determine the fair values of such assets. Whilst management considers that appropriate values have been ascribed to such assets, there is always a level of uncertainty and judgment over these valuations. Subsequent valuations could differ significantly from the results of the process described above. The Group may become aware of counterparty valuations, either directly through the exchange of information or indirectly, for example, through collateral demands. Any implied differences are considered in the independent price verification process and may result in adjustments to initially indicated valuations. As of 30 September 2012, the Group had not provided any collateral on financial instruments in excess of its own market value estimates.
Subsequent eventsSubsequent events for the current reporting period have been evaluated up to 7 November 2012. This is the date on which the financial statements are available to be issued.
Recent accounting guidanceIn October 2010, the FASB issued “Accounting for Costs Associated with Acquiring or Renewing Insurance Contracts” (ASU 2010-26), an update to Topic 944 – Financial Services – Insurance. This update limits the definition of deferrable acquisition costs to costs directly related to the successful acquisition or renewal of insurance contracts. The Group adopted this guidance as of 1 January 2012. Please refer to Note 5 and to the statement of shareholders’ equity for the impact on deferred acquisition costs and retained earnings, respectively.
In April 2011, the FASB issued “Reconsideration of Effective Control for Repurchase Agreements” (ASU 2011-03), an update to Topic 860 – Transfers and Servicing. The amendments in this update remove from the assessment of effective control for repos and similar agreements the criterion requiring the transferor to have the ability to repurchase or redeem the financial assets on substantially the agreed terms, even in the event of default by the transferee. The Group adopted this guidance as of 1 January 2012. The adoption did not have an impact on the Group’s financial statements.
In May 2011, the FASB issued “Amendments to Achieve Common Fair Value Measurement and Disclosure Requirements in US GAAP and IFRS” (ASU 2011-04), an update to Topic 820 – Fair Value Measurement. The guidance requires additional fair value disclosures. In addition, the ASU increases the emphasis on the unit of account and introduces more restrictive guidance on the incorporation of premiums and discounts relating to the size of a position of financial instruments held in measuring fair value. The Group adopted this update as of 1 January 2012. Changes in fair value measurements resulting from the application of the new guidance were immaterial. The additional disclosure requirements are reflected in Note 3.
In June 2011, the FASB issued “Presentation of Comprehensive Income” (ASU 2011-05), an update to Topic 220 – Comprehensive Income. In December 2011, an amendment of ASU 2011-05 was issued, “Deferral of the Effective Date for Amendments to the Presentation of Reclassifications of Items Out of Accumulated Other Comprehensive Income in Accounting Standards Update No. 2011-05” (ASU 2011-12). Amended ASU 2011-05 requires entities to present net income and other comprehensive income in either a single continuous statement or in two separate, but consecutive, statements of net income and other comprehensive income. The option to present items of other comprehensive income in the statement of changes in equity is eliminated. The Group has adopted this guidance as of 1 January 2012 by adjusting its presentation of net income and other comprehensive income accordingly.
In September 2011, the FASB issued “Testing Goodwill for Impairment” (ASU 2011-08), an update to Topic 350 – Intangibles – Goodwill and Other. The update provides entities with the option of performing a “qualitative” assessment to determine whether further impairment testing is necessary. The Group adopted this guidance as of 1 January 2012. The adoption did not have an impact on the Group’s financial statements.

Notes to the Group financial statements (unaudited)
Swiss Re Third Quarter 2012 Report 25
2 Investments
Investment incomeNet investment income by source (excluding unit-linked and with-profit business) for the periods ended 30 September was as follows:
Dividends received from investments accounted for using the equity method were USD 1 million and USD 34 million for the three months ended 30 September 2011 and 2012, respectively, as well as USD 51 million and USD 105 million for the nine months ended 30 September 2011 and 2012, respectively.
Realised gains and lossesRealised gains and losses for fixed income, equity securities and other investments (excluding unit-linked and with-profit business) for the periods ended 30 September were as follows:
Three months ended 30 September Nine months ended 30 SeptemberUSD millions 2011 2012 2011 2012
Fixed income securities 895 745 2 756 2 384Equity securities 19 20 64 64Policy loans, mortgages and other loans 98 77 309 285Investment real estate 36 33 102 100Short-term investments 26 25 73 74Other current investments 3 23 7 49Share in earnings of equity-accounted investees –14 95 276 427Cash and cash equivalents 23 16 80 52Net result from deposit-accounted contracts 44 21 109 129Deposits with ceding companies 91 86 258 265Gross investment income 1 221 1 141 4 034 3 829Investment expenses –108 –114 –363 –344Interest charged for funds held –32 –8 –99 –22Net investment income – non-participating 1 081 1 019 3 572 3 463
Three months ended 30 September Nine months ended 30 SeptemberUSD millions 2011 2012 2011 2012
Fixed income securities available-for-sale:Gross realised gains 994 652 1 850 2 049Gross realised losses –30 –65 –359 –323
Equity securities available-for-sale:Gross realised gains 13 56 89 116Gross realised losses –178 –30 –190 –65
Other-than-temporary impairments –84 –37 –200 –141Net realised investment gains /losses on trading securities 227 25 294 57Change in net unrealised investment gains /losses on trading securities 287 –1 278 82Other investments:
Net realised /unrealised gains /losses –411 12 –532 –242Net realised /unrealised gains /losses on insurance-related derivatives –51 –34 12 –103Gain /loss related to sale of Admin Re® US operations1 626 –399Foreign exchange gains /losses 185 –41 125 –138Net realised investment gains /losses – non-participating 952 1 163 1 367 893
1 Refer to Note 6 for more information.

Notes to the Group financial statements (unaudited)
26 Swiss Re Third Quarter 2012 Report
Proceeds from sales of fixed income securities available-for-sale amounted to USD 31 637 million and USD 24 903 million for the three months ended 30 September 2011 and 2012, respectively, and USD 86 060 million and USD 87 211 million for the nine months ended 30 September 2011 and 2012, respectively. Sales of equity securities available-for-sale were USD 1 417 million and USD 527 million for the three months ended 30 September 2011 and 2012, respectively, and USD 2 170 million and USD 1 089 million for the nine months ended 30 September 2011 and 2012, respectively.
Investment result – unit-linked and with-profit businessNet investment result on unit-linked and with-profit business credited to policyholders for the periods ended 30 September was as follows:
Impairment on fixed income securities related to credit lossesOther-than-temporary impairments for debt securities are bifurcated between credit and non-credit components, with the credit component recognised through earnings and the non-credit component recognised in other comprehensive income. The credit component of other-than-temporary impairments is defined as the difference between a security’s amortised cost basis and expected cash flows. Methodologies for measuring the credit component of impairment are aligned to market observer forecasts of credit performance drivers. Management believes that these forecasts are representative of median market expectations.
For securitised products, cash flow projection analysis is conducted integrating forward-looking evaluation of collateral performance drivers, including default rates, prepayment rates and loss severities, and deal-level features, such as credit enhancement and prioritisation among tranches for payments of principal and interest. Analytics are differentiated by asset class, product type and security-level differences in historical and expected performance. For corporate bonds and similar hybrid debt instruments, an expected loss approach based on default probabilities and loss severities expected in the current and forecast economic environment is used for securities identified as credit-impaired to project probability-weighted cash flows. Expected cash flows resulting from these analyses are discounted, and net present value is compared to the amortised cost basis to determine the credit component of other-than-temporary impairments.
A reconciliation of the other-than-temporary impairment related to credit losses recognised in earnings for the nine months ended 30 September was as follows:
USD millions 2011 2012
Balance as of 1 January 829 515Credit losses for which an other-than-temporary impairment was not previously recognised 118 14Reductions for securities sold during the period –307 –217Increase of credit losses for which an other-than-temporary impairment has been recognised previously, when the Group does not intend to sell, or more likely than not will not be required to sell before recovery 47 54Impact of increase in cash flows expected to be collected –57 –57Impact of foreign exchange movements –5 7
Balance as of 30 September 625 316
Three months ended 30 September Nine months ended 30 September
2011 2012 2011 2012USD millions Unit-linked With-profit Unit-linked With-profit Unit-linked With-profit Unit-linked With-profit
Investment income – fixed income securities 37 23 31 24 99 73 96 71Investment income – equity securities 128 8 131 7 408 29 414 25Investment income – other 8 5 –2 9 12 16 12 19Total investment income – unit-linked and with-profit business 173 36 160 40 519 118 522 115Realised gains /losses – fixed income securities 67 71 45 55 68 65 64 80Realised gains /losses – equity securities –2 539 –153 641 35 –2 316 –136 1 140 64Realised gains /losses – other –1 2 4 –11 –13 7 –22 –11Total realised gains /losses – unit-linked and with-profit business –2 473 –80 690 79 –2 261 –64 1 182 133Total net investment result – unit-linked and with-profit business –2 300 –44 850 119 –1 742 54 1 704 248

Notes to the Group financial statements (unaudited)
Swiss Re Third Quarter 2012 Report 27
Investments available-for-saleAmortised cost or cost, estimated fair values and other-than-temporary impairments of fixed income securities classified as available-for-sale as of 31 December 2011 and 30 September 2012 were as follows:
The “Other-than-temporary impairments recognised in other comprehensive income” column includes only securities with a credit-related loss recognised in earnings. Subsequent recovery in fair value of securities previously impaired in other comprehensive income is presented in the “Other-than-temporary impairments recognised in other comprehensive income” column.
2011 USD millions
Amortised cost or cost
Gross unrealised
gains
Gross unrealised
losses
Other-than-temporary
impairments recognised in other
comprehensive income
Estimated fair value
Debt securities issued by governments and government agencies:
US Treasury and other US government corporations and agencies 20 387 1 881 –1 22 267US Agency securitised products 3 866 144 –3 4 007States of the United States and political subdivisions of the states 245 24 –6 263United Kingdom 15 182 1 865 –51 16 996Canada 3 078 806 –2 3 882Germany 4 791 200 –51 4 940France 3 068 45 –52 3 061Other 6 849 453 –56 –1 7 245
Total 57 466 5 418 –222 –1 62 661Corporate debt securities 21 467 2 065 –265 –13 23 254Residential mortgage-backed securities 2 119 30 –154 –110 1 885Commercial mortgage-backed securities 3 820 222 –141 –38 3 863Other asset-backed securities 2 112 64 –54 –15 2 107Fixed income securities available-for-sale 86 984 7 799 –836 –177 93 770Equity securities available-for-sale 1 907 201 –148 1 960
2012 USD millions
Amortised cost or cost
Gross unrealised
gains
Gross unrealised
losses
Other-than-temporary
impairments recognised in other
comprehensive income
Estimated fair value
Debt securities issued by governments and government agencies:
US Treasury and other US government corporations and agencies 14 781 895 –9 15 667US Agency securitised products 4 200 133 –1 4 332States of the United States and political subdivisions of the states 93 20 113United Kingdom 15 341 1 456 –34 16 763Canada 3 298 816 –1 4 113Germany 6 129 217 –16 6 330France 3 167 177 –10 3 334Other 7 196 546 –22 7 720
Total 54 205 4 260 –93 58 372Corporate debt securities 20 267 2 345 –50 –29 22 533Residential mortgage-backed securities 1 020 40 –45 –14 1 001Commercial mortgage-backed securities 2 871 250 –41 –7 3 073Other asset-backed securities 2 402 60 –19 –3 2 440Fixed income securities available-for-sale 80 765 6 955 –248 –53 87 419Equity securities available-for-sale 2 874 357 –78 3 153

Notes to the Group financial statements (unaudited)
28 Swiss Re Third Quarter 2012 Report
Investments tradingFixed income securities and equity securities classified as trading (excluding unit-linked and with-profit business) as of 31 December 2011 and 30 September 2012 were as follows:
Investments held for unit-linked and with-profit businessInvestments held for unit-linked and with-profit business as of 31 December 2011 and 30 September 2012 were as follows:
Maturity of fixed income securities available-for-saleThe amortised cost or cost and estimated fair values of investments in fixed income securities available-for-sale by remaining maturity as of 31 December 2011 and 30 September 2012 are shown below. Fixed maturity investments are assumed not to be called for redemption prior to the stated maturity date. As of 31 December 2011 and 30 September 2012, USD 10 274 million and USD 9 418 million, respectively, of fixed income securities available-for-sale were callable.
Assets pledgedAs of 31 December 2011 and 30 September 2012, investments with a carrying value of USD 1 900 million and USD 1 901 million, respectively, were on deposit with regulatory agencies in accordance with local requirements. As of 31 December 2011 and 30 September 2012, investments with a carrying value of approximately USD 9 407 million and USD 11 899 million, respectively, were placed on deposit or pledged to secure certain reinsurance liabilities. The Group has reviewed the carrying values of investments on deposit with regulatory agencies, and of investments placed on deposit or pledged to secure certain reinsurance liabilities. The comparatives presented have been revised accordingly. The revision has no impact on net income or net equity of the Group.
As of 31 December 2011 and 30 September 2012, securities of USD 7 823 million and USD 13 484 million, respectively, were pledged as collateral in securities lending transactions and repurchase agreements. The associated liabilities of USD 6 349 million and USD 8 132 million, respectively, were recognised in accrued expenses and other liabilities.
As of 30 September 2012, a real estate portfolio with a carrying value of USD 260 million serves as collateral for short-term senior operational debt of USD 692 million.
Collateral accepted which the Group has the right to sell or repledgeAs of 31 December 2011 and 30 September 2012, the fair value of the government and corporate bond securities received as collateral was USD 4 241 million and USD 4 422 million, respectively. Of this, the amount that was sold or repledged as of 31 December 2011 and 30 September 2012 was nil and USD 1 590 million, respectively. The sources of the collateral are reverse repurchase agreements and derivative transactions.
USD millions 2011 2012
Debt securities issued by governments and government agencies 2 957 1 556Corporate debt securities 214 173Mortgage- and asset-backed securities 282 181Fixed income securities trading – non-participating 3 453 1 910Equity securities trading – non-participating 571 659
2011 2012USD millions Unit-linked With-profit Unit-linked With-profit
Fixed income securities trading 2 354 1 741 2 544 1 975Equity securities trading 15 231 951 17 291 952Investment real estate 828 510 808 496Short-term investments 734 1 099Total investments for unit-linked and with-profit business 19 147 3 202 21 742 3 423
2011 2012 USD millions
Amortised cost or cost
Estimated fair value
Amortised cost or cost
Estimated fair value
Due in one year or less 3 020 3 040 4 532 4 575Due after one year through five years 19 696 20 156 19 832 20 554Due after five years through ten years 17 955 19 072 14 410 15 659Due after ten years 38 594 43 977 35 985 40 410Mortgage- and asset-backed securities with no fixed maturity 7 719 7 525 6 006 6 221Total fixed income securities available-for-sale 86 984 93 770 80 765 87 419

Notes to the Group financial statements (unaudited)
Swiss Re Third Quarter 2012 Report 29
Unrealised losses on securities available-for-saleThe following table shows the fair value and unrealised losses of the Group’s fixed income securities, aggregated by investment category and length of time that individual securities were in a continuous unrealised loss position as of 31 December 2011 and 30 September 2012. As of 31 December 2011 and 30 September 2012, USD 144 million and USD 30 million, respectively, of the gross unrealised loss on equity securities available-for-sale relates to declines in value for less than 12 months and USD 4 million and USD 48 million, respectively, to declines in value for more than 12 months.
Less than 12 months 12 months or more Total2011 USD millions Fair value
Unrealised losses Fair value
Unrealised losses Fair value
Unrealised losses
Debt securities issued by governments and government agencies:
US Treasury and other US government corporations and agencies 337 1 337 1US Agency securitised products 500 3 500 3States of the United States and political subdivisions of the states 37 1 40 5 77 6United Kingdom 2 832 50 47 1 2 879 51Canada 79 1 2 1 81 2Germany 1 027 50 10 1 1 037 51France 1 133 52 4 1 137 52Other 1 210 44 142 13 1 352 57
Total 7 155 202 245 21 7 400 223Corporate debt securities 2 760 145 700 133 3 460 278Residential mortgage-backed securities 829 111 702 153 1 531 264Commercial mortgage-backed securities 812 123 342 56 1 154 179Other asset-backed securities 662 15 184 54 846 69Total 12 218 596 2 173 417 14 391 1 013
Less than 12 months 12 months or more Total2012 USD millions Fair value
Unrealised losses Fair value
Unrealised losses Fair value
Unrealised losses
Debt securities issued by governments and government agencies:
US Treasury and other US government corporations and agencies 2 464 9 9 2 473 9US Agency securitised products 138 1 138 1States of the United States and political subdivisions of the states 4 4 0United Kingdom 2 378 34 2 2 380 34Canada 205 1 2 207 1Germany 1 347 16 9 1 356 16France 479 10 479 10Other 919 18 44 4 963 22
Total 7 934 89 66 4 8 000 93Corporate debt securities 1 083 30 393 49 1 476 79Residential mortgage-backed securities 276 12 309 47 585 59Commercial mortgage-backed securities 348 34 244 14 592 48Other asset-backed securities 318 11 113 11 431 22Total 9 959 176 1 125 125 11 084 301

Notes to the Group financial statements (unaudited)
30 Swiss Re Third Quarter 2012 Report
Mortgages, loans and real estateAs of 31 December 2011 and 30 September 2012, the carrying values of investments in mortgages, policy and other loans, and real estate (excluding unit-linked and with-profit business) were as follows:
The fair value of the real estate as of 31 December 2011 and 30 September 2012 was USD 2 215 million and USD 2 335 million, respectively. The carrying value of policy loans, mortgages and other loans approximates fair value.
As of 31 December 2011 and 30 September 2012, the Group’s investment in mortgages and other loans included USD 270 million and USD 277 million, respectively, of loans due from employees, and USD 357 million and USD 382 million, respectively, due from officers. These loans generally consist of mortgages offered at variable and fixed interest rates.
As of 31 December 2011 and 30 September 2012, investments in real estate included USD 6 million and USD 5 million, respectively, of real estate held for sale.
Depreciation expense related to income-producing properties was USD 15 million and USD 16 million for the nine months ended 30 September 2011 and 2012, respectively. Accumulated depreciation on investment real estate totalled USD 460 million and USD 538 million as of 31 December 2011 and 30 September 2012, respectively.
Substantially all mortgages, policy loans and other loan receivables are secured by buildings, land or the underlying policies.
USD millions 2011 2012
Policy loans 3 664 287Mortgage loans 1 336 1 335Other loans 640 637Investment real estate 645 702

Notes to the Group financial statements (unaudited)
Swiss Re Third Quarter 2012 Report 31
3 Fair value disclosures
Fair value, as defined by the Fair Value Measurements and Disclosures Topic, is the price that would be received to sell an asset or paid to transfer a liability in an orderly transaction between market participants at the measurement date.
The Fair Value Measurements and Disclosures Topic requires all assets and liabilities that are measured at fair value to be categorised within the fair value hierarchy. This three-level hierarchy is based on the observability of the inputs used in the fair value measurement. The levels of the fair value hierarchy are defined as follows:
Level 1 inputs are quoted prices in active markets for identical assets or liabilities that the Group has the ability to access. Level 1 inputs are the most persuasive evidence of fair value and are to be used whenever possible.
Level 2 inputs are market based inputs that are directly or indirectly observable, but not considered level 1 quoted prices. Level 2 inputs consist of (i) quoted prices for similar assets or liabilities in active markets; (ii) quoted prices for identical assets or liabilities in non-active markets (eg markets which have few transactions and where prices are not current or price quotations vary substantially); (iii) inputs other than quoted prices that are observable (eg interest rates, yield curves, volatilities, prepayment speeds, credit risks and default rates); and (iv) inputs derived from, or corroborated by, observable market data.
Level 3 inputs are unobservable inputs. These inputs reflect the Group’s own assumptions about market pricing using the best internal and external information available.
The types of instruments valued, based on unadjusted quoted market prices in active markets, include most US government and sovereign obligations, active listed equities and most money market securities. Such instruments are generally classified within level 1 of the fair value hierarchy.
The types of instruments that trade in markets that are not considered to be active, but are valued based on quoted market prices, broker or dealer quotations, or alternative pricing sources with reasonable levels of price transparency, include most government agency securities, investment-grade corporate bonds, certain mortgage- and asset-backed products, less liquid listed equities, and state, municipal and provincial obligations. Such instruments are generally classified within level 2 of the fair value hierarchy.
Exchange-traded derivative instruments typically fall within level 1 or level 2 of the fair value hierarchy depending on whether they are considered to be actively traded or not.
Certain financial instruments are classified within level 3 of the fair value hierarchy, because they trade infrequently and therefore have little or no price transparency. Such instruments include private equity, less liquid corporate debt securities and certain asset-backed securities. Certain over-the-counter derivatives trade in less liquid markets with limited pricing information, and the determination of fair value for these derivatives is inherently more difficult. Such instruments are classified within level 3 of the fair value hierarchy. Pursuant to the election of the fair value option, the Group classifies certain liabilities for life and health policy benefits in level 3 of the fair value hierarchy. When appropriate, valuations are adjusted for various factors such as liquidity, bid /offer spreads, and credit considerations. Such adjustments are generally based on available market evidence. In the absence of such evidence, management’s best estimate is used.

Notes to the Group financial statements (unaudited)
32 Swiss Re Third Quarter 2012 Report
The fair values of assets are adjusted to incorporate the counterparty risk of non-performance. Similarly, the fair values of liabilities reflect the risk of non-performance of the Group, captured by the Group’s credit spread. These valuation adjustments from assets and liabilities measured at fair value using significant unobservable inputs are recognised in net realised gains and losses. In the third quarter of 2012, these adjustments were not material. Whenever the underlying assets or liabilities are reported in a specific business segment, the valuation adjustment is allocated accordingly. Valuation adjustments not attributable to any business segment are reported in Group items.
In certain situations, the Group uses inputs to measure the fair value of asset or liability positions that fall into different levels of the fair value hierarchy. In these situations, the Group will determine the appropriate level based upon the lowest level input that is significant to the determination of the fair value.
Valuation techniquesUS government securities typically have quoted market prices in active markets and are categorised as level 1 instruments in the fair value hierarchy. Non-US government holdings are generally classified as level 2 instruments and are valued on the basis of the quotes provided by pricing services, which are subject to the Group’s pricing validation reviews and pricing vendor challenge process. Valuations provided by pricing vendors are generally based on the actual trade information as substantially all of the Group’s non-US government holdings are traded in a transparent and liquid market.
Corporate debt securities mainly include US and European investment-grade positions, which are priced on the basis of quotes provided by third-party pricing vendors and first utilise valuation inputs from actively traded securities, such as bid prices, bid spreads to Treasury securities, Treasury curves, and same or comparable issuer curves and spreads. Issuer spreads are determined from actual quotes and traded prices and incorporate considerations of credit /default, sector composition, and liquidity and call features. Where market data is not available, valuations are developed based on the modelling techniques that utilise observable inputs and option-adjusted spreads and incorporate considerations of the security’s seniority, maturity and the issuer’s corporate structure.
Values of residential mortgage-backed securities (RMBS), commercial mortgage-backed securities (CMBS) and other asset-backed securities (Other ABS) are obtained both from third-party pricing vendors and through quoted prices, some of which may be based on the prices of comparable securities with similar structural and collateral features. Values of certain ABS for which there are no significant observable inputs are developed using benchmarks to similar transactions or indices. For both RMBS and CMBS, cash flows are derived based on the transaction-specific information, which incorporates priority in the capital structure, and are generally adjusted to reflect benchmark yields, market prepayment data, collateral performance (default rates and loss severity) for specific vintage and geography, credit enhancements, and ratings. For certain RMBS and CMBS with low levels of market liquidity, judgments may be required to determine comparable securities based on the loan type and deal-specific performance. CMBS terms may also incorporate lock-out periods that restrict borrowers from prepaying the loans or provide disincentives to prepay and therefore reduce prepayment risk of these securities, compared to RMBS. The factors specifically considered in valuation of CMBS include borrower-specific statistics in a specific region, such as debt service coverage and loan-to-value ratios, as well as the type of commercial property.

Notes to the Group financial statements (unaudited)
Swiss Re Third Quarter 2012 Report 33
The category “Other ABS” primarily includes debt securitised by credit card, student loan and auto loan receivables. Pricing inputs for these securities also focus on capturing, where relevant, collateral quality and performance, payment patterns, and delinquencies.
The Group uses third-party pricing vendor data to value agency securitised products, which mainly include collateralised mortgage obligations (CMO) and mortgage-backed government agency securities. The valuations generally utilise observable inputs consistent with those noted above for RMBS and CMBS.
Equity securities held by the Group for proprietary investment purposes are mainly classified in levels 1 and 2. Securities classified in level 1 are traded on public stock exchanges for which quoted prices are readily available. Level 2 equities include equity investments fair valued pursuant to the fair value option election and certain hedge fund positions; all valued based on primarily observable inputs.
The category “Other assets” mainly includes the Group’s private equity and hedge fund investments which are made directly or via ownership of funds. Substantially all these investments are classified as level 3 due to the lack of observable prices and significant judgment required in valuation. Valuation of direct private equity investments requires significant management judgment due to the absence of quoted market prices and the lack of liquidity. Initial valuation is based on the acquisition cost, and is further refined based on the available market information for the public companies that are considered comparable to the Group’s holdings in the private companies being valued, and the private company-specific performance indicators; both historic and projected. Subsequent valuations also reflect business or asset appraisals, as well as market transaction data for private and public benchmark companies and the actual companies being valued, such as financing rounds and mergers and acquisitions activity. The Group’s holdings in the private equity and hedge funds are generally valued utilising net asset values (NAV), subject to adjustments, as deemed necessary, for restrictions on redemption (lock-up periods and amount limitations on redemptions).
The Group holds both exchange-traded and over-the-counter (OTC) interest rate, foreign exchange, credit and equity derivative contracts for hedging and trading purposes. The fair values of exchange-traded derivatives measured using observable exchange prices are classified in level 1. Long-dated contracts may require adjustments to the exchange-traded prices which would trigger reclassification to level 2 in the fair value hierarchy. OTC derivatives are generally valued by the Group based on the internal models, which are consistent with industry standards and practices, and use both observable (dealer, broker or market consensus prices, spot and forward rates, interest rate and credit curves and volatility indices) and unobservable inputs (adjustments for liquidity, inputs derived from the observable data based on the Group’s judgments and assumptions).
Notes to the Group financial statements (unaudited)
34 Swiss Re Third Quarter 2012 Report
The Group’s OTC interest rate derivatives primarily include interest rate swaps, futures, options, caps and floors, and are valued based on the cash flow discounting models which generally utilise as inputs observable market yield curves and volatility assumptions.
The Group’s OTC foreign exchange derivatives primarily include forward, spot and option contracts and are generally valued based on the cash flow discounting models, utilising as main inputs observable foreign exchange forward curves.
The Group’s investments in equity derivatives primarily include OTC equity option contracts on single or baskets of market indices and equity options on individual or baskets of equity securities, which are valued using internally developed models (such as Black-Scholes option pricing model, various simulation models) calibrated with the inputs, which include underlying spot prices, dividend curves, volatility surfaces, yield curves, and correlations between underlying assets.
The Group’s OTC credit derivatives include index and single-name credit default swaps, as well as more complex structured credit derivatives. Plain vanilla credit derivatives, such as index and single-name credit default swaps, are valued by the Group based on the models consistent with the industry valuation standards for these credit contracts, and primarily utilising observable inputs published by market data sources, such as credit spreads and recovery rates. These valuation techniques warrant classification of plain vanilla OTC derivatives as level 2 financial instruments in the fair value hierarchy.
The Group also holds complex structured credit contracts, such as credit default swaps (CDS) referencing MBS, certain types of collateralised debt obligation (CDO) transactions, and the products sensitive to correlation between two or more underlying parameters (CDO-squared); all of which are classified within level 3 of the fair value hierarchy. A CDO is a debt instrument collateralised by various debt obligations, including bonds, loans and CDS of differing credit profiles. In a CDO-squared transaction, both the primary instrument and the underlying instruments are represented by CDOs. Generally, for CDO and CDO-squared transactions, the observable inputs such as CDS spreads and recovery rates are modified to adjust for correlation between the underlying debt instruments. The correlation levels are modelled at the portfolio level and calibrated at a transaction level to liquid benchmark rates.
Governance around level 3 fair valuationThe Group’s Senior Risk Committee, chaired by the Group Chief Risk Officer, has a primary responsibility for governing and overseeing all of the Group’s valuation policies and operating parameters (including level 3 measurements). The Senior Risk Committee delegates the responsibility for implementation and overseeing of consistent application of the Group’s pricing and valuation policies to the Pricing and Valuation Committee, which is a management control committee. Key functions of the Pricing and Valuation Committee include: oversight over the entire valuation process, approval of internal valuation methodologies, approval of external pricing vendors, monitoring of the independent price verification (IPV) process and resolution of significant or complex valuation issues.
A formal IPV process is undertaken monthly by members of the IPV team within a Financial Risk Management function. The process includes monitoring and in-depth analyses of approved pricing methodologies and valuations of the Group’s financial instruments aimed at identifying and resolving pricing discrepancies.
The Risk function is responsible for independent validation and ongoing review of the Group’s valuation models. The Product Control group within Finance is tasked with reporting of fair values and is empowered to challenge vendor- and model-based valuations.
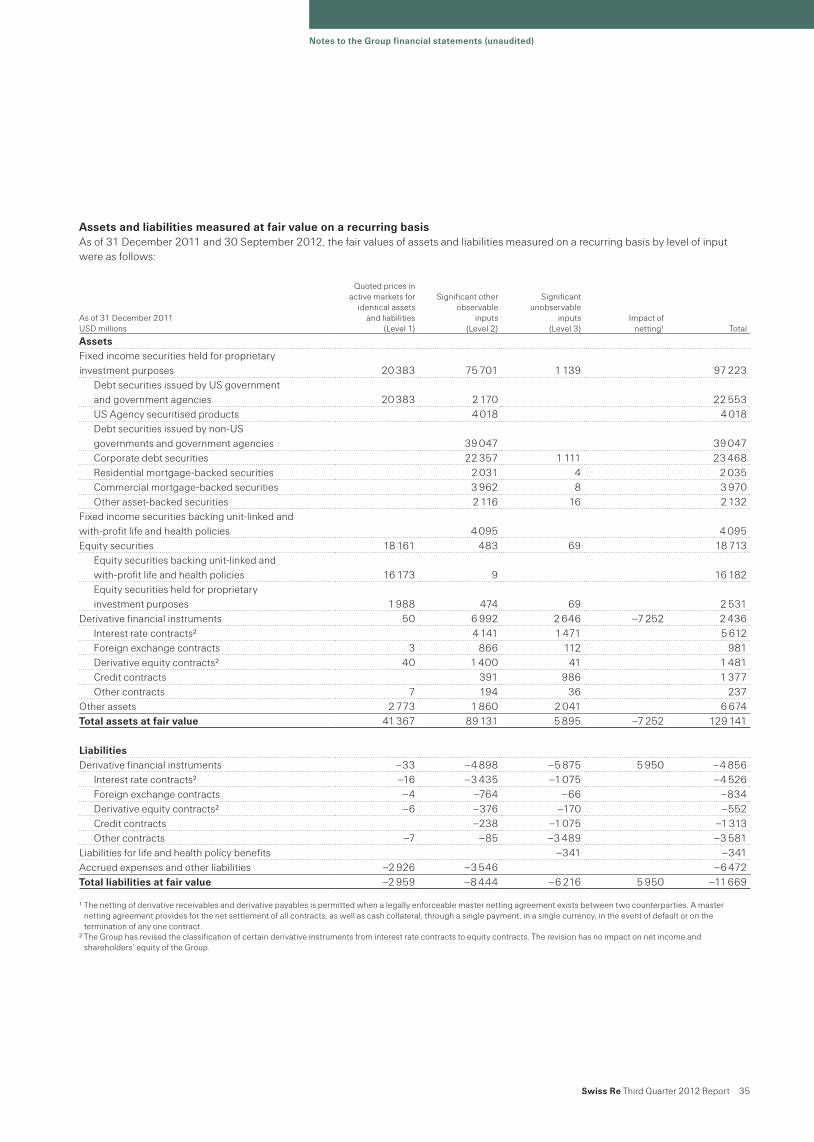
Notes to the Group financial statements (unaudited)
Swiss Re Third Quarter 2012 Report 35
Assets and liabilities measured at fair value on a recurring basisAs of 31 December 2011 and 30 September 2012, the fair values of assets and liabilities measured on a recurring basis by level of input were as follows:
As of 31 December 2011 USD millions
Quoted prices in active markets for
identical assets and liabilities
(Level 1)
Significant other observable
inputs (Level 2)
Significant unobservable
inputs (Level 3)
Impact of netting1 Total
AssetsFixed income securities held for proprietary investment purposes 20 383 75 701 1 139 97 223
Debt securities issued by US government and government agencies 20 383 2 170 22 553US Agency securitised products 4 018 4 018Debt securities issued by non-US governments and government agencies 39 047 39 047Corporate debt securities 22 357 1 111 23 468Residential mortgage-backed securities 2 031 4 2 035Commercial mortgage-backed securities 3 962 8 3 970Other asset-backed securities 2 116 16 2 132
Fixed income securities backing unit-linked and with-profit life and health policies 4 095 4 095Equity securities 18 161 483 69 18 713
Equity securities backing unit-linked and with-profit life and health policies 16 173 9 16 182Equity securities held for proprietary investment purposes 1 988 474 69 2 531
Derivative financial instruments 50 6 992 2 646 –7 252 2 436Interest rate contracts2 4 141 1 471 5 612Foreign exchange contracts 3 866 112 981Derivative equity contracts2 40 1 400 41 1 481Credit contracts 391 986 1 377Other contracts 7 194 36 237
Other assets 2 773 1 860 2 041 6 674Total assets at fair value 41 367 89 131 5 895 –7 252 129 141
LiabilitiesDerivative financial instruments –33 –4 898 –5 875 5 950 –4 856
Interest rate contracts2 –16 –3 435 –1 075 –4 526Foreign exchange contracts –4 –764 –66 –834Derivative equity contracts2 –6 –376 –170 –552Credit contracts –238 –1 075 –1 313Other contracts –7 –85 –3 489 –3 581
Liabilities for life and health policy benefits –341 –341Accrued expenses and other liabilities –2 926 –3 546 –6 472Total liabilities at fair value –2 959 –8 444 –6 216 5 950 –11 669
1 The netting of derivative receivables and derivative payables is permitted when a legally enforceable master netting agreement exists between two counterparties. A master netting agreement provides for the net settlement of all contracts, as well as cash collateral, through a single payment, in a single currency, in the event of default or on the termination of any one contract.
2 The Group has revised the classification of certain derivative instruments from interest rate contracts to equity contracts. The revision has no impact on net income and shareholders’ equity of the Group.

Notes to the Group financial statements (unaudited)
36 Swiss Re Third Quarter 2012 Report
As of 30 September 2012 USD millions
Quoted prices in active markets for
identical assets and liabilities
(Level 1)
Significant other observable
inputs (Level 2)
Significant unobservable
inputs (Level 3)
Impact of netting1 Total
AssetsFixed income securities held for proprietary investment purposes 14 966 73 706 657 89 329
Debt securities issued by US government and government agencies 14 966 841 15 807US Agency securitised products 4 340 4 340Debt securities issued by non-US governments and government agencies 39 781 39 781Corporate debt securities 22 056 650 22 706Residential mortgage-backed securities 1 066 1 066Commercial mortgage-backed securities 3 173 7 3 180Other asset-backed securities 2 449 2 449
Fixed income securities backing unit-linked and with-profit life and health policies 2 4 517 4 519Equity securities 21 461 525 69 22 055
Equity securities backing unit-linked and with-profit life and health policies 18 232 11 18 243Equity securities held for proprietary investment purposes 3 229 514 69 3 812
Derivative financial instruments 93 7 373 1 273 –6 685 2 054Interest rate contracts 11 5 761 5 772Foreign exchange contracts 8 655 663Derivative equity contracts 68 545 731 1 344Credit contracts 245 432 677Other contracts 6 167 110 283
Other assets 3 701 2 177 2 201 8 079Total assets at fair value 40 223 88 298 4 200 –6 685 126 036
LiabilitiesDerivative financial instruments –47 –5 675 –3 691 5 486 –3 927
Interest rate contracts –27 –4 395 –4 422Foreign exchange contracts –5 –502 –507Derivative equity contracts –9 –386 –241 –636Credit contracts –313 –443 –756Other contracts –6 –79 –3 007 –3 092
Liabilities for life and health policy benefits –298 –298Accrued expenses and other liabilities –3 857 –3 720 –7 577Total liabilities at fair value –3 904 –9 395 –3 989 5 486 –11 802
1 The netting of derivative receivables and derivative payables is permitted when a legally enforceable master netting agreement exists between two counterparties. A master netting agreement provides for the net settlement of all contracts, as well as cash collateral, through a single payment, in a single currency, in the event of default or on the termination of any one contract.

Notes to the Group financial statements (unaudited)
Swiss Re Third Quarter 2012 Report 37
Assets and liabilities measured at fair value on a non-recurring basisThe acquired present value of future profits (PVFP) of business in force is recorded in connection with the acquisition of life and /or health business. The initial value is determined actuarially by discounting estimated future gross profits as a measure of the value of business acquired. The resulting asset is amortised on a constant yield basis over the expected revenue recognition period of the business acquired, generally over periods ranging up to 30 years, with the accrual of interest added to the unamortised balance at the earned rate. The carrying value of PVFP is reviewed periodically for indicators of impairment in value. Adjustments to reflect impairment in value are recognised in earnings during the period in which the determination of impairment is made.
In the second quarter of 2012, the Group entered into an agreement to sell Admin Re® US to Jackson National. Upon classification of Admin Re® US as assets held for sale, PVFP and DAC of USD 649 million and USD 31 million, respectively, were reassessed as impaired and written off.
In the second quarter of 2012, the non-recurring fair value measurement using significant unobservable input of PVFP and DAC resulted in a charge to the income statement of USD 680 million.
Transfers between level 1 and level 2Transfers between level 1 and level 2 for the three and nine months ended 30 September 2012 were as follows:
For the three months ended 30 September For the nine months ended 30 September
As of 30 September 2012 USD millions
Quoted prices in active
markets for identical assets and liabilities
(Level 1)
Significant other observable inputs
(Level 2)
Quoted prices in active
markets for identical assets and liabilities
(Level 1)
Significant other observable inputs
(Level 2)
AssetsTransfer into1 7 102 191 2 355Transfer out of1 –12 –13 –78 –1 388
LiabilitiesTransfer into1 –93 –1 921Transfer out of1 589
1 Transfers are recognised at the date of the event or change in circumstances that caused the transfer. With the introduction of ASU No. 2011-4, the Group has reassessed the observability of fair value inputs. Yield curves for instruments with maturities above 20 years were deemed observable and related positions were therefore reclassified from level 3 to level 2. The inputs of one level 2 position were assessed to be unobservable, the respective assets and liabilities were therefore shifted to level 3.

Notes to the Group financial statements (unaudited)
38 Swiss Re Third Quarter 2012 Report
Assets and liabilities measured at fair value on a recurring basis using significant unobservable inputs (level 3)As of 31 December 2011 and 30 September 2012, the reconciliation of the fair values of assets and liabilities measured on a recurring basis using significant unobservable inputs were as follows:
2011 USD millions
Corporate debt securities
Residential mortgage-backed
securities
Commercial mortgage-backed
securities
US Agency securitised
products Other asset-backed
securities
Equity securities held for proprietary
investment purposesDerivative interest
rate contracts3Derivative foreign
exchange contractsDerivative equity
contracts3Derivative credit
contractsOther derivative
contracts Other assets Total
AssetsBalance as of 1 January 2011 1 748 7 3 0 123 203 839 162 0 1 214 202 1 411 5 912
Realised /unrealised gains /losses:Included in net income –1 –4 –5 –15 38 851 –63 1 –77 –48 39 716Included in other comprehensive income –1 4 –15 4 20 12
Purchases2 76 49 10 163 21 206 95 11 163 1 136 1 930Issuances2Sales2 –670 –30 –218 –196 –397 –85 –1 –239 –134 –501 –2 471Settlements2 –147 –3 –12 13 –23 20 –1 –153Transfers into level 31 223 4 17 10 1 41 9 305Transfers out of level 31 –99 –3 –28 –10 –21 –41 –11 –52 –70 –335Impact of foreign exchange movements –18 –1 2 1 –2 3 –4 –2 –21
Closing balance as of 31 December 2011 1 111 4 8 0 16 69 1 471 112 41 986 36 2 041 5 895
Liabilities for life and health policy benefits
Derivative interest rate contracts3
Derivative foreign exchange contracts
Derivative equity contracts3
Derivative credit contracts
Other derivative contracts Total
LiabilitiesBalance as of 1 January 2011 –271 –825 –72 –56 –1 007 –2 572 –4 803
Realised /unrealised gains /losses:Included in net income –69 –413 13 2 –158 –771 –1 396Included in other comprehensive income
Purchases2Issuances2 –7 –7Sales2 46 90 8 144Settlements2 1 1 –154 –152Transfers into level 31 –116 –116Transfers out of level 31 116 116Impact of foreign exchange movements –1 –1 –2
Closing balance as of 31 December 2011 –341 –1 075 –66 –170 –1 075 –3 489 –6 216
1 Transfers are recognised at the date of the event or change in circumstances that caused the transfer.2 ASU No. 2010-06, gross presentation of activity within level 3 roll forward, presenting separately information about purchases, issuances, sales, and settlements.
The standard needs to be applied prospectively.3 The Group has revised the classification of certain derivative instruments from interest rate contracts to equity contracts. The revision has no impact on net income and
shareholders’ equity of the Group.
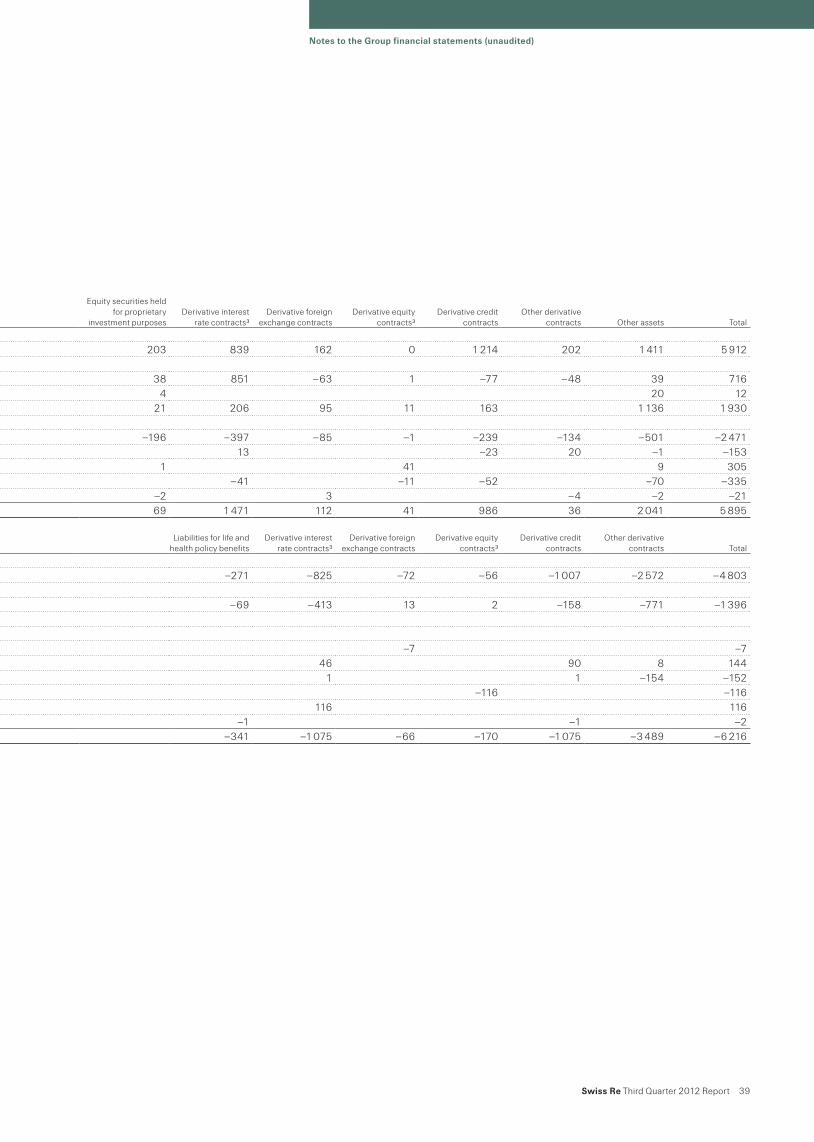
Notes to the Group financial statements (unaudited)
Swiss Re Third Quarter 2012 Report 39
2011 USD millions
Corporate debt securities
Residential mortgage-backed
securities
Commercial mortgage-backed
securities
US Agency securitised
products Other asset-backed
securities
Equity securities held for proprietary
investment purposesDerivative interest
rate contracts3Derivative foreign
exchange contractsDerivative equity
contracts3Derivative credit
contractsOther derivative
contracts Other assets Total
AssetsBalance as of 1 January 2011 1 748 7 3 0 123 203 839 162 0 1 214 202 1 411 5 912
Realised /unrealised gains /losses:Included in net income –1 –4 –5 –15 38 851 –63 1 –77 –48 39 716Included in other comprehensive income –1 4 –15 4 20 12
Purchases2 76 49 10 163 21 206 95 11 163 1 136 1 930Issuances2Sales2 –670 –30 –218 –196 –397 –85 –1 –239 –134 –501 –2 471Settlements2 –147 –3 –12 13 –23 20 –1 –153Transfers into level 31 223 4 17 10 1 41 9 305Transfers out of level 31 –99 –3 –28 –10 –21 –41 –11 –52 –70 –335Impact of foreign exchange movements –18 –1 2 1 –2 3 –4 –2 –21
Closing balance as of 31 December 2011 1 111 4 8 0 16 69 1 471 112 41 986 36 2 041 5 895
Liabilities for life and health policy benefits
Derivative interest rate contracts3
Derivative foreign exchange contracts
Derivative equity contracts3
Derivative credit contracts
Other derivative contracts Total
LiabilitiesBalance as of 1 January 2011 –271 –825 –72 –56 –1 007 –2 572 –4 803
Realised /unrealised gains /losses:Included in net income –69 –413 13 2 –158 –771 –1 396Included in other comprehensive income
Purchases2Issuances2 –7 –7Sales2 46 90 8 144Settlements2 1 1 –154 –152Transfers into level 31 –116 –116Transfers out of level 31 116 116Impact of foreign exchange movements –1 –1 –2
Closing balance as of 31 December 2011 –341 –1 075 –66 –170 –1 075 –3 489 –6 216
1 Transfers are recognised at the date of the event or change in circumstances that caused the transfer.2 ASU No. 2010-06, gross presentation of activity within level 3 roll forward, presenting separately information about purchases, issuances, sales, and settlements.
The standard needs to be applied prospectively.3 The Group has revised the classification of certain derivative instruments from interest rate contracts to equity contracts. The revision has no impact on net income and
shareholders’ equity of the Group.

Notes to the Group financial statements (unaudited)
40 Swiss Re Third Quarter 2012 Report
2012 USD millions
Corporate debt securities
Residential mortgage-backed
securities
Commercial mortgage-backed
securities Other asset-backed
securities
Equity securities held for proprietary
investment purposesDerivative interest
rate contractsDerivative foreign
exchange contractsDerivative equity
contractsDerivative credit
contractsOther derivative
contracts Other assets Total
AssetsBalance as of 1 January 2012 1 111 4 8 16 69 1 471 112 41 986 36 2 041 5 895
Realised /unrealised gains /losses:Included in net income 52 –1 15 1 –97 –127 17 –5 –145Included in other comprehensive income –26 2 2 88 66
Purchases 4 19 38 265 326IssuancesSales –443 –40 –19 –17 –1 –9 1 –140 –668Settlements –46 –9 –1 –73 –3 –132Transfers into level 31 24 41 3 828 38 21 32 987Transfers out of level 31 –26 –4 –3 –7 –1 473 –112 –41 –383 –74 –2 123Impact of foreign exchange movements –6 –6
Closing balance as of 30 September 2012 650 0 7 0 69 0 0 731 432 110 2 201 4 200
Liabilities for life and health policy benefits
Derivative interest rate contracts
Derivative foreign exchange contracts
Derivative equity contracts
Derivative credit contracts
Other derivative contracts Total
LiabilitiesBalance as of 1 January 2012 –341 –1 075 –66 –170 –1 075 –3 489 –6 216
Realised /unrealised gains /losses:Included in net income 43 43 289 369 744Included in other comprehensive income
PurchasesIssuances –2 –14 –16Sales 2 150 68 220Settlements 2 –132 –130Transfers into level 31 –366 –12 –378Transfers out of level 31 1 075 66 116 341 189 1 787Impact of foreign exchange movements
Closing balance as of 30 September 2012 –298 0 0 –241 –443 –3 007 –3 989
1 Transfers are recognised at the date of the event or change in circumstances that caused the transfer. With the introduction of ASU No. 2011-4 the Group has reassessed the observability of fair value inputs. Yield curves for instruments with maturities above 20 years were deemed observable and related positions were therefore reclassified to level 2. The inputs of one level 2 position were assessed to be unobservable, the respective assets and liabilities were therefore shifted to level 3.

Notes to the Group financial statements (unaudited)
Swiss Re Third Quarter 2012 Report 41
2012 USD millions
Corporate debt securities
Residential mortgage-backed
securities
Commercial mortgage-backed
securities Other asset-backed
securities
Equity securities held for proprietary
investment purposesDerivative interest
rate contractsDerivative foreign
exchange contractsDerivative equity
contractsDerivative credit
contractsOther derivative
contracts Other assets Total
AssetsBalance as of 1 January 2012 1 111 4 8 16 69 1 471 112 41 986 36 2 041 5 895
Realised /unrealised gains /losses:Included in net income 52 –1 15 1 –97 –127 17 –5 –145Included in other comprehensive income –26 2 2 88 66
Purchases 4 19 38 265 326IssuancesSales –443 –40 –19 –17 –1 –9 1 –140 –668Settlements –46 –9 –1 –73 –3 –132Transfers into level 31 24 41 3 828 38 21 32 987Transfers out of level 31 –26 –4 –3 –7 –1 473 –112 –41 –383 –74 –2 123Impact of foreign exchange movements –6 –6
Closing balance as of 30 September 2012 650 0 7 0 69 0 0 731 432 110 2 201 4 200
Liabilities for life and health policy benefits
Derivative interest rate contracts
Derivative foreign exchange contracts
Derivative equity contracts
Derivative credit contracts
Other derivative contracts Total
LiabilitiesBalance as of 1 January 2012 –341 –1 075 –66 –170 –1 075 –3 489 –6 216
Realised /unrealised gains /losses:Included in net income 43 43 289 369 744Included in other comprehensive income
PurchasesIssuances –2 –14 –16Sales 2 150 68 220Settlements 2 –132 –130Transfers into level 31 –366 –12 –378Transfers out of level 31 1 075 66 116 341 189 1 787Impact of foreign exchange movements
Closing balance as of 30 September 2012 –298 0 0 –241 –443 –3 007 –3 989
1 Transfers are recognised at the date of the event or change in circumstances that caused the transfer. With the introduction of ASU No. 2011-4 the Group has reassessed the observability of fair value inputs. Yield curves for instruments with maturities above 20 years were deemed observable and related positions were therefore reclassified to level 2. The inputs of one level 2 position were assessed to be unobservable, the respective assets and liabilities were therefore shifted to level 3.

Notes to the Group financial statements (unaudited)
42 Swiss Re Third Quarter 2012 Report
Gains and losses on assets and liabilities measured at fair value on a recurring basis using significant unobservable inputs (level 3)The gains and losses relating to the assets and liabilities measured at fair value using significant unobservable inputs (level 3) for the nine months ended 30 September 2011 and 2012 were as follows:
USD millions 2011 2012
Gains /losses included in net income for the period –760 599Whereof change in unrealised gains /losses relating to assets and liabilities still held at the reporting date –1 014 406

Notes to the Group financial statements (unaudited)
Swiss Re Third Quarter 2012 Report 43
This page intentionally left blank

Notes to the Group financial statements (unaudited)
44 Swiss Re Third Quarter 2012 Report
Quantitative information about level 3 fair value measurementsUnobservable inputs for major level 3 assets and liabilities as of 30 September 2012 were as follows:
USD millionsFair value as of
30 September 2012 Valuation technique Unobservable input Range (weighted average)
AssetsCorporate debt securities 650
Surplus notes with a mortality underlying 159 Discounted cash flow model Illiquidity premium 75 bps (na)Private placement corporate debt 442 Corporate spread matrix Illiquidity premium 15 bps – 500 bps (103 bps)Private placement credit tenant leases 45 Discounted cash flow model Illiquidity premium 75 bps – 250 bps (116 bps)
Derivative equity contracts 731OTC equity option referencing correlated equity indices 731 Proprietary option model Correlation –30% – 100% (35%)1
Derivative credit contracts 432
Credit default swaps referencing various asset-backed securities (ABS) 111Credit spreads derived based on a
reciprocal of a reference instrumentUp-front credit default swap
premium 25% – 100% (76%)Credit correlation tranche transactions 318 Base correlation model Correlation 32% – 83% (58%)1
LiabilitiesDerivative equity contracts –241
OTC equity option referencing correlated equity indices –86 Proprietary option model Correlation –30% – 100% (35%)1Option contract referencing a private equity underlying –151 Option model Volatility 120% – 160% (140%)1
Growth rate 4% (n.a.)
Derivative credit contracts –443
Credit default swaps referencing various asset-backed securities (ABS) –88Credit spreads derived based on a
reciprocal of a reference instrumentUp-front credit default swap
premium 25% – 100% (76%)Credit correlation tranche transactions –347 Base correlation model Correlation 32% – 83% (58%)1
Other derivative contracts and liabilities for life and health policy benefits –3 305Variable annuity and fair valued GMDB contracts –2 978 Discounted cash flow model Risk margin 4% (n.a.)
Volatility 4% – 48%Lapse 0.5% – 14%
Mortality adjustment –2% – 0%Withdrawal rate 0% – 90%
Embedded derivatives in Mod-Co and Coinsurance with Funds Withheld treaties –181 Discounted cash flow model Lapse 3% –10%Mortality adjustment 80% (n.a.)
1 Represents average input value for the reporting period.

Notes to the Group financial statements (unaudited)
Swiss Re Third Quarter 2012 Report 45
USD millionsFair value as of
30 September 2012 Valuation technique Unobservable input Range (weighted average)
AssetsCorporate debt securities 650
Surplus notes with a mortality underlying 159 Discounted cash flow model Illiquidity premium 75 bps (na)Private placement corporate debt 442 Corporate spread matrix Illiquidity premium 15 bps – 500 bps (103 bps)Private placement credit tenant leases 45 Discounted cash flow model Illiquidity premium 75 bps – 250 bps (116 bps)
Derivative equity contracts 731OTC equity option referencing correlated equity indices 731 Proprietary option model Correlation –30% – 100% (35%)1
Derivative credit contracts 432
Credit default swaps referencing various asset-backed securities (ABS) 111Credit spreads derived based on a
reciprocal of a reference instrumentUp-front credit default swap
premium 25% – 100% (76%)Credit correlation tranche transactions 318 Base correlation model Correlation 32% – 83% (58%)1
LiabilitiesDerivative equity contracts –241
OTC equity option referencing correlated equity indices –86 Proprietary option model Correlation –30% – 100% (35%)1Option contract referencing a private equity underlying –151 Option model Volatility 120% – 160% (140%)1
Growth rate 4% (n.a.)
Derivative credit contracts –443
Credit default swaps referencing various asset-backed securities (ABS) –88Credit spreads derived based on a
reciprocal of a reference instrumentUp-front credit default swap
premium 25% – 100% (76%)Credit correlation tranche transactions –347 Base correlation model Correlation 32% – 83% (58%)1
Other derivative contracts and liabilities for life and health policy benefits –3 305Variable annuity and fair valued GMDB contracts –2 978 Discounted cash flow model Risk margin 4% (n.a.)
Volatility 4% – 48%Lapse 0.5% – 14%
Mortality adjustment –2% – 0%Withdrawal rate 0% – 90%
Embedded derivatives in Mod-Co and Coinsurance with Funds Withheld treaties –181 Discounted cash flow model Lapse 3% –10%Mortality adjustment 80% (n.a.)
1 Represents average input value for the reporting period.
Notes to the Group financial statements (unaudited)
46 Swiss Re Third Quarter 2012 Report
Sensitivity of recurring level 3 measurements to changes in unobservable inputsThe significant unobservable input used in the fair value measurement of the Group’s surplus notes, private placement debt securities and private placement credit tenant leases is illiquidity premium. Significant increase (decrease) in this input in isolation would result in a significantly higher (lower) fair value measurement.
The significant unobservable input used in the fair value measurement of the Group’s OTC equity option referencing correlated equity indices is correlation. Where the Group is long correlation risk, a significant increase (decrease) in this input in isolation would result in a significantly higher (lower) fair value measurement. Where the Group is short correlation risk, a significant increase (decrease) in this input in isolation would result in a significantly lower (higher) fair value measurement.
The significant unobservable input used in the fair value measurement of the Group’s credit default swaps referencing ABS is a current up-front credit default swap premium. Where the Group is long protection, a significant increase (decrease) in this input in isolation would result in a significantly higher (lower) fair value measurement. Where the Group is short protection, a significant decrease (increase) in this input in isolation would result in a significantly higher (lower) fair value measurement.
The significant unobservable input used in the fair value measurement of the Group’s credit correlation tranche transactions is correlation. Where the Group is long correlation, a significant increase (decrease) in this input in isolation would result in a significantly higher (lower) fair value measurement. Where the Group is short correlation, a significant increase (decrease) in this input in isolation would result in a significantly lower (higher) fair value measurement.
The significant unobservable inputs used in the fair value measurement of the Group’s option referencing private equity underlying are: volatility and growth rate. Where the Group is long vega, a significant increase (decrease) in volatility in isolation would result in a significantly higher (lower) fair value measurement. Where the Group is short vega, a significant increase (decrease) in volatility in isolation would result in a significantly lower (higher) fair value measurement. Where the Group is long delta, a significant increase (decrease) in the growth rate in isolation would result in a significantly higher (lower) fair value measurement. Where the Group is short delta, a significant increase (decrease) in the growth rate in isolation would result in a significantly lower (higher) fair value measurement.
The significant unobservable inputs used in the fair value measurement of the Group’s variable annuity and fair valued guaranteed minimum death benefit (GMDB) contracts are: risk margin, volatility, lapse, mortality adjustment rate and withdrawal rate. Significant increase (decrease) in isolation in each of the following inputs: risk margin, volatility and withdrawal rate would result in a significantly higher (lower) fair value of the Group’s obligation. Significant increase (decrease) in isolation in a lapse rate for in-the-money contracts would result in a significantly lower (higher) fair value of the Group’s obligation, whereas for out-of-the-money contracts, an isolated increase (decrease) in a lapse assumption would increase (decrease) fair value of the Group’s obligation. Changes in the mortality adjustment rate impact fair value of the Group’s obligation differently for living-benefit products, compared to death-benefit products. For the former, significant increase (decrease) in the mortality adjustment rate (ie: increase (decrease) in mortality, respectively) in isolation would result in a decrease (increase) in fair value of the Group’s liability. For the latter, significant increase (decrease) in the mortality adjustment rate in isolation would result in an increase (decrease) in fair value of the Group’s liability.
The significant unobservable inputs underlying the fair valuation of an embedded derivative bifurcated from the Group’s modified coinsurance (Mod-Co) and Coinsurance with Funds Withheld treaties are lapse and mortality adjustment to published mortality tables; both are applied to build an expectation of cash flows associated with the underlying block of term business. Both inputs are not expected to significantly fluctuate over time.
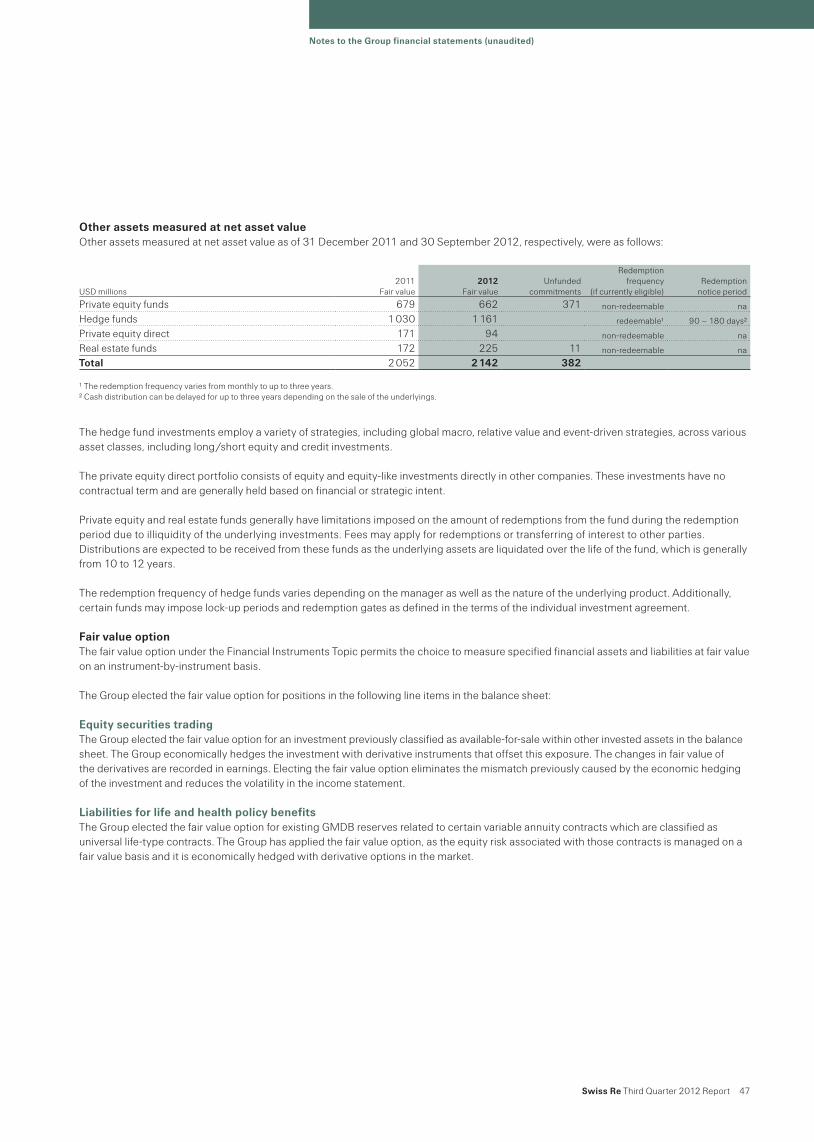
Notes to the Group financial statements (unaudited)
Swiss Re Third Quarter 2012 Report 47
Other assets measured at net asset valueOther assets measured at net asset value as of 31 December 2011 and 30 September 2012, respectively, were as follows:
The hedge fund investments employ a variety of strategies, including global macro, relative value and event-driven strategies, across various asset classes, including long /short equity and credit investments.
The private equity direct portfolio consists of equity and equity-like investments directly in other companies. These investments have no contractual term and are generally held based on financial or strategic intent.
Private equity and real estate funds generally have limitations imposed on the amount of redemptions from the fund during the redemption period due to illiquidity of the underlying investments. Fees may apply for redemptions or transferring of interest to other parties. Distributions are expected to be received from these funds as the underlying assets are liquidated over the life of the fund, which is generally from 10 to 12 years.
The redemption frequency of hedge funds varies depending on the manager as well as the nature of the underlying product. Additionally, certain funds may impose lock-up periods and redemption gates as defined in the terms of the individual investment agreement.
Fair value optionThe fair value option under the Financial Instruments Topic permits the choice to measure specified financial assets and liabilities at fair value on an instrument-by-instrument basis.
The Group elected the fair value option for positions in the following line items in the balance sheet:
Equity securities tradingThe Group elected the fair value option for an investment previously classified as available-for-sale within other invested assets in the balance sheet. The Group economically hedges the investment with derivative instruments that offset this exposure. The changes in fair value of the derivatives are recorded in earnings. Electing the fair value option eliminates the mismatch previously caused by the economic hedging of the investment and reduces the volatility in the income statement.
Liabilities for life and health policy benefitsThe Group elected the fair value option for existing GMDB reserves related to certain variable annuity contracts which are classified as universal life-type contracts. The Group has applied the fair value option, as the equity risk associated with those contracts is managed on a fair value basis and it is economically hedged with derivative options in the market.
USD millions2011
Fair value2012
Fair valueUnfunded
commitments
Redemption frequency
(if currently eligible)Redemption
notice period
Private equity funds 679 662 371 non-redeemable na
Hedge funds 1 030 1 161 redeemable1 90 – 180 days2
Private equity direct 171 94 non-redeemable na
Real estate funds 172 225 11 non-redeemable na
Total 2 052 2 142 382
1 The redemption frequency varies from monthly to up to three years.2 Cash distribution can be delayed for up to three years depending on the sale of the underlyings.

Notes to the Group financial statements (unaudited)
48 Swiss Re Third Quarter 2012 Report
Assets and liabilities measured at fair value pursuant to election of the fair value optionPursuant to the election of the fair value option for the items described, the balances as of 31 December 2011 and 30 September 2012 were as follows:
Changes in fair values for items measured at fair value pursuant to election of the fair value optionGains /losses included in earnings for items measured at fair value pursuant to election of the fair value option including foreign exchange impact for the nine months ended 30 September 2011 and 2012 were as follows:
Fair value changes from equity securities trading are reported in “Net realised investment gains /losses”. Fair value changes from the GMDB reserves are shown in “Life and health benefits”.
Assets and liabilities not measured at fair value but for which the fair value is disclosedAssets and liabilities not measured at fair value but for which the fair value is disclosed as of 30 September 2012, were as follows:
Policy loans, other loans and certain mortgage loans are classified as level 3 measurements, as they do not have an active exit market. The majority of these positions needs to be assessed in conjunction with the corresponding insurance business. Considering these circumstances, the Group presents the carrying amount as an approximation for the fair value.
Investments in real estate are fair valued primarily by external appraisers based on proprietary discounted cash flow models that incorporate applicable risk premium adjustments to discount yields and projected market rental income streams based on market-specific data. These fair value measurements are classified in level 3 in the fair value hierarchy.
Debt positions, which are fair valued based on executable broker quotes or based on the discounted cash flow method using observable inputs, are classified as level 2 measurements. Fair value of the majority of the Group’s level 3 debt positions is judged to approximate carrying value due to the highly tailored nature of the obligation and short-notice termination provisions.
USD millions 2011 2012
AssetsEquity securities held for proprietary investment purposes 571 659
of which at fair value pursuant to the fair value option 455 497LiabilitiesLiabilities for life and health policy benefits –39 044 –36 615
of which at fair value pursuant to the fair value option –341 –298
USD millions 2011 2012
Equity securities held for proprietary investment purposes –17 42Liabilities for life and health policy benefits –95 44Total –112 86
As of 30 September 2012 USD millions
Quoted prices in active
markets for identical assets and liabilities
(Level 1)
Significant other observable inputs
(Level 2)
Significant unobservable
inputs (Level 3) Total
AssetsPolicy loans 287 287Mortgage loans 1 335 1 335Other loans 637 637Investment real estate 2 335 2 335Total assets 4 594 4 594
LiabilitiesDebt –9 642 –9 502 –19 144Total liabilities –9 642 –9 502 –19 144

Notes to the Group financial statements (unaudited)
Swiss Re Third Quarter 2012 Report 49
4 Derivative financial instruments
The Group uses a variety of derivative financial instruments including swaps, options, forwards, credit derivatives and exchange-traded financial futures in its trading and hedging strategies, in line with the Group’s overall risk management strategy. The objectives include managing exposure to price, foreign currency and /or interest rate risk on planned or anticipated investment purchases, existing assets or liabilities, as well as locking in attractive investment conditions for future available funds.
The fair values represent the gross carrying value amounts at the reporting date for each class of derivative contract held or issued by the Group. The gross fair values are not an indication of credit risk, as many over-the-counter transactions are contracted and documented under ISDA master agreements or their equivalent. Management believes that such agreements provide for legally enforceable setoff in the event of default, which substantially reduces credit exposure.
Fair values and notional amounts of derivative financial instrumentsAs of 31 December 2011 and 30 September 2012, the fair values and notional amounts of the derivatives outstanding were as follows:
As of 30 September 2012 USD millions
Notional amount assets /liabilities
Fair value assets
Fair value liabilities
Carrying value assets /liabilities
Derivatives not designated as hedging instrumentsInterest rate contracts1 133 186 4 892 –4 422 470Foreign exchange contracts 26 223 663 –454 209Equity contracts1 18 458 1 344 –636 708Credit contracts 39 025 677 –756 –79Other contracts 24 066 283 –3 092 –2 809Total 240 958 7 859 –9 360 –1 501
Derivatives designated as hedging instrumentsInterest rate contracts 2 836 880 880Foreign exchange contracts 779 –53 –53Total 3 615 880 –53 827
Total derivative financial instruments 244 573 8 739 –9 413 –674
Amount offsetWhere a right of setoff exists –5 169 5 169Due to cash collateral –1 516 317
Total net amount of derivative financial instruments 2 054 –3 927 –1 873
1 The Group has revised the classification of certain derivative instruments from interest rate contracts to equity contracts. The revision has no impact on net income and shareholders’ equity of the Group.
As of 31 December 2011 USD millions
Notional amount assets /liabilities
Fair value assets
Fair value liabilities
Carrying value assets /liabilities
Derivatives not designated as hedging instrumentsInterest rate contracts1 140 676 4 733 –4 522 211Foreign exchange contracts 28 714 981 –766 215Equity contracts1 17 332 1 481 –552 929Credit contracts 45 241 1 377 –1 313 64Other contracts 23 802 237 –3 581 –3 344Total 255 765 8 809 –10 734 –1 925
Derivatives designated as hedging instrumentsInterest rate contracts 2914 879 –4 875Foreign exchange contracts 2 077 –68 –68Total 4 991 879 –72 807
Total derivative financial instruments 260 756 9 688 –10 806 –1 118
Amount offsetWhere a right of setoff exists –5 756 5 756Due to cash collateral –1 496 194
Total net amount of derivative financial instruments 2 436 –4 856 –2 420

Notes to the Group financial statements (unaudited)
50 Swiss Re Third Quarter 2012 Report
The notional amounts of derivative financial instruments give an indication of the Group’s volume of derivative activity. The fair value assets are included in “Other invested assets” and the fair value liabilities are included in “Accrued expenses and other liabilities”. The fair value amounts that were not offset were nil as of 31 December 2011 and 30 September 2012.
Non-hedging activitiesThe Group primarily uses derivative financial instruments for risk management and trading strategies. Gains and losses of derivative financial instruments not designated as hedging instruments are recorded in “Net realised investment gains /losses” in the income statement. Gains and losses of derivative financial instruments not designated as hedging instruments were as follows:
Hedging activitiesThe Group designates certain derivative financial instruments as hedging instruments. The designation of derivative financial instruments is primarily used for overall portfolio and risk management strategies. As of 30 September 2012, the following hedging relationships were outstanding:
Fair value hedgesThe Group enters into interest rate and foreign exchange swaps to reduce the exposure to interest rate and foreign exchange volatility for certain of its issued debt positions. These derivative instruments are designated as hedging instruments in qualifying fair value hedges. Gains and losses on derivative financial instruments designated as fair value hedging instruments are recorded in “Net realised investment gains /losses” in the income statement. Gains and losses attributable to the hedged risks were as follows:
For the three months ended 30 September For the nine months ended 30 SeptemberUSD millions 2011 2012 2011 2012
Derivatives not designated as hedging instrumentsInterest rate contracts1 –105 –156 –172 –199Foreign exchange contracts1 320 147 253 –69Equity contracts1 643 –142 467 –441Credit contracts 110 27 –17 –88Other contracts –992 –4 –780 377Total gain /loss recognised in income –24 –128 –249 –420
1 The Group has revised the amounts for interest, foreign exchange and equity contracts in the periods presented. The changes reflect the reclassification of certain interest rate contracts to equity contracts and the exclusion of certain foreign exchange transactions which did not qualify as derivative instruments under ASC 815. The revision has no impact on net income and shareholders’ equity of the Group.
For the three months ended 30 September For the nine months ended 30 September2011 USD millions
Gains /losses on derivatives
Gains /losses on hedged items
Gains /losses on derivatives
Gains /losses on hedged items
Fair value hedging relationshipsInterest rate contracts 389 –391 408 –403Foreign exchange contracts –150 153 –1 6Total gain /loss recognised in income 239 –238 407 –397
For the three months ended 30 September For the nine months ended 30 September2012 USD millions
Gains /losses on derivatives
Gains /losses on hedged items
Gains /losses on derivatives
Gains /losses on hedged items
Fair value hedging relationshipsInterest rate contracts –7 8 34 –29Foreign exchange contracts 1 –4 –27 13Total gain /loss recognised in income –6 4 7 –16

Notes to the Group financial statements (unaudited)
Swiss Re Third Quarter 2012 Report 51
Hedges of the net investment in foreign operationsThe Group designates non-derivative monetary financial instruments as hedging the foreign currency exposure of its net investment in certain foreign operations.
For the year ended 31 December 2011 and the nine months ended 30 September 2012, the Group recorded an accumulated net unrealised foreign currency remeasurement gain of USD 397 million and a gain of USD 350 million, respectively, in shareholders’ equity. These offset translation gains and losses on the hedged net investment.
Maximum potential lossIn consideration of the rights of setoff and the qualifying master netting arrangements with various counterparties, the maximum potential loss as of 31 December 2011 and 30 September 2012 was approximately USD 3 932 million and USD 3 570 million, respectively. The maximum potential loss is based on the positive market replacement cost assuming non-performance of all counterparties, excluding cash collateral.
Credit risk-related contingent featuresCertain derivative instruments held by the Group contain provisions that require its debt to maintain an investment-grade credit rating. If the Group’s credit rating were downgraded or its debt were no longer rated, the counterparties could request immediate payment, guarantee or an ongoing full overnight collateralisation on derivative instruments in net liability positions.
The total fair value of derivative financial instruments containing credit risk-related contingent features amounted to USD 1 538 million and USD 1 232 million as of 31 December 2011 and 30 September 2012, respectively. For derivative financial instruments containing credit risk-related contingent features, the Group posted collateral of USD 194 million and USD 317 million as of 31 December 2011 and 30 September 2012, respectively. In the event of a reduction of the Group’s credit rating to below investment grade, a fair value of USD 915 million in additional collateral would have had to be posted as of 30 September 2012. The total equals the amount needed to settle the instruments immediately as of 30 September 2012.
Credit derivatives written /soldThe Group writes /sells credit derivatives, including credit default swaps, credit spread options and credit index products, and total return swaps. The total return swaps, for which the Group assumes asset risk mainly of variable interest entities, qualify as guarantees under FASB ASC Topic 460. These activities are part of the Group’s overall portfolio and risk management strategies. The events that could require the Group to perform include bankruptcy, default, obligation acceleration or moratorium of the credit derivative’s underlying.
The following tables show the fair values and the maximum potential payout of the credit derivatives written /sold as of 31 December 2011 and 30 September 2012, categorised by the type of credit derivative and credit spreads, which were based on external market data. The fair values represent the gross carrying values, excluding the effects of netting under ISDA master agreements and cash collateral netting. The maximum potential payout is based on the notional values of the derivatives and represents the gross undiscounted future payments the Group would be required to make, assuming the default of all credit derivatives’ underlyings.
The fair values of the credit derivatives written /sold do not represent the Group’s effective net exposure as the ISDA master agreement and the cash collateral netting are excluded.
The Group has purchased protection to manage the performance /payment risks related to credit derivatives and other credit risks. As of 31 December 2011 and 30 September 2012, the total purchased credit protection based on notional values was USD 26 367 million and USD 20 698 million, respectively, of which USD 8 159 million and USD 8 165 million, respectively, were related to identical underlyings for which the Group sold credit protection. For tranched indexes and baskets, only matching tranches of the respective index were determined as identical. In addition to the purchased credit protection, the Group manages the performance /payment risks through a correlation hedge, which is established with non-identical offsetting positions.
The maximum potential payout is based on notional values of the credit derivatives. The Group enters into total return swaps mainly with variable interest entities which issue insurance-linked and credit-linked securities.

Notes to the Group financial statements (unaudited)
52 Swiss Re Third Quarter 2012 Report
As of 31 December 2011 and 30 September 2012, the fair values and maximum potential payout of the written credit derivatives outstanding were as follows:
Total fair values of credit
derivatives written /sold
Maximum potential payout (time to maturity)
Total maximum potential payout
As of 31 December 2011 USD millions 0–5 years 5–10 years Over 10 years
Credit Default SwapsCredit spread in basis points
0 – 250 –89 3 874 1 692 17 5 583251 – 500 –40 95 143 238501 – 1 000 –17 145 37 182Greater than 1 000 –331 154 5 495 654
Total –477 4 268 1 697 692 6 657
Credit Index ProductsCredit spread in basis points
0 – 250 –280 11 778 134 11 912251 – 500 –57 106 106501 – 1 000 –47 12 71 83Greater than 1 000 –56 116 116
Total –440 11 790 427 0 12 217
Total Return SwapsCredit spread in basis points
No credit spread available 100 997 997Total 100 997 0 0 997
Total credit derivatives written /sold –817 17 055 2 124 692 19 871

Notes to the Group financial statements (unaudited)
Swiss Re Third Quarter 2012 Report 53
Total fair values of credit
derivatives written /sold
Maximum potential payout (time to maturity)
Total maximum potential payout
As of 30 September 2012 USD millions 0–5 years 5–10 years Over 10 years
Credit Default SwapsCredit spread in basis points –50 2 138 2 929 5 067
0 – 250 –36 58 145 203251 – 500 –10 14 33 47501 – 1 000 –293 221 484 705Greater than 1 000 0
Total –389 2 431 2 929 662 6 022
Credit Index ProductsCredit spread in basis points
0 – 250 15 11 732 32 11 764251 – 500 –24 464 464501 – 1 000 10 77 77Greater than 1 000 0
Total 1 12 273 0 32 12 305
Total Return SwapsCredit spread in basis points
No credit spread available 64 728 728Total 64 728 0 0 728
Total credit derivatives written /sold –324 15 432 2 929 694 19 055

Notes to the Group financial statements (unaudited)
54 Swiss Re Third Quarter 2012 Report
5 Deferred acquisition costs (DAC) and acquired present value of future profits (PVFP)
For the year ended 31 December 2011 and the nine months ended 30 September 2012, the DAC were as follows:
Retroceded DAC may arise on retrocession of reinsurance portfolios, including reinsurance undertaken as part of a securitisation. The associated potential retrocession recoveries are determined by the nature of the retrocession agreements and by the terms of the securitisation.
As of 1 January 2012, the Group adopted ASU 2010-26 “Accounting for Costs Associated with Acquiring or Renewing Insurance Contracts” (ASU 2010-26). This new guidance limits the definition of deferrable acquisition costs to costs directly related to the successful acquisition or renewal of insurance contracts. The Group chose to adopt the standard retroactively. Due to immateriality, the release of USD 35 million of DAC not qualifying for deferral under the update was recognised against retained earnings as of 1 January 2012. Consequently, prior-period information has not been retrospectively adjusted. The impact of the guidance on the Group is immaterial.
2011 USD millions
Property & Casualty Reinsurance
Life & Health Reinsurance
Corporate Solutions Admin Re® Group items Total
Opening balance as of 1 January 2011 819 2 743 –40 34 15 3 571Deferred 2 233 254 202 –3 2 686Effect of acquisitions /disposals and retrocessions –1 –9 –10Amortisation –1 798 –313 –180 –8 –2 299Effect of foreign currency translation –6 –21 2 –25Closing balance as of 31 December 2011 1 247 2 663 –25 34 4 3 923
2012 USD millions
Property & Casualty Reinsurance
Life & Health Reinsurance
Corporate Solutions Admin Re® Group items Total
Opening balance as of 1 January 2012 1 247 2 663 –25 34 4 3 923Cumulative effect of adoption of ASU No. 2010-26 –35 –35Deferred 1 470 331 444 2 245Effect of acquisitions /disposals and retrocessions 0Amortisation –1 683 –281 –221 –1 –2 –2 188Effect of foreign currency translation 16 48 1 65Write-off of DAC –31 –31Closing balance as of 30 September 2012 1 050 2 726 199 2 2 3 979

Notes to the Group financial statements (unaudited)
Swiss Re Third Quarter 2012 Report 55
For the year ended 31 December 2011 and the nine months ended 30 September 2012, the PVFP was as follows:
Retroceded PVFP may arise on retrocession of reinsurance portfolios, including reinsurance undertaken as part of a securitisation. The associated potential retrocession recoveries are determined by the nature of the retrocession agreements and by the terms of the securitisation.
On 4 September 2012, the Group completed the sale of Admin Re® US to Jackson National. Subsequently, the subject business was deconsolidated as of that date. In the second quarter of 2012, upon classification of Admin Re® US as assets held for sale, PVFP and DAC of USD 649 million and USD 31 million, respectively, were reassessed as impaired and were written off. Please refer to Note 6 “Acquisitions and Disposals” for further information.
2011 2012
USD millionsLife & Health Reinsurance Admin Re® Total
Life & Health Reinsurance Admin Re® Total
Opening balance 1 736 2 829 4 565 1 674 2 552 4 226Effect of acquisitions /disposals and retrocessions 112 135 247 –206 256 50Amortisation –218 –413 –631 –160 –294 –454Interest accrued on unamortised PVFP 54 177 231 42 140 182Effect of foreign currency translation –10 –10 –20 36 58 94Effect of change in unrealised gains /losses –166 –166 49 49Write-off of PVFP –649 –649Closing balance 1 674 2 552 4 226 1 386 2 112 3 498

Notes to the Group financial statements (unaudited)
56 Swiss Re Third Quarter 2012 Report
6 Acquisitions and disposals
Disposal of Admin Re® USIn the second quarter of 2012, the Group entered into an agreement to sell Admin Re® US to Jackson National Life Insurance Company. In the third quarter of 2012, the Group completed the sale following the receipt of all necessary regulatory approvals. Admin Re® US primarily consisted of bonds, policy loans and policyholder liabilities.
The purchase price was USD 663 million, with an initial cash payment of USD 589 million and the remainder deferred until 2013. A pre-close dividend of USD 270 million was also received. The transaction has resulted in a net loss in the Admin Re® segment of USD 399 million on a year to date basis. The loss has been reflected in the “Net realised investment gains /losses – non-participating business” line in the income statement of the Admin Re® segment. Certain blocks of businesses have been retained through retrocession or other contractual agreements.
Aquisition of New California Holdings, Inc.In 2000, the Group and the shareholders of New California Holdings, Inc. entered into a put /call agreement for the acquisition of New California Holdings, Inc., which is the parent company of Aurora National Life Assurance Company. The latter was already fully consolidated by the Group as a VIE from 1 January 2010 due to an update to Topic 810 – Consolidation, because the majority of the mortality, investment and expense risk was passed on to the Group via a modified coinsurance agreement. As the modified coinsurance agreement covered only 95% of Aurora’s business, the Group reported a non-controlling interest from the consolidation of this VIE. Please refer also to Note 14.
On 29 August 2012, the Group closed on the acquisition of New California Holdings, Inc., which was immediately merged into its subsidiary Aurora National Life Assurance Company. The only significant balance sheet item of New California Holdings, Inc. was its investment in Aurora National Life Assurance Company. Therefore the impact on the Group’s balance sheet and income statement from this acquisition is not material, considering the consolidation of Aurora National Life Assurance Company as a VIE in prior reporting periods.
New California Holdings, Inc. was acquired for USD 548 million in cash. As of the acquisition date, the Group fully owns Aurora National Life Assurance Company and consequently no longer reports any non-controlling interest related to this entity.
Disposal of Swiss Re Private Equity Partners AGThe sale of Swiss Re Private Equity Partners AG, the management company of the Group’s private equity fund-of-fund business, to BlackRock, Inc. was completed on 4 September 2012. As a result of the transaction, the Group recognised a gain of USD 38 million. The sale resulted in a reduction in non-controlling interests of USD 1 400 million related to private equity funds. The Group continues to be invested as a limited partner in the funds and recognises its share in the funds at the reported net asset value, accounting for them under the equity method of accounting.

Notes to the Group financial statements (unaudited)
Swiss Re Third Quarter 2012 Report 57
This page intentionally left blank

Notes to the Group financial statements (unaudited)
58 Swiss Re Third Quarter 2012 Report
7 Debt and contingent capital instruments
The Group enters into long- and short-term debt arrangements to obtain funds for general corporate use and specific transaction financing. The Group defines short-term debt as debt having a maturity at the balance sheet date of less than one year and long-term debt as having a maturity of greater than one year. Interest expense is classified accordingly.
The Group’s debt as of 31 December 2011 and 30 September 2012 was as follows:
The Group uses debt for general corporate purposes and to fund discrete pools of operational leverage and financial intermediation assets. Operational leverage and financial intermediation are subject to asset and liability matching, resulting in little to no risk that the assets will be insufficient to service and settle the liabilities. Debt used for operational leverage and financial intermediation is treated as operational debt and excluded by the rating agencies from financial leverage calculations. Certain debt positions are limited recourse, meaning the debtors’ claims are limited to assets underlying the financing. As of 31 December 2011 and 30 September 2012, debt related to operational leverage and financial intermediation amounted to USD 13.8 billion (thereof USD 6.3 billion limited recourse) and USD 10.0 billion (thereof USD 6.1 billion limited recourse), respectively.
Interest expense on long-term debt and contingent capital instrumentsInterest expense on long-term debt for the periods ended 30 September 2011 and 2012 was as follows:
Interest expenses on contingent capital instruments for the three months and nine months ended 30 September 2012 were USD 18 million and USD 39 million, respectively.
Three months ended 30 September Nine months ended 30 SeptemberUSD millions 2011 2012 2011 2012
Senior financial debt 23 36 61 124Senior operational debt 61 28 228 88Subordinated financial debt 59 64 174 173Subordinated operational debt 65 62 193 187Total 208 190 656 572
USD millions 2011 2012
Senior financial debt 279 753Senior operational debt 3 848 2 966Short-term debt – financial and operational debt 4 127 3 719
Senior financial debt 2 976 4 223Senior operational debt 4 854 1 741Subordinated financial debt 3 587 4 250Subordinated operational debt 5 124 5 315Long-term debt – financial and operational debt 16 541 15 529
Total carrying value 20 668 19 248Total fair value 20 022 19 144

Notes to the Group financial statements (unaudited)
Swiss Re Third Quarter 2012 Report 59
Long-term debt issued in 2012In July 2012, Swiss Reinsurance Company Ltd issued a 30-year subordinated fixed-to-floating rate loan note which is callable after 10 years. The instrument has a face value of EUR 500 million, with a fixed coupon of 6.625% per annum until the first optional redemption date (1 September 2022).
Contingent capital instruments issued in 2012In February 2012, Swiss Reinsurance Company Ltd issued a perpetual subordinated note with stock settlement. The instrument has a face value of CHF 320 million, with a fixed coupon of 7.25% per annum until the first optional redemption date (1 September 2017).
In March 2012, Swiss Reinsurance Company Ltd issued a perpetual subordinated capital instrument with stock settlement. The instrument has a face value of USD 750 million, with a fixed coupon of 8.25% per annum until the first optional redemption date (1 September 2018).
Both instruments may be converted, at the option of the issuer, into Swiss Re Ltd shares at any time at market or within six months following a solvency event at a pre-set floor price. These instruments are referred to in these financial statements as “contingent capital instruments”.
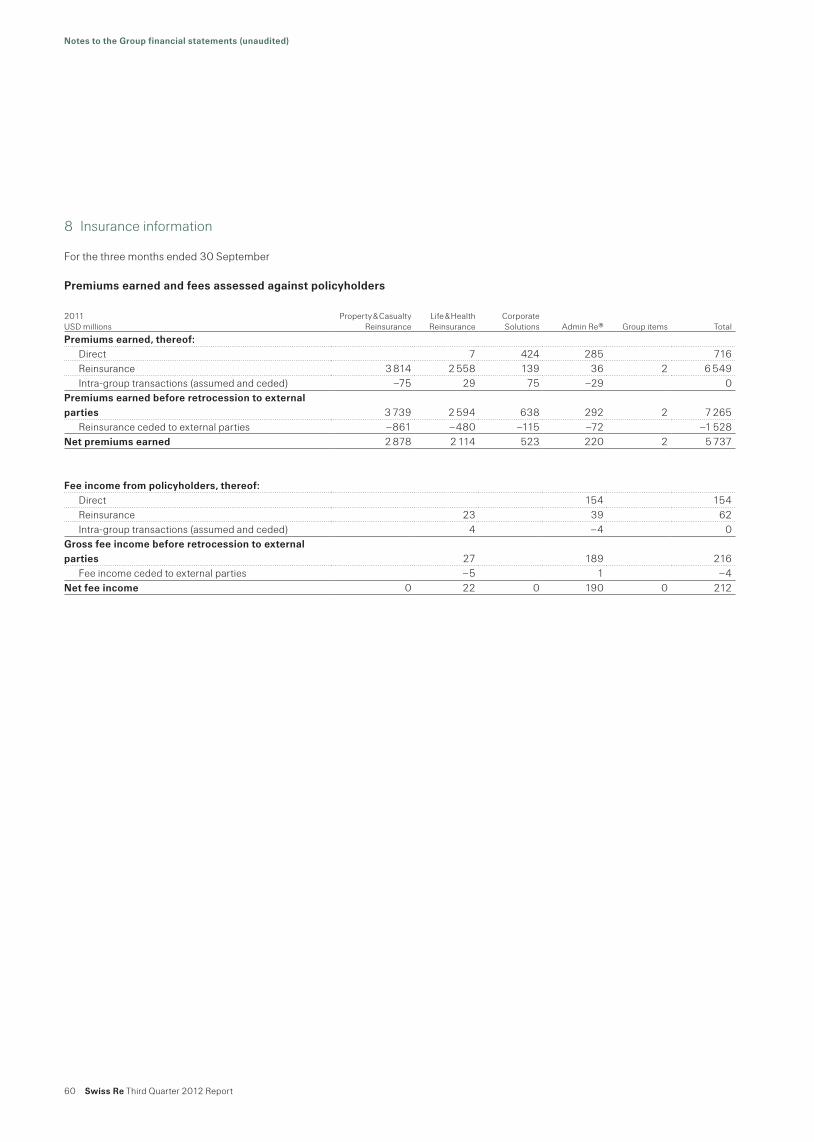
60 Swiss Re Third Quarter 2012 Report
Notes to the Group financial statements (unaudited)
8 Insurance information
For the three months ended 30 September
Premiums earned and fees assessed against policyholders
2011 USD millions
Property & Casualty Reinsurance
Life & Health Reinsurance
Corporate Solutions Admin Re® Group items Total
Premiums earned, thereof:Direct 7 424 285 716Reinsurance 3 814 2 558 139 36 2 6 549Intra-group transactions (assumed and ceded) –75 29 75 –29 0
Premiums earned before retrocession to external parties 3 739 2 594 638 292 2 7 265
Reinsurance ceded to external parties –861 –480 –115 –72 –1 528Net premiums earned 2 878 2 114 523 220 2 5 737
Fee income from policyholders, thereof:Direct 154 154Reinsurance 23 39 62Intra-group transactions (assumed and ceded) 4 –4 0
Gross fee income before retrocession to external parties 27 189 216
Fee income ceded to external parties –5 1 –4Net fee income 0 22 0 190 0 212

Swiss Re Third Quarter 2012 Report 61
Notes to the Group financial statements (unaudited)
For the three months ended 30 September
Premiums earned and fees assessed against policyholders
2012 USD millions
Property & Casualty Reinsurance
Life & Health Reinsurance
Corporate Solutions Admin Re® Group items Total
Premiums earned, thereof:Direct 51 622 244 917Reinsurance 4 351 2 655 40 65 4 7 115Intra-group transactions (assumed and ceded) –69 35 69 –35 0
Premiums earned before retrocession to external parties 4 282 2 741 731 274 4 8 032
Reinsurance ceded to external parties –986 –490 –143 –25 –1 644Net premiums earned 3 296 2 251 588 249 4 6 388
Fee income from policyholders, thereof:Direct 150 150Reinsurance 13 29 42Intra-group transactions (assumed and ceded) 1 –1 0
Gross fee income before retrocession to external parties 14 178 192
Fee income ceded to external parties 0Net fee income 0 14 0 178 0 192

62 Swiss Re Third Quarter 2012 Report
Notes to the Group financial statements (unaudited)
For the nine months ended 30 September
Premiums earned and fees assessed against policyholders
2011 USD millions
Property & Casualty Reinsurance
Life & Health Reinsurance
Corporate Solutions Admin Re® Group items Total
Premiums earned, thereof:Direct 20 1 361 838 2 219Reinsurance 9 608 7 497 313 125 22 17 565Intra-group transactions (assumed and ceded) –47 81 47 –81 0
Premiums earned before retrocession to external parties 9 561 7 598 1 721 882 22 19 784
Reinsurance ceded to external parties –2 067 –1 391 –345 –205 –4 008Net premiums earned 7 494 6 207 1 376 677 22 15 776
Fee income from policyholders, thereof:Direct 491 491Reinsurance 64 118 182Intra-group transactions (assumed and ceded) 12 –12 0
Gross fee income before retrocession to external parties 76 597 673
Fee income ceded to external parties –12 1 –11Net fee income 0 64 0 598 0 662

Swiss Re Third Quarter 2012 Report 63
Notes to the Group financial statements (unaudited)
For the nine months ended 30 September
Premiums earned and fees assessed against policyholders
2012 USD millions
Property & Casualty Reinsurance
Life & Health Reinsurance
Corporate Solutions Admin Re® Group items Total
Premiums earned, thereof:Direct 95 1 592 983 2 670Reinsurance 11 953 7 720 282 143 5 20 103Intra-group transactions (assumed and ceded) –200 103 200 –103 0
Premiums earned before retrocession to external parties 11 753 7 918 2 074 1 023 5 22 773
Reinsurance ceded to external parties –2 556 –1 376 –419 –151 –4 502Net premiums earned 9 197 6 542 1 655 872 5 18 271
Fee income from policyholders, thereof:Direct 489 489Reinsurance 47 107 154Intra-group transactions (assumed and ceded) 8 –8 0
Gross fee income before retrocession to external parties 55 588 643
Fee income ceded to external parties 0Net fee income 0 55 0 588 0 643

64 Swiss Re Third Quarter 2012 Report
Notes to the Group financial statements (unaudited)
For the three months ended 30 September
Claims and claim adjustment expenses
Acquisition costs
2011 USD millions
Property & Casualty Reinsurance
Life & Health Reinsurance
Corporate Solutions Admin Re® Group items Consolidation Total
Acquisition costs, thereof:Gross acquisition costs with external parties –725 –512 –62 –196 –4 –1 499Intra-group transactions (assumed and ceded) 4 –8 –4 8 0
Acquisition costs before impact of retrocession to external parties –721 –520 –66 –188 –4 –1 499
Retrocession to external parties 253 95 26 10 384Net acquisition costs –468 –425 –40 –178 0 –4 –1 115
2011 USD millions
Property & Casualty Reinsurance
Life & Health Reinsurance
Corporate Solutions Admin Re® Group items Consolidation Total
Claims paid, thereof:Gross claims paid to external parties –2 339 –2 258 –663 –746 –6 006Intra-group transactions (assumed and ceded) –305 –26 305 26 0
Claims before receivables from retrocession to external parties –2 644 –2 284 –358 –720 –6 006
Receivables from retrocession to external parties 375 545 97 86 1 103
Net claims paid –2 269 –1 739 –261 –634 0 0 –4 903
Change in unpaid claims and claim adjustment expenses; life and health benefits, thereof:
Gross – with external parties 528 96 30 316 –3 2 969Intra-group transactions (assumed and ceded) 126 –8 –126 8 0
Unpaid claims and claim adjustment expenses; life and health benefits before impact of retrocession to third parties 654 88 –96 324 –3 2 969
Reinsurance ceded to external parties 105 –80 –31 –6Net unpaid claims and claim adjustment expenses; life and health benefits 759 8 –127 324 –3 2 963
Claims and claim adjustment expenses; life and health benefits –1 510 –1 731 –388 –310 –3 2 –3 940

Swiss Re Third Quarter 2012 Report 65
Notes to the Group financial statements (unaudited)
For the three months ended 30 September
Claims and claim adjustment expenses
Acquisition costs
2012 USD millions
Property & Casualty Reinsurance
Life & Health Reinsurance
Corporate Solutions Admin Re® Group items Consolidation Total
Acquisition costs, thereof:Gross acquisition costs with external parties –879 –512 –101 –70 –2 –1 564Intra-group transactions (assumed and ceded) 20 –1 –20 1 0
Acquisition costs before impact of retrocession to external parties –859 –513 –121 –69 –2 –1 564
Retrocession to external parties 306 80 23 3 412Net acquisition costs –553 –433 –98 –66 –2 0 –1 152
2012 USD millions
Property & Casualty Reinsurance
Life & Health Reinsurance
Corporate Solutions Admin Re® Group items Consolidation Total
Claims paid, thereof:Gross claims paid to external parties –2 533 –2 372 –457 –768 –12 –6 142Intra-group transactions (assumed and ceded) –205 –35 204 36 0
Claims before receivables from retrocession to external parties –2 738 –2 407 –253 –732 –12 –6 142
Receivables from retrocession to external parties 393 875 73 62 1 403
Net claims paid –2 345 –1 532 –180 –670 –12 0 –4 739
Change in unpaid claims and claim adjustment expenses; life and health benefits, thereof:
Gross – with external parties 583 243 223 136 12 1 197Intra-group transactions (assumed and ceded) 368 3 –367 –4 0
Unpaid claims and claim adjustment expenses; life and health benefits before impact of retrocession to third parties 951 246 –144 132 12 1 197
Reinsurance ceded to external parties 35 –480 22 25 –398Net unpaid claims and claim adjustment expenses; life and health benefits 986 –234 –122 157 12 0 799
Claims and claim adjustment expenses; life and health benefits –1 359 –1 766 –302 –513 0 0 –3 940

66 Swiss Re Third Quarter 2012 Report
Notes to the Group financial statements (unaudited)
For the nine months ended 30 September
Claims and claim adjustment expenses
Acquisition costs
2011 USD millions
Property & Casualty Reinsurance
Life & Health Reinsurance
Corporate Solutions Admin Re® Group items Consolidation Total
Claims paid, thereof:Gross claims paid to external parties –6 648 –6 261 –1 569 –2 308 5 –16 781Intra-group transactions (assumed and ceded) –971 –96 971 96 0
Claims before receivables from retrocession to external parties –7 619 –6 357 –598 –2 212 5 –16 781
Receivables from retrocession to external parties 1 031 1 508 276 287 3 102
Net claims paid –6 588 –4 849 –322 –1 925 5 0 –13 679
Change in unpaid claims and claim adjustment expenses; life and health benefits, thereof:
Gross – with external parties –670 180 99 586 –2 7 200Intra-group transactions (assumed and ceded) 829 26 –829 –26 0
Unpaid claims and claim adjustment expenses; life and health benefits before impact of retrocession to third parties 159 206 –730 560 –2 7 200
Reinsurance ceded to external parties 728 –121 –21 –12 574Net unpaid claims and claim adjustment expenses; life and health benefits 887 85 –751 548 –2 7 774
Claims and claim adjustment expenses; life and health benefits –5 701 –4 764 –1 073 –1 377 3 7 –12 905
2011 USD millions
Property & Casualty Reinsurance
Life & Health Reinsurance
Corporate Solutions Admin Re® Group items Consolidation Total
Acquisition costs, thereof:Gross acquisition costs with external parties –1 938 –1 493 –245 –315 –7 –1 –3 999Intra-group transactions (assumed and ceded) –45 –25 45 25 0
Acquisition costs before impact of retrocession to external parties –1 983 –1 518 –200 –290 –7 –1 –3 999
Retrocession to external parties 635 236 93 26 990Net acquisition costs –1 348 –1 282 –107 –264 –7 –1 –3 009
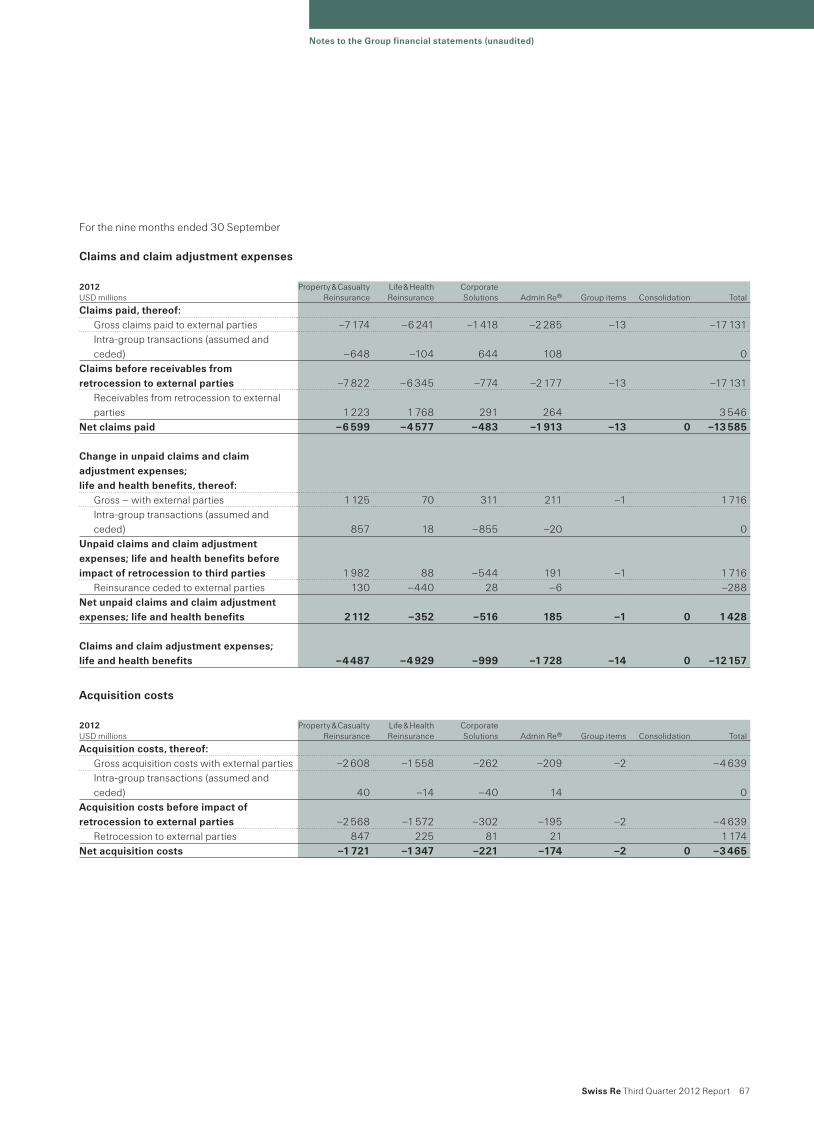
Swiss Re Third Quarter 2012 Report 67
Notes to the Group financial statements (unaudited)
For the nine months ended 30 September
Claims and claim adjustment expenses
Acquisition costs
2012 USD millions
Property & Casualty Reinsurance
Life & Health Reinsurance
Corporate Solutions Admin Re® Group items Consolidation Total
Claims paid, thereof:Gross claims paid to external parties –7 174 –6 241 –1 418 –2 285 –13 –17 131Intra-group transactions (assumed and ceded) –648 –104 644 108 0
Claims before receivables from retrocession to external parties –7 822 –6 345 –774 –2 177 –13 –17 131
Receivables from retrocession to external parties 1 223 1 768 291 264 3 546
Net claims paid –6 599 –4 577 –483 –1 913 –13 0 –13 585
Change in unpaid claims and claim adjustment expenses; life and health benefits, thereof:
Gross – with external parties 1 125 70 311 211 –1 1 716Intra-group transactions (assumed and ceded) 857 18 –855 –20 0
Unpaid claims and claim adjustment expenses; life and health benefits before impact of retrocession to third parties 1 982 88 –544 191 –1 1 716
Reinsurance ceded to external parties 130 –440 28 –6 –288Net unpaid claims and claim adjustment expenses; life and health benefits 2 112 –352 –516 185 –1 0 1 428
Claims and claim adjustment expenses; life and health benefits –4 487 –4 929 –999 –1 728 –14 0 –12 157
2012 USD millions
Property & Casualty Reinsurance
Life & Health Reinsurance
Corporate Solutions Admin Re® Group items Consolidation Total
Acquisition costs, thereof:Gross acquisition costs with external parties –2 608 –1 558 –262 –209 –2 –4 639Intra-group transactions (assumed and ceded) 40 –14 –40 14 0
Acquisition costs before impact of retrocession to external parties –2 568 –1 572 –302 –195 –2 –4 639
Retrocession to external parties 847 225 81 21 1 174Net acquisition costs –1 721 –1 347 –221 –174 –2 0 –3 465

68 Swiss Re Third Quarter 2012 Report
Notes to the Group financial statements (unaudited)
Reinsurance receivablesReinsurance receivables as of 31 December 2011 and 30 September 2012 were as follows:
Sales inducementsSales inducements are offered to contract holders of certain universal life and annuity products. The amounts deferred equal the sum of persistency bonuses credited to the account value, plus the non-interest related increase in the persistency bonus liability. These costs are amortised in constant proportion to estimated gross profits over the life of the contract, using the credited interest rates as the discount rate.
Sales inducements as of 31 December 2011 and 30 September 2012 were as follows:
Policyholder dividendsPolicyholder dividends are recognised as an element of policyholder benefits. In the nine months ended 30 September 2011 and 2012, the relative percentage of participating insurance of the life and health policy benefits was 6% and 8%, respectively. The amount of policyholder dividend expense for the three months ended 30 September 2011 and 2012 was USD 7 million and USD 47 million, respectively. For the nine months ended 30 September 2011 and 2012, the policyholder dividend expense amounted to USD 48 million and USD 97 million, respectively.
USD millions 2011 2012
Premium receivables invoiced 1 6811 1 260Receivables from ceded re /insurance business 7471 424Assets arising from the application of the deposit method of accounting and meeting the definition of financing receivables 707 1 331Recognised allowance –132 –118
1 The Group has revised its classification of reinsurance receivables and, as a result, the notional amounts of some receivables that were previously classified as premium receivables invoiced are now classified as receivables from ceded re /insurance business.
USD millions 2011 2012
Balance as of 1 January 1 019 1 020Sales inducements deferred 265 271Sales inducements amortised –257 –163Impact of foreign exchange and other movements –7 37Impact of disposals – –83Unamortised balance of sales inducements 1 020 1 082
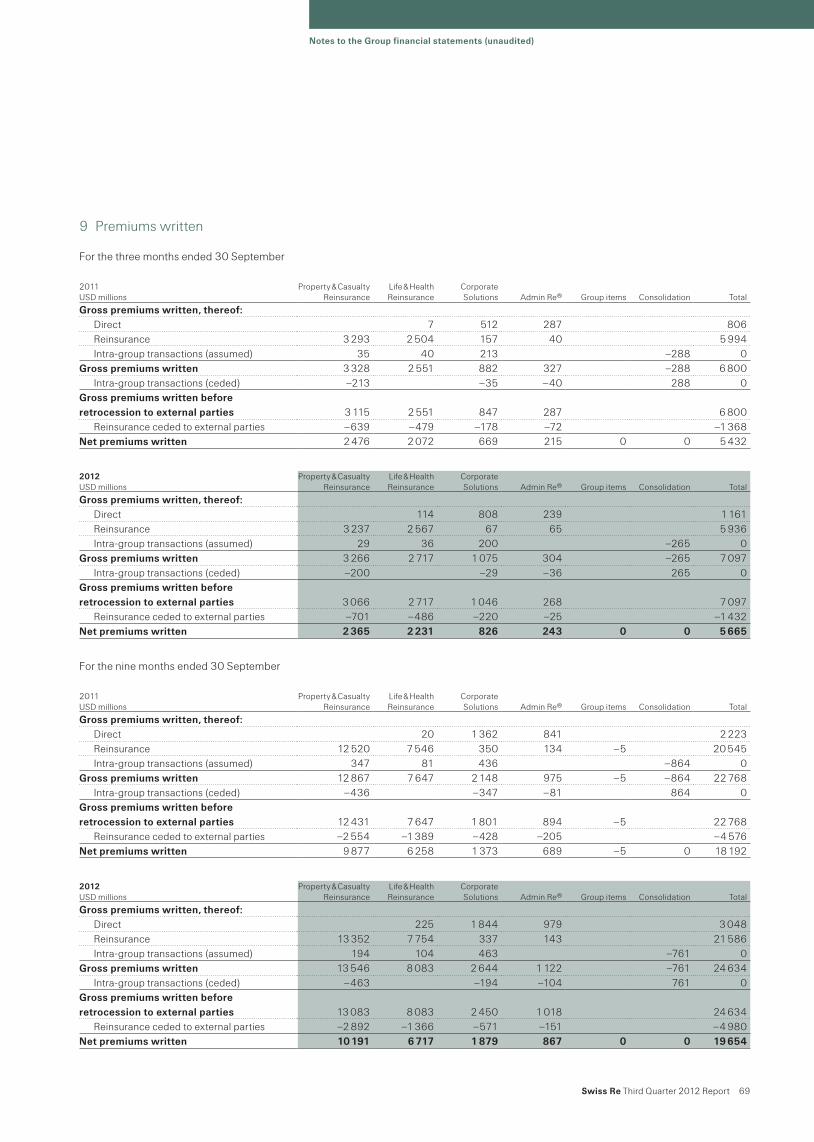
Swiss Re Third Quarter 2012 Report 69
Notes to the Group financial statements (unaudited)
9 Premiums written
For the three months ended 30 September
For the nine months ended 30 September
2011 USD millions
Property & Casualty Reinsurance
Life & Health Reinsurance
Corporate Solutions Admin Re® Group items Consolidation Total
Gross premiums written, thereof:Direct 7 512 287 806Reinsurance 3 293 2 504 157 40 5 994Intra-group transactions (assumed) 35 40 213 –288 0
Gross premiums written 3 328 2 551 882 327 –288 6 800Intra-group transactions (ceded) –213 –35 –40 288 0
Gross premiums written before retrocession to external parties 3 115 2 551 847 287 6 800
Reinsurance ceded to external parties –639 –479 –178 –72 –1 368Net premiums written 2 476 2 072 669 215 0 0 5 432
2012 USD millions
Property & Casualty Reinsurance
Life & Health Reinsurance
Corporate Solutions Admin Re® Group items Consolidation Total
Gross premiums written, thereof:Direct 114 808 239 1 161Reinsurance 3 237 2 567 67 65 5 936Intra-group transactions (assumed) 29 36 200 –265 0
Gross premiums written 3 266 2 717 1 075 304 –265 7 097Intra-group transactions (ceded) –200 –29 –36 265 0
Gross premiums written before retrocession to external parties 3 066 2 717 1 046 268 7 097
Reinsurance ceded to external parties –701 –486 –220 –25 –1 432Net premiums written 2 365 2 231 826 243 0 0 5 665
2011 USD millions
Property & Casualty Reinsurance
Life & Health Reinsurance
Corporate Solutions Admin Re® Group items Consolidation Total
Gross premiums written, thereof:Direct 20 1 362 841 2 223Reinsurance 12 520 7 546 350 134 –5 20 545Intra-group transactions (assumed) 347 81 436 –864 0
Gross premiums written 12 867 7 647 2 148 975 –5 –864 22 768Intra-group transactions (ceded) –436 –347 –81 864 0
Gross premiums written before retrocession to external parties 12 431 7 647 1 801 894 –5 22 768
Reinsurance ceded to external parties –2 554 –1 389 –428 –205 –4 576Net premiums written 9 877 6 258 1 373 689 –5 0 18 192
2012 USD millions
Property & Casualty Reinsurance
Life & Health Reinsurance
Corporate Solutions Admin Re® Group items Consolidation Total
Gross premiums written, thereof:Direct 225 1 844 979 3 048Reinsurance 13 352 7 754 337 143 21 586Intra-group transactions (assumed) 194 104 463 –761 0
Gross premiums written 13 546 8 083 2 644 1 122 –761 24 634Intra-group transactions (ceded) –463 –194 –104 761 0
Gross premiums written before retrocession to external parties 13 083 8 083 2 450 1 018 24 634
Reinsurance ceded to external parties –2 892 –1 366 –571 –151 –4 980Net premiums written 10 191 6 717 1 879 867 0 0 19 654

70 Swiss Re Third Quarter 2012 Report
Notes to the Group financial statements (unaudited)
10 Earnings per share
Earnings per share for the periods ended 30 September 2011 and 2012 were as follows:
Dividends are declared in Swiss francs. During the year ended 31 December 2011 and the period ended 30 September 2012, the Group’s dividends declared (in the form of withholding tax exempt repayment of legal reserves from capital contributions) per share were CHF 2.75 and CHF 3.00, respectively.
In 2000, Swiss Re and the shareholders of New California Holdings, Inc. entered into a put /call agreement for the acquisition of New California Holdings, Inc. by Swiss Re. The put /call agreement was considered a redeemable non-controlling interest; however, a value was not assigned to this instrument as the exercise was contingent on several items occurring to complete the transaction. During the second quarter of 2012, the majority of the contingencies had been resolved and the exercise of the put /call at the predetermined price became probable. In accordance with US GAAP requirements, the difference between the carrying value of the minority interest and the redemption price, USD 132 million, was recorded against shareholders’ equity and as a reduction in the net income attributable to common shareholders for the purposes of calculating earnings per share. In August 2012, the option was exercised and New California Holdings Inc was acquired. Please refer to Note 6 “Acquisitions and Disposals” for further information.
Three months ended 30 September Nine months ended 30 SeptemberUSD millions (except share data) 2011 2012 2011 2012
Basic earnings per shareNet income 1 442 2 220 1 860 3 585Non-controlling interests –94 –20 –217 –140Interest on contingent capital instruments1 –18 –39Net income attributable to common shareholders 1 348 2 182 1 643 3 406Attribution of value to option on redeemable non-controlling interest –6 –132Net income attributable to common shareholders after adjustment to non-controlling interest 1 348 2 176 1 643 3 274Weighted average common shares outstanding 342 032 117 343 716 610 342 032 117 343 383 256Net income per share in USD 3.94 6.33 4.80 9.53Net income per share in CHF2 3.46 5.96 4.21 8.97
Effect of dilutive securitiesChange in income available to common shares due to contingent capital instruments and debt instruments1 17 16 37Change in average number of shares due to contingent capital instruments, debt instruments and employee options 820 659 36 651 740 10 145 815 26 942 741
Diluted earnings per shareNet income assuming debt conversion and exercise of options 1 348 2 193 1 659 3 311Weighted average common shares outstanding 342 852 776 380 368 350 352 117 932 370 325 997Net income per share in USD 3.93 5.77 4.71 8.94Net income per share in CHF2 3.45 5.42 4.13 8.41
1 Please refer to Note 7 “Debt and contingent capital instruments”2 The translation from USD to CHF is shown for informational purposes only and has been calculated using the Group’s average exchange rates

Swiss Re Third Quarter 2012 Report 71
Notes to the Group financial statements (unaudited)
11 Benefit plans
Defined benefit pension plans and post-retirement benefitsThe Group sponsors various funded defined benefit pension plans. Employer contributions to the plans are charged to income on a basis which recognises the costs of pensions over the expected service lives of employees covered by the plans. The Group’s funding policy for these plans is to contribute annually at a rate that is intended to maintain a level percentage of compensation for the employees covered. A full actuarial valuation is prepared at least every three years.
The Group also provides certain healthcare and life insurance benefits for retired employees and their dependants. Employees become eligible for these benefits when they become eligible for pension benefits.
Components of net periodic benefit costThe components of pension and post-retirement cost for the nine months ended 30 September 2011 and 2012 were as follows:
Employer’s contributions for 2012For the nine months ended 30 September 2012, the Group contributed USD 142 million to its defined benefit pension plans and USD 12 million to other post-retirement plans, compared to USD 121 million and USD 12 million, respectively, in the same period of 2011.
The expected 2012 contributions to the defined benefit pension plans and to the post-retirement benefit plans, revised as of 30 September 2012 for latest information, amount to USD 168 million and USD 16 million, respectively.
2011 USD millions Swiss plans Foreign plans Other benefits Total
Service cost (net of participant contributions) 85 8 4 97Interest cost 69 77 10 156Expected return on assets –97 –80 –177Amortisation of: Net gain /loss 27 13 –8 32 Prior service cost 5 –8 –3Effect of settlement, curtailment and termination 0Net periodic benefit cost 89 18 –2 105
2012 USD millions Swiss plans Foreign plans Other benefits Total
Service cost (net of participant contributions) 80 5 4 89Interest cost 58 70 10 138Expected return on assets –75 –73 –148Amortisation of: Net gain /loss 33 9 –6 36 Prior service cost –9 –9Effect of settlement, curtailment and termination 1 1 2Net periodic benefit cost 97 12 –1 108
72 Swiss Re Third Quarter 2012 Report
Notes to the Group financial statements (unaudited)
12 Commitments and contingent liabilities
In 2010, Berkshire Hathaway through its affiliate, Berkshire Hathaway Life Insurance Company of Nebraska, entered into a coinsurance agreement with Swiss Re Life & Health America Inc. (the “Co-insurance Agreement”) and a stop loss agreement with Swiss Reinsurance Company Ltd in respect of Swiss Re’s U.S. pre-2004 yearly renewable term life business. The agreements limit Berkshire Hathaway’s exposure to USD 1.5 billion.
On the basis of its perception of the performance of the retroceded business and losses incurred to date, Berkshire Hathaway has served notice under the Co-insurance Agreement setting forth various specific and general allegations and alleging damages of between USD 0.5 and 1.0 billion.
As required by the Co-insurance Agreement, the parties have met to discuss the allegations and have exchanged, and continue to exchange, proposals to resolve the dispute. Failure to resolve the dispute could result in commencement of arbitration proceedings. If arbitration proceedings are commenced, there is no guarantee that arbitrators would agree with the Group’s position and findings against the Group could have a material adverse effect on its financial condition and results of operations.
The Group believes that these claims are without merit.

Swiss Re Third Quarter 2012 Report 73
Notes to the Group financial statements (unaudited)
This page intentionally left blank

74 Swiss Re Third Quarter 2012 Report
Notes to the Group financial statements (unaudited)
13 Information on business segments
The Group provides reinsurance and insurance throughout the world through its business segments. The business segments are determined by the organisational structure and by the way in which management reviews the operating performance of the Group.
On 1 October 2010, the Group announced a change in its organisational structure by aligning its operational business units to its core business activities. The implementation of the new structure was achieved through several steps, including changes in the Group legal entity set-up, redesign of certain intra-group transactions and capital management measures. The new operational structure became effective from 1 January 2012.
As a result, the Group presents four core operating business segments: Property & Casualty Reinsurance, Life & Health Reinsurance, Corporate Solutions and Admin Re®. Asset Management activities are no longer disclosed as a separate operating segment. Invested assets managed by Asset Management and Group Treasury have been assigned to the new business segments according to risk profile, duration and further asset-liability management considerations. Actual returns on those assets are reported in the respective operating segments.
The presentation of each segment’s balance sheet is closely aligned to the segment legal entity structure. The assignment of assets and liabilities for entities that span more than one segment are determined by considering local statutory requirements, legal and other constraints, the economic view of duration and currency requirements of the reinsurance business written, and the capacity of the segments to absorb risks. This consideration determined each segment’s initial capital positions under the new structure.
Interest expense is incurred from the segment’s capital funding position. The tax position of the operating segments is derived from legal entity tax obligations, subject to Group tax considerations.
Accounting policies applied by the business segments are in line with those described in the summary of significant accounting policies (please refer to Note 1 to the Group’s annual consolidated financial statements). Comparative information for 2011 is presented according to the 2012 segments presentation basis.
The Group operating segments are outlined below.
Property & Casualty Reinsurance and Life & Health ReinsuranceReinsurance consists of two segments, Property & Casualty and Life & Health. The Reinsurance business unit operates globally, both through brokers and directly with clients, and provides a large range of solutions for risk and capital management. Clients include insurance companies and mutual as well as public sector and governmental entities. In addition to traditional reinsurance solutions, the Business Unit offers insurance-linked securities and other insurance-related capital market products in both Property & Casualty and Life & Health.
Property & Casualty includes the business lines property, casualty including motor, and specialty. Life & Health is split into two sub-segments.
Corporate SolutionsCorporate Solutions offers innovative insurance capacity to mid-sized and large multinational corporations across the globe. Offerings range from standard risk transfer covers and multi-line programmes, to customised solutions tailored to the needs of clients. Corporate Solutions serves customers from over 40 offices worldwide.
Swiss Re Third Quarter 2012 Report 75
Notes to the Group financial statements (unaudited)
Admin Re®Through Admin Re®, the Group acquires closed blocks of in-force life and health insurance business, either through reinsurance or corporate acquisition, and typically assumes responsibility for administering the underlying policies. The administration of the business may be managed directly or, where appropriate, in partnership with a third party. Since 1998, the Group has acquired more than 40 blocks of business spanning a range of product types. It currently operates in the UK, US and the Netherlands.
Admin Re® completed the sale of its Admin Re® US operation but retained certain blocks of the US business. For more details please refer to Note 6.
Group itemsItems not allocated to the business segments are included in the “Group items” column, which encompasses Swiss Re Ltd, the Group holding company, the former Legacy reinsurance business in run-off and certain Treasury units. The holding company charges trademark licence fees to the operating segments which are reported as other revenues. Certain administrative expenses of the corporate centre functions that are not recharged to the operating segments are reported as Group items.
ConsolidationSegment information is presented net of external and internal retrocession and other intra-group arrangements. The Group total is obtained after elimination of intra-group transactions in the “Consolidation” column. This includes significant intra-group reinsurance arrangements, recharge of trademark licence fees, and intersegmental funding.

76 Swiss Re Third Quarter 2012 Report
Notes to the Group financial statements (unaudited)
a) Business segments – income statementFor the three months ended 30 September 2011
2011 USD millions
Property & Casualty Reinsurance
Life & Health Reinsurance
Corporate Solutions Admin Re® Group items Consolidation Total
RevenuesPremiums earned 2 878 2 114 523 220 2 5 737Fee income from policyholders 22 190 212Net investment income – non-participating 225 418 33 393 39 –27 1 081Net realised investment gains – non-participating 170 548 103 101 30 952Net investment result – unit-linked and with-profit –89 –2 255 –2 344Other revenues 12 –1 65 –66 10Total revenues 3 285 3 013 658 –1 351 136 –93 5 648
ExpensesClaims and claim adjustment expenses –1 510 –388 –3 6 –1 895Life and health benefits –1 731 –310 –4 –2 045Return credited to policyholders 82 2 111 2 193Acquisition costs –468 –425 –40 –178 –4 –1 115Other expenses –366 –202 –130 –139 –164 77 –924Interest expenses –39 –153 –15 –25 18 –214Total expenses –2 383 –2 429 –558 1 469 –192 93 –4 000
Income /loss before income tax expense 902 584 100 118 –56 0 1 648Income tax expense /benefit –84 –92 –33 84 –81 –206Net income /loss before attribution of non-controlling interests 818 492 67 202 –137 0 1 442
Income attributable to non-controlling interests –87 –7 –94Net income /loss after attribution of non-controlling interests 731 492 67 195 –137 0 1 348
Interest on contingent capital instrumentsNet income /loss attributable to common shareholders 731 492 67 195 –137 0 1 348
Claims ratio in % 52.5 74.2 55.8Expense ratio in % 29.0 32.5 29.5Combined ratio in % 81.5 106.7 85.3Management expense ratio in % 7.9Benefit ratio in % 76.7

Swiss Re Third Quarter 2012 Report 77
Notes to the Group financial statements (unaudited)
Business segments – income statementFor the three months ended 30 September 2012
2012 USD millions
Property & Casualty Reinsurance
Life & Health Reinsurance
Corporate Solutions Admin Re® Group items Consolidation Total
RevenuesPremiums earned 3 296 2 251 588 249 4 6 388Fee income from policyholders 14 178 192Net investment income – non-participating 329 294 30 362 10 –6 1 019Net realised investment gains – non-participating 82 271 53 742 15 1 163Net investment result – unit-linked and with-profit 52 917 969Other revenues 24 1 –1 125 –65 84Total revenues 3 731 2 883 671 2 447 154 –71 9 815
ExpensesClaims and claim adjustment expenses –1 359 –302 1 –1 660Life and health benefits –1 766 –513 –1 –2 280Return credited to policyholders –54 –929 –983Acquisition costs –553 –433 –98 –66 –2 –1 152Other expenses –371 –219 –114 –122 –156 54 –928Interest expenses –34 –144 –13 –6 17 –180Total expenses –2 317 –2 616 –514 –1 643 –164 71 –7 183
Income /loss before income tax expense 1 414 267 157 804 –10 0 2 632Income tax expense /benefit –361 –67 –47 21 42 –412Net income before attribution of non-controlling interests 1 053 200 110 825 32 0 2 220
Income attributable to non-controlling interests –18 –2 –20Net income after attribution of non-controlling interests 1 035 200 110 823 32 0 2 200
Interest on contingent capital instruments –5 –13 –18Net income attributable to common shareholders 1 030 187 110 823 32 0 2 182
Claims ratio in % 41.3 51.3 42.8Expense ratio in % 28.0 36.1 29.2Combined ratio in % 69.3 87.4 72.0Management expense ratio in % 8.6Benefit ratio in % 79.0

78 Swiss Re Third Quarter 2012 Report
Notes to the Group financial statements (unaudited)
Business segments – income statementFor the nine months ended 30 September 2011
2011 USD millions
Property & Casualty Reinsurance
Life & Health Reinsurance
Corporate Solutions Admin Re® Group items Consolidation Total
RevenuesPremiums earned 7 494 6 207 1 376 677 22 15 776Fee income from policyholders 64 598 662Net investment income – non-participating 1 056 1 194 86 1 192 122 –78 3 572Net realised investment gains /losses – non-participating 320 716 170 174 –13 1 367Net investment result – unit-linked and with-profit –63 –1 625 –1 688Other revenues 29 5 176 –175 35Total revenues 8 899 8 118 1 637 1 016 307 –253 19 724
ExpensesClaims and claim adjustment expenses –5 701 –1 073 3 20 –6 751Life and health benefits –4 764 –1 377 –13 –6 154Return credited to policyholders 34 1 237 1 271Acquisition costs –1 348 –1 282 –107 –264 –7 –1 –3 009Other expenses –964 –520 –328 –343 –272 195 –2 232Interest expenses –115 –439 –2 –46 –95 52 –645Total expenses –8 128 –6 971 –1 510 –793 –371 253 –17 520
Income /loss before income tax expense 771 1 147 127 223 –64 0 2 204Income tax expense /benefit –78 –116 –49 52 –153 –344Net income /loss before attribution of non-controlling interests 693 1 031 78 275 –217 0 1 860
Income attributable to non-controlling interests –209 –1 –7 –217Net income /loss after attribution of non-controlling interests 484 1 031 77 268 –217 0 1 643
Interest on contingent capital instruments 0Net income /loss attributable to common shareholders 484 1 031 77 268 –217 0 1 643
Claims ratio in % 76.0 78.0 76.3Expense ratio in % 30.9 31.6 31.0Combined ratio in % 106.9 109.6 107.3Management expense ratio in % 7.0Benefit ratio in % 75.1

Swiss Re Third Quarter 2012 Report 79
Notes to the Group financial statements (unaudited)
Business segments – income statementFor the nine months ended 30 September 2012
2012 USD millions
Property & Casualty Reinsurance
Life & Health Reinsurance
Corporate Solutions Admin Re® Group items Consolidation Total
RevenuesPremiums earned 9 197 6 542 1 655 872 5 18 271Fee income from policyholders 55 588 643Net investment income – non-participating 1 137 1 033 77 1 214 14 –12 3 463Net realised investment gains /losses – non-participating 302 610 111 –162 32 893Net investment result – unit-linked and with-profit 138 1 814 1 952Other revenues 80 2 –1 324 –221 184Total revenues 10 716 8 380 1 843 4 325 375 –233 25 406
ExpensesClaims and claim adjustment expenses –4 487 –999 –14 –5 500Life and health benefits –4 929 –1 728 –6 657Return credited to policyholders –181 –2 002 –2 183Acquisition costs –1 721 –1 347 –221 –174 –2 –3 465Other expenses –977 –579 –336 –335 –308 185 –2 350Interest expenses –77 –438 –41 –46 48 –554Total expenses –7 262 –7 474 –1 556 –4 280 –370 233 –20 709
Income before income tax expense 3 454 906 287 45 5 0 4 697Income tax expense /benefit –901 –236 –67 43 49 –1 112Net income before attribution of non-controlling interests 2 553 670 220 88 54 0 3 585
Income attributable to non-controlling interests –133 –7 –140Net income after attribution of non-controlling interests 2 420 670 220 81 54 0 3 445
Interest on contingent capital instruments –13 –26 –39Net income attributable to common shareholders 2 407 644 220 81 54 0 3 406
Claims ratio in % 48.8 60.3 50.5Expense ratio in % 29.3 33.7 30.0Combined ratio in % 78.1 94.0 80.5Management expense ratio in % 7.6Benefit ratio in % 75.8

80 Swiss Re Third Quarter 2012 Report
Notes to the Group financial statements (unaudited)
2011 USD millions
Property & Casualty Reinsurance
Life & Health Reinsurance
Corporate Solutions Admin Re® Group items Consolidation Total
AssetsFixed income securities 28 611 32 217 4 501 31 266 628 97 223Equity securities 1 459 183 403 9 477 2 531Other investments 18 791 3 691 213 5 439 2 819 –4 492 26 461Short-term investments 7 004 3 368 973 1 096 1 219 13 660Investments for unit-linked and with-profit business 719 21 630 22 349Cash and cash equivalents 6 550 2 367 685 1 472 333 11 407Deferred acquisition costs 1 247 2 663 –25 34 4 3 923Acquired present value of future profits 1 674 2 552 4 226Reinsurance recoverable 4 951 2 902 9 900 3 641 –9 557 11 837Other reinsurance assets 12 500 10 133 2 147 358 3 –4 636 20 505Goodwill 2 006 2 028 17 4 051Other 4 769 1 886 1 249 791 163 –1 132 7 726Total assets 87 888 63 831 20 063 68 288 5 646 –19 817 225 899
LiabilitiesUnpaid claims and claim adjustment expenses 49 451 9 310 12 465 1 695 24 –8 067 64 878Liabilities for life and health policy benefits 18 367 198 21 229 –750 39 044Policyholder account balances 2 423 32 486 –747 34 162Other reinsurance liabilities 11 334 2 056 4 654 2 143 14 –5 504 14 697Short-term debt 856 797 230 963 2 674 –1 393 4 127Long-term debt 3 376 12 930 235 16 541Other 11 209 8 976 229 1 980 2 074 –3 305 21 163Total liabilities 76 226 54 859 17 776 60 496 5 021 –19 766 194 612
Shareholders’ equity 10 389 8 972 2 277 7 378 625 –51 29 590
Non-controlling interests 1 273 10 414 1 697Total equity 11 662 8 972 2 287 7 792 625 –51 31 287
Total liabilities and equity 87 888 63 831 20 063 68 288 5 646 –19 817 225 899
Business segments – balance sheetAs of 31 December 2011

Swiss Re Third Quarter 2012 Report 81
Notes to the Group financial statements (unaudited)
2012 USD millions
Property & Casualty Reinsurance
Life & Health Reinsurance
Corporate Solutions Admin Re® Group items Consolidation Total
AssetsFixed income securities 31 196 31 118 4 849 22 012 154 89 329Equity securities 2 415 296 580 3 518 3 812Other investments 17 789 3 565 195 1 743 4 980 –7 301 20 971Short-term investments 8 356 4 733 1 513 1 180 750 16 532Investments for unit-linked and with-profit business 767 24 398 25 165Cash and cash equivalents 7 262 1 985 644 1 548 1 517 12 956Deferred acquisition costs 1 050 2 726 199 2 2 3 979Acquired present value of future profits 1 386 2 112 3 498Reinsurance recoverable 5 321 2 407 9 222 671 –7 493 10 128Other reinsurance assets 13 417 8 761 2 579 3 426 3 –2 696 25 490Goodwill 1 998 2 057 17 4 072Other 7 480 2 051 673 793 323 –2 442 8 878Total assets 96 284 61 852 20 471 57 888 8 247 –19 932 224 810
LiabilitiesUnpaid claims and claim adjustment expenses 47 841 9 285 12 302 1 243 25 –7 490 63 206Liabilities for life and health policy benefits 17 347 210 19 070 –12 36 615Policyholder account balances 1 386 27 639 29 025Other reinsurance liabilities 13 899 2 047 4 631 503 9 –3 120 17 969Short-term debt 2 128 1 513 630 1 403 –1 955 3 719Long-term debt 3 853 11 603 604 –531 15 529Other 16 474 10 404 589 1 933 2 556 –6 777 25 179Total liabilities 84 195 53 585 17 732 51 018 4 597 –19 885 191 242
Shareholders’ equity 12 075 8 267 2 729 6 870 3 650 –47 33 544
Non-controlling interests 14 10 24Total equity 12 089 8 267 2 739 6 870 3 650 –47 33 568
Total liabilities and equity 96 284 61 852 20 471 57 888 8 247 –19 932 224 810
Business segments – balance sheetAs of 30 September 2012

82 Swiss Re Third Quarter 2012 Report
Notes to the Group financial statements (unaudited)
b) Property & Casualty Reinsurance business segment – by line of businessFor the three months ended 30 September
2011 USD millions Property Casualty Specialty Total
Premiums earned 1 546 849 483 2 878
ExpensesClaims and claim adjustment expenses –791 –653 –66 –1 510Acquisition costs –166 –192 –110 –468Other expenses –176 –105 –85 –366Total expenses before interest expenses –1 133 –950 –261 –2 344
Underwriting result 413 –101 222 534
Net investment income 225Net realised investment gains /losses 170Other revenues 12Interest expenses –39Income before income tax expenses 902
Claims ratio in % 51.2 76.9 13.6 52.5Expense ratio in % 22.1 35.0 40.4 29.0Combined ratio in % 73.3 111.9 54.0 81.5
2012 USD millions Property Casualty Specialty Total
Premiums earned 1 704 1 119 473 3 296
ExpensesClaims and claim adjustment expenses –612 –644 –103 –1 359Acquisition costs –177 –280 –96 –553Other expenses –195 –117 –59 –371Total expenses before interest expenses –984 –1 041 –258 –2 283
Underwriting result 720 78 215 1 013
Net investment income 329Net realised investment gains /losses 82Other revenues 24Interest expenses –34Income before income tax expenses 1 414
Claims ratio in % 35.9 57.5 21.7 41.3Expense ratio in % 21.8 35.5 32.8 28.0Combined ratio in % 57.7 93.0 54.5 69.3

Swiss Re Third Quarter 2012 Report 83
Notes to the Group financial statements (unaudited)
2011 USD millions Property Casualty Specialty Total
Premiums earned 3 583 2 359 1 552 7 494
ExpensesClaims and claim adjustment expenses –3 641 –1 516 –544 –5 701Acquisition costs –463 –526 –359 –1 348Other expenses –453 –279 –232 –964Total expenses before interest expenses –4 557 –2 321 –1 135 –8 013
Underwriting result –974 38 417 –519
Net investment income 1 056Net realised investment gains /losses 320Other revenues 29Interest expenses –115Income before income tax expenses 771
Claims ratio in % 101.6 64.3 35.0 76.0Expense ratio in % 25.6 34.1 38.1 30.9Combined ratio in % 127.2 98.4 73.1 106.9
2012 USD millions Property Casualty Specialty Total
Premiums earned 4 241 3 505 1 451 9 197
ExpensesClaims and claim adjustment expenses –1 840 –2 136 –511 –4 487Acquisition costs –529 –892 –300 –1 721Other expenses –507 –294 –176 –977Total expenses before interest expenses –2 876 –3 322 –987 –7 185
Underwriting result 1 365 183 464 2 012
Net investment income 1 137Net realised investment gains /losses 302Other revenues 80Interest expenses –77Income before income tax expenses 3 454
Claims ratio in % 43.4 61.0 35.2 48.8Expense ratio in % 24.4 33.8 32.8 29.3Combined ratio in % 67.8 94.8 68.0 78.1
Property & Casualty Reinsurance business segment – by line of businessFor the nine months ended 30 September

84 Swiss Re Third Quarter 2012 Report
Notes to the Group financial statements (unaudited)
c) Life & Health Reinsurance business segment – by line of business For the three months ended 30 September
2011 USD millions Life Health Total
RevenuesPremiums earned 1 501 613 2 114Fee income from policyholders 22 22Net investment income – non-participating 280 138 418Net investment income – unit-linked and with-profit 12 12Net realised investment gains /losses – unit-linked and with-profit –101 –101Net realised investment gains /losses – insurance-related derivatives 108 –11 97Other revenues 0Total revenues before non-participating realised gains /losses 1 822 740 2 562
ExpensesLife and health benefits –1 334 –397 –1 731Return credited to policyholders 82 82Acquisition costs –318 –107 –425Other expenses –159 –43 –202Total expenses before interest expenses –1 729 –547 –2 276
Operating income 93 193 286
Net realised investment gains /losses – non-participating and excluding insurance-related derivatives 451Interest expenses –153Income before income tax expenses 584
Management expense ratio in % 8.8 5.8 7.9Benefit ratio1 in % 81.6 64.8 76.7
1 The benefit ratio is calculated as claims paid and claims adjustment expenses in relation to premiums earned, both of which exclude unit-linked and with-profit business. Additionally, the impact of guaranteed minimum death benefit (GMDB) products is excluded, as this ratio is not indicative of the operating performance of such products.

Swiss Re Third Quarter 2012 Report 85
Notes to the Group financial statements (unaudited)
Life & Health Reinsurance business segment – by line of business For the three months ended 30 September
2012 USD millions Life Health Total
RevenuesPremiums earned 1 473 778 2 251Fee income from policyholders 14 14Net investment income – non-participating 186 108 294Net investment income – unit-linked and with-profit 18 18Net realised investment gains /losses – unit-linked and with-profit 34 34Net realised investment gains /losses – insurance-related derivatives –17 –17Other revenues 1 1Total revenues before non-participating realised gains /losses 1 709 886 2 595
ExpensesLife and health benefits –1 131 –635 –1 766Return credited to policyholders –54 –54Acquisition costs –313 –120 –433Other expenses –151 –68 –219Total expenses before interest expenses –1 649 –823 –2 472
Operating income 60 63 123
Net realised investment gains /losses – non-participating and excluding insurance-related derivatives 288Interest expenses –144Income before income tax expenses 267
Management expense ratio in % 9.0 7.7 8.6Benefit ratio1 in % 77.6 81.6 79.0
1 The benefit ratio is calculated as claims paid and claims adjustment expenses in relation to premiums earned, both of which exclude unit-linked and with-profit business. Additionally, the impact of guaranteed minimum death benefit (GMDB) products is excluded, as this ratio is not indicative of the operating performance of such products.

86 Swiss Re Third Quarter 2012 Report
Notes to the Group financial statements (unaudited)
2011 USD millions Life Health Total
RevenuesPremiums earned 4 476 1 731 6 207Fee income from policyholders 64 64Net investment income – non-participating 764 430 1 194Net investment income – unit-linked and with-profit 20 20Net realised investment gains /losses – unit-linked and with-profit –83 –83Net realised investment gains /losses – insurance-related derivatives 96 –8 88Other revenues 0Total revenues before non-participating realised gains /losses 5 337 2 153 7 490
ExpensesLife and health benefits –3 587 –1 177 –4 764Return credited to policyholders 34 34Acquisition costs –968 –314 –1 282Other expenses –414 –106 –520Total expenses before interest expenses –4 935 –1 597 –6 532
Operating income 402 556 958
Net realised investment gains /losses – non-participating and excluding insurance-related derivatives 628Interest expenses –439Income before income tax expenses 1 147
Management expense ratio in % 7.8 4.9 7.0Benefit ratio1 in % 77.9 68.0 75.1
1 The benefit ratio is calculated as claims paid and claims adjustment expenses in relation to premiums earned, both of which exclude unit-linked and with-profit business. Additionally, the impact of guaranteed minimum death benefit (GMDB) products is excluded, as this ratio is not indicative of the operating performance of such products.
Life & Health Reinsurance business segment – by line of business For the nine months ended 30 September
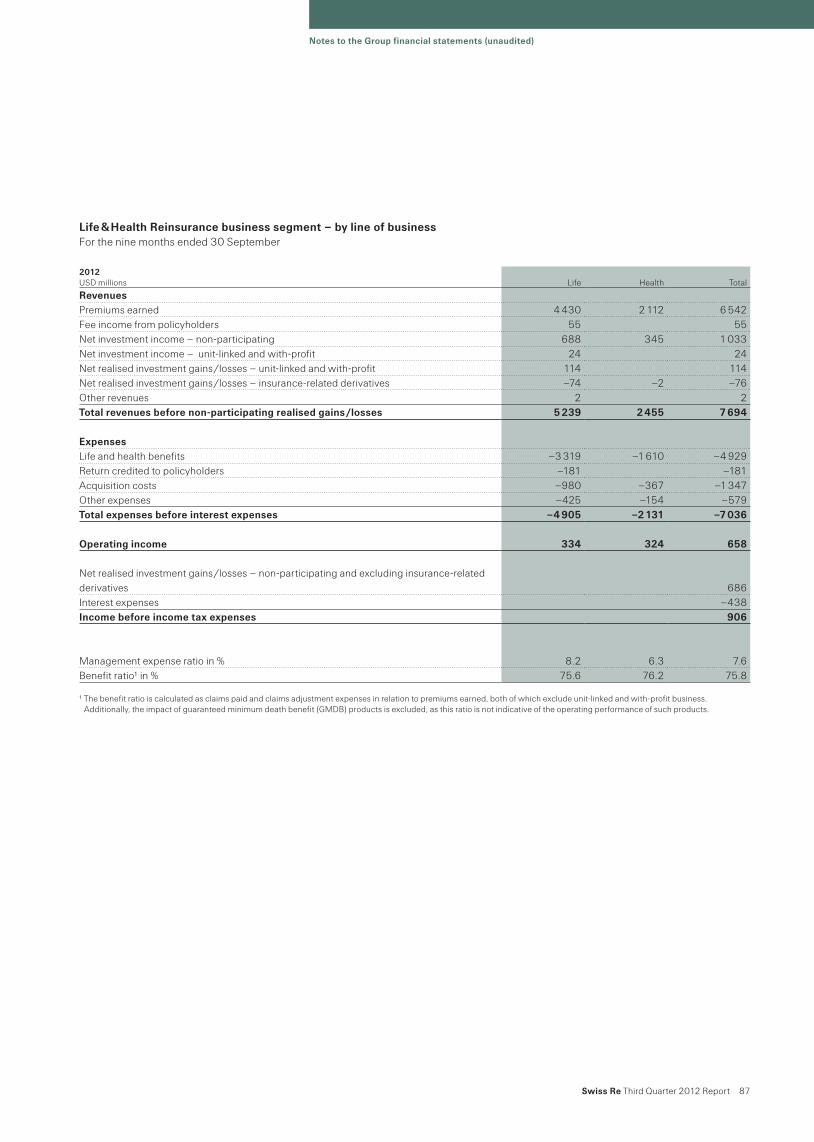
Swiss Re Third Quarter 2012 Report 87
Notes to the Group financial statements (unaudited)
2012 USD millions Life Health Total
RevenuesPremiums earned 4 430 2 112 6 542Fee income from policyholders 55 55Net investment income – non-participating 688 345 1 033Net investment income – unit-linked and with-profit 24 24Net realised investment gains /losses – unit-linked and with-profit 114 114Net realised investment gains /losses – insurance-related derivatives –74 –2 –76Other revenues 2 2Total revenues before non-participating realised gains /losses 5 239 2 455 7 694
ExpensesLife and health benefits –3 319 –1 610 –4 929Return credited to policyholders –181 –181Acquisition costs –980 –367 –1 347Other expenses –425 –154 –579Total expenses before interest expenses –4 905 –2 131 –7 036
Operating income 334 324 658
Net realised investment gains /losses – non-participating and excluding insurance-related derivatives 686Interest expenses –438Income before income tax expenses 906
Management expense ratio in % 8.2 6.3 7.6Benefit ratio1 in % 75.6 76.2 75.8
1 The benefit ratio is calculated as claims paid and claims adjustment expenses in relation to premiums earned, both of which exclude unit-linked and with-profit business. Additionally, the impact of guaranteed minimum death benefit (GMDB) products is excluded, as this ratio is not indicative of the operating performance of such products.
Life & Health Reinsurance business segment – by line of business For the nine months ended 30 September

88 Swiss Re Third Quarter 2012 Report
Notes to the Group financial statements (unaudited)
14 Variable interest entities
Swiss Re Group enters into arrangements with variable interest entities (VIEs) in the normal course of business. The involvement ranges from being a passive investor to designing, structuring and managing the VIEs. The variable interests held by the Group arise as a result of the Group’s involvement in a modified coinsurance agreement, certain insurance-linked and credit-linked securitisations, swaps in trusts, debt financing and other entities which meet the definition of a VIE.
When analysing the status of an entity, the Group mainly assesses if (1) the equity is sufficient to finance the entity’s activities without additional subordinated financial support, (2) the equity holders have the right to make significant decisions affecting the entity’s operations and (3) the holders of the voting rights substantively participate in the gains and losses of the entity. When one of these criteria is not met, the entity is considered a VIE and needs to be assessed for consolidation under the VIE section of the Consolidation Topic.
The party that has a controlling financial interest is called the primary beneficiary and consolidates the VIE. An enterprise is deemed to have a controlling financial interest if it has both of the following: ̤ the power to direct the activities of the VIE that most significantly impact the entity’s economic performance; and ̤ the obligation to absorb losses of the entity that could potentially be significant to the VIE or the right to receive benefits from the entity
that could potentially be significant to the VIE.
The Group assesses for all its variable interests in VIEs whether it has a controlling financial interest in these entities and, thus, is the primary beneficiary. For this, the Group identifies the activities that most significantly impact the entity’s performance and determines whether the Group has the power to direct those activities. In conducting the analysis, the Group considers the purpose, the design and the risks that the entity was designed to create and pass through to its variable interest holders. In a second step, the Group assesses if it has the obligation to absorb losses or if it has the right to receive benefits of the VIE that could potentially be significant to the entity. If both criteria are met, the Group has a controlling financial interest in the VIE and consolidates the entity.
Whenever facts and circumstances change, a review is undertaken of the impact these changes could have on the consolidation assessment previously performed. When the assessment might be impacted, a reassessment to determine the primary beneficiary is performed.

Swiss Re Third Quarter 2012 Report 89
Notes to the Group financial statements (unaudited)
Modified coinsurance agreementThe Group assumes insurance risk via a modified coinsurance agreement from Aurora National Life Assurance Company. Until the second quarter of 2012, Aurora National Life Assurance Company was recognised as a VIE in which the Group qualified as the primary beneficiary and consolidated the entity (for further details please refer to Annual Report 2011).
In the third quarter of 2012, a put /call option to acquire the parent of Aurora National Life Assurance Company, New California Holdings Inc., was exercised. As a result, Aurora National Life Assurance Company is wholly owned by Swiss Re and does not qualify as a VIE. The related non-controlling interests are no longer reported. Please refer to Note 6 for further information.
Insurance-linked and credit-linked securitisationsThe insurance-linked and credit-linked securitisations transfer pre-existing insurance or credit risk to the capital markets through the issuance of insurance-linked or credit-linked securities. In insurance-linked securitisations, the securitisation vehicle assumes the insurance risk through insurance or derivative contracts. In credit-linked securitisations, the securitisation vehicle assumes the credit risk through credit default swaps. The securitisation vehicle generally retains the issuance proceeds as collateral. The collateral held predominantly consists of investment-grade securities.
Typically, the variable interests held by the Group arise through ownership of insurance-linked and credit-linked securities, or through protection provided under a total return swap for the principal of the collateral held by the securitisation vehicle.
Generally, the activities of a securitisation vehicle are pre-determined at formation. There are substantially no ongoing activities during the life of the VIE that could significantly impact the economic performance of the vehicle. Consequently, the main focus to identify the primary beneficiary is on the activities performed and decisions made when the VIE was designed. Typically, the Group is considered the primary beneficiary of a securitisation vehicle when the Group acts as a sponsor of risk passed to the VIE and enters at the same time into a total return swap with the VIE to protect the VIE’s assets from market risk. Under the total return swap, the Group would incur losses if some or all of the securities held as collateral in the securitisation vehicle decline in value or default. Therefore, the Group’s maximum exposure to loss equals the principal amount of the collateral protected under the total return swap.
As of 30 September 2012, the total assets of the insurance-linked and credit-linked securitisation vehicles in which the Group holds variable interests but is not the primary beneficiary were USD 2 504 million. The total assets of the vehicles in which the Group is the primary beneficiary were USD 62 million.
Swaps in trustsThe Group provides risk management services to certain asset securitisation trusts which qualify as VIEs. As the involvement of the Group is limited to interest rate and foreign exchange derivatives, Swiss Re does not have power to direct any activities of the trusts and therefore does not qualify as primary beneficiary of any of these trusts. These activities are in run-off.
Debt financing vehiclesDebt financing vehicles issue preference shares or loan notes to provide the Group with funding. The Group is partially exposed to the asset risk by holding equity rights or by protecting some of the assets held by the VIEs via guarantees or derivative contracts. The assets held by the VIEs consist of investment-grade securities, structured products, hedge fund units, derivatives and others.
The Group consolidates certain debt financing vehicles as it has power over the investment management in the vehicles, which is considered to be the activity that most significantly impacts the entities’ economic performance. In addition, the Group absorbs the variability of the investment return so that both criteria for a controlling financial interest are met.
As of 30 September 2012, the total assets of the debt financing vehicles in which the Group holds variable interests but is not the primary beneficiary were USD 2 850 million. The total assets of the vehicles in which the Group is the primary beneficiary were USD 7 636 million.
90 Swiss Re Third Quarter 2012 Report
Notes to the Group financial statements (unaudited)
Investment vehiclesAs of 30 September 2012, this VIE category has been introduced to disclose the new VIEs resulting from the sale of Swiss Re Private Equity Partners AG (please see Note 6). Another private equity limited partnership, previously reported in the category “Other”, has been included in this category.
Investment vehicles are private equity limited partnerships, in which the Group is invested as part of its investment strategy. Typically, the Group’s variable interests arise through limited partner ownership interests in the vehicles. The Group does not own the general partners of the limited partnerships, and does not have any significant kick-out or participating rights. Therefore the Group lacks power over the relevant activities of the vehicles and, consequently, does not qualify as the primary beneficiary. The Group is exposed to losses when the values of the investments held by the vehicles decrease. The maximum exposure to loss equals the carrying amount of the ownership interest.
As of 30 September 2012, the total assets of investment vehicles in which the Group holds variable interests but is not the primary beneficiary were USD 2 306 million.
OtherThe VIEs in this category were created for various purposes. Generally, the Group is exposed to the asset risk of the VIEs by holding an equity stake in the VIE or by guaranteeing a part or the entire asset value to third-party investors. A significant portion of the Group’s exposure is either retroceded or hedged. The assets held by the VIEs consist mainly of residential real estate and other.
As of 30 September 2012, the total assets of other VIEs in which the Group holds variable interests but is not the primary beneficiary were USD 3 916 million. The total assets of the vehicles in which the Group is the primary beneficiary were USD 754 million.
The Group did not provide financial or other support to any VIEs during 2012 that it was not previously contractually required to provide.

Swiss Re Third Quarter 2012 Report 91
Notes to the Group financial statements (unaudited)
2011 2012USD millions Carrying value Whereof restricted: Carrying value Whereof restricted:
Fixed income securities available-for-sale 9 254 9 254 7 022 7 022Policy loans, mortgages and other loans 191 191Short-term investments 998 998 587 587Other invested assets 202 202 233 233Cash and cash equivalents 928 928 211 211Accrued investment income 78 78 50 50Premiums and other receivables 9 9Reinsurance recoverable on unpaid claims and policy benefits 7 7Funds held by ceding companies 2 2Income taxes recoverable 1 1Acquired present value of future profits 23 23Other assets 273 253 349 329Total assets 11 966 11 946 8 452 8 432
Carrying valueWhereof
limited recourse: Carrying valueWhereof
limited recourse:
Unpaid claims and claim adjustment expenses 15 15Liabilities for life and health policy benefits 1 165 1 165Policyholder account balances 1 365 1 365Reinsurance balances payable 5 5Deferred and other non-current taxes 180 180Short-term debt 973 973 505 505Accrued expenses and other liabilities 633 633 496 496Long-term debt 5 172 5 172 5 315 5 315Total liabilities 9 508 9 508 6 316 6 316
Consolidated VIEsThe following table shows the total assets and liabilities on the Group’s balance sheet relating to VIEs of which the Group is the primary beneficiary as of 31 December 2011 and 30 September 2012:
The above USD 11 966 million total assets as of year-end 2011 include USD 3 473 million total assets of the modified coinsurance agreement.
As of 30 September 2012, the consolidation of the VIEs resulted in non-controlling interests in the balance sheet of nil (31 December 2011: USD 414 million). The non-controlling interests in income were USD 7 million and USD 7 million net of tax for the nine months ended 30 September 2011 and 2012, respectively. All non-controlling interests were related to Aurora National Life Assurance Company, which has been fully owned by Swiss Re since the third quarter of 2012. Therefore, the non-controlling interests are no longer reported (see above under “Modified coinsurance agreement” and Note 6 for further information).

92 Swiss Re Third Quarter 2012 Report
Notes to the Group financial statements (unaudited)
Non-consolidated VIEsThe following table shows the total assets and liabilities in the Group’s balance sheet related to VIEs in which the Group held a variable interest but was not the primary beneficiary as of 31 December 2011 and 30 September 2012.
The following table shows the Group’s assets, liabilities and maximum exposure to loss related to VIEs in which the Group held a variable interest but was not the primary beneficiary as of 31 December 2011 and 30 September 2012:
The assets and liabilities for the swaps in trusts represent the positive and negative fair values of the derivatives the Group has entered into with the trusts. Liabilities are recognised for certain debt financing VIEs when losses occur. To date, the respective debt financing VIEs have not incurred any losses. Liabilities of USD 541 million recognised for the “Other” category relate mainly to collateral received.
USD millions 2011 2012
Fixed income securities:Available-for-sale 99 89Trading 20 12
Other invested assets 1 053 1 718Total assets 1 172 1 819
Short-term debt 393 390Accrued expenses and other liabilities 509 372Total liabilities 902 762
2011 2012
USD millions Total assets Total liabilities Maximum
exposure to loss
Difference between exposure
and liabilities Total assets Total liabilitiesMaximum
exposure to loss
Difference between exposure
and liabilities
Insurance-linked /credit-linked securitisations 261 1 168 1 168 228 855 855Swaps in trusts 212 316 –1 – 160 221 –1 –Debt financing 373 29 29 402 31 31Investment vehicles 802 802 802Other 326 586 1 152 566 227 541 1 736 1 195Total 1 172 902 –1 – 1 819 762 –1 –
1 The maximum exposure to loss for swaps in trusts cannot be meaningfully quantified due to their derivative character.

Swiss Re Third Quarter 2012 Report 93
Notes to the Group financial statements (unaudited)
15 Subsequent events
Hurricane Sandy, which made landfall in New Jersey on the evening of 29 October 2012 (EDT), caused high winds and storm surge, resulting in extensive flooding. Estimating claims is particularly complex due to the combined impact of prolonged power outages, disruptions to public transport and damage to other infrastructure. As a result of these factors, it is not possible to provide a reliable claims estimate at this time.

94 Swiss Re Third Quarter 2012 Report
General information
This page intentionally left blank

Swiss Re Third Quarter 2012 Report 95
Note on risk factorsGeneral impact of adverse market conditions and deterioration in global financial marketsFor much of 2012, there has been deterioration in bank funding markets, depressed volumes of capital markets activity overall, sharply higher yields on sovereign debt of Italy and Spain and significant capital outflows from banks in certain euro area countries. It remains unclear whether European Union leaders will be able to deliver on proposals reached at the end of June (around the creation of a banking union and recapitalisation of banks through direct equity injections) and whether the proposed steps (without greater integration and greater levels of supervision) will be sufficient to adequately address the sovereign debt crisis. An exit of one or more countries from the euro (and related redenomination of obligations and imposition of capital and exchange controls) cannot be ruled out. At the same time, there remains continued need for structural reforms in a number of economies and lack of consensus over the virtue and efficacy of austerity-led versus growth-led reforms.
The uncertainty around the future of the euro and the volatility in the financial and credit markets could increase the severity and duration of economic recession, cause more economic turmoil in the near term, cause further disruptions in the global financial markets and impact foreign currency exchange rates. These developments in turn could have an adverse impact on the Group’s investment results, the Group’s ability to access the capital markets and the bank funding market, the ability of counterparties to meet their obligations to the Group and the short-term outlook for the life insurance industry, particularly in North America and Europe, with a corresponding negative impact on the Group’s Life & Health business. Concerns over the stability of the euro could also have a broad effect on contractual arrangements denominated in, or otherwise tied to, the euro.
The foregoing developments could have material adverse effects on the Group’s industry and on the Group.
Regulatory changesSwiss Re and its subsidiaries are regulated in a number of jurisdictions in which they conduct business. New legislation as well as changes to existing legislation have been proposed and /or recently adopted in a number of jurisdictions that are expected to alter, in a variety of ways, the manner in which the financial services industry is regulated. Although it is difficult to predict which proposals will become law and when and how new legislation ultimately will be implemented by regulators (including in respect of the extraterritorial effect of reforms), it is likely that significant aspects of existing regulatory regimes governing financial services will change. These may include changes as to which governmental bodies regulate financial institutions, changes in the way financial institutions generally are regulated, enhanced governmental authority to take control over operations of financial institutions, restrictions on the conduct of certain lines of business, changes in the way financial institutions account for transactions and securities positions, changes in disclosure obligations and changes in the way rating agencies rate the creditworthiness and financial strength of financial institutions.

96 Swiss Re Third Quarter 2012 Report
Note on risk factors
Legislative initiatives directly impacting the Group’s industry include the establishment of a pan-European regulator for insurance companies, the European Insurance and Occupational Pension Authority, which gained its regulatory powers on 1 January 2011 and will be able to overrule national regulators in certain circumstances. In addition, Swiss Re is subject to the Swiss Solvency Test, and will be subject to Solvency II, which was expected to be transposed into law in June 2013 and become binding on insurers in January 2014, but which could be delayed to as late as 2016. In the US, as a possible step towards federal oversight of insurance, the US Congress created the Federal Insurance Office within the Department of Treasury.
Other changes are focused principally on banking institutions, but some could have direct applicability to insurance or reinsurance operations and others could have a general impact on the regulatory landscape for financial institutions, which might indirectly impact capital requirements and /or required reserve levels or have other direct or indirect effects on the Group. Changes are particularly likely to impact financial institutions designated as “systemically important”, a designation which is expected to result in enhanced regulatory supervision and heightened capital, liquidity and diversification requirements under evolving reforms. Although, to date, the focus of reforms with respect to systemically important financial institutions principally has been on banks, there is an emerging focus on insurance companies as well. Swiss Re could be designated as a global systemically important financial institution. In addition, there appears to be a trend towards a more coordinated, centralised and stricter approach to insurance regulation specifically, in both the EU and the US.
Regulatory changes may also occur in areas of broader application, such as competition policy and tax laws. Changes in tax laws could increase the taxes the Group pays, the attractiveness of products offered by the Group, the Group’s investment activities and the value of deferred tax assets. Any number of these changes could apply to the Group and its operations. These changes could increase the costs of doing business, reduce access to liquidity, limit the scope of business or affect the competitive balance, or could make reinsurance less attractive to primary insurers.
Market riskVolatility and disruption in the global financial markets can expose the Group to significant financial and capital markets risk, including changes in interest rates, credit spreads, equity prices and foreign currency exchange rates, which may adversely impact the Group’s financial condition, results of operations, liquidity and capital position. The Group’s exposure to interest rate risk is primarily related to the market price and cash flow variability associated with changes in interest rates. Exposure to credit spreads primarily relates to market price and cash flow variability associated with changes in credit spreads. When credit spreads widen, the net unrealised loss position of the Group’s investment portfolio can increase, as could other-than-temporary impairments. With respect to equity prices, the Group is exposed to changes in the level and volatility of equity prices, as they affect the value of equity securities themselves as well as the value of securities or instruments that derive their value from a particular equity security, a basket of equity securities or a stock index. The Group is also subject to equity price risk to the extent that the values of life-related benefits under certain products and life contracts, most notably variable annuity business, are tied to financial market values; to the extent market values fall, the financial exposure on guarantees related to these contracts would increase to the extent this exposure is not hedged. While the Group has discontinued writing new variable annuity business and has an extensive hedging programme covering its existing variable annuity business, certain risks cannot be hedged, including actuarial risks, basis risk and correlation risk. Exposure to foreign exchange risk arises from exposures to changes in spot prices and forward prices as well as to volatile movements in exchange rates.
Swiss Re Third Quarter 2012 Report 97
Note on risk factors
These risks can have a significant effect on investment returns and market values of securities positions, which in turn may affect both the Group’s results of operations and financial condition. The Group continues to focus on asset-liability management for its investment portfolio, but pursuing even this strategy has its risks – including possible mismatch – that in turn can lead to reinvestment risk. The Group seeks to manage the risks inherent in its investment portfolio by repositioning the portfolio from time to time, as needed, and to reduce risk and fluctuations through the use of hedges and other risk management tools. The Group has reduced risk to the portfolio by repositioning the components of the portfolio and, as a result, profitability could potentially be impacted and, unless offset by underwriting returns, reduced.
Credit riskAlthough the Group has taken significant steps to de-risk its portfolio and reposition its assets, if the credit markets were again to deteriorate and further asset classes were to be impacted, the Group could experience further losses. Changes in the market value of the underlying securities and other factors impacting their price could give rise to market value losses. If the credit markets were to deteriorate again, the Group could also face further write-downs in other areas of its portfolio, including other structured instruments, and the Group and its counterparties could once again face difficulties in valuing credit-related instruments. Differences in opinion with respect to valuations of credit-related instruments could result in legal disputes among the Group and its counterparties as to their respective obligations, the outcomes of which are difficult to predict and could be material.
Liquidity risksThe Group’s business requires, and its clients expect, that it has sufficient capital and sufficient liquidity to meet its reinsurance obligations, and that this would continue to be the case following the occurrence of any event or series of events, including extreme catastrophes, that would trigger insurance or reinsurance coverage obligations. The Group’s uses of funds include obligations arising in its reinsurance business (including claims and other payments as well as insurance provision repayments due to portfolio transfers, securitisations and commutations), which may include large and unpredictable claims (including catastrophe claims), funding of capital requirements and operating costs, payment of principal and interest on outstanding indebtedness and funding of acquisitions. The Group also enters into contracts or trading arrangements that could give rise to significant short-term funding obligations and, in connection with the Group’s trading operations, it could be subject to unexpected calls to deliver collateral or unwind trading positions at a net cost to it. The Group also has unfunded capital commitments in its private equity and hedge fund investments, which could result in funding obligations at a time when it is subject to liquidity constraints. The Group also has potential collateral requirements in connection with a number of reinsurance arrangements, the amounts of which may be material and the meeting of which could require the Group to liquidate cash equivalents or other securities.

98 Swiss Re Third Quarter 2012 Report
Note on risk factors
The Group manages liquidity and funding risks by focusing on the liquidity stress that is likely to result from extreme capital markets scenarios or from extreme loss events or combinations of the two. Generally, the ability to meet liquidity needs could be adversely impacted by factors that the Group cannot control, such as market dislocations or interruptions, adverse economic conditions, severe disruption in the financial and worldwide credit markets and the related increased constraints on the availability of credit; changes in interest rates, foreign exchange rates and credit spreads, or by perceptions among market participants of the extent of the Group’s liquidity needs.
The Group may not be able to secure new sources of liquidity or funding, should projected or actual liquidity fall below levels it requires. The ability to meet liquidity needs through asset sales may be constrained by market conditions and the related stress on valuations, and through third-party funding may be limited by constraints on the general availability of credit and willingness of lenders to lend. In addition, the Group’s ability to meet liquidity needs may also be constrained by regulatory requirements that require regulated entities to maintain or increase regulatory capital, or that restrict intra-group transactions, the timing of dividend payments from subsidiaries or the fact that certain assets may be encumbered or otherwise non-tradable. Failure to meet covenants in lending arrangements could give rise to collateral-posting or defaults, and further constrain access to liquidity. Finally, any adverse ratings action could trigger a need for further liquidity (for example, by triggering termination provisions or collateral delivery requirements in contracts to which the Group is a party) at a time when the Group’s ability to obtain liquidity from external sources is limited by such ratings action.
Counterparty risksThe Group’s general exposure to counterparty risk was heightened during the credit crisis, and this risk could still be exacerbated to the extent defaults, or concerns about possible defaults, by certain market participants trigger more systemic concerns about liquidity. Losses due to defaults by counterparties, including issuers of investment securities (which include structured securities) or derivative instrument counterparties, could adversely affect the Group. In addition, trading counterparties, counterparties under swaps and other derivative contracts, and financial intermediaries may default on their obligations due to bankruptcy, insolvency, lack of liquidity, adverse economic conditions, operational failure, fraud or other reasons, which could also have a material adverse impact on the Group.
The Group could also be adversely affected by the insolvency of, or other credit constraints affecting, counterparties in its reinsurance operations. Moreover, the Group could be adversely affected by liquidity issues at ceding companies or at third parties to whom the Group has retroceded risk, and such risk could be exacerbated to the extent any such exposures are concentrated. The Group’s most significant single counterparty risk is in respect of Berkshire Hathaway Inc., with which it has a quota share arrangement (which expires at the end of 2012), an adverse development cover and a retrocession arrangement in respect of a closed block of US individual life reinsurance business.

Swiss Re Third Quarter 2012 Report 99
Note on risk factors
Risks relating to credit rating downgradesRatings are an important factor in establishing the competitive position of reinsurance companies, and market conditions could increase the risk of downgrade. Third-party rating agencies assess and rate the financial strength of reinsurers and insurers such as Swiss Re. These ratings are intended to measure a company’s ability to repay its obligations and are based upon criteria established by the rating agencies.
The Group’s ratings reflect the current opinion of the relevant rating agencies. One or more of its ratings could be downgraded or withdrawn in the future. Rating agencies may increase the frequency and scope of ratings reviews, revise their criteria or take other actions that may negatively impact the Group’s ratings. In addition, changes to the process or methodology of issuing ratings, or the occurrence of events or developments affecting the Group, could make it more difficult for the Group to achieve improved ratings which it would otherwise have expected.
As claims paying and financial strength ratings are key factors in establishing the competitive position of reinsurers, a decline in ratings alone could make reinsurance provided by the Group less attractive to clients relative to reinsurance from competitors with similar or stronger ratings. A decline in ratings could also cause the loss of clients who are required by either policy or regulation to purchase reinsurance only from reinsurers with certain ratings. A decline in ratings could also impact the availability and terms of unsecured financing and obligate the Group to provide collateral or other guarantees in the course of its reinsurance business or trigger early termination of funding arrangements. Any rating downgrades could also have a material adverse impact on the Group’s costs of borrowing and limit its access to the capital markets. Further negative ratings action could also impact reinsurance contracts.
Legal and regulatory risksThe Group has been named, from time to time, as a defendant in various legal actions in connection with its operations. The Group is also involved, from time to time, in investigations and regulatory proceedings, certain of which could result in adverse judgments, settlements, fines and other outcomes. The number of these investigations and proceedings involving the financial services industry has increased in recent years, and the potential scope of these investigations and proceedings has also increased, not only in respect of matters covered by the Group’s direct regulators, but also in respect of compliance with broader business conduct rules, such as market abuse regulations, anti-bribery legislation, anti-money laundering legislation and trade sanctions legislation. The Group could be subject to risks arising from alleged, or actual, violations of any of the foregoing, and could also be subject to risks arising from potential employee misconduct, including non-compliance with internal policies and procedures. Substantial legal liability could materially adversely affect the Group’s business, financial condition or results of operations or could cause significant reputational harm, which could seriously harm its business.

100 Swiss Re Third Quarter 2012 Report
Note on risk factors
Insurance, operational and other risksAs part of the Group’s ordinary course of operations, the Group is subject to a variety of risks, including risks that reserves may not adequately cover future claims and benefits, risks that catastrophic events (including hurricanes, windstorms, floods, earthquakes, industrial accidents, explosions, industrial actions, fires and pandemics) may expose the Group to unexpected large losses (and related uncertainties in estimating future claims in respect of such events), changes in the insurance industry that affect ceding companies, competitive conditions, cyclicality of the industry, risks related to emerging claims and coverage issues (including, for example, trends to establish stricter building standards, which can lead to higher industry losses for earthquake cover based on higher replacement values), risks arising from the Group’s dependence on policies, procedures and expertise of ceding companies, risks related to investments in emerging markets, and risks related to the failure of operational systems and infrastructure. In addition, the occurrence of future risks that the Group’s risk management procedures fail to identify or anticipate could have a material adverse effect on the Group. Any of the foregoing, as well as other concerns in respect of the Group’s business, could also give rise to reputational risk.
Use of models; accounting mattersThe Group is subject to risks relating to the preparation of estimates and assumptions that management uses, for example, as part of its risk models as well as those that affect the reported amounts of assets, liabilities, revenues and expenses in the Group’s financial statements, including assumed and ceded business. For example, the Group estimates premiums pending receipt of actual data from ceding companies, and such actual data could deviate from the Group’s estimates. In addition, particularly with respect to large natural catastrophes, it may be difficult to estimate losses, and preliminary estimates may be subject to a high degree of uncertainty and change as new information becomes available. Deterioration in market conditions could have an adverse impact on assumptions used for financial reporting purposes, which could affect possible impairment of present value of future profits, fair value of assets and liabilities, deferred acquisition costs or goodwill. To the extent that management’s estimates or assumptions prove to be incorrect, it could have a material impact on underwriting results (in the case of risk models) or on reported financial condition or results of operations, and such impact could be material.
The Group’s results may be impacted by changes in accounting standards, or changes in the interpretation of accounting standards. The Group’s results may also be impacted if regulatory authorities take issue with any conclusions the Group may reach in respect of accounting matters. Changes in accounting standards could impact future reported results or require restatement of past reported results.

Swiss Re Third Quarter 2012 Report 101
Note on risk factors
The Group uses non-GAAP financial measures in its external reporting, including in this report. These measures are not prepared in accordance with US GAAP or any other comprehensive set of accounting rules or principles, and should not be viewed as a substitute for measures prepared in accordance with US GAAP. Moreover, these may be different from or otherwise inconsistent with non-GAAP financial measures used by other companies. These measures have inherent limitations, are not required to be uniformly applied and are not audited.
Risks related to Swiss Re’s corporate structure Swiss Re Ltd is a holding company, a legal entity separate and distinct from its subsidiaries, including Swiss Reinsurance Company Ltd. As a holding company with no operations of its own, Swiss Re Ltd is dependent upon dividends and other payments from Swiss Reinsurance Company Ltd and its other principal operating subsidiaries.

102 Swiss Re Third Quarter 2012 Report
Cautionary note on forward-looking statements
Certain statements contained herein are forward-looking. These statements (including as to plans, objectives, targets and trends) provide current expectations of future events based on certain assumptions and include any statement that does not directly relate to a historical fact or current fact.
Forward-looking statements typically are identified by words or phrases such as “anticipate”, “assume”, “believe”, “continue”, “estimate”, “expect”, “foresee”, “intend”, “may increase” and “may fluctuate” and similar expressions or by future or conditional verbs such as “will”, “should”, “would” and “could”. These forward-looking statements involve known and unknown risks, uncertainties and other factors, which may cause Swiss Re’s actual results of operations, financial condition, solvency ratios, liquidity position or prospects to be materially different from any future results of operations, financial condition, solvency ratios, liquidity position or prospects expressed or implied by such statements or cause Swiss Re to not achieve its published targets. Such factors include, among others: ̤ further instability affecting the global financial system and developments related thereto,
including as a result of concerns over, or adverse developments relating to, sovereign debt of euro area countries;
̤ further deterioration in global economic conditions; ̤ Swiss Re’s ability to maintain sufficient liquidity and access to capital markets, including
sufficient liquidity to cover potential recapture of reinsurance agreements, early calls of debt or debt-like arrangements and collateral calls due to actual or perceived deterioration of Swiss Re’s financial strength or otherwise;
̤ the effect of market conditions, including the global equity and credit markets, and the level and volatility of equity prices, interest rates, credit spreads, currency values and other market indices, on Swiss Re’s investment assets;
̤ changes in Swiss Re’s investment result as a result of changes in its investment policy or the changed composition of its investment assets, and the impact of the timing of any such changes relative to changes in market conditions;
̤ uncertainties in valuing credit default swaps and other credit-related instruments; ̤ possible inability to realise amounts on sales of securities on Swiss Re’s balance sheet
equivalent to their mark-to-market values recorded for accounting purposes; ̤ the outcome of tax audits, the ability to realise tax loss carryforwards and the ability to
realise deferred tax assets (including by reason of the mix of earnings in a jurisdiction or deemed change of control), which could negatively impact future earnings;
̤ the possibility that Swiss Re’s hedging arrangements may not be effective; ̤ the lowering or loss of financial strength or other ratings of Swiss Re companies, and
developments adversely affecting Swiss Re’s ability to achieve improved ratings; ̤ the cyclicality of the reinsurance industry; ̤ uncertainties in estimating reserves; ̤ uncertainties in estimating future claims for purposes of financial reporting, particularly
with respect to large natural catastrophes, as significant uncertainties may be involved in estimating losses from such events and preliminary estimates may be subject to change as new information becomes available;
̤ the frequency, severity and development of insured claim events; ̤ acts of terrorism and acts of war; ̤ mortality, morbidity and longevity experience; ̤ policy renewal and lapse rates; ̤ extraordinary events affecting Swiss Re’s clients and other counterparties, such as
bankruptcies, liquidations and other credit-related events; ̤ current, pending and future legislation and regulation affecting Swiss Re or its ceding
companies;

Swiss Re Third Quarter 2012 Report 103
Cautionary note on forward-looking statements
̤ legal actions or regulatory investigations or actions, including those in respect of industry requirements or business conduct rules of general applicability;
̤ changes in accounting standards; ̤ significant investments, acquisitions or dispositions, and any delays, unexpected costs or
other issues experienced in connection with any such transactions; ̤ changing levels of competition; and ̤ operational factors, including the efficacy of risk management and other internal
procedures in managing the foregoing risks.
These factors are not exhaustive. Swiss Re operates in a continually changing environment and new risks emerge continually. Readers are cautioned not to place undue reliance on forward-looking statements. Swiss Re undertakes no obligation to publicly revise or update any forward-looking statements, whether as a result of new information, future events or otherwise.
This communication is not intended to be a recommendation to buy, sell or hold securities and does not constitute an offer for the sale of, or the solicitation of an offer to buy securities in any jurisdiction, including the US. Any such offer will only be made by means of a prospectus or offering memorandum, and in compliance with applicable securities laws.

104 Swiss Re Third Quarter 2012 Report
Corporate calendar and contact informationCorporate calendar21 February 2013 2012 annual results
10 April 2013 149th Annual General Meeting
2 May 2013 First quarter 2013 results
8 August 2013 Second quarter 2013 results
7 November 2013 Third quarter 2013 results
Contact informationInvestor RelationsTelephone +41 43 285 4444Fax +41 43 282 [email protected]
Media RelationsTelephone +41 43 285 7171Fax +41 43 282 [email protected]
Share RegisterTelephone +41 43 285 6810Fax +41 43 282 [email protected]

© 2012 Swiss Re. All rights reserved.
Title:Swiss Re GroupThird Quarter 2012 Report
Production:Swiss Re Logistics Media Production, Zurich
The web version of the Third Quarter 2012 Report is available at: www.swissre.com /investors
Order no: 1504017_12_en
CCHCC, 11 /12, 2 000 en
www.multiclimate.chZertifikats-Nr.SCER-SU-56.1

Swiss Re Ltd Mythenquai 50/60 P.O. Box 8022 Zurich Switzerland
Telephone +41 43 285 2121 Fax +41 43 285 2999 www.swissre.com