third quarter 2014 results - swiss re › dam › jcr:3f971d0c-6551-4a46... · third quarter 2014...
TRANSCRIPT
Third quarter 2014 results
Analyst and investor presentation Zurich, 7 November 2014

Third quarter 2014 results
• Good contribution from all Business Units
• Group net income USD 1.2bn – Return on equity 14.8%, earnings per share USD 3.59 (CHF 3.21)
– Return on investments 3.5%
• Reinsurance net income USD 1.0bn – Strong underwriting result in P&C Re, helped by low nat cat burden
– Continued improvement in L&H Re operating margin
• Corporate Solutions grows profitably, net premiums earned +14.2%
• Admin Re® with strong gross cash generation USD 142m
• Book value per common share USD 98.27 (CHF 93.90) – Swiss Re Group SST ratio 249%1
Q3 2014 Financial highlights Strong Group performance
1 SST 2/2014 as filed with FINMA at the end of October 2014, consolidated Group view
2
Third quarter 2014 results
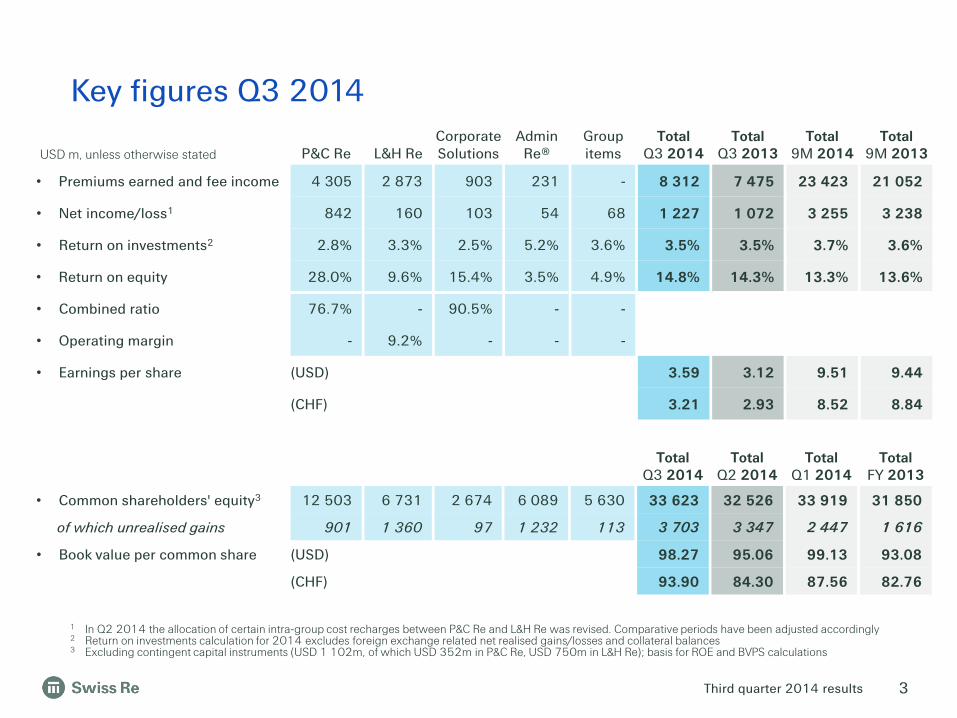
1 In Q2 2014 the allocation of certain intra-group cost recharges between P&C Re and L&H Re was revised. Comparative periods have been adjusted accordingly 2 Return on investments calculation for 2014 excludes foreign exchange related net realised gains/losses and collateral balances 3 Excluding contingent capital instruments (USD 1 102m, of which USD 352m in P&C Re, USD 750m in L&H Re); basis for ROE and BVPS calculations
Total Q3 2014
Total Q2 2014
Total Q1 2014
Total FY 2013
• Common shareholders' equity3 12 503 6 731 2 674 6 089 5 630 33 623 32 526 33 919 31 850
of which unrealised gains 901 1 360 97 1 232 113 3 703 3 347 2 447 1 616
• Book value per common share (USD) 98.27 95.06 99.13 93.08
(CHF) 93.90 84.30 87.56 82.76
3
USD m, unless otherwise stated P&C Re L&H Re Corporate Solutions
Admin Re®
Group items
Total Q3 2014
Total Q3 2013
Total 9M 2014
Total
9M 2013
• Premiums earned and fee income 4 305 2 873 903 231 - 8 312 7 475 23 423 21 052
• Net income/loss1 842 160 103 54 68 1 227 1 072 3 255 3 238
• Return on investments2 2.8% 3.3% 2.5% 5.2% 3.6% 3.5% 3.5% 3.7% 3.6%
• Return on equity 28.0% 9.6% 15.4% 3.5% 4.9% 14.8% 14.3% 13.3% 13.6%
• Combined ratio 76.7% - 90.5% - -
• Operating margin - 9.2% - - -
• Earnings per share (USD) 3.59 3.12 9.51 9.44
(CHF) 3.21 2.93 8.52 8.84
Key figures Q3 2014

Third quarter 2014 results
Combined ratio
%
Net income
USD m
Net premiums earned USD m
2013 2014
• Net impact from large nat cats in Q3 2014 was 3.0%pts, 8.8%pts below expected
• Q3 2014 benefited by 2.2%pts from prior-year net reserve releases; Q3 2013: 9.0%pts
• Adjusting for expected nat cat and prior-year development, CR is 87.7%, reflecting the release of a premium tax provision and the seasonality of nat cat premiums
P&C Reinsurance Very strong results supported by low nat cat impact
6 704 7 373
3 951 4 305
10 655 11 678
1 455 1 543
784 842
2 239 2 385
81.5% (9M: 83.6%)
76.7% (9M: 82.7%)
ROE: 25.1%
ROE: 28.0%
2013 2014
• Increase in premiums earned mainly driven by the expiry of a quota share agreement in 2012 and a large Asian transaction written at the end of 2013, partially offset by the non-renewal of a large European deal
• Gross premiums written in line with prior year
Q3 H1
9M
4
2013 2014
• Underwriting result benefited from better large loss experience, favourable prior- year development and release of a premium tax provision
• ROI of 2.8% in Q3 2014, driven by realised gains from equity sales
• Investment related net realised gains in Q3 2014 of USD 61m; Q3 2013: USD 142m

Third quarter 2014 results
1 Operating margin is calculated as operating income divided by total operating revenues
Operating margin1
%
L&H Reinsurance Improvement in operating margin continues
5 509 6 397
2 815 3 240
8 324 9 637
385
112
35
160
420
272 ROE: 5.9%
ROE: 9.6%
2013 2014
• Q3 2014 operating margin benefited from better than expected mortality experience in the Americas
• Q3 2013 included USD 121m reserve strengthening for Australia group disability business
• Q3 2014 fixed income running yield 3.7%; Q3 2013: 3.6%
5.6% (9M: 8.2%)
9.2% (9M: 8.8%)
Operating revenues USD m
Net income
USD m
Q3 H1
9M
5
2013 2014
• Q3 2014 premiums earned and fee income increased by 17%
• Increase driven by continued growth in Health business in Asia and EMEA, and a large Q1 2014 longevity transaction in the UK
2013 2014
• One transaction closed in Q3 2014 and good progress made on negotiations with clients in respect of pre-2004 US YRT business
• Common shareholders' equity increased to USD 6.7bn as a result of lower interest rates; Q3 2013: USD 5.6bn
Third quarter 2014 results
156 146
71 103
227 249
Net income
USD m
Combined ratio
%
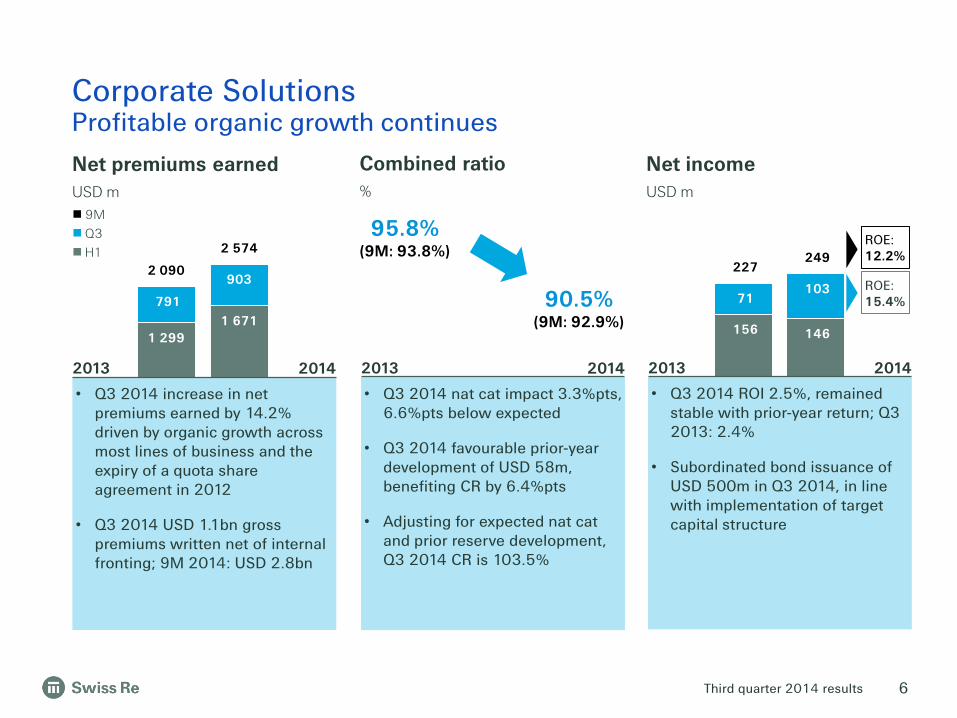
Corporate Solutions Profitable organic growth continues
1 299 1 671
791
903 2 090
2 574 ROE: 12.2%
ROE: 15.4%
95.8% (9M: 93.8%)
90.5% (9M: 92.9%)
Q3 H1
9M
2013 2014
• Q3 2014 ROI 2.5%, remained stable with prior-year return; Q3 2013: 2.4%
• Subordinated bond issuance of USD 500m in Q3 2014, in line with implementation of target capital structure
6
2013 2014
• Q3 2014 increase in net premiums earned by 14.2% driven by organic growth across most lines of business and the expiry of a quota share agreement in 2012
• Q3 2014 USD 1.1bn gross premiums written net of internal fronting; 9M 2014: USD 2.8bn
2013 2014
• Q3 2014 nat cat impact 3.3%pts, 6.6%pts below expected
• Q3 2014 favourable prior-year development of USD 58m, benefiting CR by 6.4%pts
• Adjusting for expected nat cat and prior reserve development, Q3 2014 CR is 103.5%
Net premiums earned USD m

Third quarter 2014 results
170
473
85
142
255
615
187 165
151
54
338
219
Gross cash generation1
USD m
Net income
USD m
Return on investments
%
1 Gross cash generation (GCG) is the change in excess capital over and above the target capital position
Admin Re® Strong gross cash generation
ROE: 4.9%
ROE: 3.5%
2013 2014
• Prior-year net income benefited from favourable tax impacts including tax rate reductions and a new tax regime in the UK
• Lower finance costs in Q3 2014 due to external credit facility
2013 2014
• Q3 2014 return on investments of 5.2% primarily driven by net investment income
• Q3 2014 running yield on fixed income portfolio 4.0%; Q2 2014: 4.4%; Q3 2013: 4.3%
• Net realised gains of USD 82m in Q3 2014; Q3 2013: USD 60m
5.0% (9M: 5.1%)
5.2% (9M: 5.0%)
Q3 H1
9M
2013
2014
• Strong gross cash generation in the quarter and year to date
• Positive impact of USD 92m in Q3 2014 following finalisation of UK half year statutory valuation
7

Third quarter 2014 results
Average invested assets1
USD bn, basis for ROI calculation
Group investment result Continued strong performance
Return on investments2
%
Total return2
%
111.6 116.9
2013 2014
• Increase in average invested assets driven by lower interest rates compared to Q3 2013
• Net DV01 of USD -2.6m as of Q3 2014
• Net purchases of government bonds of USD 8.6bn; net reduction in listed equities of USD 0.9bn
1 Average invested assets excludes cash management activity; 2014 also excludes collateral balances 2 2013 includes foreign exchange related net realised gains/losses, which are excluded from the return on investments and total return scope in 2014
3.5% (9M: 3.6%)
3.5% (9M: 3.7%)
flat 4.6%
(9M: -1.1%)
5.2% (9M: 7.1%)
114.8 115.3
Q3 9M
8
2013 2014
• ROI of 3.5% for Q3 2014 is driven by net investment income from fixed income and realised gains from sales of listed equities
• Q3 2014 net realised gains of USD 210m; Q3 2013: USD 194m2
• Q3 2014 impairments of USD 18m; Q3 2013: USD 20m
2013 2014
• Total return for Q3 2014 impacted by mark-to-market gains due to interest rates declining over the quarter
• Q3 2014 Group fixed income running yield 3.2%; Q2 2014: 3.5%; 9M 2014: 3.4%

Third quarter 2014 results
1 Excluding contingent capital instruments (USD 1 102m, of which USD 352m in P&C Re, USD 750m in L&H Re); basis for ROE and BVPS calculations 2 Including foreign exchange translation adjustments of USD -533m
1
1
32 526
-486 1 227
356 33 623
Common shareholders'equity
30 June 2014
Net incomeattributable to
common shareholders
Other Net change inunrealised
gains/losses
Common shareholders'equity
30 Sep 2014
Gov bonds 0.7 Corp bonds 0.0 Sec products 0.0 Equities and others -0.1 Tax -0.2 Total 0.4
2
Common shareholders' equity Q3 2014 Increase driven by net income; adverse fx effect largely offset by change in unrealised gains
9
USD m
Third quarter 2014 results
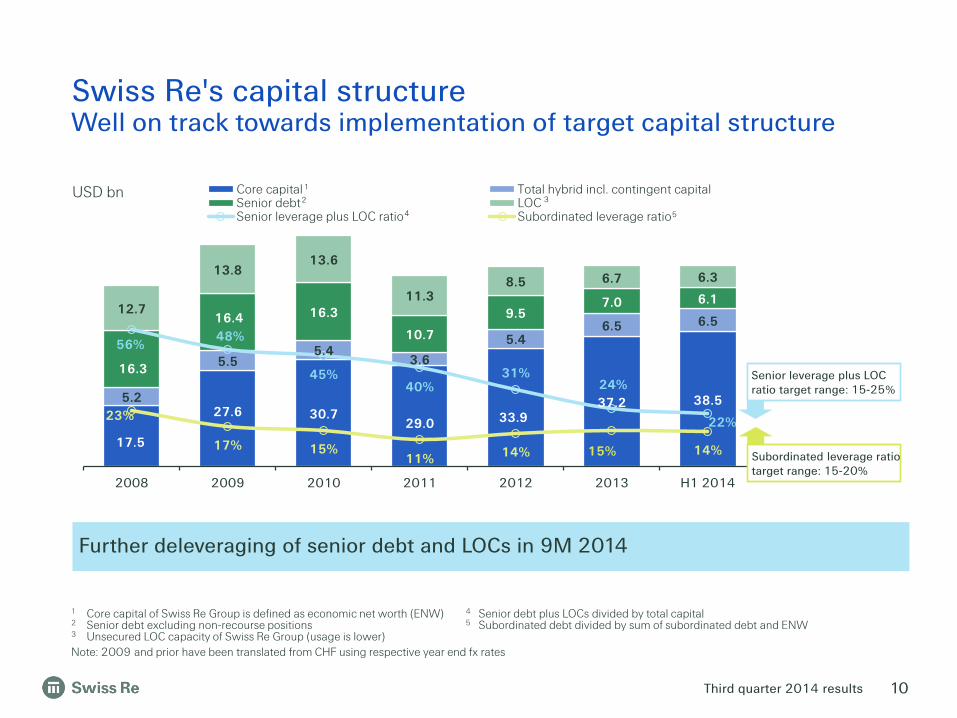
17.5
27.6 30.7 29.0 33.9
37.2 38.5 5.2
5.5 5.4
3.6
5.4 6.5 6.5
16.3
16.4 16.3
10.7
9.5 7.0 6.1
12.7
13.8 13.6
11.3 8.5 6.7 6.3
56% 48%
45% 40%
31% 24%
22% 23%
17% 15% 11% 14% 15% 14%
0%
10%
20%
30%
40%
50%
60%
70%
80%
90%
100%
2008 2009 2010 2011 2012 2013 H1 2014
Core capital Total hybrid incl. contingent capitalSenior debt LOCSenior leverage plus LOC ratio Subordinated leverage ratio
USD bn
Further deleveraging of senior debt and LOCs in 9M 2014
4 5
1
2 3
Senior leverage plus LOC ratio target range: 15-25%
Subordinated leverage ratio target range: 15-20%
1 Core capital of Swiss Re Group is defined as economic net worth (ENW) 4 Senior debt plus LOCs divided by total capital 2 Senior debt excluding non-recourse positions 5 Subordinated debt divided by sum of subordinated debt and ENW 3 Unsecured LOC capacity of Swiss Re Group (usage is lower) Note: 2009 and prior have been translated from CHF using respective year end fx rates
10
Swiss Re's capital structure Well on track towards implementation of target capital structure
Third quarter 2014 results
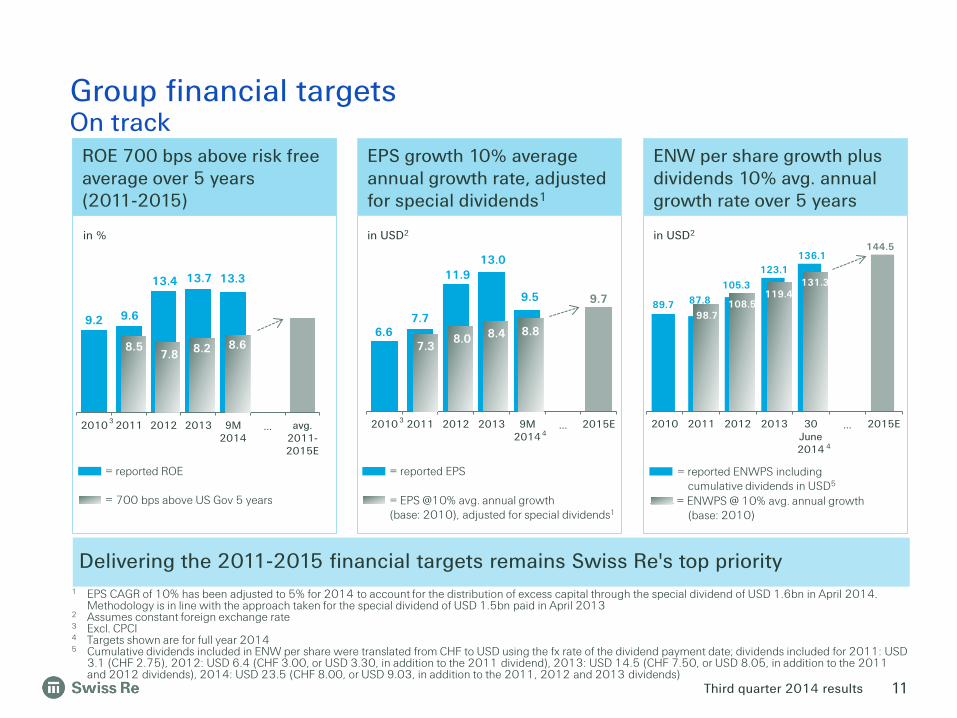
Group financial targets On track
= EPS @10% avg. annual growth (base: 2010), adjusted for special dividends1
Delivering the 2011-2015 financial targets remains Swiss Re's top priority
3
6.6 7.7
11.9 13.0
9.5 9.7
2010 2011 2012 2013 9M2014
… 2015E
in USD2
= reported EPS
EPS growth 10% average annual growth rate, adjusted for special dividends1
7.3 8.0 8.4 8.8
3
ROE 700 bps above risk free average over 5 years (2011-2015)
9.2 9.6
13.4 13.7 13.3
2010 2011 2012 2013 9M2014
… avg.2011-2015E
in %
= reported ROE
= 700 bps above US Gov 5 years
8.5 7.8 8.2 8.6
89.7 87.8
105.3
123.1 136.1
2010 2011 2012 2013 30June2014
… 2015E
= reported ENWPS including cumulative dividends in USD5
144.5
= ENWPS @ 10% avg. annual growth (base: 2010)
ENW per share growth plus dividends 10% avg. annual growth rate over 5 years
in USD2
98.7 108.5
119.4 131.3
1 EPS CAGR of 10% has been adjusted to 5% for 2014 to account for the distribution of excess capital through the special dividend of USD 1.6bn in April 2014. Methodology is in line with the approach taken for the special dividend of USD 1.5bn paid in April 2013
2 Assumes constant foreign exchange rate 3 Excl. CPCI 4 Targets shown are for full year 2014 5 Cumulative dividends included in ENW per share were translated from CHF to USD using the fx rate of the dividend payment date; dividends included for 2011: USD
3.1 (CHF 2.75), 2012: USD 6.4 (CHF 3.00, or USD 3.30, in addition to the 2011 dividend), 2013: USD 14.5 (CHF 7.50, or USD 8.05, in addition to the 2011 and 2012 dividends), 2014: USD 23.5 (CHF 8.00, or USD 9.03, in addition to the 2011, 2012 and 2013 dividends)
4
4
11
Third quarter 2014 results
Appendix
• Business segment results Q3 2014 – Income statement
• Business segment results Q3 2014 – Balance sheet
• Total equity and ROE Q3 2014
• P&C Reinsurance – Underwriting performance
• Corporate Solutions – Underwriting performance
• Return on investments (ROI)
• Overall investment portfolio
• Investment mix
• Fixed income securities
• Equities and alternative investments
• Group capitalisation
• Sustainability and Swiss Re
• Corporate calendar & contacts
• Cautionary note on forward-looking statements
12

Third quarter 2014 results
USD m Re-
insurance P&C Re L&H Re Corporate Solutions
Admin Re®
Group items
Consoli-dation
Total Q3 2014
Total Q3 2013
Total 9M 2014
Revenues Premiums earned 7 163 4 305 2 858 903 118 - - 8 184 7 349 23 044 Fee income from policyholders 15 - 15 - 113 - - 128 126 379 Net investment income/loss – non participating 643 276 367 23 307 22 7 1 002 995 3 121 Net realised investment gains/losses – non participating -26
-69
43
46 62 22 - 104 4 548
Net investment result – unit-linked and with-profit 49
- 49
- 184 - - 233 701 880
Other revenues 16 16 - 1 1 87 -94 11 2 17 Total revenues 7 860 4 528 3 332 973 785 131 -87 9 662 9 177 27 989 Expenses Claims and claim adjustment expenses -2 264 -2 264 - -513 - -1 - -2 778 -2 588 -7 896 Life and health benefits -2 214 - -2 214 - -375 - - -2 589 -2 351 -7 750 Return credited to policyholders -59 - -59 - -215 - - -274 -755 -1 037 Acquisition costs -1 398 -897 -501 -128 -37 - - -1 563 -1 255 -4 377 Other expenses -364 -143 -221 -176 -100 -79 85 -634 -848 -2 240 Interest expenses -177 -64 -113 -2 -5 -3 2 -185 -198 -564 Total expenses -6 476 -3 368 -3 108 -819 -732 -83 87 -8 023 -7 995 -23 864 Income/loss before income tax expenses 1 384 1 160 224 154 53 48 - 1 639 1 182 4 125 Income tax expense/benefit -365 -313 -52 -51 1 20 - -395 -93 -817 Net income/loss before attribution of non-controlling interests 1 019
847 172
103 54 68 - 1 244 1 089 3 308
Income attributable to non-controlling interests - - - - - - - - - -1 Net income/loss after attribution of non-controlling interests 1 019
847 172 103 54 68 - 1 244 1 089 3 307
Interest on contingent capital instruments -17 -5 -12 - - - - -17 -17 -52 Net income/loss attributable to common shareholders 1 002
842 160
103 54 68 - 1 227 1 072 3 255
Business segment results Q3 2014 Income statement
13

Third quarter 2014 results
30 September 2014, USD m Re-
insurance P&C Re L&H Re Corporate Solutions
Admin Re®
Group items
Consoli-dation
End Q3 2014
End Q2 2014
Assets
Fixed income securities 63 876 32 723 31 153 5 061 20 449 49 - 89 435 82 516 Equity securities 2 460 1 673 787 688 - 659 - 3 807 4 772 Other investments 10 963 9 329 1 634 38 1 820 6 587 -5 413 13 995 15 986 Short-term investments 12 180 7 554 4 626 2 558 1 402 243 - 16 383 20 373 Investments for unit-linked and with-profit business 947 - 947 - 25 107 - - 26 054 27 878 Cash and cash equivalents 4 803 4 625 178 647 1 326 302 - 7 078 9 690 Deferred acquisition costs 4 675 1 870 2 805 323 1 - - 4 999 5 197 Acquired present value of future profits 1 351 - 1 351 - 2 004 - - 3 355 3 646 Reinsurance recoverable 5 589 3 881 1 708 7 775 292 - -6 462 7 194 7 737 Other reinsurance assets 20 644 12 076 8 568 2 454 3 578 4 -1 882 24 798 26 581 Goodwill 3 988 1 984 2 004 17 - - - 4 005 4 122 Other 13 422 9 400 4 022 1 028 1 019 609 -6 924 9 154 10 540
Total assets 144 898 85 115 59 783 20 589 56 998 8 453 -20 681 210 257 219 038
Liabilities Unpaid claims and claim adjustments expenses 52 752 42 526 10 226 11 629 1 190 29 -6 464 59 136 61 012 Liabilities for life and health policy benefits 16 864 - 16 864 242 17 570 - -1 34 675 36 334 Policyholder account balances 1 541 - 1 541 - 28 634 - - 30 175 31 761 Other reinsurance liabilities 14 705 12 828 1 877 4 428 502 7 -2 314 17 328 19 171 Short-term debt 4 269 718 3 551 - - 568 -2 871 1 966 3 008 Long-term debt 14 320 4 609 9 711 497 888 - -615 15 090 14 747 Other 20 089 11 557 8 532 1 119 2 125 2 219 -8 412 17 140 19 350
Total liabilities 124 540 72 238 52 302 17 915 50 909 2 823 -20 677 175 510 185 383
Equity Common shareholders' equity 19 234 12 503 6 731 2 674 6 089 5 630 -4 33 623 32 526 Contingent capital instruments 1 102 352 750 - - - - 1 102 1 102 Non-controlling interests 22 22 - - - - - 22 27
Total equity 20 358 12 877 7 481 2 674 6 089 5 630 -4 34 747 33 655
Total liabilities and equity 144 898 85 115 59 783 20 589 56 998 8 453 -20 681 210 257 219 038
Business segment results Q3 2014 Balance sheet
14
Third quarter 2014 results
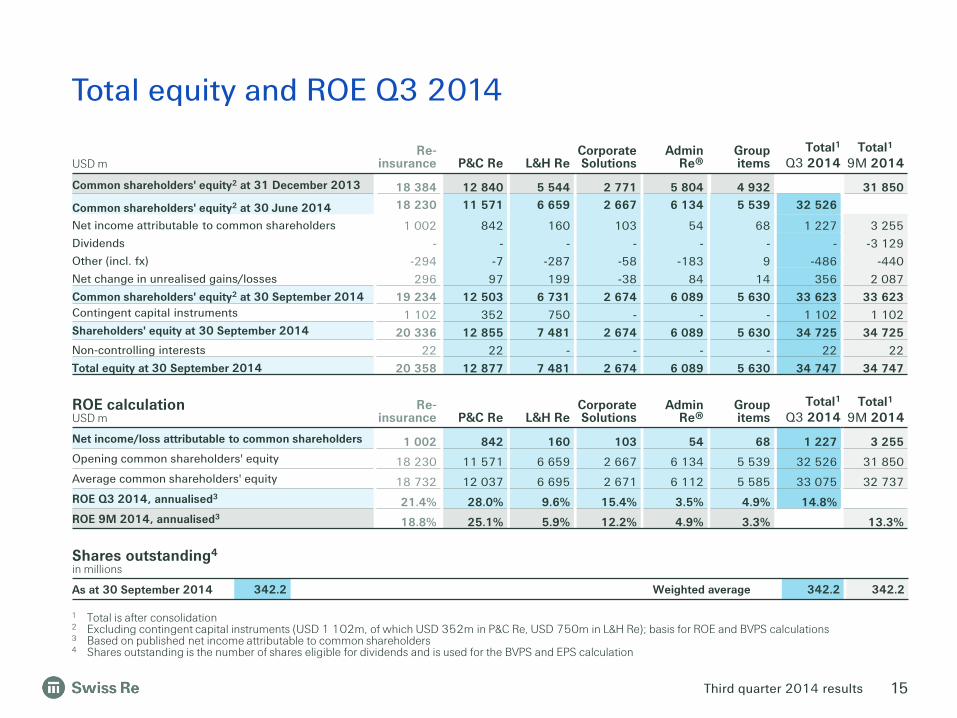
1 Total is after consolidation 2 Excluding contingent capital instruments (USD 1 102m, of which USD 352m in P&C Re, USD 750m in L&H Re); basis for ROE and BVPS calculations 3 Based on published net income attributable to common shareholders 4 Shares outstanding is the number of shares eligible for dividends and is used for the BVPS and EPS calculation
ROE calculation USD m
Re-
insurance
P&C Re L&H Re Corporate Solutions
Admin
Re® Group items
Total1 Q3 2014
Total1 9M 2014
Net income/loss attributable to common shareholders 1 002 842 160 103 54 68 1 227 3 255 Opening common shareholders' equity 18 230 11 571 6 659 2 667 6 134 5 539 32 526 31 850 Average common shareholders' equity 18 732 12 037 6 695 2 671 6 112 5 585 33 075 32 737 ROE Q3 2014, annualised3 21.4% 28.0% 9.6% 15.4% 3.5% 4.9% 14.8% ROE 9M 2014, annualised3 18.8% 25.1% 5.9% 12.2% 4.9% 3.3% 13.3%
Total equity and ROE Q3 2014
Shares outstanding4
in millions
As at 30 September 2014 342.2 Weighted average 342.2 342.2
USD m Re-
insurance P&C Re L&H Re Corporate Solutions
Admin Re®
Group items
Total1
Q3 2014 Total1
9M 2014
Common shareholders' equity2 at 31 December 2013 18 384 12 840 5 544 2 771 5 804 4 932 31 850
Common shareholders' equity2 at 30 June 2014 18 230 11 571 6 659 2 667 6 134 5 539 32 526
Net income attributable to common shareholders 1 002 842 160 103 54 68 1 227 3 255 Dividends - - - - - - - -3 129 Other (incl. fx) -294 -7 -287 -58 -183 9 -486 -440 Net change in unrealised gains/losses 296 97 199 -38 84 14 356 2 087 Common shareholders' equity2 at 30 September 2014 19 234 12 503 6 731 2 674 6 089 5 630 33 623 33 623 Contingent capital instruments 1 102 352 750 - - - 1 102 1 102 Shareholders' equity at 30 September 2014 20 336 12 855 7 481 2 674 6 089 5 630 34 725 34 725 Non-controlling interests 22 22 - - - - 22 22 Total equity at 30 September 2014 20 358 12 877 7 481 2 674 6 089 5 630 34 747 34 747
15
Third quarter 2014 results
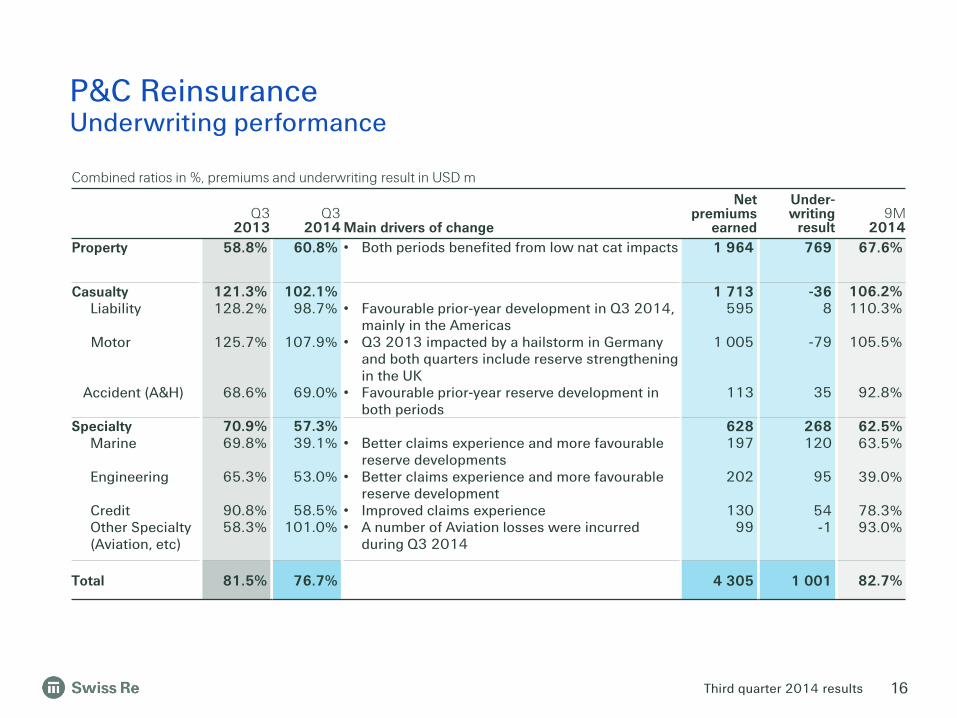
P&C Reinsurance Underwriting performance
16
Combined ratios in %, premiums and underwriting result in USD m
Q3 2013
Q3 2014 Main drivers of change
Net premiums
earned
Under-writing
result 9M
2014 Property 58.8% 60.8% • Both periods benefited from low nat cat impacts 1 964 769 67.6%
Casualty Liability Motor Accident (A&H)
121.3% 128.2%
125.7%
68.6%
102.1% 98.7%
107.9%
69.0%
• Favourable prior-year development in Q3 2014,
mainly in the Americas • Q3 2013 impacted by a hailstorm in Germany
and both quarters include reserve strengthening in the UK
• Favourable prior-year reserve development in both periods
1 713 595
1 005
113
-36 8
-79
35
106.2% 110.3%
105.5%
92.8%
Specialty Marine
Engineering Credit Other Specialty (Aviation, etc)
70.9% 69.8%
65.3%
90.8% 58.3%
57.3% 39.1%
53.0%
58.5%
101.0%
• Better claims experience and more favourable
reserve developments • Better claims experience and more favourable
reserve development • Improved claims experience • A number of Aviation losses were incurred
during Q3 2014
628 197
202
130
99
268 120
95
54 -1
62.5% 63.5%
39.0%
78.3% 93.0%
Total 81.5% 76.7% 4 305 1 001 82.7%
Third quarter 2014 results
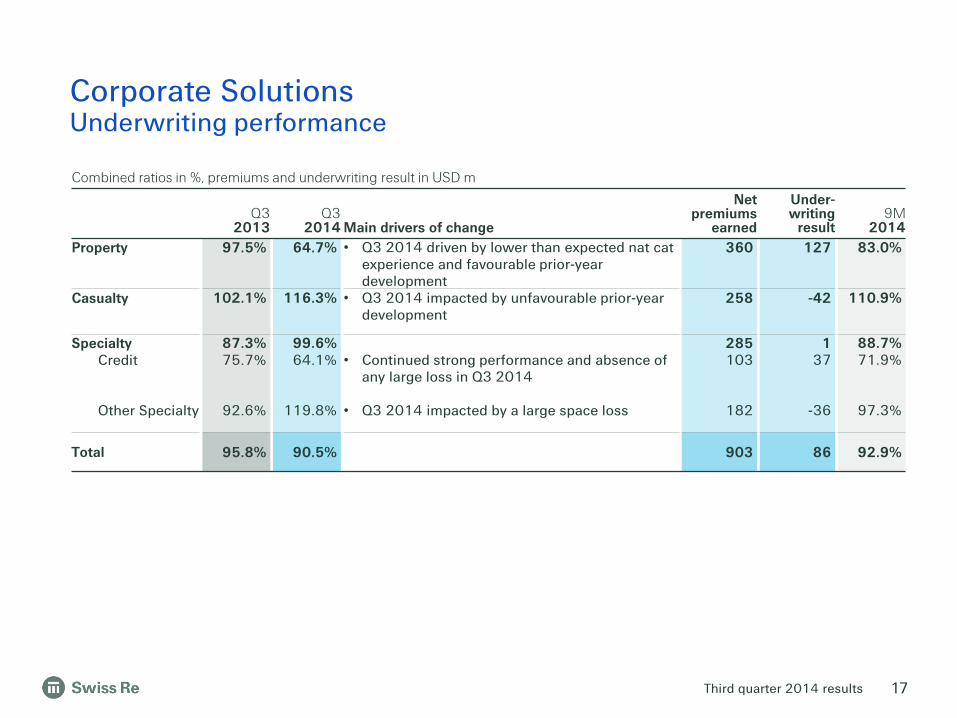
Corporate Solutions Underwriting performance
Combined ratios in %, premiums and underwriting result in USD m
Q3 2013
Q3 2014 Main drivers of change
Net premiums
earned
Under-writing
result 9M
2014 Property 97.5% 64.7% • Q3 2014 driven by lower than expected nat cat
experience and favourable prior-year development
360 127 83.0%
Casualty
102.1% 116.3% • Q3 2014 impacted by unfavourable prior-year development
258 -42 110.9%
Specialty Credit Other Specialty
87.3% 75.7%
92.6%
99.6% 64.1%
119.8%
• Continued strong performance and absence of
any large loss in Q3 2014
• Q3 2014 impacted by a large space loss
285 103
182
1 37
-36
88.7% 71.9%
97.3%
Total 95.8% 90.5% 903 86 92.9%
17
Third quarter 2014 results
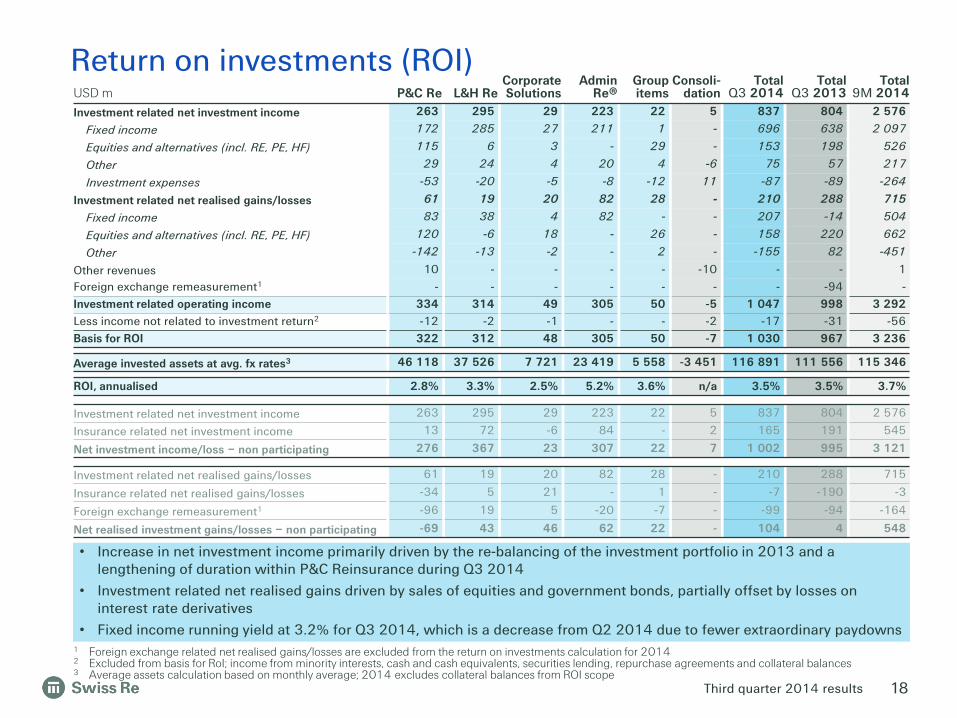
Return on investments (ROI)
1 Foreign exchange related net realised gains/losses are excluded from the return on investments calculation for 2014 2 Excluded from basis for RoI; income from minority interests, cash and cash equivalents, securities lending, repurchase agreements and collateral balances 3 Average assets calculation based on monthly average; 2014 excludes collateral balances from ROI scope
• Increase in net investment income primarily driven by the re-balancing of the investment portfolio in 2013 and a lengthening of duration within P&C Reinsurance during Q3 2014
• Investment related net realised gains driven by sales of equities and government bonds, partially offset by losses on interest rate derivatives
• Fixed income running yield at 3.2% for Q3 2014, which is a decrease from Q2 2014 due to fewer extraordinary paydowns
USD m P&C Re L&H Re Corporate Solutions
Admin Re®
Group items
Consoli-dation
Total Q3 2014
Total Q3 2013
Total 9M 2014
Investment related net investment income 263 295 29 223 22 5 837 804 2 576
Fixed income 172 285 27 211 1 - 696 638 2 097
Equities and alternatives (incl. RE, PE, HF) 115 6 3 - 29 - 153 198 526
Other 29 24 4 20 4 -6 75 57 217
Investment expenses -53 -20 -5 -8 -12 11 -87 -89 -264
Investment related net realised gains/losses 61 19 20 82 28 - 210 288 715
Fixed income 83 38 4 82 - - 207 -14 504
Equities and alternatives (incl. RE, PE, HF) 120 -6 18 - 26 - 158 220 662
Other -142 -13 -2 - 2 - -155 82 -451
Other revenues 10 - - - - -10 - - 1 Foreign exchange remeasurement1 - - - - - - - -94 - Investment related operating income 334 314 49 305 50 -5 1 047 998 3 292 Less income not related to investment return2 -12 -2 -1 - - -2 -17 -31 -56 Basis for ROI 322 312 48 305 50 -7 1 030 967 3 236
Average invested assets at avg. fx rates3 46 118 37 526 7 721 23 419 5 558 -3 451 116 891 111 556 115 346
ROI, annualised 2.8% 3.3% 2.5% 5.2% 3.6% n/a 3.5% 3.5% 3.7%
Investment related net investment income 263 295 29 223 22 5 837 804 2 576
Insurance related net investment income 13 72 -6 84 - 2 165 191 545
Net investment income/loss – non participating 276 367 23 307 22 7 1 002 995 3 121
Investment related net realised gains/losses 61 19 20 82 28 - 210 288 715
Insurance related net realised gains/losses -34 5 21 - 1 - -7 -190 -3
Foreign exchange remeasurement1 -96 19 5 -20 -7 - -99 -94 -164
Net realised investment gains/losses – non participating -69 43 46 62 22 - 104 4 548
18
Third quarter 2014 results
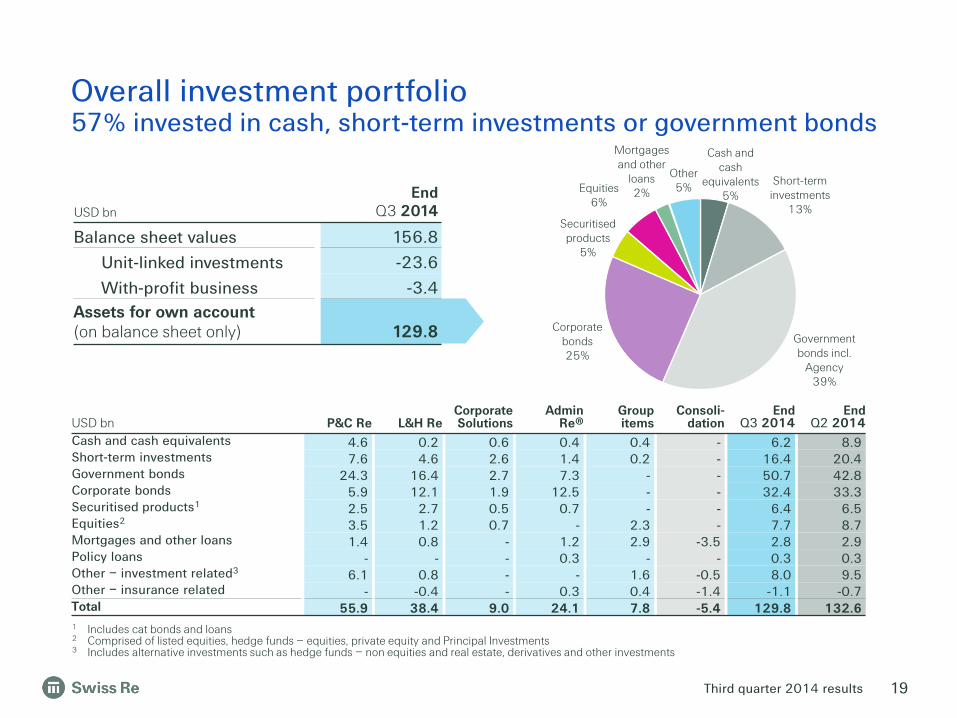
USD bn End
Q3 2014
Balance sheet values 156.8
Unit-linked investments -23.6
With-profit business -3.4 Assets for own account (on balance sheet only) 129.8
1 Includes cat bonds and loans 2 Comprised of listed equities, hedge funds – equities, private equity and Principal Investments 3 Includes alternative investments such as hedge funds – non equities and real estate, derivatives and other investments
USD bn P&C Re L&H Re Corporate Solutions
Admin Re®
Group items
Consoli-dation
End Q3 2014
End Q2 2014
Cash and cash equivalents 4.6 0.2 0.6 0.4 0.4 - 6.2 8.9 Short-term investments 7.6 4.6 2.6 1.4 0.2 - 16.4 20.4 Government bonds 24.3 16.4 2.7 7.3 - - 50.7 42.8 Corporate bonds 5.9 12.1 1.9 12.5 - - 32.4 33.3 Securitised products1 2.5 2.7 0.5 0.7 - - 6.4 6.5 Equities2 3.5 1.2 0.7 - 2.3 - 7.7 8.7 Mortgages and other loans 1.4 0.8 - 1.2 2.9 -3.5 2.8 2.9 Policy loans - - - 0.3 - - 0.3 0.3 Other – investment related3 6.1 0.8 - - 1.6 -0.5 8.0 9.5 Other – insurance related - -0.4 - 0.3 0.4 -1.4 -1.1 -0.7 Total 55.9 38.4 9.0 24.1 7.8 -5.4 129.8 132.6
Cash and cash
equivalents 5%
Short-term investments
13%
Government bonds incl.
Agency 39%
Corporate bonds 25%
Securitised products
5%
Equities 6%
Mortgages and other
loans 2%
Other 5%
Overall investment portfolio 57% invested in cash, short-term investments or government bonds
19
Third quarter 2014 results
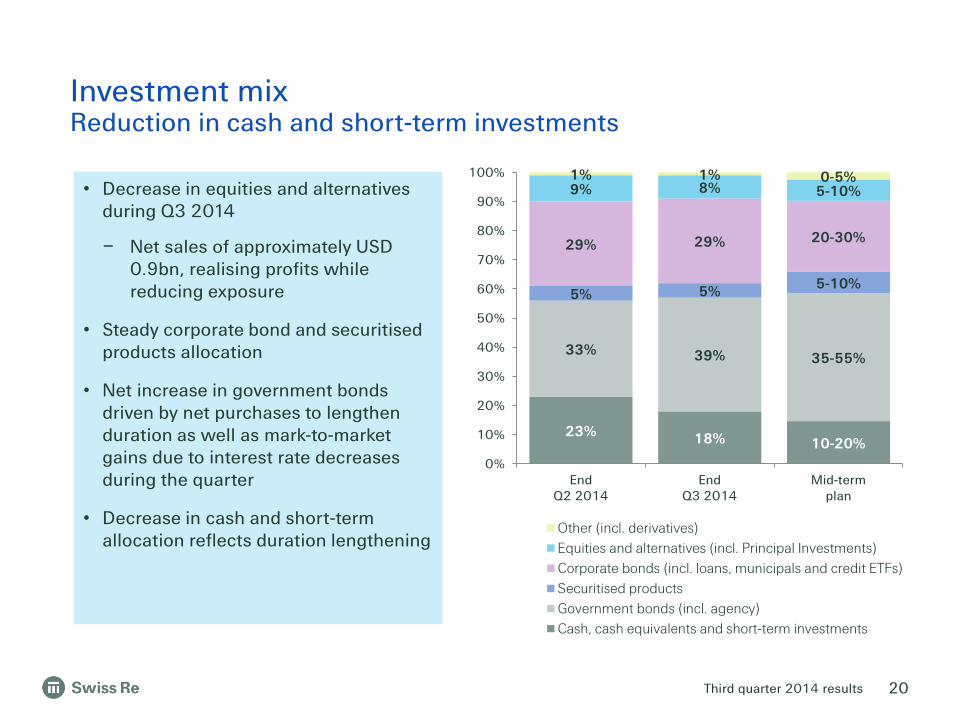
23% 18% 10-20%
33% 39% 35-55%
5% 5% 5-10%
29% 29% 20-30%
9% 8% 5-10% 1% 1% 0-5%
0%
10%
20%
30%
40%
50%
60%
70%
80%
90%
100%
EndQ2 2014
EndQ3 2014
Mid-termplan
Other (incl. derivatives)Equities and alternatives (incl. Principal Investments)Corporate bonds (incl. loans, municipals and credit ETFs)Securitised productsGovernment bonds (incl. agency)Cash, cash equivalents and short-term investments
• Decrease in equities and alternatives during Q3 2014
– Net sales of approximately USD 0.9bn, realising profits while reducing exposure
• Steady corporate bond and securitised products allocation
• Net increase in government bonds driven by net purchases to lengthen duration as well as mark-to-market gains due to interest rate decreases during the quarter
• Decrease in cash and short-term allocation reflects duration lengthening
Investment mix Reduction in cash and short-term investments
20
Third quarter 2014 results
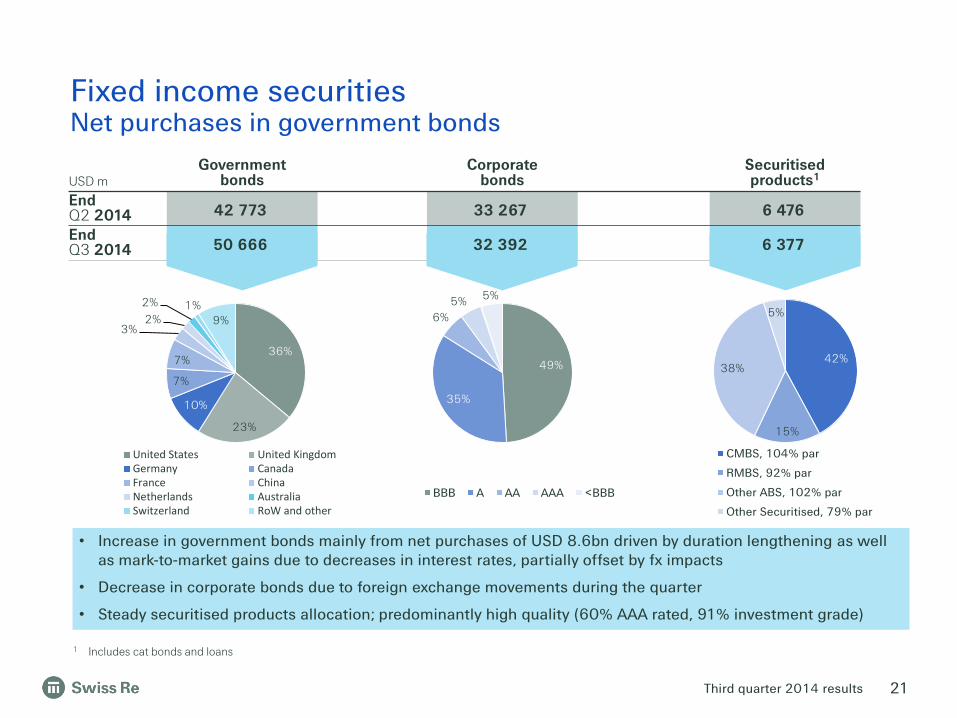
Fixed income securities Net purchases in government bonds
36%
23%
10%
7%
7%
3% 2%
2% 1% 9%
United States United KingdomGermany CanadaFrance ChinaNetherlands AustraliaSwitzerland RoW and other
1 Includes cat bonds and loans
• Increase in government bonds mainly from net purchases of USD 8.6bn driven by duration lengthening as well as mark-to-market gains due to decreases in interest rates, partially offset by fx impacts
• Decrease in corporate bonds due to foreign exchange movements during the quarter
• Steady securitised products allocation; predominantly high quality (60% AAA rated, 91% investment grade)
49%
35%
6% 5% 5%
BBB A AA AAA <BBB
42%
15%
38%
5%
CMBS, 104% par
RMBS, 92% par
Other ABS, 102% par
Other Securitised, 79% par
USD m Government
bonds Corporate
bonds Securitised products1
End Q2 2014 42 773 33 267 6 476
End Q3 2014 50 666 32 392 6 377
21

Third quarter 2014 results
66%
17%
17%
Real Estate by geography
Switzerland
Indirect Real Estate
Germany
Equities and alternative investments Listed equity reduction
USD m End
Q2 2014 End
Q3 2014
Listed Equities1 3 976 3 084
Private Equity1 1 794 1 761
Hedge Funds - equities 446 407
Principal Investments2 2 494 2 474
Total market value 8 710 7 726
USD m End
Q2 2014 End
Q3 2014
Hedge Funds – non equities 918 932
Real Estate 3 201 2 962
Total market value 4 119 3 894
Equities
Alternative investments
• Decrease in listed equities driven by net sales
• 51% of hedge funds and 69% of private equity investments are equity accounted, performance recognised through net investment income
• Decrease in real estate largely due to foreign exchange movement during the quarter
23%
20%
15%
12%
7%
6%
5%
5% 3% 3% 1%
Listed Equities by sector
Exchange-traded fundsNon-Cyclical Consumer GoodsFinancialsInformation TechnologyResourcesCyclical ServicesGeneral IndustrialsNon-Cyclical ServicesBasic IndustriesCyclical Consumer GoodsUtilities
1 Excludes Principal Investments 2 Principal Investments consists of listed equities (USD 667m) and private equity (USD 1 807m)
22
Third quarter 2014 results
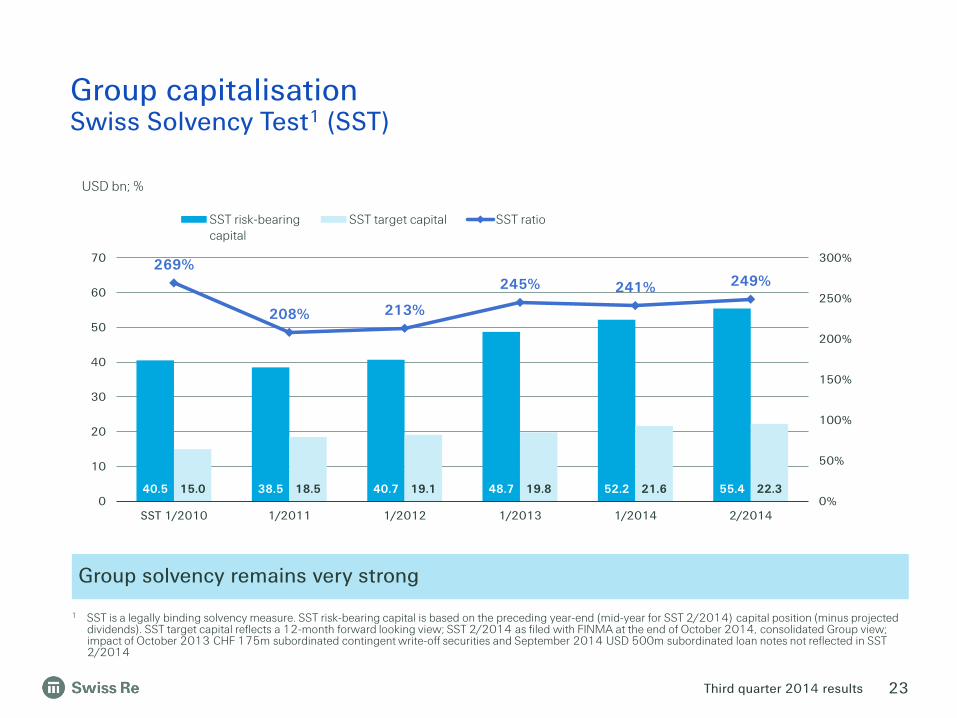
Group capitalisation Swiss Solvency Test1 (SST)
1 SST is a legally binding solvency measure. SST risk-bearing capital is based on the preceding year-end (mid-year for SST 2/2014) capital position (minus projected dividends). SST target capital reflects a 12-month forward looking view; SST 2/2014 as filed with FINMA at the end of October 2014, consolidated Group view; impact of October 2013 CHF 175m subordinated contingent write-off securities and September 2014 USD 500m subordinated loan notes not reflected in SST 2/2014
Group solvency remains very strong
40.5 38.5 40.7 48.7 52.2 55.4 15.0 18.5 19.1 19.8 21.6 22.3
269%
208% 213%
245% 241% 249%
0%
50%
100%
150%
200%
250%
300%
0
10
20
30
40
50
60
70
SST 1/2010 1/2011 1/2012 1/2013 1/2014 2/2014
SST risk-bearingcapital
SST target capital SST ratio
USD bn; %
23

Third quarter 2014 results
Sustainability and Swiss Re Taking the long-term view
• Signatory of the UN Global Compact, UN Principles for Sustainable Insurance (PSI) of the UN Environmental Programme Finance Initiative and UN Principles for Responsible Investments
• UN Climate summit, 23 Sep 2014, NY: "By the year 2020, Swiss Re commits to having advised 50 sovereigns and sub-sovereigns on climate risk resilience, and to have offered them protection of USD 10bn against this risk"
• Swiss Re's proprietary Sustainability Risk Framework implements an integrated approach to identify, assess and control the Group's risk exposure with respect to environmental, social and ethical issues
• Swiss Re named as the insurance sector leader in the 2014 Dow Jones Sustainability Indices. Swiss Re has led the insurance sector in these rankings eight times since 2004
24
We generate value for shareholders and contribute to sustainable economies in the future
Third quarter 2014 results
Investor Relations contacts Hotline E-mail +41 43 285 4444 [email protected] Ross Walker Chris Menth +41 43 285 2243 +41 43 285 3878
Simone Lieberherr Simone Fessler +41 43 285 4190 +41 43 285 7299
Corporate calendar & contacts
Corporate calendar 2015 19 February Annual Results 2014 Conference call 18 March Publication of Annual Report 2014 and EVM 2014 21 April 151st Annual General Meeting Zurich 30 April First Quarter 2015 Results Conference call 30 July Second Quarter 2015 Results Conference call
25

Third quarter 2014 results
Cautionary note on forward-looking statements Certain statements and illustrations contained herein are forward-looking. These statements (including as to plans objectives, targets and trends) and illustrations provide current expectations of future events based on certain assumptions and include any statement that does not directly relate to a historical fact or current fact. Forward-looking statements typically are identified by words or phrases such as “anticipate“, “assume“, “believe“, “continue“, “estimate“, “expect“, “foresee“, “intend“, “may increase“ and “may fluctuate“ and similar expressions or by future or conditional verbs such as “will“, “should“, “would“ and “could“. These forward-looking statements involve known and unknown risks, uncertainties and other factors, which may cause Swiss Re’s actual results of operations, financial condition, solvency ratios, liquidity position or prospects to be materially different from any future results of operations, financial condition, solvency ratios, liquidity position or prospects expressed or implied by such statements or cause Swiss Re to not achieve its published targets. Such factors include, among others:
• further instability affecting the global financial system and developments related thereto;
• deterioration in global economic conditions; • Swiss Re’s ability to maintain sufficient liquidity and access to capital markets,
including sufficient liquidity to cover potential recapture of reinsurance agreements, early calls of debt or debt-like arrangements and collateral calls due to actual or perceived deterioration of Swiss Re’s financial strength or otherwise;
• the effect of market conditions, including the global equity and credit markets, and the level and volatility of equity prices, interest rates, credit spreads, currency values and other market indices, on Swiss Re’s investment assets;
• changes in Swiss Re’s investment result as a result of changes in its investment policy or the changed composition of its investment assets, and the impact of the timing of any such changes relative to changes in market conditions;
• uncertainties in valuing credit default swaps and other credit-related instruments; • possible inability to realise amounts on sales of securities on Swiss Re’s balance
sheet equivalent to their mark-to-market values recorded for accounting purposes; • the outcome of tax audits, the ability to realise tax loss carryforwards and the
ability to realise deferred tax assets (including by reason of the mix of earnings in a jurisdiction or deemed change of control), which could negatively impact future earnings;
• the possibility that Swiss Re’s hedging arrangements may not be effective; • the lowering or loss of one of the financial strength or other ratings of one or more
Swiss Re companies, and developments adversely affecting Swiss Re’s ability to achieve improved ratings;
• the cyclicality of the reinsurance industry; • uncertainties in estimating reserves; • uncertainties in estimating future claims for purposes of financial reporting,
particularly with respect to large natural catastrophes, as significant uncertainties may be involved in estimating losses from such events and preliminary estimates may be subject to change as new information becomes available;
• the frequency, severity and development of insured claim events; • acts of terrorism and acts of war; • mortality, morbidity and longevity experience; • policy renewal and lapse rates; • extraordinary events affecting Swiss Re’s clients and other counterparties,
such as bankruptcies, liquidations and other credit-related events; • current, pending and future legislation and regulation affecting Swiss Re or its
ceding companies, and the interpretation of legislation or regulations by regulators;
• legal actions or regulatory investigations or actions, including those in respect of industry requirements or business conduct rules of general applicability;
• changes in accounting standards; • significant investments, acquisitions or dispositions, and any delays,
unexpected costs or other issues experienced in connection with any such transactions;
• changing levels of competition; and • operational factors, including the efficacy of risk management and other
internal procedures in managing the foregoing risks.
These factors are not exhaustive. Swiss Re operates in a continually changing environment and new risks emerge continually. Readers are cautioned not to place undue reliance on forward-looking statements. Swiss Re undertakes no obligation to publicly revise or update any forward-looking statements, whether as a result of new information, future events or otherwise. This communication is not intended to be a recommendation to buy, sell or hold securities and does not constitute an offer for the sale of, or the solicitation of an offer to buy, securities in any jurisdiction, including the United States. Any such offer will only be made by means of a prospectus or offering memorandum, and in compliance with applicable securities laws.
26