sustainable water management handbook for · pdf filecalifornia sustainable winegrowing...
TRANSCRIPT

benefiting the environment, the community, and high quality grapes and wine
CALIFORNIA SUSTAINABLE WINEGROWING ALLIANCE
SUSTAINABLE WATER MANAGEMENT HANDBOOK FOR SMALL WINERIESAPRIL 2014

www.sustainablewinegrowing.org April 2014 | 2
Introduction . . . . . . . . . . . . . . . . . . . . . . . . . . . . . . . . . . . . . . . . . . . . . . . . . . . . . . . . . . . . . . . . . . . . . . . . . . . . . . . . . . . 3
THE STEPSStep 1 - Planning and Organization . . . . . . . . . . . . . . . . . . . . . . . . . . . . . . . . . . . . . . . . . . . . . . . . . . . 4Step 2 - Winery Self-Assessment . . . . . . . . . . . . . . . . . . . . . . . . . . . . . . . . . . . . . . . . . . . . . . . . . . . . . . 6Step 3 - Data Evaluation and Option Identification . . . . . . . . . . . . . . . . . . . . . . . . . . . . . . 8Step 4 - Feasibility Analysis . . . . . . . . . . . . . . . . . . . . . . . . . . . . . . . . . . . . . . . . . . . . . . . . . . . . . . . . . . . . .10Step 5 - Program Implementation . . . . . . . . . . . . . . . . . . . . . . . . . . . . . . . . . . . . . . . . . . . . . . . . . . . .11
APPENDIXAppendix A - Data Collection Sheets
Background Information . . . . . . . . . . . . . . . . . . . . . . . . . . . . . . . . . . . . . . . . . . . . . . . . . . . . . . . . . . . . . .12Water In and Water Out information . . . . . . . . . . . . . . . . . . . . . . . . . . . . . . . . . . . . . . . . . . . . .13Inventory of Water Using and Process Water Generating Activities . . . . . . .14Example Calculations / Barrel Program . . . . . . . . . . . . . . . . . . . . . . . . . . . . . . . . . . . . . . . . . . .15Chemical Inventory . . . . . . . . . . . . . . . . . . . . . . . . . . . . . . . . . . . . . . . . . . . . . . . . . . . . . . . . . . . . . . . . . . . . .21Equipment Associated with Water Management . . . . . . . . . . . . . . . . . . . . . . . . . . . . . . .22Focusing the Data . . . . . . . . . . . . . . . . . . . . . . . . . . . . . . . . . . . . . . . . . . . . . . . . . . . . . . . . . . . . . . . . . . . . . . .23Possible Water Efficiency & Source Control Measures . . . . . . . . . . . . . . . . . . . . . . .24Action Plan . . . . . . . . . . . . . . . . . . . . . . . . . . . . . . . . . . . . . . . . . . . . . . . . . . . . . . . . . . . . . . . . . . . . . . . . . . . . . . .25
Appendix B - Case StudiesCooper-Garrod Case Study . . . . . . . . . . . . . . . . . . . . . . . . . . . . . . . . . . . . . . . . . . . . . . . . . . . . . . . . . .26Alpha Omega Case Study . . . . . . . . . . . . . . . . . . . . . . . . . . . . . . . . . . . . . . . . . . . . . . . . . . . . . . . . . . . . .29
Appendix C - Applicable Sections of the Full Guide . . . . . . . . . . . . . . . . . . . . . . . . . . .31
TABLE OF CONTENTS
SUSTAINABLE WATER MANAGEMENT HANDBOOK FOR SMALL WINERIES
www.sustainablewinegrowing.org April 2014 | 3
This sustainable water management handbook for small wineries (Handbook) provides a set of tools for wineries to achieve goals for sustainable management of winery source water and process water, with the ancillary benefits of increasing energy efficiency and reducing greenhouse gas generation. The Handbook is based upon the approach described in a full guide, The Comprehensive Guide to Sustainable Management of Winery Water and Associated Energy (the Guide), but tailored to reflect a small production environment that uses water intermittently and has a small staff.
The full Guide was prepared on behalf of the American Vineyard Foundation (AVF), Wine Institute (Wine Institute), and Pacific Gas & Electric Company (PG&E) with support and guidance from the National Grape and Wine Initiative (NGWI). The guidelines and appendices are based on several decades of research in the areas of winery water efficiency, cleaning and sanitation practices, source control, process water treatment, land application, and a host of other winery-specific topics. The full document including all appendices is available online at no cost from Wine Institute at: http://www.wineinstitute.org/winerywaterguide.
We would like to thank the California Department of Food and Agriculture for a Specialty Crop Block Grant that made the development of this Handbook possible.
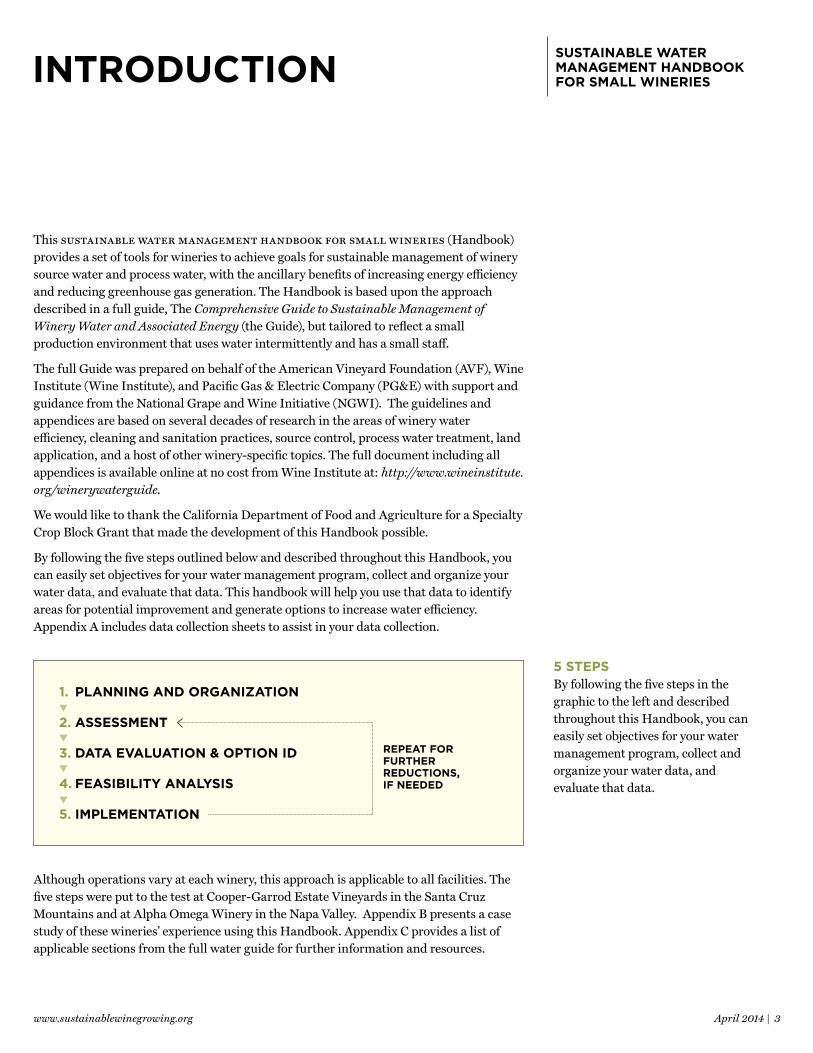
By following the five steps outlined below and described throughout this Handbook, you can easily set objectives for your water management program, collect and organize your water data, and evaluate that data. This handbook will help you use that data to identify areas for potential improvement and generate options to increase water efficiency. Appendix A includes data collection sheets to assist in your data collection.
Although operations vary at each winery, this approach is applicable to all facilities. The five steps were put to the test at Cooper-Garrod Estate Vineyards in the Santa Cruz Mountains and at Alpha Omega Winery in the Napa Valley. Appendix B presents a case study of these wineries’ experience using this Handbook. Appendix C provides a list of applicable sections from the full water guide for further information and resources.
INTRODUCTION
1. PLANNING AND ORGANIZATION
2. ASSESSMENT
3. DATA EVALUATION & OPTION ID
4. FEASIBILITY ANALYSIS
5. IMPLEMENTATION
REPEAT FOR FURTHER REDUCTIONS, IF NEEDED
5 STEPSBy following the five steps in the graphic to the left and described throughout this Handbook, you can easily set objectives for your water management program, collect and organize your water data, and evaluate that data.
SUSTAINABLE WATER MANAGEMENT HANDBOOK FOR SMALL WINERIES

www.sustainablewinegrowing.org April 2014 | 4
This first step helps you establish goals for your water and process water management program and helps the entire organization agree on those goals. Doing so ensures that the entire facility is working together and will share in the program achievements.
1.1 SEEK MANAGEMENT COMMITMENTSuccess of a water conservation and process water management program hinges on the commitment of the owner or management team. In general, wineries are receptive to practices that minimize environmental impacts and reduce costs.
POSSIBLE GOALS FOR IMPROVING WATER USE EFFICIENCY
financial manager wonders why utility bills fluctuate
➜ save money; reduce budget variance
owner wants to be considered ‘green’ ➜
develop marketing material that documents achievements; site water security; assist in long-term sustainability of the watershed
cellar master feels the facility uses water efficiently
➜quantify successes and reward employees
winemaker won’t compromise quality ➜ maintain quality
1.2 DEFINE ASSESSMENT PROGRAM OBJECTIVESThe goals of the assessment program will be specific to each winery, and will depend in part on the winery’s initial understanding of their water use and the associated energy. Some wineries may have previously collected data on their operations while other wineries have not yet started data collection.
Potential objectives for a winery with no initial data
| Develop a baseline water balance for the facility (see case study on page 26 for example).
| Collect data to identify largest water using activities and waste generators.
| Determine which winery process or activity contributes the greatest amount of constituents to process water.
Potential objectives for a winery with data
| Centralize data in a way that it can be used to make informed decisions to reduce water use and improve source control.
| Determine what percentage of energy use (electricity, propane, natural gas) is associated with managing water.
STEP 1PLANNING AND ORGANIZATION
SUSTAINABLE WATER MANAGEMENT HANDBOOK FOR SMALL WINERIES
1. PLANNING AND ORGANIZATION
2. ASSESSMENT 3. DATA EVALUATION & OPTION ID
4. FEASIBILITY ANALYSIS
5. IMPLEMENTATION

www.sustainablewinegrowing.org April 2014 | 5
1.3 ORGANIZE IMPLEMENTATION TEAMIt is likely that the entire staff will be involved in the assessment tasks including the cellar workers, winemaker, owners, and financial managers. However, there are specific roles to be considered:
| Who will collect, consolidate and evaluate the data?
| Who will provide input on current practices and the feasibility of proposed changes?
| Who will evaluate costs associated with current practices and the costs of potential modifications?
| Who has authority to approve assessment costs as well as capital and operating costs associated with potential modifications?
STEP 1 PLANNING AND ORGANIZATION (CONTINUED)
SUSTAINABLE WATER MANAGEMENT HANDBOOK FOR SMALL WINERIES
www.sustainablewinegrowing.org April 2014 | 6
During this step, you will compile and evaluate existing data on water uses and process water sources and associated energy and identify additional information you may need to collect.
2.1 COMPILE EXISTING FACILITY DATAYou may already have some or all of the data needed for the assessment. The Data Collection Sheets contained in this handbook (in Appendix A starting on page 12) are provided to help centralize existing data. Reviewing and completing the Data Collection Sheets #1 to #5 (described below) will help you become familiar with the flow data (quantity and quality) that you may want to collect. Using this information, you can then develop your own worksheet that itemizes water activities, calculates their flows, and estimates their constituent contributions. See the attached case studies in Appendix B that describe how the Cooper-Garrod and Alpha Omega wineries collected data and developed worksheets.
Fill out Data Collection Sheet #1 (Background Information) and calculate the gallons of wine produced per gallon of process water generated. This ratio provides a quick benchmark to determine the water efficiency of your facility. Gallon of wine produced is the combined total of tons processed, wine received, and juice received. Alternatively, you can use the total of cases bottled and wine/juice shipped offsite. In either case, be consistent in which data you use to calculate the ratio from year to year.
Collect the data identified in Data Collection Sheet #2 (Water In and Water Out information). Not all may be readily available. The purpose of Sheet #2 is to reinforce the understanding of the volume and quality of water coming into the facility and the volume and quality of process water leaving the facility.
Data Collection Sheet #3 (Inventory of Water Using and Process Water Generating Activities) is provided to help identify the relevent activities that occur in your winery. While completing this sheet, consider how much water each process uses and the volume of chemicals you add during that process:
| For example, an activity that uses 20 gallons of water per minute for 2 minutes uses a total of 40 gallons per task. If 100 of these tasks are performed each year, the total annual water use for this activity is 4,000 gallons.
| Use the table titled “Reference Water Use Rates for Typical Equipment” (Appendix A, page 17) to help estimate how much water certain equipment uses.
Data Collection Sheet #4 (Chemical Inventory) will help confirm which activities use the greatest volume of chemicals and the total loading (pounds per year) of those chemicals. Note that this list does not include the contribution from the grapes themselves which increases the Biochemical Oxygen Depand (BOD) of the process water.
Data Collection Sheet #5 (Equipment Associated with Water Management) is designed to help identify equipment used to acquire, treat, move, and/or dispose of process water. This equipment will use electricity, natural gas, propane, or fuel oil. Once the equipment has been identified, try to estimate the amount of energy the equipment uses and the cost of that energy.
PROCESS WATER-TO-WINE RATIO: For small and midsize wineries, a typical ratio is 3-6. However, it is not unusual for wineries to have a lower ratio. If your ratio is above 10, you likely have opportunities to improve your water use efficiency.
Data Collection Sheet #1 helps you calculate your process water-to-wine ratio.
SUSTAINABLE WATER MANAGEMENT HANDBOOK FOR SMALL WINERIES
STEP 2 WINERY SELF-ASSESSMENT
1. PLANNING AND ORGANIZATION
2. ASSESSMENT 3. DATA EVALUATION & OPTION ID
4. FEASIBILITY ANALYSIS
5. IMPLEMENTATION

www.sustainablewinegrowing.org April 2014 | 7
Additional guidance on collecting information is given in the full Guide. Appendix C of this Handbook shows which sections in the full Guide are relevant for collecting data.
After conducting the inventories and reviewing available information, most wineries will discover they need to collect additional information to gain a full understanding of (1) where water use is the greatest in the winery and (2) the relative contribution of various winery activities to process water, in terms of both volume and constituent concentrations.
2.2 COLLECT ADDITIONAL INFORMATIONAlthough there are cost/benefit considerations in collecting additional data, a more complete data set will provide a basis for selecting optimal water conservation and waste minimization strategies. It will also be needed for measuring the effectiveness of changes that the winery implements to improve water use efficiencies.
Appendix C of this Handbook shows which sections in the full Guide may be helpful to you in completing this Step (Step 2 – Self Assessment). For example, if you want to collect additional data, guidance on sampling strategies to characterize process water for the following activities are presented in Section 2.2 of the full Guide:
| Crushing and Pressing Operations
| Tank Washing
| Plate and Frame Filter Cleaning
| Filter Sanitation
| Centrifuges/Decanters
| Barrel Washing
| Bottling
| Spent Water Softener Regenerant
| Boiler Water Blowdown
| Cooling Tower Blowdown
| Evaporative Condenser Bleed
| Total Effluent
STEP 2 WINERY SELF-ASSESSMENT (CONTINUED)
SUSTAINABLE WATER MANAGEMENT HANDBOOK FOR SMALL WINERIES
WHY CHARACTERIZE PROCESS WATER QUALITY? In order to identify opportunities to improve process water treatment, you will need information on both the volume of process water and the quality of that water. For example, tank washing may represent a higher percentage of total winery water use compared to barrel washing. However, barrel washing contributes significantly more to the Biochemical Oxygen Demand (BOD) levels in process water. By focusing solely on reducing water used during tank washing, the quality of the process water leaving the facility might not improve. If the goal is to reduce cost, energy, and maintenance of treating and disposing of process water, quality needs to be addressed.
www.sustainablewinegrowing.org April 2014 | 8
During this step, you will evaluate the data collected during the previous step. While collecting and evaluating the data, you should consider the goals you established during Step 1. Keeping your objectives at the forefront will help you focus your evaluation. For example, will your evaluation identify those winery activities that use the greatest amount of water; those activities that contribute the most constituents to process water; or possibly both?
3.1 REVIEW DATAThe insights gained from evaluating the data will improve with the quantity and quality of information collected during Step 2. In addition, the likelihood of identifying the best options for source reduction increases with better information. Although wineries are encouraged to collect as much analytical data as is feasible, this Handbook also recognizes that some wineries might not have the resources to collect the flow measurements and characterization data.
Data Collection Sheet #6 (Focusing the Data) is provided to help you evaluate the data that has been collected and compiled thus far and where additional review may be necessary.
3.2 GENERATE OPTIONS FOR SOURCE REDUCTION, RECYCLING, OR TREATMENTImprovement options that reduce the amount of source materials in process water is preferred over treatment options that require energy input and may have other potential impacts. In other words, it’s preferable to not generate the waste in the first place than to apply the energy to treat it.
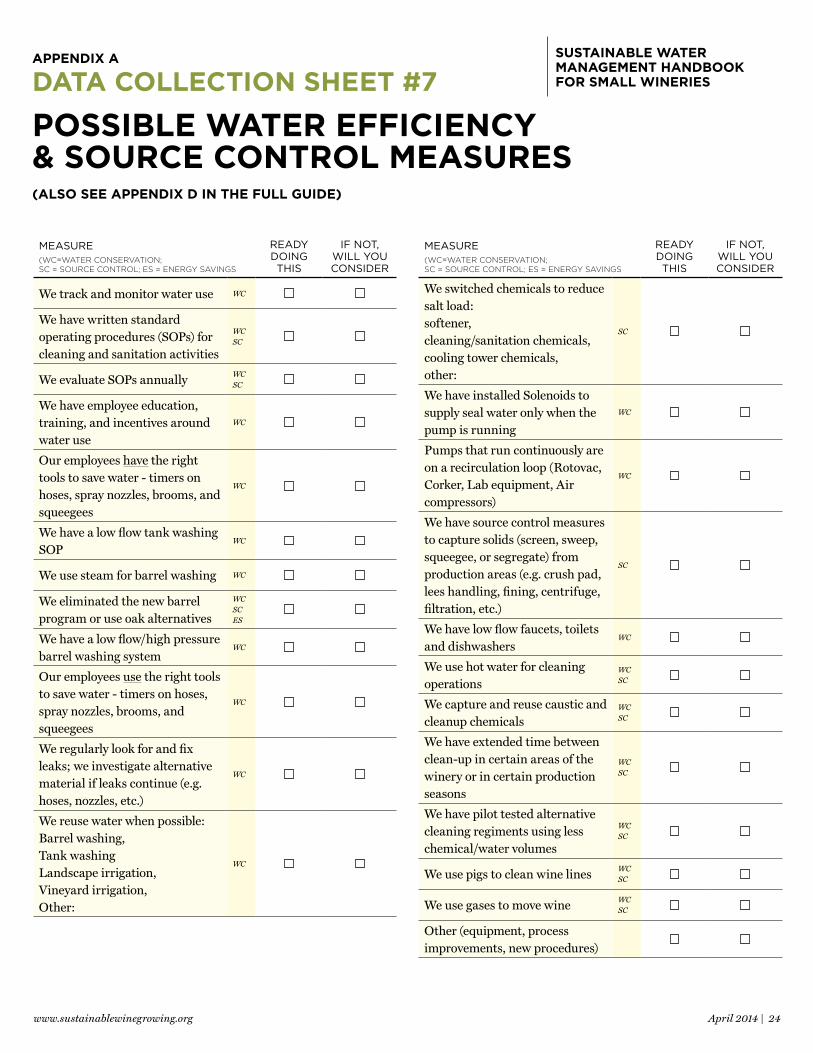
Data Collection Sheet #7 lists over twenty possible water efficiency & source control measures. The measures include those that reduce solids, salts, and other constituents from entering the process water. For additional examples of potential options used by wineries, such as product substitution, reuse, good housekeeping techniques, and conservation strategies see Appendix D in the full Guide.
Note that the Environmental Protection Agency (EPA) also defines source reduction and recycling as two branches under the umbrella of waste minimization. Thus, it is useful to categorize process water streams into three reuse types, based on the chemical characterization results:
1. Relatively clean and can be reused without treatment
2. Can be reused after limited treatment
3. Requires full treatment and/or disposal
The table in Data Collection Sheet #6 (Focusing the Data) can help with this categorization of waste streams. After categories are assigned, the volume of process water in each category can be totaled to help frame the requirements for an improvement option. The best way to begin to identify options is to hold a brainstorming session with
HIGH WATER USING ACTIVITIES: Although every winery is different there are a few areas that typically contribute to a majority of the water use:
| tank cleaning and sanitation
| barrel cleaning and sanitation
| bottle sterilization
| vacuum pumps
| pushing wine
In addition, 30 to 50% of a winery’s annual water use typically occurs during the 60 days of harvest.
SOURCES OF SOLIDS: Solids contribute to the BOD loading in process water and often Publically Owned Treatment Works (POTWs) charge dischargers extra fees for high levels of BOD (and/or solids). Once in the process water stream, solids can accumulate, putrify, and require a significant amount of energy to treat. Primary sources of solids include:
| crush pad
| barreling
| lees handling
| fining
| filtration
| centrifuge
Data Collection Sheet #4 helps you identify which activity in the winery may contribute the most salt to the process water.
SUSTAINABLE WATER MANAGEMENT HANDBOOK FOR SMALL WINERIES
STEP 3 DATA EVALUATION AND OPTION IDENTIFICATION
1. PLANNING AND ORGANIZATION
2. ASSESSMENT 3. DATA EVALUATION & OPTION ID
4. FEASIBILITY ANALYSIS
5. IMPLEMENTATION

www.sustainablewinegrowing.org April 2014 | 9
staff members. See Worksheet 3-1 (Brainstorming Improvement Options) in Appendix C in the full Guide to help with this exercise.
3.3 SCREEN AND SELECT OPTIONS FOR FURTHER STUDYA brainstorming discussion should yield an array of possible options with varying degrees of feasibility. The next step is to review and screen the list of options to reduce the list to those that warrant a full feasibility analysis. See Worksheet 3-2 (Option Evaluation by Weighted Sum Method) in the Appendix C in the full Guide to help screen the options.
STEP 3 DATA EVALUATION AND OPTION IDENTIFICATION (CONTINUED)
SUSTAINABLE WATER MANAGEMENT HANDBOOK FOR SMALL WINERIES
LOW- TO NO-COST BEST MANAGEMENT PRACTICES: | Tracking and monitor water use
| Standard Operating Procedures (SOPs) for cleaning and sanitation activities
| Auditing against SOPs
| Employee education, training, and incentives
| Provide employees with tools - timers on hoses, spray nozzles, brooms, and squeegees
| Leak patrol
Many wineries say that they experience a 30% or more reduction in water use just by paying closer attention.

www.sustainablewinegrowing.org April 2014 | 10
This step entails a detailed evaluation of the screened options identified in Step 3.3. Based on this evaluation, a preferred option, or options, can be selected for implementation.
4.1 CONDUCT TECHNICAL EVALUATIONThe level of effort required to evaluate each option is influenced by the cost, complexity, risk and the history of use in the wine industry. For example, relatively low-cost, proven changes such as product substitution or housekeeping modifications may require very little evaluation and can be implemented with low risk. But a costly, innovative treatment system requires full evaluation, potentially including bench-scale or pilot testing to demonstrate feasibility. Depending on the winery, criteria for equipment selection may include compatibility with existing equipment and processes, fit within available floor space, ease of operation and maintenance, whether installation can be completed without disrupting ongoing operations, and other factors. When evaluating the options, however, the potential of any proposed change to affect the quality of the finished wine is an overriding consideration.
4.2 CONDUCT ECONOMIC EVALUATIONSimilar to the technical evaluation, the economic evaluation for a relatively minor change should consist of a simple assessment of cost and benefits. Larger investment requires comprehensive analysis that accounts for both capital and operating costs, net present value, payback periods, and return on investment.
4.3 IDENTIFY PREFERRED OPTION(S)Using the findings from the technical and economic evaluations, identify the preferred option(s) to meet the objectives identified in Step 1 (Planning and Organization). The rationale for the selection (or deferral) of each option should be noted for future reference. This information may be useful if the implemented approach is not as successful as initially projected or further reductions are sought at a later date.
4.4. DEVELOP ACTION PLANAll collected information, evaluation results, and next steps should be summarized in an Action Plan. A template for an Action Plan is provided in Data Collection Sheet #8. The plan is intended as a reference tool and can be expanded as more information becomes available. Overall, this approach is consistent with the self-assessment and action plan process outlined in the California Code of Sustainable Winegrowing Workbook (California Sustainable Winegrowing Alliance, Wine Institute and California Association of Winegrape Growers, 2012).
SUSTAINABLE WATER MANAGEMENT HANDBOOK FOR SMALL WINERIES
STEP 4 FEASIBILITY ANALYSIS
1. PLANNING AND ORGANIZATION
2. ASSESSMENT 3. DATA EVALUATION & OPTION ID
4. FEASIBILITY ANALYSIS
5. IMPLEMENTATION
www.sustainablewinegrowing.org April 2014 | 11
Implementing the preferred option(s) may entail installing equipment and/or initiating material or procedural changes. Because the details of implementation will vary widely depending on the nature and complexity of the selected improvements, detailed guidance for these tasks is beyond the scope of this Handbook.
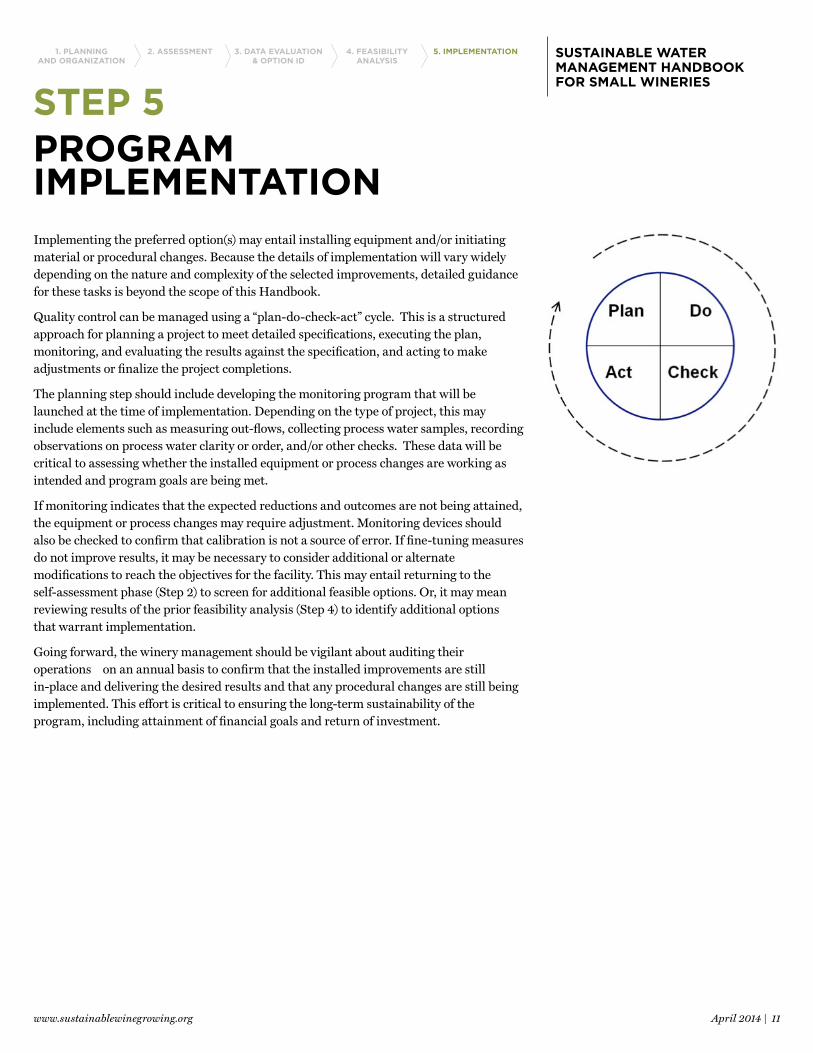
Quality control can be managed using a “plan-do-check-act” cycle. This is a structured approach for planning a project to meet detailed specifications, executing the plan, monitoring, and evaluating the results against the specification, and acting to make adjustments or finalize the project completions.
The planning step should include developing the monitoring program that will be launched at the time of implementation. Depending on the type of project, this may include elements such as measuring out-flows, collecting process water samples, recording observations on process water clarity or order, and/or other checks. These data will be critical to assessing whether the installed equipment or process changes are working as intended and program goals are being met.
If monitoring indicates that the expected reductions and outcomes are not being attained, the equipment or process changes may require adjustment. Monitoring devices should also be checked to confirm that calibration is not a source of error. If fine-tuning measures do not improve results, it may be necessary to consider additional or alternate modifications to reach the objectives for the facility. This may entail returning to the self-assessment phase (Step 2) to screen for additional feasible options. Or, it may mean reviewing results of the prior feasibility analysis (Step 4) to identify additional options that warrant implementation.
Going forward, the winery management should be vigilant about auditing their operations on an annual basis to confirm that the installed improvements are still in-place and delivering the desired results and that any procedural changes are still being implemented. This effort is critical to ensuring the long-term sustainability of the program, including attainment of financial goals and return of investment.
SUSTAINABLE WATER MANAGEMENT HANDBOOK FOR SMALL WINERIES
STEP 5PROGRAM IMPLEMENTATION
1. PLANNING AND ORGANIZATION
2. ASSESSMENT 3. DATA EVALUATION & OPTION ID
4. FEASIBILITY ANALYSIS
5. IMPLEMENTATION

www.sustainablewinegrowing.org April 2014 | 12
year _ _ _ _ year _ _ _ _ year _ _ _ _
tons crushed
gallons received as juice
gallons received as wine
cases bottled on site
gallons shipped offsite as bulk wine or juice
gallons of water supplied to the facility1
gallons of process water leaving the facility1
gallons of process water per gallon of wine produced2
1. Look at the difference between water supply and process water flow numbers. The difference may be domestic uses (employee bathrooms and kitchens), tasting room and hospitality activities, cooling towers, leaks, or irrigation. At some facilities, these other water using activities can account for 30 to 50% of total water use and, thus, represent an opportunity for water conservation.
2. This ratio provides a high level benchmark to determine the water efficiency of your facility. Gallon of wine produced is the combined total of tons processed, wine received, and juice received. Alternatively, you can use the total of cases bottled and wine/juice shipped offsite. Just be consistent in which data you use to use calculate the ratio from year to year.
APPENDIX A DATA COLLECTION SHEET #1
BACKGROUND INFORMATION
SUSTAINABLE WATER MANAGEMENT HANDBOOK FOR SMALL WINERIES
www.sustainablewinegrowing.org April 2014 | 13
1. SOURCE WATER:
1. If municipally served, please collect:
a. Number and location of connections
b. 3 years of monthly water usage data (i.e., gallons)
c. Description of additional onsite treatment (softeners, de-chlorination, etc.)
2. If self-supplied groundwater, please collect:
a. If metered, 3 years of monthly total usage
b. Description of treatment – chlorination, ozonation, ultraviolet, chlorine dioxide, etc.
c. Any sampling or analytical data
d. Additional treatment – softeners, de-chlorination, etc.
2. PROCESS WATER
1. If process water is sent to a Publically Owned Treatment Works (POTW), please collect:
a. 3 years of monthly billing which should show quantity and quality of flow data (i.e., gallons, TSS and BOD)
b. Rate schedule and any service contract
c. Description of onsite pre-treatment
d. Copy of current contract with POTW
2. If process water is disposed of on site, please collect:
a. Copy of current process water discharge permit
b. If metered, 3 years of monthly total usage
c. Description of treatment system
d. Any sampling or analytical data
e. Discharge and/or irrigation records, including details on frequency and volume applied per acre of vineyards
f. If metered separately from the rest of the winery, the electricity billing for the treatment system
APPENDIX A
DATA COLLECTION SHEET #2
WATER IN AND WATER OUT INFORMATION
SUSTAINABLE WATER MANAGEMENT HANDBOOK FOR SMALL WINERIES
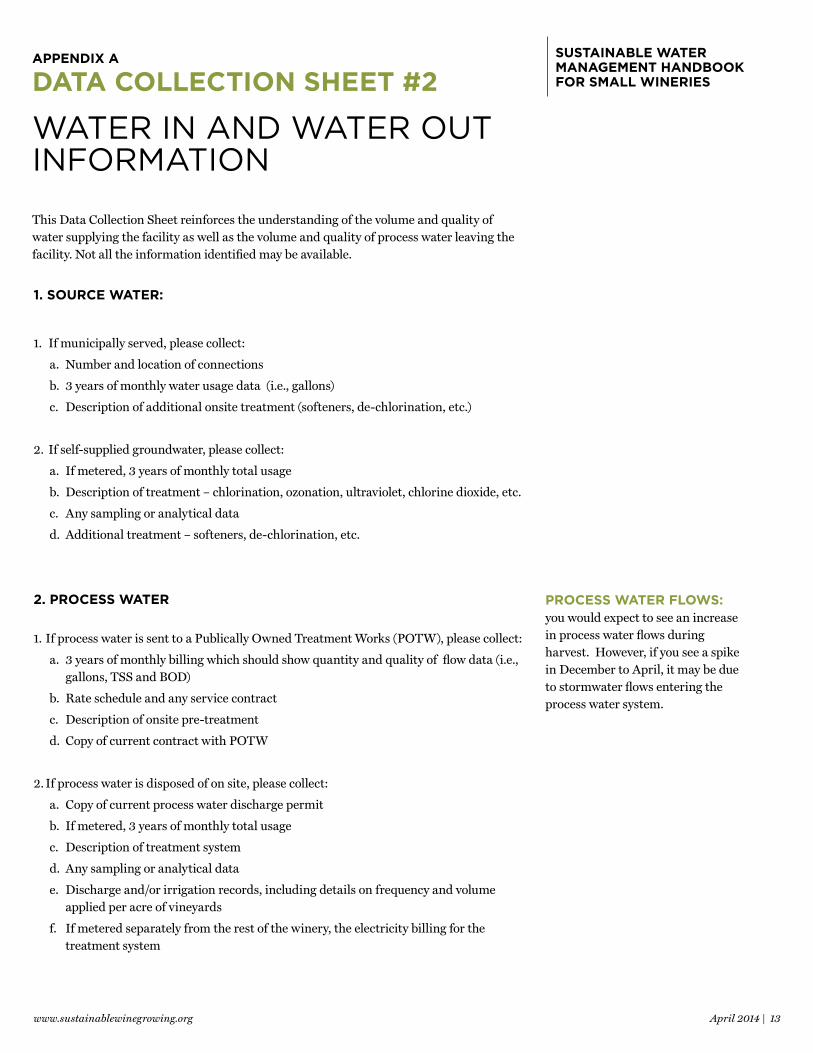
PROCESS WATER FLOWS:you would expect to see an increase in process water flows during harvest. However, if you see a spike in December to April, it may be due to stormwater flows entering the process water system.
This Data Collection Sheet reinforces the understanding of the volume and quality of water supplying the facility as well as the volume and quality of process water leaving the facility. Not all the information identified may be available.

www.sustainablewinegrowing.org April 2014 | 14
As you identify the activities that occur in the winery, consider how much water each process uses and the volume of chemicals added during that process. At the same time, download the worksheets from the Wine Institute website which are provided to guide inventories for water use (Worksheet 2-1), sanitation activities (Worksheet 2-2) and energy demand associated with water management (Worksheet 2-3) available at: http://www.wineinstitute.org/winerywaterguide.
Check all that apply to your operation:
HARVEST ACTIVITIES
Hopper Rinse/Sanitation
Bin Rinse/Sanitation
General Press Sanitation
Pushing Red Must
Chasing White Juice
Chasing Red Pressings
Clean-up
Other: . . . . . . . . . . . . . . . . . . . . . . . . . . . . . . . . . . . . . . . . . . .
CELLAR ACTIVITIES
Wine Pushing/Line Sanitation
Tank Cleaning/Sanitation
Barrel Cleaning
Barrel Storage Sanitation
Lees Filter Cleaning/Sanitation
Cross-Flow Cleaning/Sanitation
Centrifuge Cleaning/Sanitation
Electrodialysis
Tankers Rinse/Sanitation
General Cleaning/Sanitation
Vacuum Pump – rotovac
Other: . . . . . . . . . . . . . . . . . . . . . . . . . . . . . . . . . . . . . . . . . . .
BOTTLING & PRE-BOTTLING ACTIVITIES:
Line Cleaning / Sterilization
Bottle Rinsing
Bottle washing
Vacuum Pumps – corker
Other: . . . . . . . . . . . . . . . . . . . . . . . . . . . . . . . . . . . . . . . . . . .
FACILITY ACTIVITIES:
Landscape irrigation
Process water screen/rinse
Chillers
Bathroom and break rooms
Tasting room
Boilers, heat exchangers, water heaters
Water Softener
Misters
Lab
Vacuum Pump – lab
Stormwater
Other: . . . . . . . . . . . . . . . . . . . . . . . . . . . . . . . . . . . . . . . . . . .
APPENDIX A
DATA COLLECTION SHEET #3
INVENTORY OF WATER USING AND PROCESS WATER GENERATING ACTIVITIES
SUSTAINABLE WATER MANAGEMENT HANDBOOK FOR SMALL WINERIES

www.sustainablewinegrowing.org April 2014 | 15
1. BARREL CLEANING AND SANITATION – INTERIOR OF BARREL:
a. Wineries with a Barrel Washing Machine
CLEANING/SANITIZING THE BARREL WASHING MACHINE
YEAR ROUND
topping setup (gallons per setup)
HARVEST
racking set-up (gallons per setup)
caustic 50 100
paa 50 100
rinse 50 100
total gallons per set-up 150 300
set up per year 30 30
Total gallons per year 4,500 9,000
CLEANING/SANITIZING THE INTERIOR OF BARRELS WITH A BARREL WASHING MACHINE:
flow rate (gallons per minute) 5
total minutes per barrel - cold rinse, hot clean, rinse/sanitize
12
total gallons per barrel (total time x flow rate)
60
number of barrel washing per year 500
Total gallons per year 3,000
Total Water Use Associated with Using a Barrel Washing Machine = 4,500 + 9,000 + 3,000 = 16,500 gallons per year
Note: confirm the flow rate (gallons per minute) at your facility as well as the total time based on your standard operating procedures (SOPs)
APPENDIX A
CALCULATING WATER INVENTORIES - EXAMPLES
SUSTAINABLE WATER MANAGEMENT HANDBOOK FOR SMALL WINERIES
Use the appropriate gallons for your winery
When filling out Worksheet 2-1 (Inventories for Water Use) or creating your own worksheet, include all the activities you checked in Data Collection Sheet #2. Below are some example calculations. You should perform similar calculations for all activies identified in Data Collections Sheet #2. See the Cooper-Garrod Case Study for example.
www.sustainablewinegrowing.org April 2014 | 16
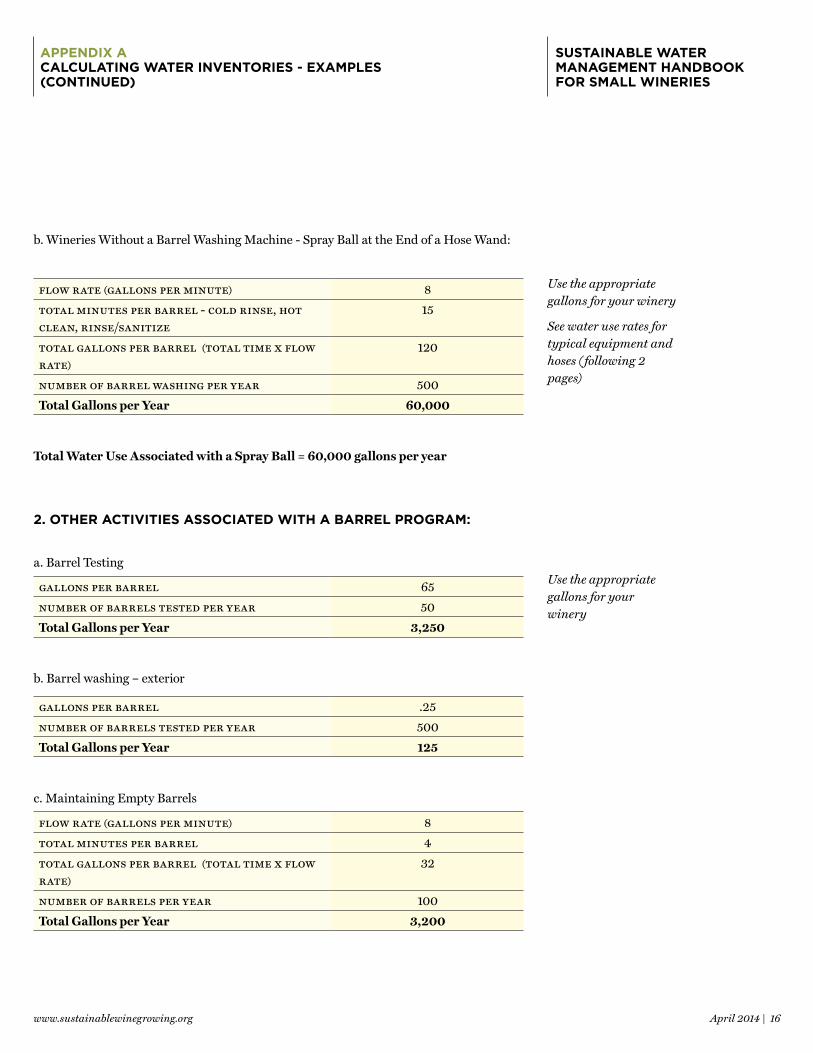
b. Wineries Without a Barrel Washing Machine - Spray Ball at the End of a Hose Wand:
flow rate (gallons per minute) 8
total minutes per barrel - cold rinse, hot clean, rinse/sanitize
15
total gallons per barrel (total time x flow rate)
120
number of barrel washing per year 500
Total Gallons per Year 60,000
Total Water Use Associated with a Spray Ball = 60,000 gallons per year
2. OTHER ACTIVITIES ASSOCIATED WITH A BARREL PROGRAM:
a. Barrel Testing
gallons per barrel 65
number of barrels tested per year 50
Total Gallons per Year 3,250
b. Barrel washing – exterior
gallons per barrel .25
number of barrels tested per year 500
Total Gallons per Year 125
c. Maintaining Empty Barrels
flow rate (gallons per minute) 8
total minutes per barrel 4
total gallons per barrel (total time x flow rate)
32
number of barrels per year 100
Total Gallons per Year 3,200
APPENDIX A CALCULATING WATER INVENTORIES - EXAMPLES (CONTINUED)
SUSTAINABLE WATER MANAGEMENT HANDBOOK FOR SMALL WINERIES
Use the appropriate gallons for your winery
See water use rates for typical equipment and hoses (following 2 pages)
Use the appropriate gallons for your winery
www.sustainablewinegrowing.org April 2014 | 17
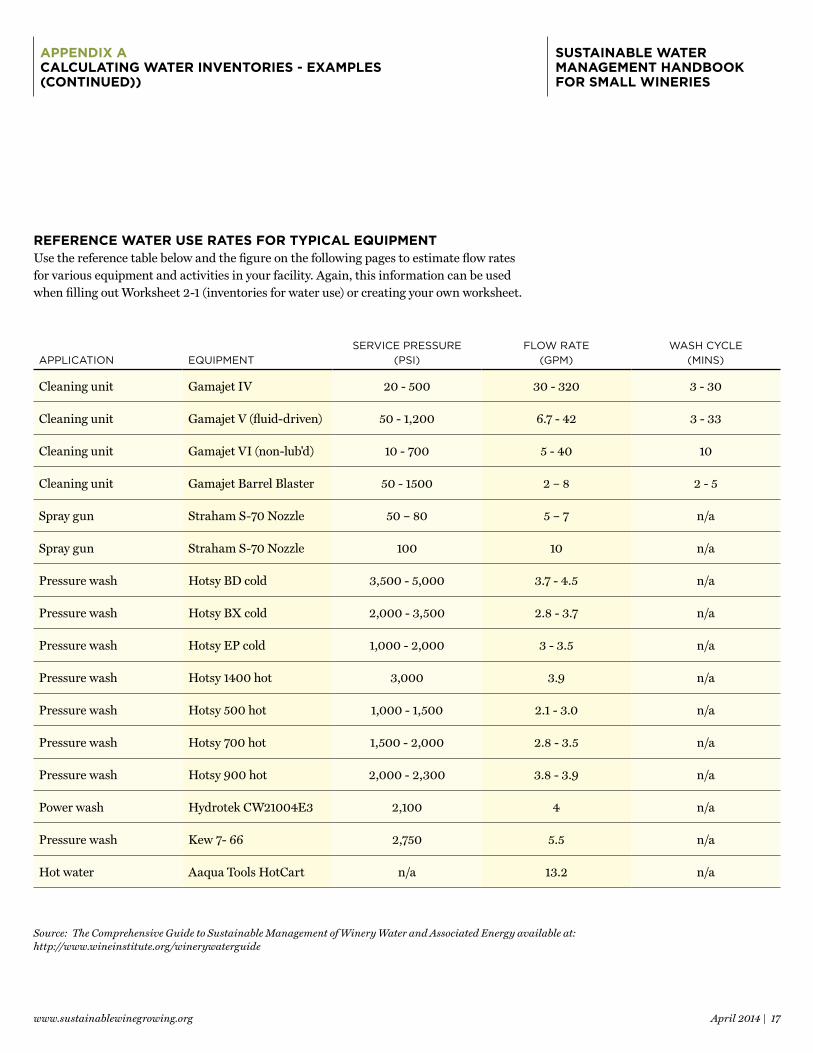
REFERENCE WATER USE RATES FOR TYPICAL EQUIPMENTUse the reference table below and the figure on the following pages to estimate flow rates for various equipment and activities in your facility. Again, this information can be used when filling out Worksheet 2-1 (inventories for water use) or creating your own worksheet.
APPLICATION EQUIPMENTSERVICE PRESSURE
(PSI)FLOW RATE
(GPM)WASH CYCLE
(MINS)
Cleaning unit Gamajet IV 20 - 500 30 - 320 3 - 30
Cleaning unit Gamajet V (fluid-driven) 50 - 1,200 6.7 - 42 3 - 33
Cleaning unit Gamajet VI (non-lub'd) 10 - 700 5 - 40 10
Cleaning unit Gamajet Barrel Blaster 50 - 1500 2 – 8 2 - 5
Spray gun Straham S-70 Nozzle 50 – 80 5 – 7 n/a
Spray gun Straham S-70 Nozzle 100 10 n/a
Pressure wash Hotsy BD cold 3,500 - 5,000 3.7 - 4.5 n/a
Pressure wash Hotsy BX cold 2,000 - 3,500 2.8 - 3.7 n/a
Pressure wash Hotsy EP cold 1,000 - 2,000 3 - 3.5 n/a
Pressure wash Hotsy 1400 hot 3,000 3.9 n/a
Pressure wash Hotsy 500 hot 1,000 - 1,500 2.1 - 3.0 n/a
Pressure wash Hotsy 700 hot 1,500 - 2,000 2.8 - 3.5 n/a
Pressure wash Hotsy 900 hot 2,000 - 2,300 3.8 - 3.9 n/a
Power wash Hydrotek CW21004E3 2,100 4 n/a
Pressure wash Kew 7- 66 2,750 5.5 n/a
Hot water Aaqua Tools HotCart n/a 13.2 n/a
APPENDIX A CALCULATING WATER INVENTORIES - EXAMPLES (CONTINUED))
SUSTAINABLE WATER MANAGEMENT HANDBOOK FOR SMALL WINERIES
Source: The Comprehensive Guide to Sustainable Management of Winery Water and Associated Energy available at: http://www.wineinstitute.org/winerywaterguide

www.sustainablewinegrowing.org April 2014 | 18
REFERENCE WATER DISCHARGE THROUGH 100 FEET OF HOSE:
The diagram above shows water flow through 100 feet of hose. If your hose is less than 100 feet in length, you will have less friction loss and therefore your flow rate will increase. However, the estimated flows in the diagram can be used for estimating purposes.
If you want to determine the actual flow rate (gallons per minute) of your equipment, we recommend you use an (1) empty tank with a known volume and (2) a stop watch. Put the hose in the tank, start your stop watch while turning the hose on and fill the tank with water (or to a known volume) and stop the watch. Record the time to fill the tank. Divide the known volume of the water in the tank by the time it took to fill it and that represents your flow rate.
A tank rather than a barrel is recommended as the flow rate from a ½-inch hose varies from 1.2 gallons per minute to almost 15 gallons per minute depending on the pressure. You want to make sure you have a container that can hold the maximum volume estimated in the figure above.
APPENDIX A CALCULATING WATER INVENTORIES - EXAMPLES (CONTINUED)
SUSTAINABLE WATER MANAGEMENT HANDBOOK FOR SMALL WINERIES
www.sustainablewinegrowing.org April 2014 | 19
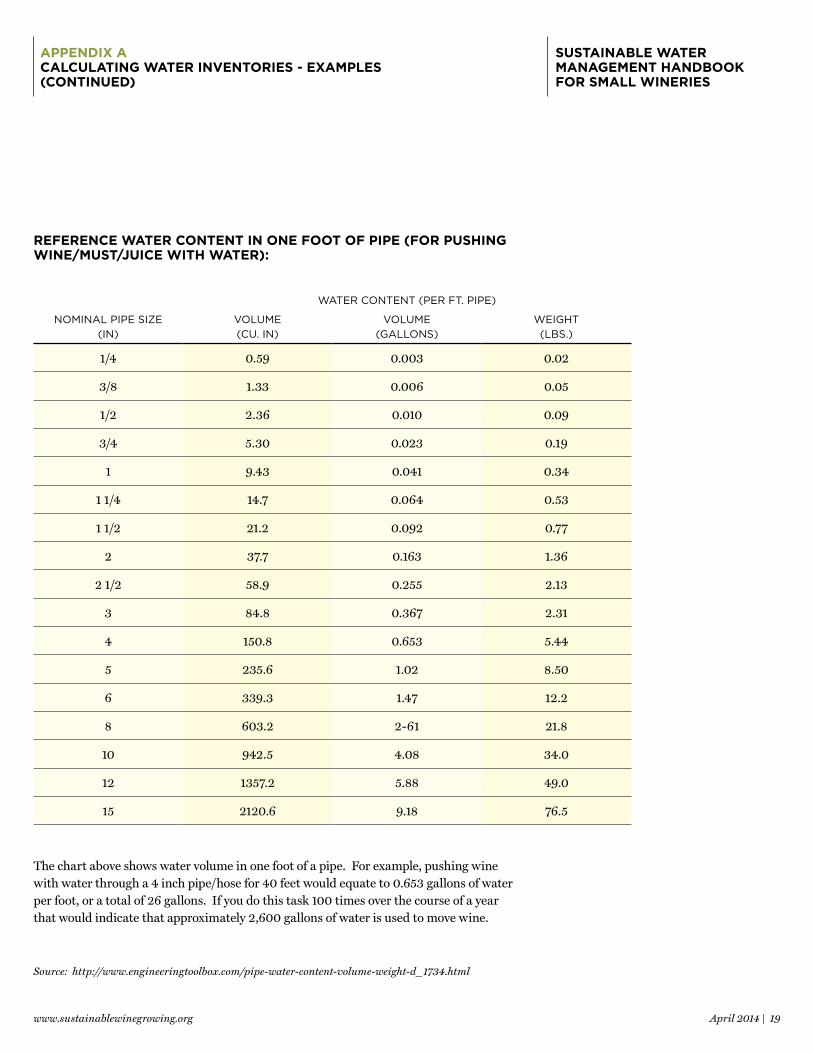
REFERENCE WATER CONTENT IN ONE FOOT OF PIPE (FOR PUSHING WINE/MUST/JUICE WITH WATER):
WATER CONTENT (PER FT. PIPE)
NOMINAL PIPE SIZE (IN)
VOLUME (CU. IN)
VOLUME (GALLONS)
WEIGHT (LBS.)
1/4 0.59 0.003 0.02
3/8 1.33 0.006 0.05
1/2 2.36 0.010 0.09
3/4 5.30 0.023 0.19
1 9.43 0.041 0.34
1 1/4 14.7 0.064 0.53
1 1/2 21.2 0.092 0.77
2 37.7 0.163 1.36
2 1/2 58.9 0.255 2.13
3 84.8 0.367 2.31
4 150.8 0.653 5.44
5 235.6 1.02 8.50
6 339.3 1.47 12.2
8 603.2 2-61 21.8
10 942.5 4.08 34.0
12 1357.2 5.88 49.0
15 2120.6 9.18 76.5
The chart above shows water volume in one foot of a pipe. For example, pushing wine with water through a 4 inch pipe/hose for 40 feet would equate to 0.653 gallons of water per foot, or a total of 26 gallons. If you do this task 100 times over the course of a year that would indicate that approximately 2,600 gallons of water is used to move wine.
APPENDIX A CALCULATING WATER INVENTORIES - EXAMPLES (CONTINUED)
SUSTAINABLE WATER MANAGEMENT HANDBOOK FOR SMALL WINERIES
Source: http://www.engineeringtoolbox.com/pipe-water-content-volume-weight-d_1734.html

www.sustainablewinegrowing.org April 2014 | 20
You may end up with an estimated Facility Water Balance. The facility water balance will show you relative percentages and help you identify your ‘hot spots.’ Hot spots represent your best opportunities for improving water use efficiency. Typically a few activities may represent a large portion of total use as shown in the example table below.
EXAMPLE FACILITY WATER BALANCES
EXAMPLE WINERY #1
EXAMPLE WINERY #2
general press sanitation
2 % 4 %
wine pushing / line sanitation
28 % 17 %
tank sanitation 15 % 14 %
barrel cleaning 21 % 17 %
cross-flow sanitation 16 % 13 %
bottling line sterilization
6 % 15 %
vacuum pumps -- 9 %
Total 85+% 85+ %
Percentages vary depending on the winery operations, equipment and standard operating procedures. Also, see Case Studies in Appendix B to read how those wineries developed their Facility Water Balance.
APPENDIX A CALCULATING WATER INVENTORIES - EXAMPLES (CONTINUED)
SUSTAINABLE WATER MANAGEMENT HANDBOOK FOR SMALL WINERIES
Source: http://www.engineeringtoolbox.com/pipe-water-content-volume-weight-d_1734.html
FACILITY WATER BALANCE:

www.sustainablewinegrowing.org April 2014 | 21
Look at your invoices from chemical suppliers for the past year. For those chemicals that are combined with process water (e.g., cleaners, sanitizers, softeners, etc.) list the name of the product, name of the chemicals of concern in that product, and the volume purchased. Determine if the volume used was less than that purchased.
Examples: potassium hydroxide, trisodium phosphate, citric acid, potassium metabisulfite, sodium percarbonate, peraceitic acid, nitric acid / phosphoric acid, sodium hypochlorite, sodium hydroxide, organophosphate, bromine tablets, diatomaceous earth, etc.
As you list the chemicals, consider if there are opportunities to substitute or replace the existing chemicals with one that contains less salt. For example, replacing a sodium based water softener with a potassium based resin.
ACTIVITYNAME OF PRODUCT
NAMES OF CHEMICALS OF
CONCERN IN PRODUCT1
CONCENTRATION OF EACH CHEMICAL
OF CONCERN IN PRODUCT (%)1
QUANTITY OF PRODUCT PURCHASED
AMOUNT OF CHEMICAL OF CONCERN DISCHARGED
(LBS/YEAR)
tank sanitation chem prod NaSO4 5% 50 lbs 5% x 50 = 2.5 lbs/yr
water softener softener resin NaCl 10% 50 lbs 10% x 50 = 5.0 lbs/yr
TOTAL 7.5 lbs/year
APPENDIX A
DATA COLLECTION SHEET #4CHEMICAL INVENTORY
SUSTAINABLE WATER MANAGEMENT HANDBOOK FOR SMALL WINERIES
1. Refer to product Safety Data Sheet for chemicals of concern and concentrations.

www.sustainablewinegrowing.org April 2014 | 22
IS THE EQUIPMENT
ON SITE?
ELECTRICITY (SOLAR
OR GRID)NATURAL
GAS PROPANE FUEL OIL
✔ Check ✔ The Type of Energy Source
well pump
supply water treatment
distribution pumps
process water screen
process water sump pump
process water treatment (if treat onsite):
| aerators
| mixers
| bioreactors
| sbr
| mbr
winery pumps
boiler
cooling tower
Other:
APPENDIX A
DATA COLLECTION SHEET #5
EQUIPMENT ASSOCIATED WITH WATER MANAGEMENT
SUSTAINABLE WATER MANAGEMENT HANDBOOK FOR SMALL WINERIES
Consider calculating the cost to operate this equipment. Here are some basic conversions to help you:
| 1 Btu = 0.000010002 therm [U.S. (uncommon)] of natural gas
| 1 Btu = 0.00001047 gallon [U.S.] of liquid propane gas
| 1 horsepower = 0.745699872 kilowatts (kW) of electricity
For example: if you have a 1 horsepower (Hp) pump that runs 1000 hours a year and your average cost of electricity is $0.20 per kilowatt-hour (kWh), then your cost of running that pump is: (1Hp* 0.745 kW/Hp *1000 hours/year*$0.20/kWh) = $150/year
More conversions can be found here: http://www.onlineconversion.com/energy.htm

www.sustainablewinegrowing.org April 2014 | 23
WATER USING ACTIVITY
ESTIMATED ANNUAL FLOW (GALLONS PER
YEAR)
(FROM PREVIOUS DATA COLLECTION SHEETS)
CONSTITUENT CONTRIBUTION TO PROCESS WATER
ESTIMATED ANNUAL AMOUNT
OF CHEMICALS OF CONCERNED
DISCHARGED
(LBS/YEAR) (FROM PREVIOUS DATA
COLLECTION SHEETS)
RANK IN TERMS OF WATER USE
(RANK FROM LARGEST
CONTRIBUTOR TO LOWEST)
RANK IN TERMS OF CONSTITUENT CONTRIBUTION
(RANK FROM LARGEST
CONTRIBUTOR TO LOWEST)
tank washing 20,000 salt (fds) 50 2 1 for salt
barrel washing 20,000 bodnot sure, but high
2 2 for bod
landscape irrigation 25,000 n/a n/a 1 n/a
centrifuge sanitation 4,000 de, bod not sure 4 1 for bod
vacuum pump 8,000 n/a n/a 3 n/a
APPENDIX A
DATA COLLECTION SHEET #6
FOCUSING THE DATA
SUSTAINABLE WATER MANAGEMENT HANDBOOK FOR SMALL WINERIES
While generating options for source control, focus on those activities that ranked highest for both water use and constituent contribution.
CONSIDERATIONS AS YOU EVALUATE THE DATA:1. Process water as a percent of supply water - If a significant volume of supply water is going to non-winery uses, consider
opportunities to:
a. Reuse treated process water for irrigationb. Install low flow faucets and fixturesc. Look for and fix leaks in the facility and potentially in the conveyance system
2. Water Use Inventory and Metered Totals - If you sum up the individual flows for each water using activity (measured and estimated flows), does the total approximate the total gallons of process water identified in Line 6 or in Line 7 of Data Collection Sheet #1? If not:
a. Check that you identified all your water using activitiesb. Review Guideline 1 in the full Guide and consider doing additional flow measurements
3. Stormwater - If a significant about of stormwater is going into the process water or septic systems, consider opportunities to:a. Redirect roof drains to storm drainsb. Cover outside processing areas
4. Process water to wine ratio – For wineries that have grape-to-bottling activities, it is unusual to have a ratio less than 3. A ratio above 10 would indicate an opportunity to conserve water.a. If your ratio is outside of the range, confirm your ratio if under 3 and above 10. b. If your ratio fluctuated over the past few years, identify the reasons. For example, stormwater entering the process water system
before the meter can make the ratio appear high.
www.sustainablewinegrowing.org April 2014 | 24
MEASURE(WC=WATER CONSERVATION; SC = SOURCE CONTROL; ES = ENERGY SAVINGS
READY DOING THIS
IF NOT, WILL YOU CONSIDER
We track and monitor water use WC
We have written standard operating procedures (SOPs) for cleaning and sanitation activities
WC SC
We evaluate SOPs annually WC SC
We have employee education, training, and incentives around water use
WC
Our employees have the right tools to save water - timers on hoses, spray nozzles, brooms, and squeegees
WC
We have a low flow tank washing SOP
WC
We use steam for barrel washing WC
We eliminated the new barrel program or use oak alternatives
WC SC ES
We have a low flow/high pressure barrel washing system
WC
Our employees use the right tools to save water - timers on hoses, spray nozzles, brooms, and squeegees
WC
We regularly look for and fix leaks; we investigate alternative material if leaks continue (e.g. hoses, nozzles, etc.)
WC
We reuse water when possible: Barrel washing,Tank washingLandscape irrigation,Vineyard irrigation, Other:
WC
APPENDIX A
DATA COLLECTION SHEET #7
POSSIBLE WATER EFFICIENCY & SOURCE CONTROL MEASURES (ALSO SEE APPENDIX D IN THE FULL GUIDE)
SUSTAINABLE WATER MANAGEMENT HANDBOOK FOR SMALL WINERIES
MEASURE(WC=WATER CONSERVATION; SC = SOURCE CONTROL; ES = ENERGY SAVINGS
READY DOING THIS
IF NOT, WILL YOU CONSIDER
We switched chemicals to reduce salt load: softener, cleaning/sanitation chemicals,cooling tower chemicals,other:
SC
We have installed Solenoids to supply seal water only when the pump is running
WC
Pumps that run continuously are on a recirculation loop (Rotovac, Corker, Lab equipment, Air compressors)
WC
We have source control measures to capture solids (screen, sweep, squeegee, or segregate) from production areas (e.g. crush pad, lees handling, fining, centrifuge, filtration, etc.)
SC
We have low flow faucets, toilets and dishwashers
WC
We use hot water for cleaning operations
WC SC
We capture and reuse caustic and cleanup chemicals
WC SC
We have extended time between clean-up in certain areas of the winery or in certain production seasons
WC SC
We have pilot tested alternative cleaning regiments using less chemical/water volumes
WC SC
We use pigs to clean wine lines WC SC
We use gases to move wine WC SC
Other (equipment, process improvements, new procedures)

www.sustainablewinegrowing.org April 2014 | 25
PRIORITY PROJECT NAME BRIEF DESCRIPTIONRESPONSIBLE
PARTY(S)START DATE
END DATE
1 SOPsDevelop written SOPs for cleaning and sanitation activities
J. Smith, Cellar Master
Jan 2014 Mar 2014
2 SOPs (Re)train cellar workers on SOPsJ. Smith, Cellar Master
Apr 2014 May 2014
3
4
5
6
7
APPENDIX A
DATA COLLECTION SHEET #8
ACTION PLAN
SUSTAINABLE WATER MANAGEMENT HANDBOOK FOR SMALL WINERIES

www.sustainablewinegrowing.org April 2014 | 26
Cooper-Garrod is a family owned and operated 28-acre estate vineyard and winery located above the village of Saratoga on unirrigated hillsides in the Santa Cruz Mountains AVA. Typical yield is approximately 75 tons of fruit of which 45-50 are processed and aged onsite and ultimately bottled by a mobile bottling company. An adjoining tasting room is open daily and hosts about 8,000 visitors a year. Other activities that impact metered water usage include horse events that draw up to 2,000 guests a year. Process water, domestic waste, and some storm water is treated onsite via septic system and leach field.
In 2012, the Mount Eden Mutual Water Company provided 69,190 gallons of water to the winery and tasting room through a single metered connection. The 2012 water usage was a surprising 20% increase over the previous two years.
In response, Bill and his nephew, Ben Cooper, followed the Handbook steps as summarized below:
STEP 1 PLANNING AND ORGANIZATION (SET GOALS):| Identify the largest water using activities
| Determine if water is used as efficiently as possible
STEP 2 ASSESSMENT (COMPILE DATA):| Translate written Standard Operating Procedure (SOP) into an
Excel spreadsheet
| Identify water-using activities not included in SOP
| Estimate annual gallons water used per activity
STEP 3 DATA EVALUATION (IDENTIFY HOTSPOTS):| Develop a Facility Water Balance (FWB) (see table below)
| Identify largest water uses:
(1) Press cleaning/sanitation
(2) Barrel cleaning/sanitation
(3) Tasting room
| Identify data gaps that need to be filled
STEP 4 OPTION IDENTIFICATION (CLOSE DATA GAPS):| Improve Facility Water Balance by identifying ‘unaccounted’
water use:
(1) Read meter before and after when water is used on the crush pad or in cellar
(2) Read meter before and after bottling line operations
(3) Identify water usage when winery is not using water, i.e., meter is spinning, but winery is not using water.
| Refine and incorporate estimated task times directly into the SOPs
| Use improved Facility Water Balance to forecast seasonal or monthly usage
Step 2 appeared relatively straight-forward as Cooper-Garrod had written a Cleaning and Sanitation SOP for their organic certification and only had to identify other water usage, then calculate water required for the various steps and their frequency of occurrence.
About three hours later, at the end of Step 3, they had developed an estimated Facility Water Balance (below). Because the estimate of non-winery water use is fairly accurate, if not conservative, the Coopers could approximate the volume of water the winery used in 2012 (69,190 – 6,000 = 63,190 gallons) and the ratio of water used to gallons of wine bottled (approximately 8.6). A ratio below 9 is reasonable for a winery of this size, and their success can be attributed to existing best practices including:
| Pre-cleaning crush equipment and tanks with brush or scraper
| Recycling ozone rinse water when feasible
| Using a pig to help clean hoses
| Using a pressure washer or other flow control devices during cleaning and sanitizing activities
However, Cooper-Garrod is interested in further improving their water efficiency. Because the Facility Water Balance (below) currently sums to about half the metered total, most of the next steps involve closing data gaps and improving the understanding of where metered water is used in, and outside, the winery. By identifying the unaccounted flows, Cooper-Garrod will be able to confirm which activities use the most water, and then tailor the next water conservation initiatives to address the largest water-using activities.
APPENDIX B CASE STUDIES
COOPER-GARROD CASE STUDY
SUSTAINABLE WATER MANAGEMENT HANDBOOK FOR SMALL WINERIES

www.sustainablewinegrowing.org April 2014 | 27
Cooper-Garrod will be able to improve their water-to-wine ratio in the coming years.
CLEANING AND SANITATION ACTIVITIESESTIMATED ANNUAL
GALLONSPERCENT OF
ESTIMATEALLOCATED
GALLONS
press 6,527 19% 13,187
barrels 5,130 15% 10,364
pumps, hoses, valves, gaskets 4,720 14% 9,536
destemmer 2,882 8% 5,823
tanks 2,170 6% 4,384
kegs, carboys and glass jugs 1,800 5% 3,637
plate and frame filter 1,275 4% 2,576
bottling 900 3% 1,818
bottling tank cleaning 868 3% 1,754
dumping stand 815 2% 1,647
harvest bins 583 2% 1,178
hand tools 78 0.2% 158
Other Winery Activities -
lab 300 0.9% 606
barrel testing 100 0.3% 202
chiller 100 0.3% 202
Non Winery Activities -
sinks - tasting room and horse owners 6,000 17.5% 12,122
Total Estmated Water Use 34,247 -
metered gallons * 69,190 69,192
APPENDIX B CASE STUDIES COOPER-GARROD CASE STUDY (CONTINUED)
SUSTAINABLE WATER MANAGEMENT HANDBOOK FOR SMALL WINERIES
* Water supply for the employee and guest bathrooms as well as some small water features and minor landscape irrigation is supplied from a separate water meter and therefore not included in this work.

www.sustainablewinegrowing.org April 2014 | 28
BENEFITS FROM WORKING THE STEPS:Bill Cooper anticipates experiencing additional benefits from his proactive approach of measuring and managing water use at the winery.
Shortly after completing the Facility Water Balance shown above, and in response to a 2011 Santa Clara County study to recommend how the county could better support local wineries, the County created a “Limited Food Service for Wineries” license to bridge the gap between tasting room crackers and a full-service kitchen. As a first step, the license required an evaluation (below) of the 1993 septic system that was installed to support the tasting room and a 6,000 case winery (the winery currently produces 2,500-3,000 cases per year). Much of the information collected as part of the Facility Water Balance process will be useful in responding to the County’s request for information.
The County required the following information as part of the septic system evaluation:
THE FOLLOWING QUESTIONS WILL HELP US ASSIST YOU IN EVALUATING THE WASTEWATER FLOW OF THE ONSITE SEWAGE DISPOSAL SYSTEM.
Existing House
number of bedrooms in existing house on site.
Wine Making
is winemaking operation seasonal or year round.
if seasonal, what is the season?
average gallons of waste water per day used during wine making?
average number of wine tasting customers per week?
Horse Activities (boarder, shows, special events)
october-march
average number of people onsite each weekday?
average number of people onsite each weekend?
april-september
average number of people onsite each weekday?
average number of people onsite each weekend?
Overall-Winery and Farm
number of employees-week days?
number of employees-weekends?
are there other restrooms for public use, or any chemical toilets brought in for special events?
is the horse wash pad connected to septic system?
Please feel free to provide any additional information.
Looking ahead, if the Mutual Water Company asks its customers to consider voluntary reduction in water use in the future, Cooper-Garrod could use the Facility Water Balance and the ongoing measuring and management activities to demonstrate that the winery has already reduced water use and had achieved appropriate levels of water conservation.
APPENDIX B CASE STUDIES COOPER-GARROD CASE STUDY (CONTINUED)
SUSTAINABLE WATER MANAGEMENT HANDBOOK FOR SMALL WINERIES

www.sustainablewinegrowing.org April 2014 | 29
Alpha Omega is located in Rutherford in the heart of Napa Valley and produces high-end estate wines. Grapes are procured from the many appellations of Napa Valley. An onsite tasting room is open daily and hosts visitors and special events. In addition to the winery and tasting room, activities that impact water usage include landscape irrigation, and the fire/ornamental pond.
Process water from the winery, domestic waste, and some storm water is treated onsite via process water treatment system. The treatment system consists of several underground settling tanks, the Lyve System (Activated Sludge process), a holding pond with aeration, sand filter, and UV system. The treated effluent is ultimately applied to 6 acres of vineyard via drip irrigation.
As is typical with most wineries, Alpha Omega water use and process water generation increases substantially during harvest. During past harvests seasons, flows from the facility were at such high levels that the Lyve System capacity was exceeded. When this occurred, the winery pumped process water from the settling tanks that precede the Lyve system and hauled the waste to Napa Sanitation District. This was both costly and time consuming. In response, Alpha Omega began investigating methods to improve the performance of the process water treatment system. First, the winery is considering retrofitting the existing process water system. Another opportunity includes using the Handbook to help reduce harvest season process water flows. To do so, onsite water using and process water generating activities need to be identified and their flows estimated. However, because the facility does not have a sub-meter at the winery, Alpha Omega started with the meter at the supply well. This groundwater well supplies water to all onsite activities, including landscape irrigation, decorative pond, tasting room, special events, and the winery. To calculate the estimated flows associated with winery activities, the amount of water used by non-winery onsite activities were estimated and subtracted from the supply well meter total. This includes landscape irrigation (submetered), water used to replenish evaporation loss in the decorative pond, tasting room guests, visitors, and employees. The estimated calculations are shown in the table below.
Based on these estimates, Alpha Omega determined that its ratio of gallons of water to the gallons of wine produced was over 11. This is a high ratio and indicates that there are opportunities for improvement in water use efficiency. The estimates also confirmed that harvest represents approximately 45% of total water use. The next step for Alpha Omega in reducing its harvest related flows is to identify those activities that use the greatest amount of water.
Based on their experience, Alpha Omega’s winemakers identified several winery activities that they considered the key contributors to the process water flows at harvest, including: the sorting table, chasing wine, tank cleaning and sanitation, barrel cleaning and sanitation, and pushing red must. However, no data exists to confirm that these activities are the largest contributors to winery water consumption and process water generation. To calculate the estimated flows associated with specific winery activities, the facility developed a Harvest Season Facility Water Balance (FWB) based upon their written standard operating procedures (SOPs) for cleaning and sanitation activities. From the written SOPs, the estimated flows per tasks can be calculated and when multiplied by the frequency of that task, the total seasonal flows can be estimated. However, the SOPs do not include all the water and process water generating activities identified by staff and for those activities not included in the SOPs, the winery will have to estimate flows. This includes the sorting table, chasing wine, and pushing must.
The Draft Facility Water Balance was completed and compared to the total estimated harvest process water flow from the winery (table below). However, there was a significant difference between the estimated flow of almost 0.5 million gallons shown in the table below and that calculated in the Facility Water Balance. Alpha Omega has decided to use Harvest 2013 to collect additional data and to true-up the Facility Water Balance. This will include how much water is used during various tasks and how many times that task is performed during harvest.
APPENDIX B CASE STUDIES
ALPHA OMEGA CASE STUDY
SUSTAINABLE WATER MANAGEMENT HANDBOOK FOR SMALL WINERIES

www.sustainablewinegrowing.org April 2014 | 30
ESTIMATED WINERY WATER USE ANNUAL HARVEST
total from wella 2,592,443 1,073,446
evaporation loss (net of precipitation)b (118,590) (83,310)
irrigations (877,999) (354,189)
total process water flow to lyve 1,595,854 100% 635,947 100%
employees - sanitary flowc (163,350) (62,100)
special event cleaning - process waterd (59,040) (14,760)
visitors - sanitary flowc (240,450) (60,113)
total estimated sanitary flows (462,840) 29% (136,973) 22%
Total Estimated Process Water Flows From The Winery
1,133,286 71% 498,974 78%
The Handbook steps that Alpha Omega followed included:
STEP 1 PLANNING AND ORGANIZATION (SET GOALS):| Reduce harvest-related process water flows
| Reduce costs associated with hauling process water to Sanitation District
| Reduce strain on the domestic supply well
STEP 2 ASSESSMENT (COMPILE DATA):| Use metered data to estimate winery water use
| Identify key water using activities during harvest
| Translate written SOP into an Excel spreadsheet
| Identify water-using activities not included in SOP
| Estimate gallons water used per activity during harvest
STEP 3 DATA EVALUATION (IDENTIFY HOTSPOTS):| Develop a Harvest Season Facility Water Balance
| Compare to estimated winery water use data (metered)
| Identify largest water uses
| Identify data gaps that need to be filled:
STEP 4 OPTION ID (CLOSE DATA GAPS):| Improve accuracy of the Facility Water Balance by collecting additional data during in
the future.
APPENDIX B CASE STUDIES ALPHA OMEGA CASE STUDY (CONTINUED)
SUSTAINABLE WATER MANAGEMENT HANDBOOK FOR SMALL WINERIES
a. Available metered data
b. Evaporation loss from the 7,000 square foot decorative pond was calculated from pan evaporation data available through the Western Regional Climate Center. Pan evaporation is approximately 77 inches (or 6.42 feet) over the year = 7,000 SF * 6.42 FT *7.48 gallons per cubic foot. The result is then multiplied by 0.80 to more closely estimate the evaporation from a shallow lake. In some months, precipitation reduces the amount of water loss due to evaporation in the decorative pond. The amount of well water that replenishes the decorative pond is calculated as the difference between evaporation loss and direct precipitation onto the pond.
c. For the purpose of this analysis, sanitary flows were estimated as follows:
• Employees - contribute approximately 15 gallons per day per employee
• Tasting room visitors – contribute approximately 3 gallons per day per guest
• Special events visitors – contribute
approximately 10 gallons per day per guest
d. In preparation for special events, there is often a complete cleaning estimated as gallons per minute multiplied by the number of minutes cleaning takes place.
www.sustainablewinegrowing.org April 2014 | 31
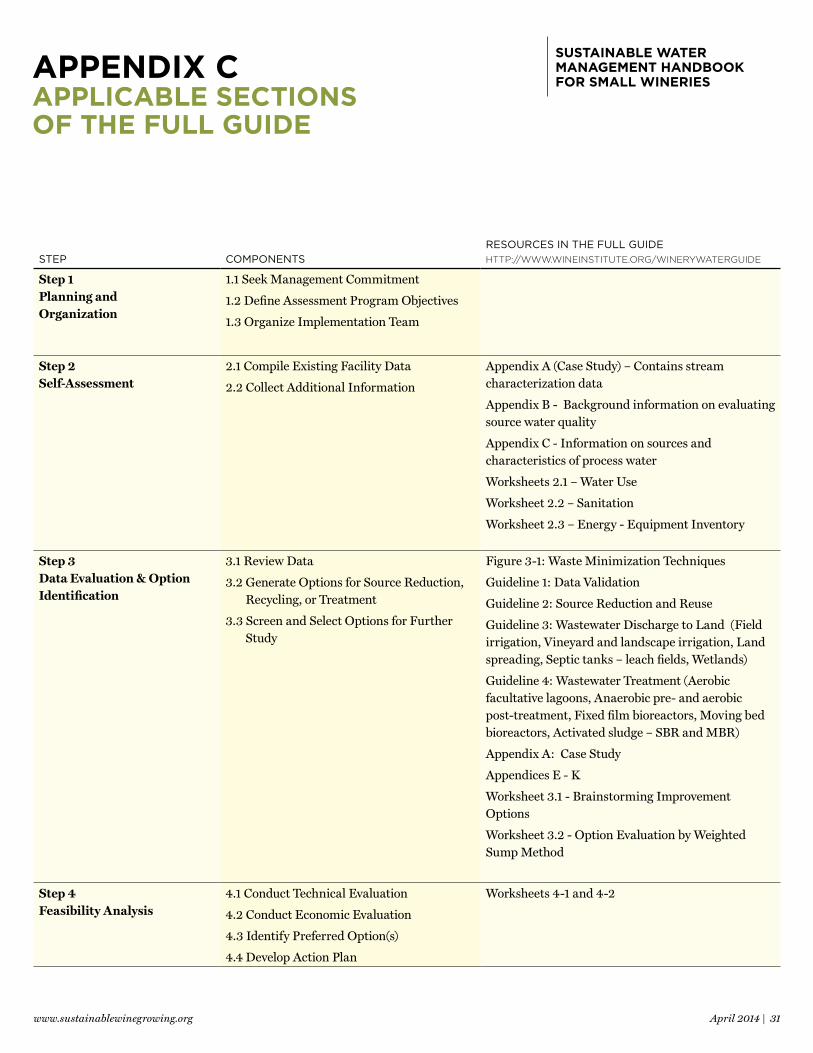
STEP COMPONENTSRESOURCES IN THE FULL GUIDE HTTP://WWW.WINEINSTITUTE.ORG/WINERYWATERGUIDE
Step 1 Planning and Organization
1.1 Seek Management Commitment
1.2 Define Assessment Program Objectives
1.3 Organize Implementation Team
Step 2 Self-Assessment
2.1 Compile Existing Facility Data
2.2 Collect Additional Information
Appendix A (Case Study) – Contains stream characterization data
Appendix B - Background information on evaluating source water quality
Appendix C - Information on sources and characteristics of process water
Worksheets 2.1 – Water Use
Worksheet 2.2 – Sanitation
Worksheet 2.3 – Energy - Equipment Inventory
Step 3 Data Evaluation & Option Identification
3.1 Review Data
3.2 Generate Options for Source Reduction, Recycling, or Treatment
3.3 Screen and Select Options for Further Study
Figure 3-1: Waste Minimization Techniques
Guideline 1: Data Validation
Guideline 2: Source Reduction and Reuse
Guideline 3: Wastewater Discharge to Land (Field irrigation, Vineyard and landscape irrigation, Land spreading, Septic tanks – leach fields, Wetlands)
Guideline 4: Wastewater Treatment (Aerobic facultative lagoons, Anaerobic pre- and aerobic post-treatment, Fixed film bioreactors, Moving bed bioreactors, Activated sludge – SBR and MBR)
Appendix A: Case Study
Appendices E - K
Worksheet 3.1 - Brainstorming Improvement Options
Worksheet 3.2 - Option Evaluation by Weighted Sump Method
Step 4 Feasibility Analysis
4.1 Conduct Technical Evaluation
4.2 Conduct Economic Evaluation
4.3 Identify Preferred Option(s)
4.4 Develop Action Plan
Worksheets 4-1 and 4-2
APPENDIX C APPLICABLE SECTIONS OF THE FULL GUIDE
SUSTAINABLE WATER MANAGEMENT HANDBOOK FOR SMALL WINERIES

www.sustainablewinegrowing.org