sustainable use of the earth’s natural resources - bourse · outotec oyj 1 vuosikertomus 2010...
TRANSCRIPT

1 Vuosikertomus 2010Outotec Oyj
Sustainable use ofthe Earth’s natural
resources
ANNUAL REPORT 2010

1 Annual Report 2010Outotec Oyj
2010 was an eventful year. The market recovered, the company’s operational model was stream-lined and the revised strategy was launched. Read more
BUSINESS OPERATIONSNon-ferrous Solutions 17Ferrous Solutions 22Energy, Light Metals and Environmental Solutions 27Services 32Research & development 35Environment 40Personnel 47Risk management 51
FINANCIAL STATEMENTSReport by the Board of Directors 57Consolidated financial statements, IFRS 65Key financial figures, IFRS 112Parent company’s financial statements, FAS 115
SHARE INFORMATIONShares and shareholders 126Auditors’ report 130Board of Directors 131Executive Board 132Corporate Governance 2010 134Investor information 136
57
ConTenTs
ANNUAL REVIEW 2010Year 2010 in brief 2Mission and strategic intent 3Outotec in brief 4Technology and service offering 5CEO’s review 6Strategy review 9Market review 12
632
47
outotec’s personnel has strong expertise an innovative attitude to technology development.Read more
over 60% of sales came from emerging markets and were evenly split by materials. Read more
services sales grew organically and through acquisitions. Read more

2 Annual Report 2010Outotec Oyj
evenTful yeaR
Market activity returned and order intake was excellent. The year-end order backlog strengthened by over 60% from 2009.
new long term financial targets were set as part of the strategy revision.
services represented 29% of sales. Growth was boosted by acquisitions and customers’ enhanced production capacity.
significant part of the achieved euR
26.2 million structural cost savings will be reinvested to growth.
Sales by destination
Sales, EUR million
06 07 08 09 10
0
25
50
75
100
125
Operating profit, EUR million
06 07 08 09 10
0
250
500
750
1,000
1,250
1,500
Order backlog, EUR million
06 07 08 09 10
0.0
0.5
1.0
1.5
2.0
2.5
Earnings per share, EUR
06 07 08 09 10
Sales by materials
yeaR 2010 in bRief
Other metals 6% (-)Sulfuric acid 8% (16%)Nickel 7% (6%)Zinc 5% (5%)Precious metals 11% (15%)Ferroalloys 3% (3%)Aluminum 7% (10%)Iron 12% (17%)Copper 25% (20%)
Non-ferrous Solutions 64%
Ferrous Solutions 13%
Energy, Light Metals and Environmental Solutions 23%
Sales by business area Operating profit by business area
Non-ferrous Solutions 41%
Ferrous Solutions 17%
Energy, Light Metals and Environmental Solutions 42%
*) excluding one-time items and PPA amortizations
Other incl. energy, water, chemical industry 16% (8%)
969.6
740.4
1,000.1
1,217.9
877.7
41.6
51.6
96.1
120.2
58.6
0.59
0.88
1.85
2.25
1.01
Europe and CIS countries20% (22%)
North America 11% (5%)
Asia 22% (31%)Africa 12% (9%)
South America 23% (27%)
Australia and Pacific countries 12% (6%)
866.4
1,317.21,176.7
867.4
1,393.1
74.7 *)
3 Annual Report 2010Outotec Oyj
Mission and sTRaTeGiC inTenT
our mission is sustainable use of the earth’s natural resources.
our strategic intent is to be the leading provider of sustainable minerals and metals processing solutions, and to become an
innovative provider of sustainable energy and water processing solutions.
3 Annual Report 2010Outotec Oyj

4 Annual Report 2010Outotec Oyj
Outotec has a strong portfolio of tech-nologies for the entire value chain from ore to metals. To further strengthen the technology offering, Outotec plans to expand to adjacent industries such as the energy industry and industrial water treatment.
Outotec actively develops and ac-quires new technologies and processes based on customer needs and business requirements.
pRovidinG susTainable life CyCle soluTions
NON-FERROUS SOLUTIONSThe Non-ferrous Solutions business area consists of businesses relating to the processing of copper, nickel, zinc, lead, gold, silver, and platinum group metals as well as industrial minerals. Its solutions cover the entire value chain from ore to metal. The Larox, Ausmelt, and Millteam acquired businesses are included in the business area.
ouToTeC in bRief
With a mission of sustainable use of the earth’s natural resourc-es, outotec develops technologies and provides sustainable life cycle solutions to its customers, guaranteeing the best return on the customer’s investment. The common denominator in all outotec technologies is their ability to maximize recovery, minimize environmental impacts, save energy, natural resources, and capital investments.
Many of Outotec’s technologies have been rated by the European Union as BAT, the best existing, economically viable techniques with regard to the environment.
Outotec operates globally with sales and service centers in 24 countries and deliveries to over 80 countries. At the end of 2010, Outotec had 3,130 employees.
FERROUS SOLUTIONSThe Ferrous Solutions business area con-sists of businesses relating to the process-ing of iron, steel, and ferroalloys as well as titanium feedstock to products such as concentrates, pellets, sinter, direct reduced iron, hot-briquetted iron, ferroalloys, and titanium feedstock.
ENERGY, LIGHT METALS AND ENVIRONMENTAL SOLUTIONSThe Energy, Light Metals and Environmental Solutions business area consists businesses related to energy (incl. oil shale, oil sands and biomass materials), alumina, alumi-num, and light metals processing. The BA’s environmental solutions include sulfuric acid plants, applications for gas cleaning, and heat recovery systems, as well as in-dustrial water treatment. The acquisition of Edmeston is included in the business area.
SERVICESServices is included in the figures of the three other business areas, and its sales volume is reported separately. The Services business area focuses on growing and developing the service business glob-ally and providing life cycle services.
BUSINESS AREAS

5 Annual Report 2010Outotec Oyj
TeCHnoloGy and seRviCe offeRinG
GrindingFlotationFiltrationPhysical separationThickening and clarificationAnalyzers and process automation
Minerals processing Metallurgical processing
Sintering and pelletizing Smelting and refining Direct and smelting reduction Calcination Roasting and off-gas handling Leaching and solution purification Solvent extraction Electrorefining and electrowinning Process control
ChemicalsSulfuric acid production
Water treatmentNeutralization, effluent treatment, drinking water
EnergyCombustion and gasification, heat recovery, gas handling, bioenergy, oil sand and oil shale processing
Nat
ural
reso
urce
s (o
res,
min
eral
s, e
nerg
y, w
ater
)
Industrial minerals
Copper
Nickel
Zinc
Cobalt
Precious metals
Aluminum
Ferroalloys
DRI/HBI/ Pig iron
Sulfuric acid
Water
Shale oil
Char
Energy
LARGE INSTALLED BASE IN OVER 80 COUNTRIES, DELIVERED OVER THE LAST 100 YEARS
140 non-ferrous smelters•600 sulfuric acid plants•1,000 grinding mills•5,000 flotation units •1,600 thickeners•3,500 filters•12 pelletizing and sintering plants •for chromites9 ferroalloy smelters•400 iron ore sintering plants•60 iron ore pelletizing plants•260 fluidized bed roasting plants•
Outotec is one of the world’s leading technology and service providers for the mining and metals industry. There are a number of players in the sector and Outotec has several competitors in various areas of technology. Outotec’s offering is more extensive than that of its competitors, covering most metals and the entire value chain.
ouToTeC is a TeCHnoloGy CoMpany WiTH offeRinGs aCRoss MineRals and MeTals value CHain and adjaCenT indusTRies
Outotec’s customers include large, globally operating mining companies and metals producers as well as local mining and metals companies. In addi-tion, Outotec serves fertilizer producers, companies in the chemical industry, and companies that utilize alternative energy sources.
Outotec’s competitiveness is based on excellent proprietary technologies, strong process expertise in the entire produc-tion chain, good references, and a solid reputation in delivering large projects and turnkey plants. Outotec plans to lever-age its strong core technologies and competencies to new applications such as energy and industrial water, offering
new attractive growth opportunities with high synergies and manageable risks.
Outotec serves its customers globally. To ensure flexibility and operational effi-ciency, Outotec uses an extensive global subcontractor network for engineering and manufacturing and local experts and subcontractors in projects.
ServicesExpert services, maintenance and spare part services, operations, equipment and plant modernization, long term service contracts

6 Annual Report 2010Outotec Oyj
Ceo’s RevieW
”The year 2010 was eventful for outotec. We started the year with a low order backlog and limited market visibility. Thus, our first priority was to win new orders and secure our profitability. We succeeded very well with these short term targets. in addition, we focused on securing long term success by launching our new operational model as a platform for future growth, defined our strategy for the coming years, and announced new long term financial targets.
6 Annual Report 2010Outotec Oyj

7 Annual Report 2010Outotec Oyj
The year 2010 was eventful for Outotec. We started the year with a low order backlog and limited market visibility. Thus, our first priority was to secure business and profitability. The second key theme was to establish the ele-ments for future growth by launching our new operational model and defining our strategy for the coming years. We have taken significant strides to push all of these matters ahead and I am very satisfied with the results. I am happy to state that despite the challenging start, 2010 turned out to be a successful year for Outotec.
Back on the growth trackAfter a sluggish market in 2009, the industries we serve have returned to investing in new technologies and ser-vices once again, driven by the growing demand for metals and materials in the emerging economies. This has been, no doubt, good news for Outotec.
I am very pleased with the excellent development in our order intake and backlog over the last twelve months. The demand for our technologies has
intensified in all areas and we have received several large orders, includ-ing the delivery of a copper plant for Codelco’s new Mina Ministro Hales mine in Chile, a manganese sinter plant on a turnkey basis for Kalagadi Manganese in South Africa, and a drinking water treat-ment scheme for Sri Lanka. Our sales grew due to the technology and service businesses of the four companies we acquired during the year. The integra-tion of these companies has progressed well and some synergies have already materialized.
Though we started the year with a low order backlog, I am happy to announce that we achieved our 2010 fi-nancial targets thanks to a strong order intake, solid project execution, growing services business, and cost efficiency improvement measures. We success-fully completed several large projects, such as the turnkey delivery of a zinc roasting, gas cleaning and sulfuric acid plant to Votorantim Metais’ Cajamar-quilla operations in Peru, the delivery of new, environmentally sound technology for Shougang’s iron ore pelletizing plant
in Caofeidian, China, and the delivery of copper smelting, slag cleaning, and cobalt recovery technology for Konkola Copper Mines in Zambia. By the end of the year, our order backlog was once again very healthy, which, along with a positive market outlook, has given us a strong start for 2011.
Platform for further growthWe launched a new operational model in April to align our organizational struc-ture with our growth objectives. Outotec now has four business areas, each fo-cusing on growing and developing their respective businesses globally by provid-ing life cycle solutions to our customers. Marketing, sales, and delivery opera-tions in geographical market areas were placed in a global Market Operations organization to strengthen the sales of all of our company’s offerings. The new shared functions are responsible for establishing the operational platforms enabling improved scalability, flexibility, and productivity.
Restructuring the organization and adjusting to new ways of cooperating
has demanded that our personnel be flexible and committed to navigating the new operational model. I am convinced that the path we have chosen is the key to our future competitiveness and growth.
The mission forward In 2010, we re-stated our mission and defined our strategic priorities. The “sustainable use of the Earth’s natural resources” is the mission we believe both our customers and employees can fully embrace and work toward achiev-ing. We want to be the leading provider
buildinG THe plaTfoRM foR fuTuRe GRoWTH
The investments in in new technologies and services returned once again, driven by the
growing
demand for metals and materials
in the emerging economies. This has been, no doubt, good news for Outotec.
Ceo’s RevieW

8 Annual Report 2010Outotec Oyj
Ceo’s RevieW
of sustainable minerals and metals processing solutions as well as an in-novative provider of sustainable energy and water processing solutions.
With the new, long term financial targets, we intend to continue our solid, profitable growth. In terms of sales, our target is to grow faster than the mar-ket, resulting in a compound average annual sales growth target in the range of 10-20%. When it comes to Services, our goal is to grow to EUR 500 million in annual sales by the end of 2015. Our operating profit margin from business operations is targeted to be, on aver-age, at 10%. We also plan to maintain a strong balance sheet to provide opera-tional flexibility and allow for further acquisitions.
We aim to grow both organically and through acquisitions, expanding the scope of deliveries, entering new business areas and introducing new life cycle service offerings.
Providing the best return on the customer’s investment In everything we do, we are commit-ted to generating the highest value for our customers with minimal impact on the environment. Our long experi-
ence, extensive technology offering, and strong in-house R&D mean that we have a unique ability to customize processes for different raw materials, to test and scale up, and, when needed as well as develop totally new processes tailored to our customers’ needs. Once a plant has been designed and built, we support our customers running it smoothly at all times and in refining their opera-tions. For our customers, this means guaranteed performance, improved cost efficiency and quality, shorter delivery times, and faster time to profit. All in all, we promise our customers the best return on their investment.
In addition to continuously enhancing our technology portfolio for the entire value chain - from ore to metals - we plan on expanding into attractive growth industries such as energy and indus-trial water treatment, which have high
technological synergies and manageable risks. We also aim to further bolster our local presence in emerging markets, which currently represent two-thirds of our business.
We also improve our scalability and productivity by developing modular and reusable core products and by establish-ing common processes and tools. We will improve our cost competitiveness by stepping up our global engineering and supply management practices.
Focus in 2011Our efforts to build an integrated global company and a scalable and efficient platform for further growth will con-tinue in 2011. We are also continuously looking for potential acquisition targets to complement our existing technol-ogy portfolio, accelerate growth in new areas, and grow our service business.
I am confident we have all the capabili-ties needed to implement our strategy.
I am proud of our team and the re-sults we were able to deliver and would like to thank our employees for their commitment and excellent work during the demanding year. I would also like to thank both our customers for their trust and business, and our shareholders for their confidence in our work. We stand committed and prepared to continue our legacy of creating a prosperous future for all.
pertti KorhonenPresident and CEO
The “sustainable use of the earth’s natural resources” is the mis-sion we believe both our customers and employees can fully embrace and work toward achiev-ing. We want to be the leading provider of sustainable minerals and metals processing solutions as well as an innovative provider of sustainable energy and water processing solutions.
9 Annual Report 2010Outotec Oyj
sTRaTeGy in aCTion 2010
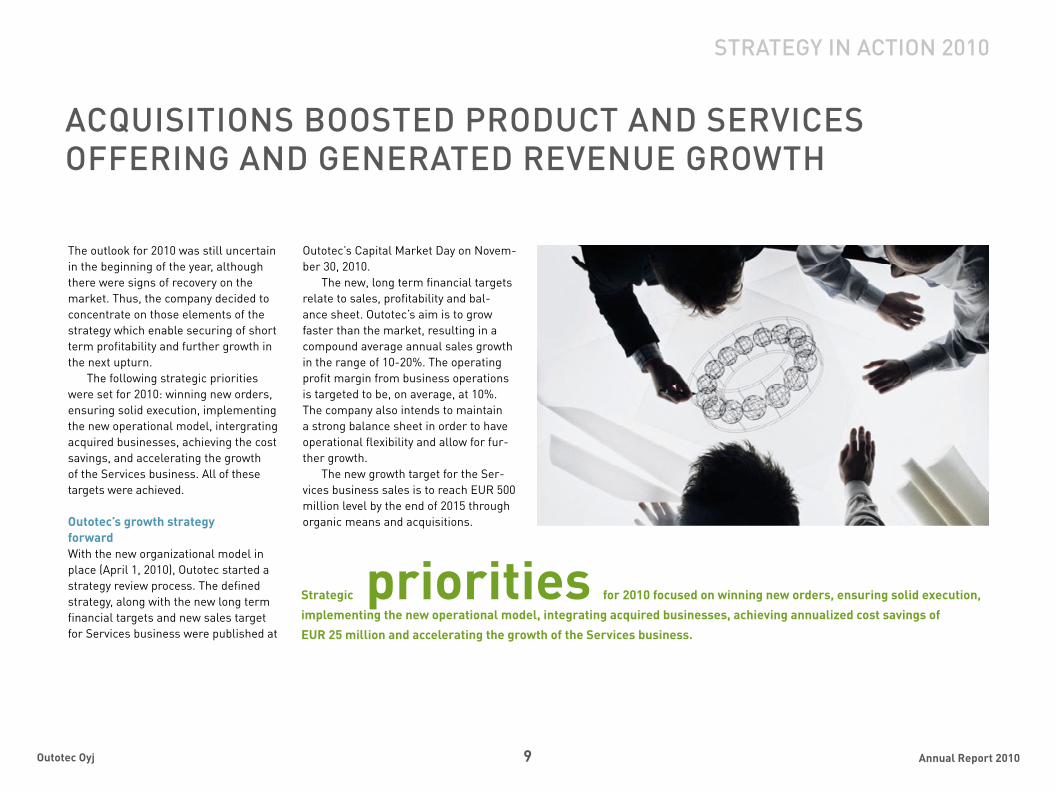
aCquisiTions boosTed pRoduCT and seRviCes offeRinG and GeneRaTed Revenue GRoWTH
The outlook for 2010 was still uncertain in the beginning of the year, although there were signs of recovery on the market. Thus, the company decided to concentrate on those elements of the strategy which enable securing of short term profitability and further growth in the next upturn.
The following strategic priorities were set for 2010: winning new orders, ensuring solid execution, implementing the new operational model, intergrating acquired businesses, achieving the cost savings, and accelerating the growth of the Services business. All of these targets were achieved.
Outotec’s growth strategy forwardWith the new organizational model in place (April 1, 2010), Outotec started a strategy review process. The defined strategy, along with the new long term financial targets and new sales target for Services business were published at
Outotec’s Capital Market Day on Novem-ber 30, 2010.
The new, long term financial targets relate to sales, profitability and bal-ance sheet. Outotec’s aim is to grow faster than the market, resulting in a compound average annual sales growth in the range of 10-20%. The operating profit margin from business operations is targeted to be, on average, at 10%. The company also intends to maintain a strong balance sheet in order to have operational flexibility and allow for fur-ther growth.
The new growth target for the Ser-vices business sales is to reach EUR 500 million level by the end of 2015 through organic means and acquisitions.
Strategic priorities for 2010 focused on winning new orders, ensuring solid execution, implementing the new operational model, integrating acquired businesses, achieving annualized cost savings of EUR 25 million and accelerating the growth of the Services business.
10 Annual Report 2010Outotec Oyj
dRiveRs foR sTRaTeGy
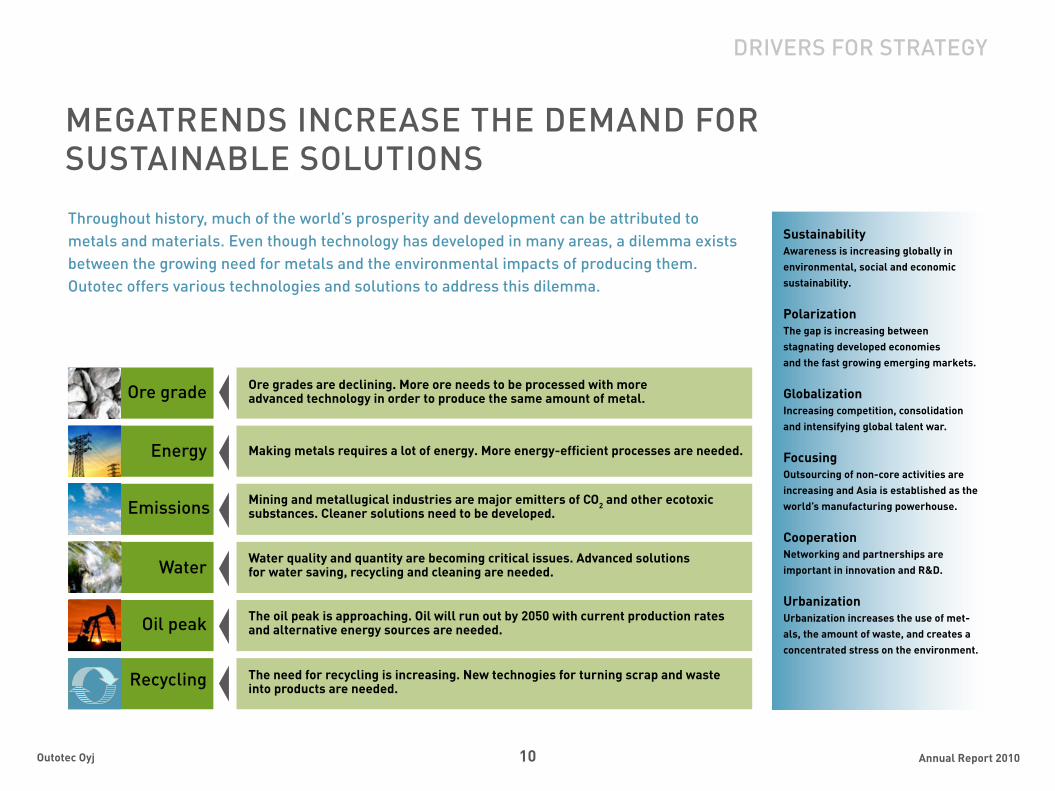
Throughout history, much of the world’s prosperity and development can be attributed to metals and materials. even though technology has developed in many areas, a dilemma exists between the growing need for metals and the environmental impacts of producing them. outotec offers various technologies and solutions to address this dilemma.
MeGaTRends inCRease THe deMand foRsusTainable soluTions
SustainabilityAwareness is increasing globally in environmental, social and economic sustainability.
PolarizationThe gap is increasing between stagnating developed economies and the fast growing emerging markets.
GlobalizationIncreasing competition, consolidation and intensifying global talent war.
FocusingOutsourcing of non-core activities are increasing and Asia is established as the world’s manufacturing powerhouse.
CooperationNetworking and partnerships are important in innovation and R&D.
Urbanization Urbanization increases the use of met-als, the amount of waste, and creates a concentrated stress on the environment.
Ore grades are declining. More ore needs to be processed with more advanced technology in order to produce the same amount of metal.
Making metals requires a lot of energy. More energy-efficient processes are needed.
Mining and metallugical industries are major emitters of CO2 and other ecotoxic substances. Cleaner solutions need to be developed.
Water quality and quantity are becoming critical issues. Advanced solutions for water saving, recycling and cleaning are needed.
The oil peak is approaching. Oil will run out by 2050 with current production rates and alternative energy sources are needed.
The need for recycling is increasing. New technogies for turning scrap and waste into products are needed.
ore grade
energy
emissions
Water
oil peak
Recycling
11 Annual Report 2010Outotec Oyj
GRoWTH sTRaTeGy foRWaRd
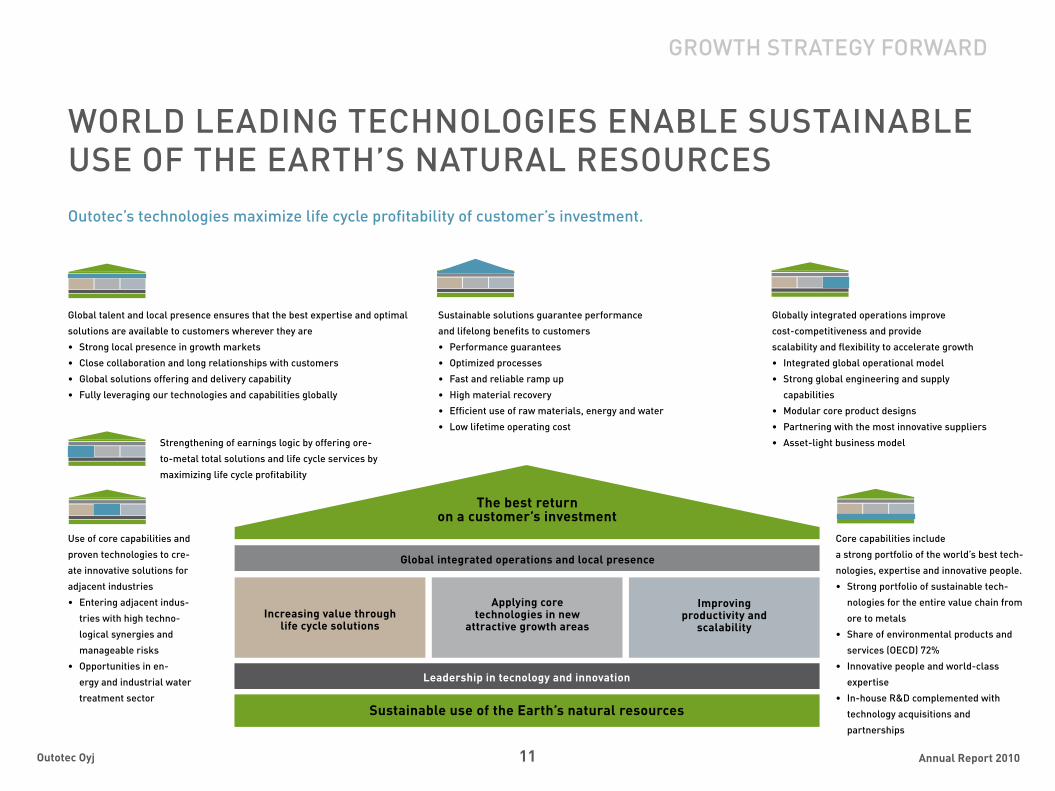
WoRld leadinG TeCHnoloGies enable susTainable use of THe eaRTH’s naTuRal ResouRCes
Global integrated operations and local presence
Leadership in tecnology and innovation
The best return on a customer’s investment
Increasing value through life cycle solutions
Applying core technologies in new
attractive growth areas
Improving productivity and
scalability
Sustainable use of the Earth’s natural resources
outotec’s technologies maximize life cycle profitability of customer’s investment.
sustainable solutions guarantee performance
and lifelong benefits to customers
performance guarantees•
optimized processes•
fast and reliable ramp up•
High material recovery•
efficient use of raw materials, energy and water•
low lifetime operating cost•
Global talent and local presence ensures that the best expertise and optimal
solutions are available to customers wherever they are
strong local presence in growth markets •
Close collaboration and long relationships with customers•
Global solutions offering and delivery capability •
fully leveraging our technologies and capabilities globally•
strengthening of earnings logic by offering ore-
to-metal total solutions and life cycle services by
maximizing life cycle profitability
use of core capabilities and
proven technologies to cre-
ate innovative solutions for
adjacent industries
entering adjacent indus-•
tries with high techno-
logical synergies and
manageable risks
opportunities in en-•
ergy and industrial water
treatment sector
Globally integrated operations improve
cost-competitiveness and provide
scalability and flexibility to accelerate growth
integrated global operational model•
strong global engineering and supply •
capabilities
Modular core product designs•
partnering with the most innovative suppliers•
asset-light business model•
Core capabilities include
a strong portfolio of the world’s best tech-
nologies, expertise and innovative people.
strong portfolio of sustainable tech-•
nologies for the entire value chain from
ore to metals
share of environmental products and •
services (oeCd) 72%
innovative people and world-class •
expertise
in-house R&d complemented with •
technology acquisitions and
partnerships
12 Annual Report 2010Outotec Oyj
Outotec’s customer industries are in the mining and metals processing indus-tries, but the company’s technologies are also applied in other sectors, such as energy production, the fertilizer industry, and the treatment of industrial process waters. Customer investments are driven by developments in the global economy and also by the demand for and prices of metals on world markets. Dur-ing 2010, the global economy recovered even faster than expected and demand for the most important metals increased significantly, causing their price levels to increase.
Several drivers can be seen in Outotec’s customer industries, the most significant of which are the strive for environmentally sustainable technolo-gies, companies focusing on their core areas of competence, networking and the emphasis on cooperation, strong growth of developing countries while the growth in developed countries is evening out, as well as the progress of globaliza-tion. Urbanization increases the need for metals but brings with it further load on the environment.
Toward sustainable developmentThe environmental impact of the mining and metallurgical industries has tra-ditionally been rather high, but invest-
ments in cleaner technologies have also been significant. Several international producers have voluntarily decreased the emissions caused by their produc-tion, in addition to which, efficiency and environmental requirements have been made stricter through legislation. Efficient use of natural resources and recycling will be increasingly important factors in the future. While the growing need for metals is increasing production volumes, the need to decrease emis-sions requires the use of ever more sustainable technology. The significance of energy-efficient and environmentally sound technologies is continuously growing.
Customers focusing on their core competencesAlso in mining and metals industry, companies are increasingly focusing on their core competences and increasing outsourcing. As an example, customer organizations are managing some of their maintenance functions by using their own staff, but interest in outsourc-ing maintenance has increased. The benefits brought about outsourcing services also create a strong business
according to mining companies their investments in mining and metal indus-tries will increase substan-tially in 2011. demand for the most important metals is expected to grow by
4-7%annually.
MaRKeT RevieW
MeTals deMand ConTinues To GRoW
case. The best efficiency of production is secured through a service contract covering the life cycle of plants and equipment. As a part of focusing on their own core areas of competence, com-panies have increased networking with other companies and with training and development organizations in the indus-try. Indeed, an increase in subcontract-ing in production and various forms of collaboration are becoming increasingly commonplace in the industry.

13 Annual Report 2010Outotec Oyj
souTH and CenTRal aMeRiCa
turned towards steady growth.
The region has a large number
of mines and also some metals
industry. brazil is still the re-
gion’s driver for growth and it is
a significant producer of iron ore.
souTH afRiCa has significant
mining production. There are also
plenty of deposits elsewhere in
africa, but their utilization is often
hindered by the lack of infrastruc-
ture and shortages of energy or
water. africa has attracted the
interest of foreign investors, particularly from China, for a long time
but willingness to invest fluctuates due to the continent’s political
and economic instability.
CHina’s economic growth
exceeded again 10% in 2010.
Rapid urbanization and
industrialization are strongly
increasing the demand for
metals. China has extensive
minerals resources and it
controls, among others, the
majority of many special
metal reserves. China is not
self-sufficient in metals which
makes the country the world’s
largest importer of metals and
concentrates.
india has significant mineral
resources, such as iron and
zinc, but in some areas the lack
of energy and water is creating
problems.
sCandinavia saw rapid recov-
ery of the economy, and many
new projects were started in the
mining sector.
MaRKeT RevieW
14 Annual Report 2010Outotec Oyj
Growth from emerging marketsAsia’s fast developing countries, primar-ily China and India, continue to be the drivers of economic growth. The world’s industrial production is increasingly concentrated in Asia to serve the rapidly growing large domestic markets and to supply the word markets with low cost manufacturing. Thus, the major-ity of new metals production capacity is also being constructed in the develop-ing markets. Countries such as Brazil, which supply raw materials, particularly iron ore, to China, are also investing in new capacity.
Competitive landscapeThere are a lot of suppliers in the industry, some of whom only focus on a narrow sector. The consolidation of customer organizations through merg-ers will lead to larger deliveries. This means that the capability to manage broader-scope deliveries brings a significant competitive advantage. By ordering a turnkey plant delivery, cus-tomers are able to give full responsibil-ity for the delivery to a single supplier. In this way, the project can be managed in a more centralized way, it is easier to predict delivery results and, thus, it is also easier to arrange financing.
Clear recovery in the marketsThe demand for metals was increased by the recovery of the automotive and electronics industries, as well as the construction industry. It seems that the industries growing fastest after the
recession are those that contracted the most during it. For example, the global production of passenger cars is estimated to have grown by about 20% during 2010. Also, the long term demand outlook for metals turned more positive, which was seen in higher metals prices and increased interest in investments among customer industries.
The demand for metals grew stron-ger toward the end of the year. As a result, the prices of the most important metals rose sharply. For example, the price of iron ore increased by about 60% and the prices of steel, copper, nickel and gold increased by about 30% during 2010. Only the price of zinc fell during the year, losing about 7% of its value. Also the use of and demand for some previously fairly rare metals increased
strongly. An example of these is palla-dium, which is used in catalytic convert-ers for cars, the price of which rose by as much as 95% during the year. Also, the price of silver, which is used, for in-stance, in the electronics industry, rose significantly. Although metals invento-ries decreased slightly, they remained at a reasonable level. In addition to de-mand, the prices of metals are impacted by the use of metals as investments. It can be concluded from the realized price development that in the opinion of inves-tors, metals production is not sufficient to satisfy ever-increasing demand and it is, therefore, expected that the prices of metals will remain high.
The rise in metals prices and the positive outlook enable profitable production of metals. At the start of the
recession, many metals producers had contracted their production significantly. During 2010, production capacity utiliza-tion rates increased and investments in new production were commenced. Some of the previously closed produc-tion capacity is likely to be inefficient and polluting, so putting it into use requires new technology and modernization. As
MaRKeT RevieW
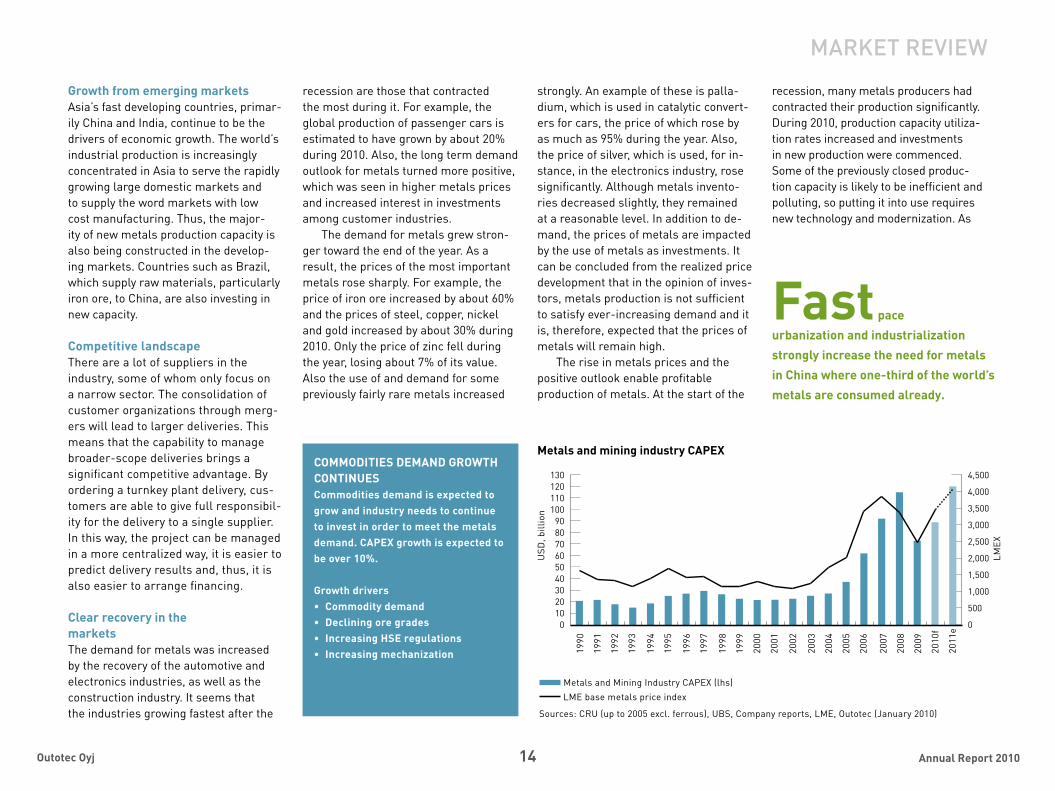
Fast pace urbanization and industrialization strongly increase the need for metals in China where one-third of the world’s metals are consumed already.
COMMODITIES DEMAND GROWTH CONTINUESCommodities demand is expected to grow and industry needs to continue to invest in order to meet the metals demand. CAPEX growth is expected to be over 10%.
Growth driversCommodity demand•Declining ore grades•Increasing HSE regulations•Increasing mechanization•
USD
, bill
ion
LMEX
0102030405060708090100110120130
0
500
1,000
1,500
2,000
2,500
3,000
3,500
4,000
4,500
Metals and mining industry CAPEX
1990
1991
1992
1993
1994
1995
1996
1997
1998
1999
2000
2001
2002
2003
2004
2005
2006
2007
2008
2009
2010
f
2011
e
Metals and Mining Industry CAPEX (lhs)LME base metals price index
Sources: CRU (up to 2005 excl. ferrous), UBS, Company reports, LME, Outotec (January 2010)
15 Annual Report 2010Outotec Oyj
the production utilization rate grew, so did the need for various equipment, plant and maintenance services.
The uncertainty that still prevailed in the financial markets continued to have an impact on the investment opportu-nities of some companies. Decision-making, particularly as regards major projects involving construction of new capacity, takes time. Financiers’ and regulators’ interest in the environmental impacts continues to grow and, almost without exception, they place strict requirements on the technology used when considering the preconditions for executing projects.
The globe as the marketOutotec serves its customers globally. The company has offices on all conti-nents, in a total of 24 countries, and de-liveries to more than 80 countries. The focus in the growth of metals consump-tion and the construction of additional capacity has shifted considerably over the past decade. The greatest growth potential lies in the emerging markets such as China, India, Russia, and other CIS countries, as well as Latin America. In contrast, in Europe, North America, Africa, and Australia, demand for metals has been more even.
A boost for Asia’s growthThe rate of China’s economic growth rose again, exceeding 10% in 2010. The strong growth was supported by the country’s population of 1.3 billion and its excellent investment capability, both
in the private and public sectors. Rapid urbanization and industrialization are strongly increasing the demand for met-als in China, which already consumes about a third of the world’s metals. China has extensive minerals resources and it controls, among others, the majority of many special metal reserves. China is not self-sufficient in met-als, which makes it the world’s largest importer of metals and concentrates. Modern Chinese companies are eager to acquire the latest technology to secure their business operations today, with an eye on tomorrow’s tighter environmen-tal regulations, as China joins global climate agreements. Chinese companies have also actively sought to acquire min-ing companies outside the borders of their country.
India’s growth rate rose again to nearly 10% in 2010. Due to economic reforms and the construction of infra-structure, the development of India has continued to be positive for more than ten years. In India, growth is also supported by a population of 1.1 bil-lion, whose buying power is increasing rapidly. India has significant mineral resources, such as iron and zinc, but in some areas, a lack of energy and water is creating problems in utilizing those resources. India’s competitiveness has clearly strengthened in recent decades, and the country’s industrialization re-quires continuous investments into new technology.
MaRKeT RevieW
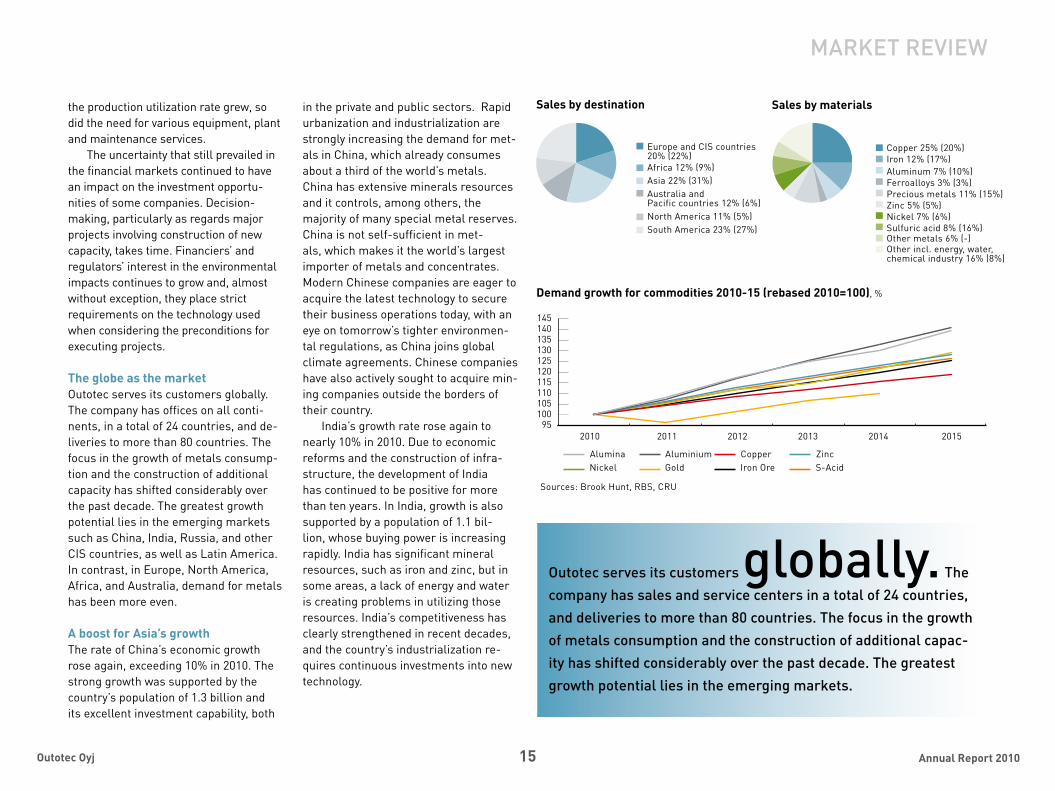
Demand growth for commodities 2010-15 (rebased 2010=100), %
Alumina Aluminium Copper Zinc
outotec serves its customers globally. The company has sales and service centers in a total of 24 countries, and deliveries to more than 80 countries. The focus in the growth of metals consumption and the construction of additional capac-ity has shifted considerably over the past decade. The greatest growth potential lies in the emerging markets.
Europe and CIS countries20% (22%)
North America 11% (5%)
Asia 22% (31%)Africa 12% (9%)
South America 23% (27%)
Australia and Pacific countries 12% (6%)
Sales by destination Sales by materials
Other metals 6% (-) Sulfuric acid 8% (16%) Nickel 7% (6%) Zinc 5% (5%) Precious metals 11% (15%) Ferroalloys 3% (3%) Aluminum 7% (10%) Iron 12% (17%) Copper 25% (20%)
Other incl. energy, water, chemical industry 16% (8%)
95100105110115120125130135140145
2010 2011 2012 2013 2014 2015
Nickel Gold Iron Ore S-Acid
Sources: Brook Hunt, RBS, CRU

16 Annual Report 2010Outotec Oyj
New projects in EuropeIn Europe, economic development was uneven but positive as a whole, and the economies of many countries have already begun to recover. The region’s mining and metals production developed moderately well and, in the area of Scan-dinavia, in particular, many new projects were started. Elsewhere in Europe, investments were often focused on the modernization and expansion of exist-ing plants. The markets also developed favorably in Eastern Europe and on the Iberian peninsula. There is a relatively large amount of mineral deposits in Europe, and the majority of the region’s production plants are efficient and modern.
The Russian economy, which leans strongly on private consumption, began its recovery in 2010 and achieved annual growth of about 5%. Investments in the corporate sector were held back by stricter terms for financing. In mining and metals production, the development of the most significant CIS countries was also positive. The region is industrial-izing and there is still plenty of growth potential. Russia and many of the CIS countries are rich in natural resources and they control a significant proportion of the world’s gas and oil reserves, as well as uranium, coal, and precious metal reserves. The utilization of these requires new production plants and the modern-ization of existing plants.
Uneven development in the AmericasThe economies of South and Central America turned towards steady growth.
The region has a large number of mines and also some metal industry. Brazil is still the region’s driver for growth and it is a significant producer of iron ore. Chile, Peru, and Mexico all have significant min-ing operations as well as and basic met-als production. However, many countries rich in mineral resources face other challenges, such as the availability of water and energy. There is also growth potential in North America but there the prevailing period of slow growth has so far kept investment levels low.
Energy efficiency plays a major role in Africa There is a significant amount of mining production in South Africa. There are also plenty of deposits elsewhere in Africa, but their utilization is often hindered by
the lack of infrastructure and shortages of energy or water. Indeed, Africa has attracted the interest of foreign investors, particularly from China, for a long time, but willingness to invest fluctuates due to the continent’s political and economic instability.
Iron ore projects increasing in AustraliaThe rapid development of Australia’s mining industry, which has continued for a long time, is particularly apparent in the continuous growth of iron ore produc-tion capacity and related infrastructure projects
Demand growing furtherThe demand for metals is expected to grow significantly in the near future.
The greatest demand still comes from developing countries in which construc-tion is strong and where the automotive and electronics industries are grow-ing rapidly. In addition, the recovery of developed economic regions will increase the demand for metals. According to the forecasts, investments in the mining and metal industries will increase substan-tially during 2011, reaching even the previous peak level seen in 2008. Also demand for the most important metals is expected to grow by 4-7% annually.
Despite the capacity increases over the last few years, metals production is not sufficient to satisfy the continuously growing demand. Indeed, companies in the mining and metals industries will need to both increase their production and make it more efficient. Tightening ef-ficiency and environmental requirements and the decreasing metal content of ore bodies continue to attract investments in plant modernization, optimization, and increased automation. Rising energy prices are also driving the industry to improve processes in order to achieve lower unit costs.
MaRKeT RevieW
The president of Mongolia, Mr. elbegdorj Tsakhia, visited outotec in october and discussed plans
to build an industrial complex to add value to the oyu Tolgoi copper deposit and to diversify the
economy.

17 Annual Report 2010Outotec Oyj
non-ferrous solutions business area is the
market leader in several technologies and one of the leading technology suppliers in the entire industry.
non-feRRous soluTions
17 Annual Report 2010Outotec Oyj

18 Annual Report 2010Outotec Oyj
Non-ferrous Solutions business area offers world-leading sustainable pro-cessing technologies for the processing of non-ferrous ores to metals – cover-ing the entire value chain. Its advanced technologies are used to process copper, nickel, zinc, lead, gold, silver, platinum
metals, and industrial minerals. The of-fering includes proprietary technologies, engineering, production equipment, sys-tem integrations, project deliveries, as well as training, maintenance, and spare parts services. Delivery scopes may vary from single equipment to large process
solutions and plants as well as services. The business area’s world-wide custom-er base consists of mining companies, non-ferrous metals producers, as well as engineering companies.
0
150
300
450
600
750
Sales, EUR million
06 07 08 09 10
0
13
26
39
52
65
Operating profit, EUR million
06 07 08 09 10
non-feRRous soluTions
sTRonG pRoCess TeCHnoloGy poRTfolio foR THe oRe-To-MeTal value CHain
411.2
556.8666.8
482.6
623.3
26.125.8
63.5 61.8
35.1
Growth from acquired businesses and servicesThe positive market trend that had al-ready begun at the end of 2009 continued in 2010. Demand at the beginning of the year was still quite weak, but the activity picked up during the year. Customers
50.6 *)
*) excluding one-time items and PPA amortizations
non-ferrous solutions business area’s offering includes proprietary technologies. delivery scopes may vary from single equipment to large process solu-
tions and plants as well as services.
19 Annual Report 2010Outotec Oyj
non-feRRous soluTions
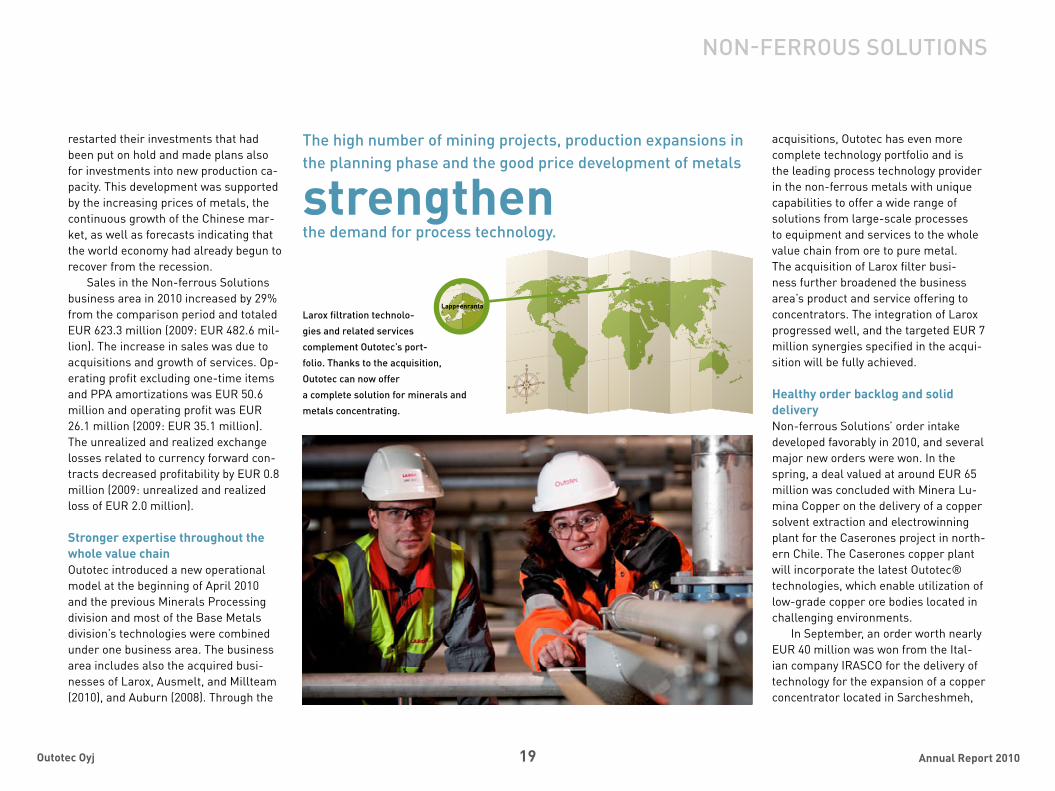
larox filtration technolo-
gies and related services
complement outotec’s port-
folio. Thanks to the acquisition,
outotec can now offer
a complete solution for minerals and
metals concentrating.
Lappeenranta
restarted their investments that had been put on hold and made plans also for investments into new production ca-pacity. This development was supported by the increasing prices of metals, the continuous growth of the Chinese mar-ket, as well as forecasts indicating that the world economy had already begun to recover from the recession.
Sales in the Non-ferrous Solutions business area in 2010 increased by 29% from the comparison period and totaled EUR 623.3 million (2009: EUR 482.6 mil-lion). The increase in sales was due to acquisitions and growth of services. Op-erating profit excluding one-time items and PPA amortizations was EUR 50.6 million and operating profit was EUR 26.1 million (2009: EUR 35.1 million). The unrealized and realized exchange losses related to currency forward con-tracts decreased profitability by EUR 0.8 million (2009: unrealized and realized loss of EUR 2.0 million).
Stronger expertise throughout the whole value chainOutotec introduced a new operational model at the beginning of April 2010 and the previous Minerals Processing division and most of the Base Metals division’s technologies were combined under one business area. The business area includes also the acquired busi-nesses of Larox, Ausmelt, and Millteam (2010), and Auburn (2008). Through the
acquisitions, Outotec has even more complete technology portfolio and is the leading process technology provider in the non-ferrous metals with unique capabilities to offer a wide range of solutions from large-scale processes to equipment and services to the whole value chain from ore to pure metal. The acquisition of Larox filter busi-ness further broadened the business area’s product and service offering to concentrators. The integration of Larox progressed well, and the targeted EUR 7 million synergies specified in the acqui-sition will be fully achieved.
Healthy order backlog and solid deliveryNon-ferrous Solutions’ order intake developed favorably in 2010, and several major new orders were won. In the spring, a deal valued at around EUR 65 million was concluded with Minera Lu-mina Copper on the delivery of a copper solvent extraction and electrowinning plant for the Caserones project in north-ern Chile. The Caserones copper plant will incorporate the latest Outotec® technologies, which enable utilization of low-grade copper ore bodies located in challenging environments.
In September, an order worth nearly EUR 40 million was won from the Ital-ian company IRASCO for the delivery of technology for the expansion of a copper concentrator located in Sarcheshmeh,
The high number of mining projects, production expansions in the planning phase and the good price development of metals
strengthen the demand for process technology.

20 Annual Report 2010Outotec Oyj
Iran. The deliveries scheduled for 2012 include the design of the concentrator’s grinding and thickening circuits, equip-ment deliveries, as well as installation supervision and training services.
A deal valued at over EUR 20 million was concluded with the First Quantum Minerals Limited Projects Office based in Australia on the delivery of flotation, thickening, and automation technolo-gies for several projects around the world. The deal includes delivery of 14 Outotec TankCell® 300 flotation cells and 54 smaller TankCell® cells to the Kevitsa nickel and copper concentra-tor in Sodankylä in northern Finland, as well as delivery of six Tankcell® 300 cells to the Kansanshi copper and cobalt concentrator in Zambia. Advanced auto-mation technology will also be delivered to the Guelb Moghrein gold and copper concentrator in Mauritania in order to optimize the flotation process.
In the spring, a deal was concluded with Tongling Non-Ferrous Metals Group on the design and delivery of a copper smelter to be built in Jingchang, China, in 2012. The deal, approximately EUR 15 million, covers licenses for both Outotec Flash Smelting and Kennecott-Outotec Flash Converting technologies, basic plant engineering, and all key equipment for smelting and converting. Tongling chose Outotec’s flash smelting/flash converting process because it is the cleanest solution available.
In September, Konkola Copper Mines placed an order worth approximately
EUR 13 million for the delivery of an electric furnace to the Chingola cop-per smelter in Zambia. The deal also includes a service agreement. Boliden ordered Kaldo furnace technology for the Rönnskär copper smelter in Sweden. The delivery is part of the expansion of Boliden’s electronic scrap recycling plant. Furthermore, a deal worth of approximately EUR 6 million was con-cluded at the beginning of the year with Baiyin Non-Ferrous Group on the design and delivery of a new precious metals plant in Gansu Province, China.
Project deliveries were carried out as planned, and delivery times normalized.
Opportunities for acquisitions in the marketOutotec’s market is fragmented, and a number of different players operate in it. Outotec is a market leader in several non-ferrous metals technologies and one of the leading technology suppliers in the entire industry. It has a strong market position globally, but varies depending on the product and region. The markets have plenty of growth op-
portunities, and the goal is to grow both organically and through acquisitions. The aim is to strengthen the business by further expanding the process technol-ogy offering in the entire value chain, investing in the development of the services business, and strengthen the presence in all geographical markets.
The high number of mining proj-ects and production expansions in the planning phase, in addition to the good metals price development strengthen the demand for process technology. Even though there is still uncertainty in the financial markets, the need for ad-ditional metals production capacity and especially more efficient and cleaner technologies are on the rise.
Although there is strong competition for new orders, Outotec is well-equipped to support its market position with its strong and wide process technology portfolio that enables the company to give customers performance guaran-tees. These guarantees are related to important process parameters such as recovery rates, energy consumption and emission levels, which are all important and leading to the lowest possible life time operational costs. This gives Outo-tec a unique advantage on the market.
The markets picked up towards the end of the year and new orders were won. The strong order backlog provides a solid starting point for the year 2011.
non-feRRous soluTions
ausmelt allows outotec to offer sustainable solutions for ferrous metals, zinc, lead, and tin concen-
trates, zinc bearing residues, recycling, and various secondary and waste materials.
21 Annual Report 2010Outotec Oyj
non-feRRous soluTions
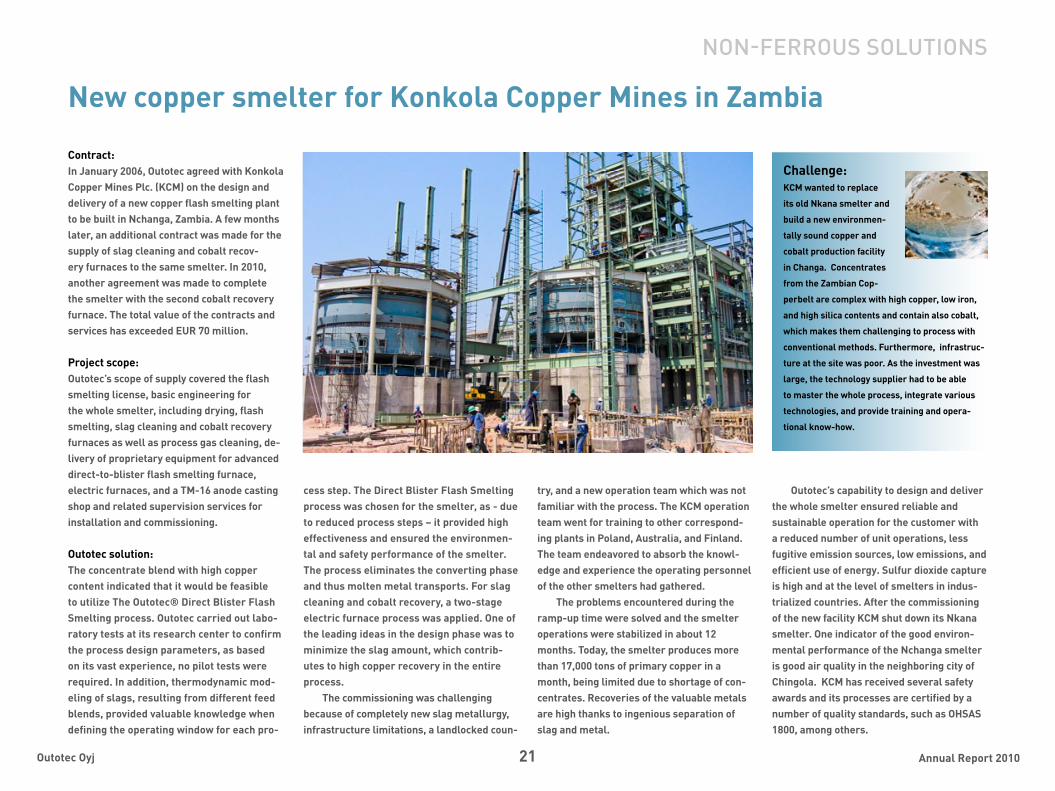
New copper smelter for Konkola Copper Mines in Zambia
Challenge:KCM wanted to replace
its old Nkana smelter and
build a new environmen-
tally sound copper and
cobalt production facility
in Changa. Concentrates
from the Zambian Cop-
perbelt are complex with high copper, low iron,
and high silica contents and contain also cobalt,
which makes them challenging to process with
conventional methods. Furthermore, infrastruc-
ture at the site was poor. As the investment was
large, the technology supplier had to be able
to master the whole process, integrate various
technologies, and provide training and opera-
tional know-how.
Contract:In January 2006, Outotec agreed with Konkola Copper Mines Plc. (KCM) on the design and delivery of a new copper flash smelting plant to be built in Nchanga, Zambia. A few months later, an additional contract was made for the supply of slag cleaning and cobalt recov-ery furnaces to the same smelter. In 2010, another agreement was made to complete the smelter with the second cobalt recovery furnace. The total value of the contracts and services has exceeded EUR 70 million.
Project scope:Outotec’s scope of supply covered the flash smelting license, basic engineering for the whole smelter, including drying, flash smelting, slag cleaning and cobalt recovery furnaces as well as process gas cleaning, de-livery of proprietary equipment for advanced direct-to-blister flash smelting furnace, electric furnaces, and a TM-16 anode casting shop and related supervision services for installation and commissioning.
Outotec solution:The concentrate blend with high copper content indicated that it would be feasible to utilize The Outotec® Direct Blister Flash Smelting process. Outotec carried out labo-ratory tests at its research center to confirm the process design parameters, as based on its vast experience, no pilot tests were required. In addition, thermodynamic mod-eling of slags, resulting from different feed blends, provided valuable knowledge when defining the operating window for each pro-
cess step. The Direct Blister Flash Smelting process was chosen for the smelter, as - due to reduced process steps – it provided high effectiveness and ensured the environmen-tal and safety performance of the smelter. The process eliminates the converting phase and thus molten metal transports. For slag cleaning and cobalt recovery, a two-stage electric furnace process was applied. One of the leading ideas in the design phase was to minimize the slag amount, which contrib-utes to high copper recovery in the entire process.
The commissioning was challenging because of completely new slag metallurgy, infrastructure limitations, a landlocked coun-
try, and a new operation team which was not familiar with the process. The KCM operation team went for training to other correspond-ing plants in Poland, Australia, and Finland. The team endeavored to absorb the knowl-edge and experience the operating personnel of the other smelters had gathered.
The problems encountered during the ramp-up time were solved and the smelter operations were stabilized in about 12 months. Today, the smelter produces more than 17,000 tons of primary copper in a month, being limited due to shortage of con-centrates. Recoveries of the valuable metals are high thanks to ingenious separation of slag and metal.
Outotec’s capability to design and deliver the whole smelter ensured reliable and sustainable operation for the customer with a reduced number of unit operations, less fugitive emission sources, low emissions, and efficient use of energy. Sulfur dioxide capture is high and at the level of smelters in indus-trialized countries. After the commissioning of the new facility KCM shut down its Nkana smelter. One indicator of the good environ-mental performance of the Nchanga smelter is good air quality in the neighboring city of Chingola. KCM has received several safety awards and its processes are certified by a number of quality standards, such as OHSAS 1800, among others.

22 Annual Report 2010Outotec Oyj
The ferrous solutions plans to expand its offering to cover the whole production chain from ore to metal and use more widely its
skills and ability in the delivery of large projects.
feRRous soluTions
22 Annual Report 2010Outotec Oyj

23 Annual Report 2010Outotec Oyj
The Ferrous Solutions business area offers sustainable technologies for the processing of iron and ferroalloys. Its customers are producers of concen-trates, pellets, sinter, direct-reduced iron, hot-briquetted iron, steel, ferroalloys, and titanium feedstock.
The offering of the business area includes feasibility studies, engineering,
process equipment, automation, project implementation, and services cover-ing the life cycle of a plant. Its special expertise encompasses beneficiation, pelletizing and sintering, direct reduc-tion and smelting technologies. Due to their energy efficiency and environmental soundness, many of the processes devel-oped by the business area are rated best
available technologies (BAT) according to the EU’s classification.
Consumption of steel on the riseThe markets were quiet at the turn of the year but they started to pick up in early 2010, and the recovery of the steel industry continued until the end of the year as the demand for steel increased.
0
60
120
180
240
300
Sales, EUR million
06 07 08 09 10
0
10
20
30
40
Operating profit, EUR million
06 07 08 09 10
leadeR in iRon and feRRoalloy TeCHnoloGies
feRRous soluTions
131.5
12.6 *)
189.7
256.4
192.4
146.7
32.5
22.9
28.5
9.5
about two-thirds of the global pellet production derives from outotec’s leading technology with guaranteed high quality and low operational costs.
samarco in brazil is the world’s largest pelletizing plant with annual capacity of 7.25 million tonnes.
Furthermore, the strong rise in prices and smaller inventories encouraged customers to invest again.
The World Steel Association, which is an organization representing steel producers, estimated that, in 2010, steel consumption increased by over 13% and the price of iron ore doubled. Getting financing continued to be challenging
11.3
*) excluding one-time items

24 Annual Report 2010Outotec Oyj
The markets started to pick up in early 2010, and the recovery of the steel industry continued until the end of the year. The demand for steel increased. furthermore, the strong rise in prices and smaller inventories encouraged customers to invest again.
outotec is building one
of the world’s largest
manganese ore sinter
plants for Kalagadi
Manganese company
in south africa.
feRRous soluTions
in general due to the uncertainties of the money markets, but the favorable long-term outlook on the price develop-ment of metals supported the decisions on the construction of additional capac-ity. The activation of customers was also visible as a clear increase in the number of enquiries and tender requests in the business area. The demand for services, too, increased toward the end of the year.
Sales in the Ferrous Solutions busi-ness area in 2010 totaled EUR 131.5 mil-lion (2009: EUR 146.7 million). The 10% decrease in sales compared to 2009 was due to fewer projects in the active deliv-ery phase. The operating profit excluding one-time items was EUR 12.6 million and operating profit was EUR 11.3 million (2009: EUR 9.5 million). In the second half of 2010, project completions and final acceptances by customers improved the business area’s profitability. Higher sales and marketing expenses and one-time items related to the savings program had a negative impact on the operating profit.
Benefits from focused operationsFerrous Solutions was created by combining iron ore processing and fer-roalloy production technologies into one business area in the reorganization that took place in the spring. The new orga-nizational structure enables advanced specialization in iron and ferroalloy tech-nologies and their development. The aim is to achieve larger-scale deliveries to the whole value chain starting from concen-
India. The deal covers the technology fee and the delivery of equipment based on proprietary product development.
In March, the South African company Kalagadi Manganese ordered a sinter plant worth EUR 119 million. The plant commissioning is scheduled for 2012. With an annual production of 2.4 tons of sinter, the plant will be one of the world’s largest manganese ore sinter plants. Outotec’s turnkey delivery includes plant engineering, project management, delivery of equipment and steel struc-tures, construction, start-up, and general supervising services related to construc-tion. In April, Ferrous Solutions won an order to deliver pelletizing technology for
Kalagadi
trates. A more focused operational model also helps improve management of customer relationships and utilize econo-mies of scale in acquisitions and logistics.
Large sinter plants in India Ferrous Solutions’ deliveries went smoothly during the year, and many new orders were won, reflecting Outotec’s leadership position in agglomeration technology. In February, a deal was concluded with JSW Steel Limited (JSW) on the delivery of technology to JSW’s new iron ore sinter plant in Toranagallu,

25 Annual Report 2010Outotec Oyj
feRRous soluTions
the expansion of the Bhushan steel plant in India.
More major orders were won in August. An order worth EUR 28 million was received from Australia’s Karara Iron Ore Project for the design of the flotation circuit of an iron concentrator as well as the equipment delivery and filtration systems related to it. In addition, a deal valued at approximately EUR 17 million was concluded with RB Met Engineering (Pty) Ltd and Xstrata Merafe PSV on the delivery of chromite ore sintering tech-nology to Xstrata Merafe’s ferrochrome plant located in Rustenburg, South Africa.
Toward the end of the fall, the busi-ness area won order for the delivery of an iron ore sinter plant to India. The order for the Bhilai steel plant of the Steel Authority of India (SAIL) covers turnkey delivery in consortium with Larsen & Toubro Ltd. Another order came from Outokumpu Oyj for the delivery of a sinter plant and a ferrochrome smelter for the expansion of Tornio’s plant in Finland. The value of Outokumpu’s order is approximately EUR 45 million, and the delivery will double ferrochrome produc-tion capacity in Tornio. Outokumpu’s stainless steel production plant located in Tornio is one of the most modern and most efficient in the world. The deliveries are scheduled for 2011 and the first half of 2012.
Brighter times aheadOutotec has delivered all the larg-est pelletizing and sinter plants in the
world, being the clear market leader. The strong expertise of the business area and continuous development of advanced technologies will enable success in the future as well. Research and develop-ment in close cooperation with custom-ers guarantee the most efficient possible use of raw material, the safest process, and the best final result for the customer.
The goal of the business area is to grow by utilizing its proven skills and improved ability in the delivery of large
projects as well as by expanding its tech-nology offering to cover the whole pro-duction chain from ore to metal. Growth is also sought by developing a technologi-cal head start in direct reduction plants and smelters as well as by maintaining its position as the leading provider of fer-rochrome technologies.
Especially the trend at the end of the year suggests that the markets will continue to grow. The higher utilization rates of metal production plants and
the increasing prices of metals support the demand. Furthermore, some of the production plants use old technology that will have to be updated in the near future. The higher utilization rate of plants also causes the need for different services to increase.
The large number of projects under negotiation and the received orders in 2010 give reason to believe that current year will enable both growth and higher profitability.
outotec is the clear market leader in iron ore pelletizing and sintering technologies as well as ferroalloy production technologies.

26 Annual Report 2010Outotec Oyj
Contract:Outotec agreed in April, 2008 with Shou-gang Jingtang United Iron & Steel Co. Ltd on the delivery of new environmentally sound technology for Shougang’s iron ore pellet-izing plant to be built in Caofeidian, China. The contract value was approximately EUR 29 million. Project scope:Outotec’s scope of delivery covered the basic and detail engineering, supply of proprietary equipment, instrumentation and control sys-tems, supervisory services for erection and commissioning as well as related technical training.
Outotec solution:Outotec started the engineering work for the first larger size plant in China using modern travelling grate technology. The pellet indu-rating furnace, which is the core of the plant and Outotec’s proprietary technology, has a grate area of 504 m² and an annual capacity of over 4 million tonnes of iron oxide pellets. The equipment supplies started in late 2008. Part of the equipment, services and engi-neering were sourced locally from China. The construction of the new plant went smoothly.
The new plant started operation in mid 2010 and after less than six weeks from the first pellets Outotec received the final acceptance from Shougang. The plant was basically ready from day one to operate at
Modern iron ore pelletizing technology to Caofeidian, China
nominal load, thanks to the experienced proj-ect, engineering, and commissioning team. It is the first plant which uses Coke Oven gas as a fuel, which is a novelty for travelling grate plants and challenged Outotec’s execution team. The fully automated burner system works to the full satisfaction of the customer and Outotec.
Investing in the latest technology creates several benefits for Shougang, such as better recoveries and larger output, lower energy and water consumption, lower emissions, and improved working conditions. Today, these are decisive factors in industrial investments in China.
Challenge:Chinese steel giant
Shougang wanted to
relocate all of its steel-
related operations
from Beijing city by
2010 – in less than two
years - and build a new pelletizing plant in
Caofeidian using modern, environmentally
sound technology.
Commissioning team of Caofeidian.
feRRous soluTions
27 Annual Report 2010Outotec Oyj
energy, light Metals and environmental solutions develops
clean and efficient processing methods for alternative energy sources, alumina and aluminum, sulfuric acid as well as industrial water treatment.
eneRGy, liGHT MeTals and enviRonMenTal soluTions
27 Annual Report 2010Outotec Oyj
28 Annual Report 2010Outotec Oyj
The Energy, Light Metals and Environ-mental Solutions business area develops and delivers solutions for the produc-tion of energy, alumina, aluminum, and light metals. For energy, the focus is on developing clean and efficient produc-tion methods for sources such as oil shale, oil sand, and renewable energy. The environmental solutions include sulfuric acid plants, applications for gas
cleaning and heat recovery as well as the treatment of industrial and municipal wastewater.
The scope of deliveries ranges from feasibility studies, plant audits, and plant debottlenecking to technology packages and lump-sum turnkey plant deliveries. Outotec’s broad and world-wide cus-tomer base includes companies in the aluminum industry, the metallurgical
industry, and the fertilizer and pigment industry as well as in energy production.
Cautious recoveryA cautious recovery in demand began during 2010 and activity increased, particularly in South America and the Middle East. Interest in water and energy technologies has clearly strengthened around the world. Sales in the Energy,
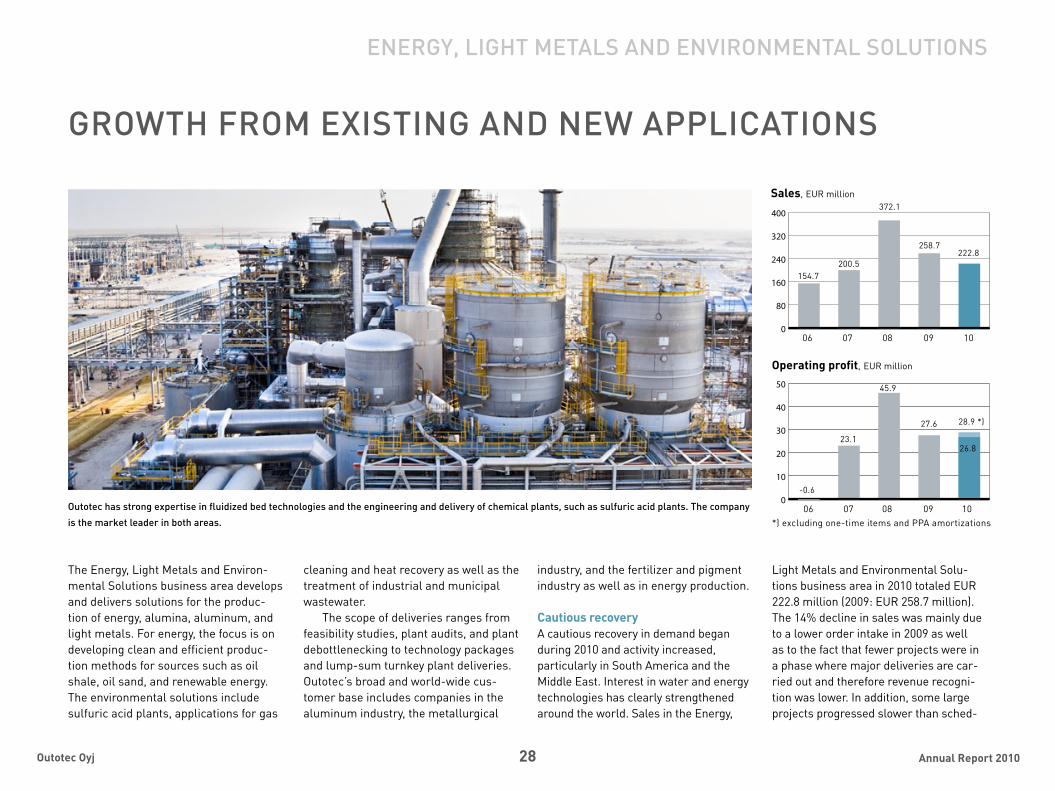
outotec has strong expertise in fluidized bed technologies and the engineering and delivery of chemical plants, such as sulfuric acid plants. The company
is the market leader in both areas.
0
80
160
240
320
400
Sales, EUR million
06 07 08 09 10
0
10
20
30
40
50
Operating profit, EUR million
06 07 08 09 10
eneRGy, liGHT MeTals and enviRonMenTal soluTions
GRoWTH fRoM exisTinG and neW appliCaTions
154.7200.5
372.1
258.7222.8
-0.6
23.1
45.9
27.6 28.9 *)
Light Metals and Environmental Solu-tions business area in 2010 totaled EUR 222.8 million (2009: EUR 258.7 million). The 14% decline in sales was mainly due to a lower order intake in 2009 as well as to the fact that fewer projects were in a phase where major deliveries are car-ried out and therefore revenue recogni-tion was lower. In addition, some large projects progressed slower than sched-
26.8
*) excluding one-time items and PPA amortizations
29 Annual Report 2010Outotec Oyj
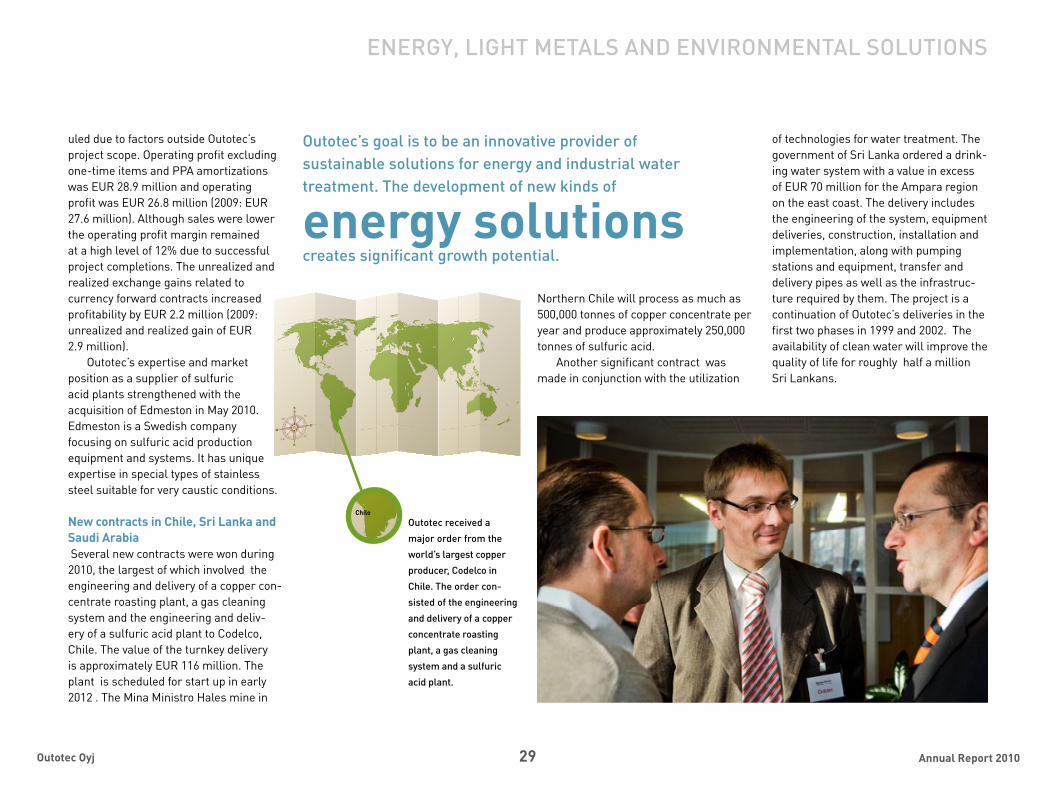
outotec’s goal is to be an innovative provider of sustainable solutions for energy and industrial water treatment. The development of new kinds of
energy solutionscreates significant growth potential.
outotec received a
major order from the
world’s largest copper
producer, Codelco in
Chile. The order con-
sisted of the engineering
and delivery of a copper
concentrate roasting
plant, a gas cleaning
system and a sulfuric
acid plant.
Chile
eneRGy, liGHT MeTals and enviRonMenTal soluTions
uled due to factors outside Outotec’s project scope. Operating profit excluding one-time items and PPA amortizations was EUR 28.9 million and operating profit was EUR 26.8 million (2009: EUR 27.6 million). Although sales were lower the operating profit margin remained at a high level of 12% due to successful project completions. The unrealized and realized exchange gains related to currency forward contracts increased profitability by EUR 2.2 million (2009: unrealized and realized gain of EUR 2.9 million).
Outotec’s expertise and market position as a supplier of sulfuric acid plants strengthened with the acquisition of Edmeston in May 2010. Edmeston is a Swedish company focusing on sulfuric acid production equipment and systems. It has unique expertise in special types of stainless steel suitable for very caustic conditions.
New contracts in Chile, Sri Lanka and Saudi Arabia Several new contracts were won during 2010, the largest of which involved the engineering and delivery of a copper con-centrate roasting plant, a gas cleaning system and the engineering and deliv-ery of a sulfuric acid plant to Codelco, Chile. The value of the turnkey delivery is approximately EUR 116 million. The plant is scheduled for start up in early 2012 . The Mina Ministro Hales mine in
Northern Chile will process as much as 500,000 tonnes of copper concentrate per year and produce approximately 250,000 tonnes of sulfuric acid.
Another significant contract was made in conjunction with the utilization
of technologies for water treatment. The government of Sri Lanka ordered a drink-ing water system with a value in excess of EUR 70 million for the Ampara region on the east coast. The delivery includes the engineering of the system, equipment deliveries, construction, installation and implementation, along with pumping stations and equipment, transfer and delivery pipes as well as the infrastruc-ture required by them. The project is a continuation of Outotec’s deliveries in the first two phases in 1999 and 2002. The availability of clean water will improve the quality of life for roughly half a million Sri Lankans.
30 Annual Report 2010Outotec Oyj
eneRGy, liGHT MeTals and enviRonMenTal soluTions
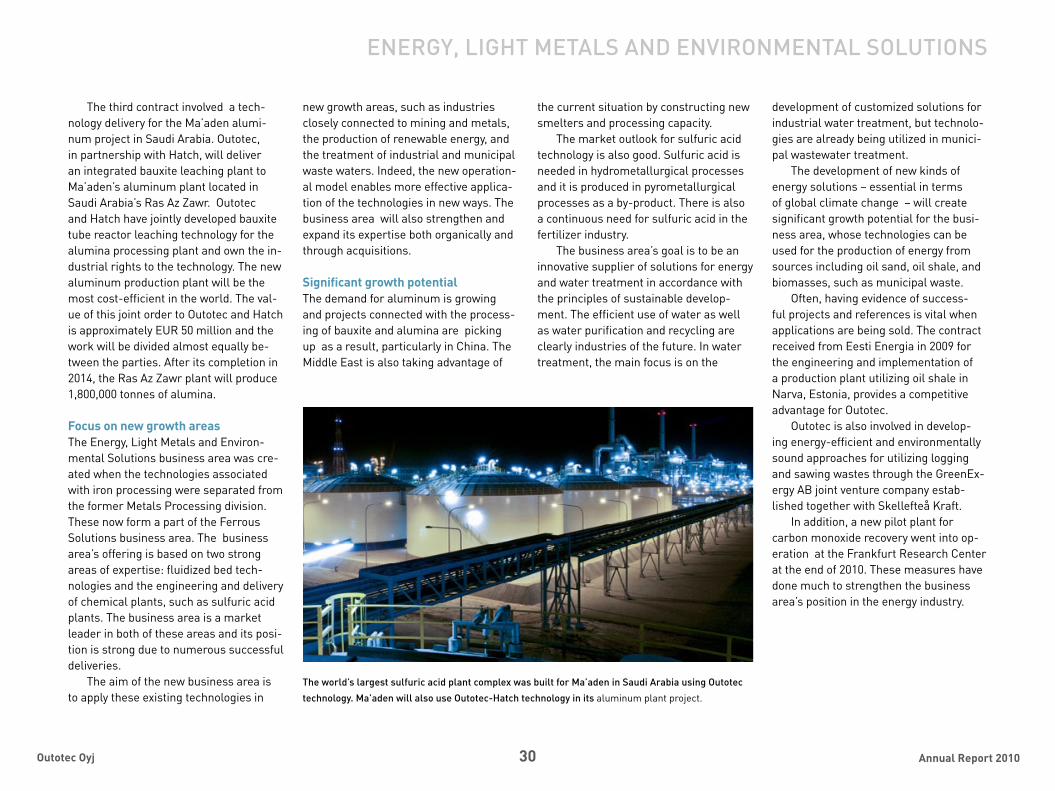
The third contract involved a tech-nology delivery for the Ma’aden alumi-num project in Saudi Arabia. Outotec, in partnership with Hatch, will deliver an integrated bauxite leaching plant to Ma’aden’s aluminum plant located in Saudi Arabia’s Ras Az Zawr. Outotec and Hatch have jointly developed bauxite tube reactor leaching technology for the alumina processing plant and own the in-dustrial rights to the technology. The new aluminum production plant will be the most cost-efficient in the world. The val-ue of this joint order to Outotec and Hatch is approximately EUR 50 million and the work will be divided almost equally be-tween the parties. After its completion in 2014, the Ras Az Zawr plant will produce 1,800,000 tonnes of alumina.
Focus on new growth areasThe Energy, Light Metals and Environ-mental Solutions business area was cre-ated when the technologies associated with iron processing were separated from the former Metals Processing division. These now form a part of the Ferrous Solutions business area. The business area’s offering is based on two strong areas of expertise: fluidized bed tech-nologies and the engineering and delivery of chemical plants, such as sulfuric acid plants. The business area is a market leader in both of these areas and its posi-tion is strong due to numerous successful deliveries.
The aim of the new business area is to apply these existing technologies in
new growth areas, such as industries closely connected to mining and metals, the production of renewable energy, and the treatment of industrial and municipal waste waters. Indeed, the new operation-al model enables more effective applica-tion of the technologies in new ways. The business area will also strengthen and expand its expertise both organically and through acquisitions.
Significant growth potentialThe demand for aluminum is growing and projects connected with the process-ing of bauxite and alumina are picking up as a result, particularly in China. The Middle East is also taking advantage of
the current situation by constructing new smelters and processing capacity.
The market outlook for sulfuric acid technology is also good. Sulfuric acid is needed in hydrometallurgical processes and it is produced in pyrometallurgical processes as a by-product. There is also a continuous need for sulfuric acid in the fertilizer industry.
The business area’s goal is to be an innovative supplier of solutions for energy and water treatment in accordance with the principles of sustainable develop-ment. The efficient use of water as well as water purification and recycling are clearly industries of the future. In water treatment, the main focus is on the
development of customized solutions for industrial water treatment, but technolo-gies are already being utilized in munici-pal wastewater treatment.
The development of new kinds of energy solutions – essential in terms of global climate change – will create significant growth potential for the busi-ness area, whose technologies can be used for the production of energy from sources including oil sand, oil shale, and biomasses, such as municipal waste.
Often, having evidence of success-ful projects and references is vital when applications are being sold. The contract received from Eesti Energia in 2009 for the engineering and implementation of a production plant utilizing oil shale in Narva, Estonia, provides a competitive advantage for Outotec.
Outotec is also involved in develop-ing energy-efficient and environmentally sound approaches for utilizing logging and sawing wastes through the GreenEx-ergy AB joint venture company estab-lished together with Skellefteå Kraft.
In addition, a new pilot plant for carbon monoxide recovery went into op-eration at the Frankfurt Research Center at the end of 2010. These measures have done much to strengthen the business area’s position in the energy industry.
The world’s largest sulfuric acid plant complex was built for Ma’aden in saudi arabia using outotec
technology. Ma’aden will also use outotec-Hatch technology in its aluminum plant project.

31 Annual Report 2010Outotec Oyj
ContractOutotec was awarded a contract in October 2007 by Votorantim Metais to supply a new zinc roasting plant, including gas cleaning and sulfuric acid plant ,on a turnkey basis to be built in Cajamarquilla, Peru. The contract value exceeded EUR 80 million. The delivery time was two years.
Project scopeOutotec’s scope of delivery included the complete engineering and civil works for a zinc roasting, gas cleaning and sulfuric acid plant, supply and installation of numerous pieces of equipment, as well as supervision services and commissioning of the plant.
Outotec solutionIn 1977 Outotec built the first zinc roaster in Cajamarquilla and it is still working at increased capacity. In this second delivery Outotec’s scope was larger and covered the whole roaster train, which brings additional benefits for the customer, such as improved energy recovery as well as reduced dust and sulfur dioxide gas emissions.
The construction work at the Cajama-rquilla site started in June 2008 and the project employed more than 600 people in various fields of construction. As in all of Outotec’s construction projects, the safety of the people involved had the highest possible priority. Together with the construction sub-
HSE team in operations was crucial because Outotec was working next to an existing plant in operation.
The safety award is recognition of the safety team’s superb performance. The team
A complete zinc roasting line to Cajamarquilla in Peru
contractor Graña y Montero (GyM), Outotec received a safety award from Votorantim Metais for achieving a spectacular mark of 500,000 working hours without a severe inci-dent. The experience of Votorantim’s own
raised high awareness of work safety among all employees in all areas.
ChallengeVotorantim Metais
is one of the world’s
largest zinc produc-
ers. The company was
planning to double its
annual zinc produc-
tion from 160,000 tonnes while keeping the
existing production line next to the planned
new one in operation, while at the same time
improving the environmental conditions of
the operations.
eneRGy, liGHT MeTals and enviRonMenTal soluTions

32 Annual Report 2010Outotec Oyj
seRviCes
The services business area develops outotec’s service offering and global service network to increase business, and provides services to its customers throughout the
life cycle of their production plants.
32 Annual Report 2010Outotec Oyj
33 Annual Report 2010Outotec Oyj
The Services business area focuses on developing Outotec’s service offering, strengthening the global service net-work, and increasing service business. Outotec aims to provide services to its customers throughout the life cycle of their production plants. Its service offering enables efficient and uninter-rupted use of plants for its customers with the lowest possible impact on the environment. Outotec’s service range includes expert services, operation, maintenance, and spare parts services, as well as equipment and plant mod-ernization services.
Outotec’s Services business is affected by the industry’s production capacity level, reorganizations, and expansions, as well as the construction of new capacity. Customers’ need for spare parts, maintenance, and mod-ernization is increasing as new capacity is being built and the utilization rate of existing capacity is being raised. The variety of the required services is ex-tensive, ranging from single spare parts to outsourced maintenance contracts.
The goal was achievedThe Services business is included in the sales and profit figures of three other
business areas. The Services business area was created in conjunction with the reorganization that took place in April 2010. For the Services business area, only the sales figures are pub-lished. Creating a separate business area strengthens the development of services, monitoring, and strong sales growth.
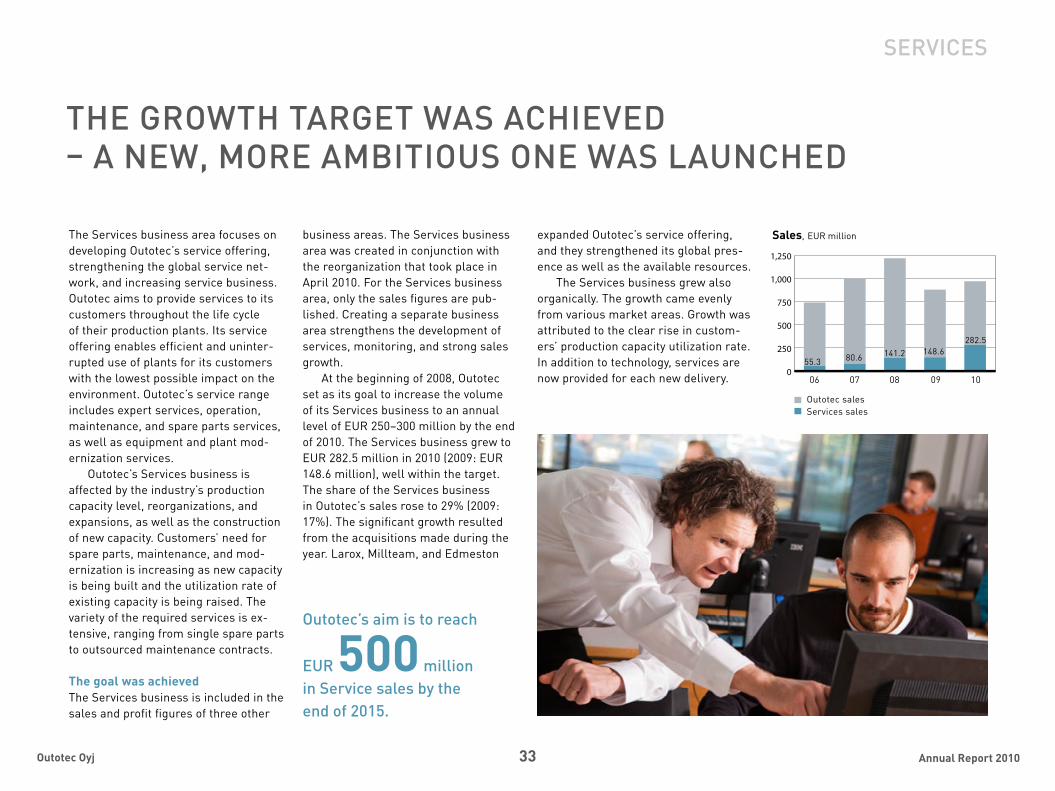
At the beginning of 2008, Outotec set as its goal to increase the volume of its Services business to an annual level of EUR 250–300 million by the end of 2010. The Services business grew to EUR 282.5 million in 2010 (2009: EUR 148.6 million), well within the target. The share of the Services business in Outotec’s sales rose to 29% (2009: 17%). The significant growth resulted from the acquisitions made during the year. Larox, Millteam, and Edmeston
seRviCes
THe GRoWTH TaRGeT Was aCHieved – a neW, MoRe aMbiTious one Was launCHed
outotec’s aim is to reach
euR 500 million in service sales by the end of 2015.
expanded Outotec’s service offering, and they strengthened its global pres-ence as well as the available resources.
The Services business grew also organically. The growth came evenly from various market areas. Growth was attributed to the clear rise in custom-ers’ production capacity utilization rate. In addition to technology, services are now provided for each new delivery. 0
250
500
750
1,000
1,250
Sales, EUR million
06 07 08 09 10
Outotec salesServices sales
55.3 80.6 141.2 148.6282.5

34 Annual Report 2010Outotec Oyj
seRviCes
Setting the bar higherAt the end of 2010, Outotec set as its new goal to increase service sales to EUR 500 million by the end of 2015. Increasing service sales supports Outotec’s growth and profitability tar-gets, and it also evens out the cyclic at nature of the business related to new investments in the mining and metals industry. This ambitious goal can be achieved through successful acquisi-tions and organic growth. Outotec’s broad customer base and already delivered plants and equipments enable active offering of services to the exist-ing customer base. Moreover, service offering, expertise, and service network will be further strengthened.
Added value for the customerThe markets clearly have significant growth opportunities for the providers of high-quality services. The existence of a service offering is the requirement of many customers already in conjunc-tion with planning of the investment and equipment sales. When making the investment decision, studies and analyses enable the selection of the technology and plant best suited to the customer’s need. As technology supplier, Outotec can guarantee the us-ability and effectiveness of the technol-ogies acquired throughout the life cycle of the plant. Commissioning support, operating consultation, and training ensure successful commissioning, and operating and maintenance and spare
parts services ensure effective produc-tion. With modernization services, it is possible to prolong the life cycle of a plant productively and in compliance with environmental requirements.
Many of Outotec’s customers still perform service and maintenance
work using their own resources. New technology requires, however, more accurate and more advanced process solutions expertise. Furthermore, in-creased personnel turnover in custom-ers’ plants will result in the required expertise being more challenging to
find internally. Some customers also use small local service providers whose offerings may be very limited. As out-sourcing becomes more common, there will also be higher demand for the services provided by reliable technology suppliers like Outotec.
Significant growth opportunities are also created by the over 2,000 operat-ing plants delivered by Outotec. One of Outotec’s strengths as a service provider is its strong expertise in its own equipment. Using equipment and production plants in the best possible way reduces their operating costs and, at the same time, makes production re-liable, environmentally sound, and safe. Environmental soundness is an aspect which will have to be further empha-sized and requires strong amount of expertise from the service provider.
Information for product developmentThe Services business requires operat-ing close to the customers. Outotec has a global network of service centers that provide advanced services and critical support to customers locally. Operating close to the customer and equipment maintenance also strengthen Outotec’s position as a developer and supplier of new plants. The experiences gained in operation and maintenance services can be utilized in Outotec’s product develop-ment, and presence enables access to information on future investment needs.
OUTOTEC’S SERVICES COVER THE LIFE CYCLE OF THE CUSTOMER’S PRODUCTION PLANTS
R&D services0perate and MaintainComponent services
TrainingInstallation services
Start-up servicesRamp-up services
Preventive maintenanceAuditing
Shut-down servicesEquipment life assessment
Upgrades and modernizationsRefurbishment of equipment for
new production
Engineering
Flo
wsh
eet D
esig
n
Spares
CAPEX
Concept
Testwork
Com
mis
sion
ing
Operatio
nal Services

35 Annual Report 2010Outotec Oyj
several of outotec’s technologies have been classified by the european union as “best available technologies” due to their small load on the environment, the
efficiency of energy and water usage and the productivity of the process.
ReseaRCH and developMenT
35 Annual Report 2010Outotec Oyj

36 Annual Report 2010Outotec Oyj
Outotec aims to be a leading supplier of environmentally friendly production solutions for minerals and metals and to offer innovative and sustainable technol-ogies for the processing of energy and water. Outotec’s customer promise is to guarantee the best possible end result for its customers’ investments. Custom-ers’ changing operating environments continuously create new kinds of needs
and requirements. Indeed, for Outotec to maintain its leadership position requires strong investment in the development of technologies and equipment, as well as supporting innovation in its operations.
Outotec’s technology leadership is based on managing the entire process-ing chain from ore to refined metal, continuous development of technology, and close cooperation with custom-
ers. Several of its technologies have been classified by the European Union as “best available technologies”, due to their small load on the environment, the efficiency of energy and water us-age, and the productivity of the process. The majority of Outotec’s deliveries also fulfill the OECD’s requirements for environmental goods and services. Of the company’s order intake in 2010, the
outotec aims to improve its customers’ pro-
duction processes by offering technological
solutions that guarantee the best materials
efficiency, reduce energy and water consump-
tion, minimize wastewater and emissions, and
improve the quality of by-products. in addition,
attention is paid to the reliability, usability, and
safety of production.
susTainable soluTions foR THe use of naTuRal ResouRCes
ReseaRCH and developMenT
0
10
20
30
R&D expenditure, EUR million
06 07 08 09 10
19.2 19.9 20.2 20.5
28.5
proportion of environmental goods and services was approximately 72% (2009: 76%).
Outotec aims to improve its custom-ers’ production processes by offering technological solutions that guarantee the best materials efficiency, reduce en-ergy and water consumption, minimize wastewater and emissions, and improve the quality of by-products. In addition,
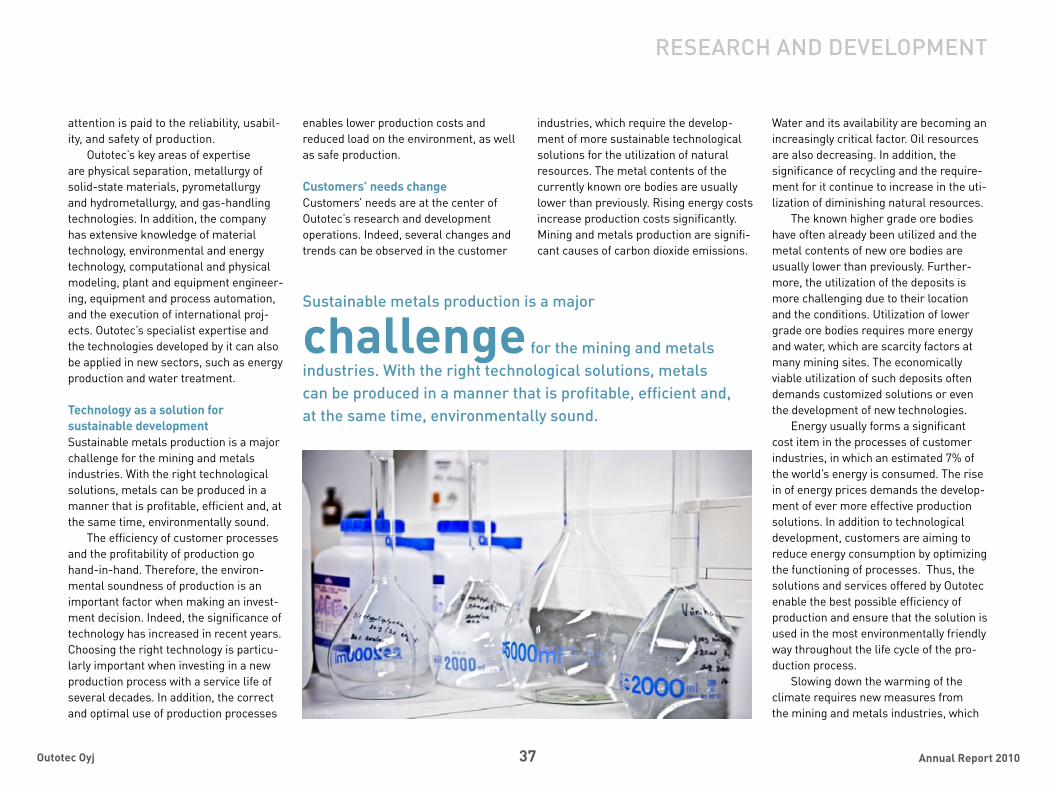
37 Annual Report 2010Outotec Oyj
ReseaRCH and developMenT
attention is paid to the reliability, usabil-ity, and safety of production.
Outotec’s key areas of expertise are physical separation, metallurgy of solid-state materials, pyrometallurgy and hydrometallurgy, and gas-handling technologies. In addition, the company has extensive knowledge of material technology, environmental and energy technology, computational and physical modeling, plant and equipment engineer-ing, equipment and process automation, and the execution of international proj-ects. Outotec’s specialist expertise and the technologies developed by it can also be applied in new sectors, such as energy production and water treatment.
Technology as a solution for sustainable development Sustainable metals production is a major challenge for the mining and metals industries. With the right technological solutions, metals can be produced in a manner that is profitable, efficient and, at the same time, environmentally sound.
The efficiency of customer processes and the profitability of production go hand-in-hand. Therefore, the environ-mental soundness of production is an important factor when making an invest-ment decision. Indeed, the significance of technology has increased in recent years. Choosing the right technology is particu-larly important when investing in a new production process with a service life of several decades. In addition, the correct and optimal use of production processes
enables lower production costs and reduced load on the environment, as well as safe production.
Customers’ needs changeCustomers’ needs are at the center of Outotec’s research and development operations. Indeed, several changes and trends can be observed in the customer
industries, which require the develop-ment of more sustainable technological solutions for the utilization of natural resources. The metal contents of the currently known ore bodies are usually lower than previously. Rising energy costs increase production costs significantly. Mining and metals production are signifi-cant causes of carbon dioxide emissions.
Water and its availability are becoming an increasingly critical factor. Oil resources are also decreasing. In addition, the significance of recycling and the require-ment for it continue to increase in the uti-lization of diminishing natural resources.
The known higher grade ore bodies have often already been utilized and the metal contents of new ore bodies are usually lower than previously. Further-more, the utilization of the deposits is more challenging due to their location and the conditions. Utilization of lower grade ore bodies requires more energy and water, which are scarcity factors at many mining sites. The economically viable utilization of such deposits often demands customized solutions or even the development of new technologies.
Energy usually forms a significant cost item in the processes of customer industries, in which an estimated 7% of the world’s energy is consumed. The rise in of energy prices demands the develop-ment of ever more effective production solutions. In addition to technological development, customers are aiming to reduce energy consumption by optimizing the functioning of processes. Thus, the solutions and services offered by Outotec enable the best possible efficiency of production and ensure that the solution is used in the most environmentally friendly way throughout the life cycle of the pro-duction process.
Slowing down the warming of the climate requires new measures from the mining and metals industries, which
sustainable metals production is a major
challenge for the mining and metals industries. With the right technological solutions, metals can be produced in a manner that is profitable, efficient and, at the same time, environmentally sound.
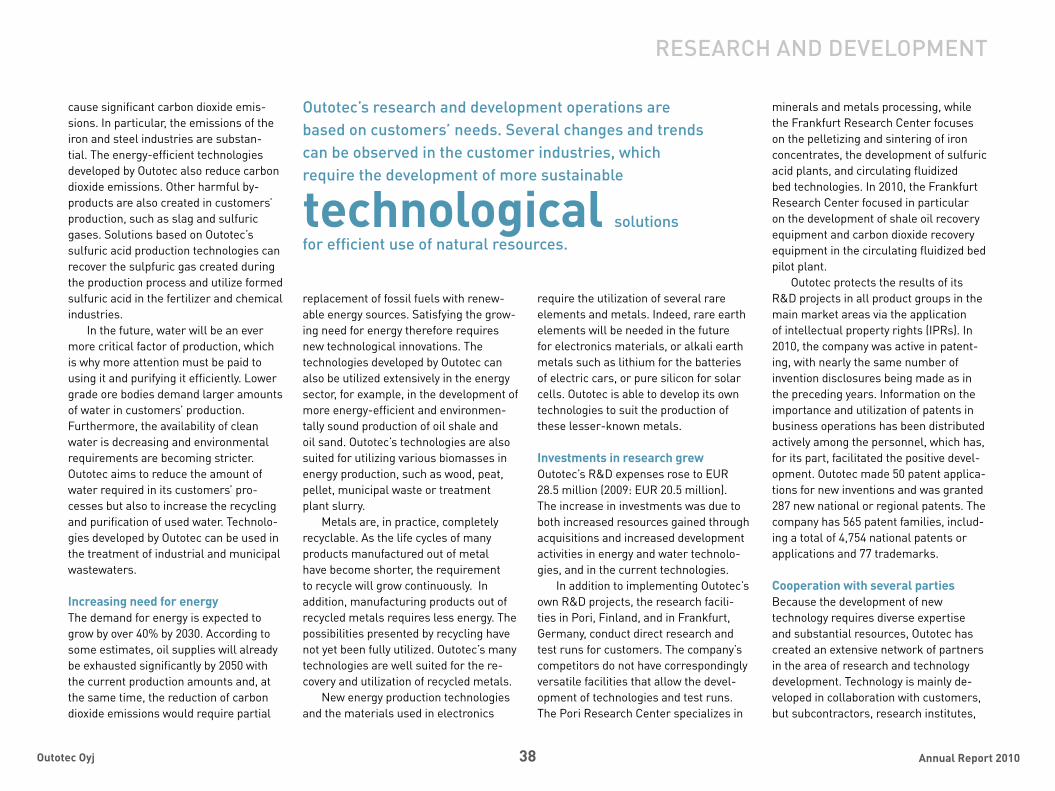
38 Annual Report 2010Outotec Oyj
cause significant carbon dioxide emis-sions. In particular, the emissions of the iron and steel industries are substan-tial. The energy-efficient technologies developed by Outotec also reduce carbon dioxide emissions. Other harmful by-products are also created in customers’ production, such as slag and sulfuric gases. Solutions based on Outotec’s sulfuric acid production technologies can recover the sulpfuric gas created during the production process and utilize formed sulfuric acid in the fertilizer and chemical industries.
In the future, water will be an ever more critical factor of production, which is why more attention must be paid to using it and purifying it efficiently. Lower grade ore bodies demand larger amounts of water in customers’ production. Furthermore, the availability of clean water is decreasing and environmental requirements are becoming stricter. Outotec aims to reduce the amount of water required in its customers’ pro-cesses but also to increase the recycling and purification of used water. Technolo-gies developed by Outotec can be used in the treatment of industrial and municipal wastewaters.
Increasing need for energyThe demand for energy is expected to grow by over 40% by 2030. According to some estimates, oil supplies will already be exhausted significantly by 2050 with the current production amounts and, at the same time, the reduction of carbon dioxide emissions would require partial
replacement of fossil fuels with renew-able energy sources. Satisfying the grow-ing need for energy therefore requires new technological innovations. The technologies developed by Outotec can also be utilized extensively in the energy sector, for example, in the development of more energy-efficient and environmen-tally sound production of oil shale and oil sand. Outotec’s technologies are also suited for utilizing various biomasses in energy production, such as wood, peat, pellet, municipal waste or treatment plant slurry.
Metals are, in practice, completely recyclable. As the life cycles of many products manufactured out of metal have become shorter, the requirement to recycle will grow continuously. In addition, manufacturing products out of recycled metals requires less energy. The possibilities presented by recycling have not yet been fully utilized. Outotec’s many technologies are well suited for the re-covery and utilization of recycled metals.
New energy production technologies and the materials used in electronics
require the utilization of several rare elements and metals. Indeed, rare earth elements will be needed in the future for electronics materials, or alkali earth metals such as lithium for the batteries of electric cars, or pure silicon for solar cells. Outotec is able to develop its own technologies to suit the production of these lesser-known metals.
Investments in research grew Outotec’s R&D expenses rose to EUR 28.5 million (2009: EUR 20.5 million). The increase in investments was due to both increased resources gained through acquisitions and increased development activities in energy and water technolo-gies, and in the current technologies.
In addition to implementing Outotec’s own R&D projects, the research facili-ties in Pori, Finland, and in Frankfurt, Germany, conduct direct research and test runs for customers. The company’s competitors do not have correspondingly versatile facilities that allow the devel-opment of technologies and test runs. The Pori Research Center specializes in
minerals and metals processing, while the Frankfurt Research Center focuses on the pelletizing and sintering of iron concentrates, the development of sulfuric acid plants, and circulating fluidized bed technologies. In 2010, the Frankfurt Research Center focused in particular on the development of shale oil recovery equipment and carbon dioxide recovery equipment in the circulating fluidized bed pilot plant.
Outotec protects the results of its R&D projects in all product groups in the main market areas via the application of intellectual property rights (IPRs). In 2010, the company was active in patent-ing, with nearly the same number of invention disclosures being made as in the preceding years. Information on the importance and utilization of patents in business operations has been distributed actively among the personnel, which has, for its part, facilitated the positive devel-opment. Outotec made 50 patent applica-tions for new inventions and was granted 287 new national or regional patents. The company has 565 patent families, includ-ing a total of 4,754 national patents or applications and 77 trademarks.
Cooperation with several partiesBecause the development of new technology requires diverse expertise and substantial resources, Outotec has created an extensive network of partners in the area of research and technology development. Technology is mainly de-veloped in collaboration with customers, but subcontractors, research institutes,
ReseaRCH and developMenT
outotec’s research and development operations are based on customers’ needs. several changes and trends can be observed in the customer industries, which require the development of more sustainable
technological solutions for efficient use of natural resources.

39 Annual Report 2010Outotec Oyj
ReseaRCH and developMenT
and universities participating in the de-velopment projects are often significant partners.
In 2010, Outotec agreed on strategic cooperation with Kemira, a supplier of chemicals and process solutions for the oil and mining industries. The compa-nies will develop business operations in the provision of solutions for the mining industry and oil sand processing, as well as the treatment of related industrial wastewaters. Outotec’s process expertise in beneficiation and oil sand process-ing together with Kemira’s expertise in water chemistry and its solutions enables the offering of process optimization that improves cost-efficiency and quality for customers.
Outotec decided to participate in an industrial research program led by the University of Alberta, the aim of which is to enhance the efficiency and sustain-ability of water use in the processing of Canada’s oil sands. Outotec supports the five-year research program through a professorship established in cooperation with various parties. In addition, Outotec donated EUR 600,000 to Finnish univer-sities. Donated funds were distributed to Aalto University Foundation, Oulu University Fund, Lappeenranta University of Technology, and Åbo Akademi. Outotec has also supported undergraduate and graduate students of universities, as well as the research activities through the Technology Industries of the Finland Centennial Foundation Fund for the Association of Finnish Steel and Metal Producers. Furthermore, the company
has supported the operations of the Baltic Sea Action Group, both through its own research activities and through donations.
Outotec received international rec-ognition for the energy-efficiency of its technology when its customer Alunorte received an award at the Hannover industrial technology exhibition. Alunorte received a special mention for its calcina-tion process, which Outotec designed.
Comprehensive technology supplyOutotec aims to expand its offering to cover the entire production process from mine to metal as well as the services required throughout the life cycle of the production process. To achieve this goal, Outotec has systematically charted its own areas of expertise by metal. On the basis of the review, Outotec’s expertise and offering already cover the production processes of all the metals quite well. On
the other hand, there are also areas in which its expertise and experience still need to be strengthened, as well as areas in which no expertise currently exists. It is Outotec’s aim to strengthen these areas through its own research or by ob-taining the required technologies through acquisitions.
Customers’ needs are at the center of outotec’s research and development operations. indeed, several changes and trends can be observed in the
customer industries, which require the development of more sustainable technological solutions for the utilization of natural resources.

40 Annual Report 2010Outotec Oyj
enviRonMenT
processing of lower grade ores requires more energy and water, which are scarcity factors at many mining sites. The economically viable utilization of such deposits often demands
customized solutions or even the development of new technologies.
40 Annual Report 2010Outotec Oyj
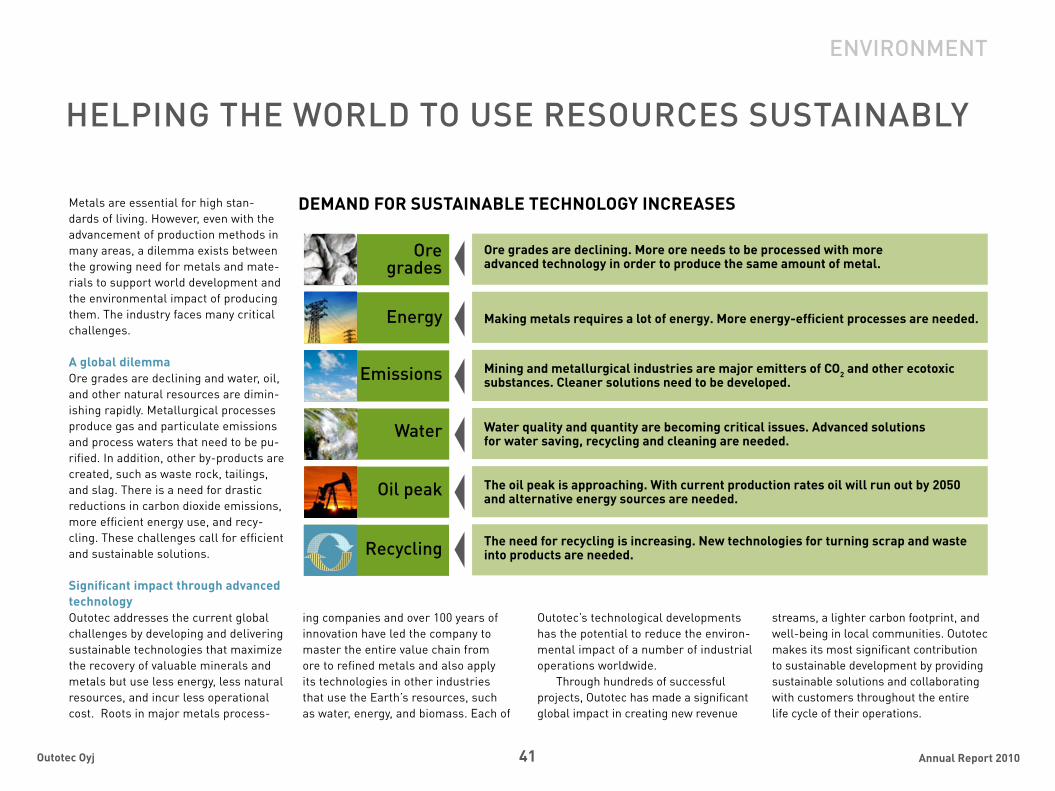
41 Annual Report 2010Outotec Oyj
Metals are essential for high stan-dards of living. However, even with the advancement of production methods in many areas, a dilemma exists between the growing need for metals and mate-rials to support world development and the environmental impact of producing them. The industry faces many critical challenges.
A global dilemmaOre grades are declining and water, oil, and other natural resources are dimin-ishing rapidly. Metallurgical processes produce gas and particulate emissions and process waters that need to be pu-rified. In addition, other by-products are created, such as waste rock, tailings, and slag. There is a need for drastic reductions in carbon dioxide emissions, more efficient energy use, and recy-cling. These challenges call for efficient and sustainable solutions.
Significant impact through advanced technologyOutotec addresses the current global challenges by developing and delivering sustainable technologies that maximize the recovery of valuable minerals and metals but use less energy, less natural resources, and incur less operational cost. Roots in major metals process-
enviRonMenT
ing companies and over 100 years of innovation have led the company to master the entire value chain from ore to refined metals and also apply its technologies in other industries that use the Earth’s resources, such as water, energy, and biomass. Each of
Outotec’s technological developments has the potential to reduce the environ-mental impact of a number of industrial operations worldwide.
Through hundreds of successful projects, Outotec has made a significant global impact in creating new revenue
streams, a lighter carbon footprint, and well-being in local communities. Outotec makes its most significant contribution to sustainable development by providing sustainable solutions and collaborating with customers throughout the entire life cycle of their operations.
HelpinG THe WoRld To use ResouRCes susTainably
Ore grades are declining. More ore needs to be processed with more advanced technology in order to produce the same amount of metal.
Making metals requires a lot of energy. More energy-efficient processes are needed.
Mining and metallurgical industries are major emitters of CO2 and other ecotoxic substances. Cleaner solutions need to be developed.
Water quality and quantity are becoming critical issues. Advanced solutions for water saving, recycling and cleaning are needed.
The oil peak is approaching. With current production rates oil will run out by 2050 and alternative energy sources are needed.
The need for recycling is increasing. New technologies for turning scrap and waste into products are needed.
ore grades
energy
emissions
Water
oil peak
Recycling
DEMAND FOR SUSTAINABLE TECHNOLOGY INCREASES
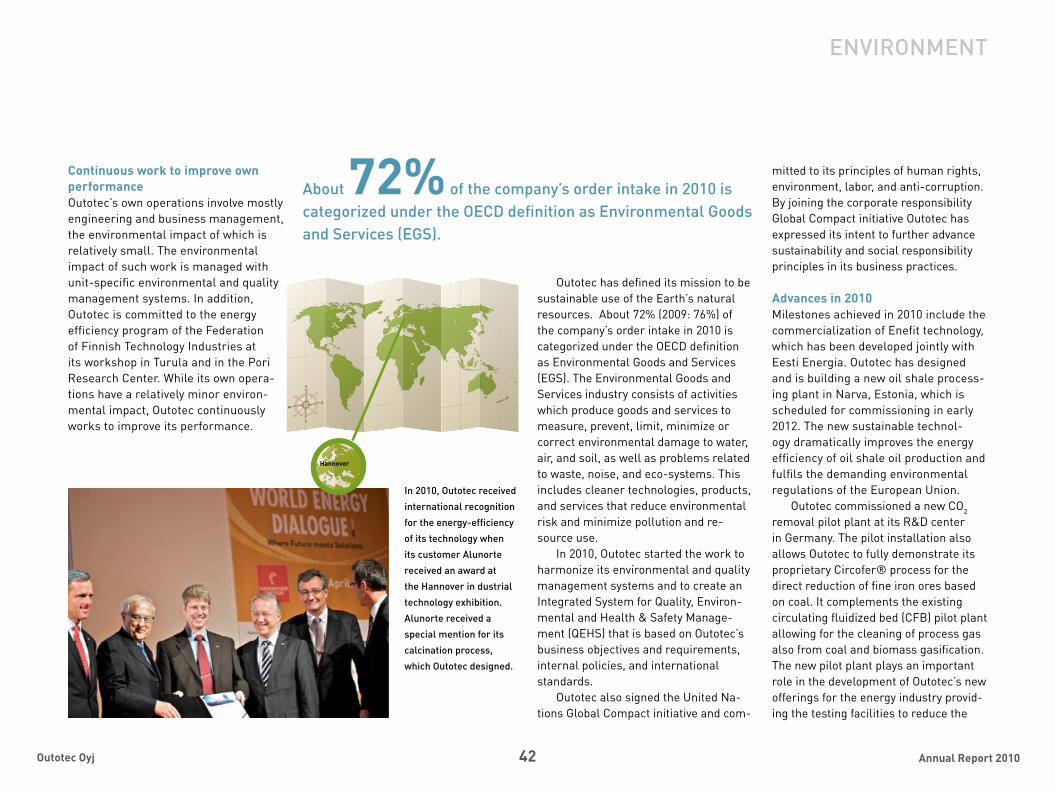
42 Annual Report 2010Outotec Oyj
about 72% of the company’s order intake in 2010 is categorized under the oeCd definition as environmental Goods and services (eGs).
in 2010, outotec received
international recognition
for the energy-efficiency
of its technology when
its customer alunorte
received an award at
the Hannover in dustrial
technology exhibition.
alunorte received a
special mention for its
calcination process,
which outotec designed.
enviRonMenT
Continuous work to improve own performanceOutotec’s own operations involve mostly engineering and business management, the environmental impact of which is relatively small. The environmental impact of such work is managed with unit-specific environmental and quality management systems. In addition, Outotec is committed to the energy efficiency program of the Federation of Finnish Technology Industries at its workshop in Turula and in the Pori Research Center. While its own opera-tions have a relatively minor environ-mental impact, Outotec continuously works to improve its performance.
Outotec has defined its mission to be sustainable use of the Earth’s natural resources. About 72% (2009: 76%) of the company’s order intake in 2010 is categorized under the OECD definition as Environmental Goods and Services (EGS). The Environmental Goods and Services industry consists of activities which produce goods and services to measure, prevent, limit, minimize or correct environmental damage to water, air, and soil, as well as problems related to waste, noise, and eco-systems. This includes cleaner technologies, products, and services that reduce environmental risk and minimize pollution and re-source use.
In 2010, Outotec started the work to harmonize its environmental and quality management systems and to create an Integrated System for Quality, Environ-mental and Health & Safety Manage-ment (QEHS) that is based on Outotec’s business objectives and requirements, internal policies, and international standards.
Outotec also signed the United Na-tions Global Compact initiative and com-
mitted to its principles of human rights, environment, labor, and anti-corruption. By joining the corporate responsibility Global Compact initiative Outotec has expressed its intent to further advance sustainability and social responsibility principles in its business practices.
Advances in 2010Milestones achieved in 2010 include the commercialization of Enefit technology, which has been developed jointly with Eesti Energia. Outotec has designed and is building a new oil shale process-ing plant in Narva, Estonia, which is scheduled for commissioning in early 2012. The new sustainable technol-ogy dramatically improves the energy efficiency of oil shale oil production and fulfils the demanding environmental regulations of the European Union.
Outotec commissioned a new CO2 removal pilot plant at its R&D center in Germany. The pilot installation also allows Outotec to fully demonstrate its proprietary Circofer® process for the direct reduction of fine iron ores based on coal. It complements the existing circulating fluidized bed (CFB) pilot plant allowing for the cleaning of process gas also from coal and biomass gasification. The new pilot plant plays an important role in the development of Outotec’s new offerings for the energy industry provid-ing the testing facilities to reduce the
Hannover

43 Annual Report 2010Outotec Oyj
carbon footprint of coal and biomass-based energy production well as the oil winning from oil shale.
Outotec and Kemira entered into strategic cooperation in developing solutions for water-intensive industrial applications. This cooperation combines Outotec’s competence in minerals and oil sands processing technology with Kemira’s know-how in water chemistry and related applications to offer cus-tomers process optimization enabling cost-efficiency, sustainability, and quality improvements.
Outotec ranked high in the Carbon Disclosure Leadership index Outotec was ranked the third best Nor-dic company by the Carbon Disclosure Project (CDP) in the Carbon Disclo-sure Leadership Index, which is a key component of CDP’s annual Nordic 200 Report. The Index highlights companies with the most complete and profession-al approach to corporate governance in respect of climate change disclosure practices. Outotec’s score in the CDP ranking in 2010 was 90/100.
CDP’s analysis is based on a ques-tionnaire focused on greenhouse gas emissions, emissions reduction targets, and risks and opportunities associated
with climate change. Companies are scored on their climate change disclo-sure and high scores indicate good inter-nal data management and understand-ing of climate change issues affecting the company. Outotec participated in the CDP for the first time in 2009 and was commended for its climate change disclosure.
4.1 million tons of carbon dioxide emissions were avoided by Outotec’s customers due to the use of five Outotec technologies compared with other corre-sponding methods available (CDP 2010).
Awards and recognitionBrazilian alumina producer Alunorte S.A. received the “Special Recognition” award handed out for energy efficiency during the Hannover Messe 2010. Alunorte uses Outotec® calcination technology and optimization processes in its cyclones to improve heat transfer and cut down on pressure losses thus resulting in energy savings and more stable operation.
Together with the construction subcontractor Graña y Montero, Outotec received a safety award from their client Votorantim Metais for outstanding safety results achieved in the Cajamarquilla zinc plant project. The health and safety
team of Outotec and GyM reached the spectacular mark of 500,000 working hours without a severe incident. The project had more than 600 employees in various fields of construction as a part of Outotec’s turnkey delivery to Votorantim Metais, Peru.
Active cooperation with scientific communitiesOutotec donated EUR 600,000 to Finnish universities to further enhance the level of research and education in universi-ties, which are important for Outotec and strengthen the company’s wide cooperation with scientific communities focusing on technology and economy.
Outotec continued its sponsorship of the Millennium Technology Prize. In 2010, the prize was awarded to Profes-sor Michael Grätzel, recognized as the developer of third-generation dye-sensi-tized solar cells. Grätzel cells are likely to have an important role in low-cost, large-scale solutions for renewable energy.
Outotec joined an industrial research program of the University of Alberta intended to foster sustainable water use in Canadian oil sands extraction. Outotec collaborates with companies such as Kemira and Suncor Energy Services, the
Canadian government and the Alberta Water Research Institute to establish a Natural Science and Engineering Research Council of Canada (NSERC) industrial research chair titled “Wa-ter Quality Management for Oil Sands Extraction” at the University of Alberta in Edmonton, Canada. The five-year re-search program focuses on water quality management studies to address water consumption, reuse and recycling by the in situ oil sands extraction industry.
Outotec also continued its active work in various organizations in develop-ing environmentally sound technologies. A representative of Outotec participates in the update of the non-ferrous metals BREF, a document which defines Best Available Techniques for non-ferrous metals, as an expert in the European Union’s technical working group and in an environmental working group of the Federation of Finnish Technology Indus-tries. In addition, Outotec has been, for example, involved, in the International Copper Association’s Health and Envi-ronment Program Advisory Committee work.
The board of the Helsinki University of Technology established a fund named ‘Tapani Järvinen’s environmental tech-nology fund’ after Outotec’s retired CEO
enviRonMenT

44 Annual Report 2010Outotec Oyj
enviRonMenT
Tapani Järvinen. The fund aims at pro-moting the research of environmental technology and will fund distinguished individuals’ research and development work. Outotec donated the basic capital for the fund.
Commitment to cleaning the Baltic SeaOutotec joined the Baltic Sea Action Group in 2009 with a commitment to contribute EUR 40,000 annually for
a period of three years and provide professional services related to improv-ing the state of the Baltic Sea. Outotec focuses on minimizing metal-contain-ing dusts and sulfur dioxide emissions
of the metals industry as well as on reducing metal-containing effluents. Furthermore, Outotec will bring in its expertise in symposiums focusing on environmentally sound process-ing methods in the metals and energy industries. In February 2010, Outotec participated in the Baltic Sea Action Summit top-level meeting in Helsinki, and later in the year started a study on oil and organics containing industrial waters at its research centers.
Support for children and youthOutotec continued its support for the re-nowned Tapiola Choir, which has around 70 young musicians aged 9 to 18, all of whom also play at least one musical instrument in addition to singing.
Donations to charitable causes included support for Engineers without Borders’ initiative to build water collec-tors in Kenya and for the SOS Children’s Village in Kitwe, Zambia.
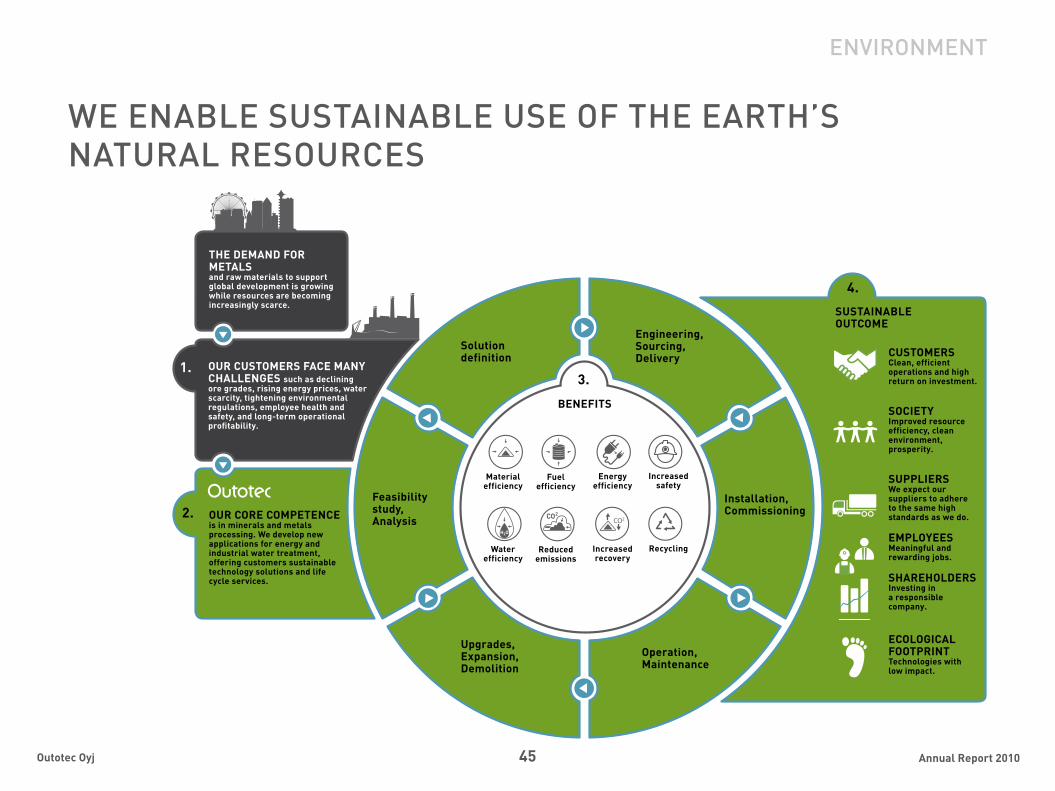
45 Annual Report 2010Outotec Oyj
enviRonMenT
CO2
We enable susTainable use of THe eaRTH’s naTuRal ResouRCes
Engineering, Sourcing, Delivery
Installation,Commissioning
Operation,Maintenance
Upgrades, Expansion,Demolition
Feasibility study,Analysis
Solutiondefinition
3.
2.
1.
Materialefficiency
Fuelefficiency
Energyefficiency
Increasedsafety
Waterefficiency
Reducedemissions
Increasedrecovery
Recycling
4.
SUSTAINABLE OUTCOME
CUSTOMERSClean, efficient operations and high return on investment.
SOCIETYImproved resource efficiency, clean environment, prosperity.
SUPPLIERSWe expect our suppliers to adhere to the same high standards as we do.
EMPLOYEESMeaningful and rewarding jobs.
SHAREHOLDERSInvesting in a responsible company.
ECOLOGICAL FOOTPRINTTechnologies with low impact.
OUR CUSTOMERS FACE MANY CHALLENGES such as declining ore grades, rising energy prices, water scarcity, tightening environmental regulations, employee health and safety, and long-term operational profitability.
OUR CORE COMPETENCE is in minerals and metals processing. We develop new applications for energy and industrial water treatment, offering customers sustainable technology solutions and life cycle services.
BENEFITS
THE DEMAND FOR METALSand raw materials to support global development is growing while resources are becoming increasingly scarce.
46 Annual Report 2010Outotec Oyj
enviRonMenT
Ores are becoming leaner and more complex to process
Challenge:The average copper ore grade is currently 0.8%, which is 20% less than ten years ago. The ore grade is forecasted to fall further to 0.65% by 2020. This means that 30 tons more of ore need to be milled for one ton of copper. Minerals and metals processing is very energy intensive. Larger amounts of material processed in the beneficiation phase will increase the amount of emissions and tailings as well as energy and water consumption. Greenhouse gas emissions in this industry are mainly related to energy
use. Furthermore, more land will be needed for the operations.
When the metal content in ore declines by 20%, water consumption in the concentra-tor increases by 20%, which means that the availability of water is becoming a critical issue in many areas. For example, processing one ton of ore requires some 3,500 liters of water, one ton of nickel in a hydrometallurgi-cal process requires 377,000 Iiters of water, and one ton of gold requires 252 million Iiters of water.
Outotec solution:Deep knowledge of mineralogy and process technologies as well as comprehensive R&D and testing facilities allow Outotec to develop an optimal process solution for each raw ma-terial. Modern technologies enable a higher recovery and optimize metal recoveries in the entire value chain from ore to refined metals. Advanced process control is one of the key issues in efficient ore processing.
Advanced technology significantly re-duces fresh water consumption by recycling process water and decreasing water loss. For example, Outotec Larox filters are energy efficient when separating water from con-centrates. Outotec paste thickeners separate water from tailings efficiently, reducing water consumption by approximately 10% and enabling concentrators to use paste directly as a backfill in the mine.
Principle 1: Businesses should support and respect the
protection of internationally proclaimed human
rights
Principle 2: Businesses should make sure that they are not
complicit in human rights abuses
Principle 3: Businesses should uphold the freedom of asso-
ciation and the effective recognition of the right
to collective bargaining
UN Global Compact – Ten Principles
Principle 4: Businesses should uphold the elimination of all
forms of forced and compulsory labor
Principle 5: Businesses should uphold the effective abolition of
child labor
Principle 6: Businesses should uphold the elimination of
discrimination in respect of employment and oc-
cupation
Principle 7: Businesses should support a precautionary ap-
proach to environmental challenges
Principle 8: Businesses should undertake initiatives to pro-
mote greater environmental responsibility
Principle 9: Businesses should encourage the development and
diffusion of environmentally friendly technologies
Principle 10: Businesses should work against corruption in all
its forms, including extortion & bribery
Outotec designs sealed processes that utilize the energy contained in the raw mate-rials. Several Outotec technologies are Best Available Techniques (BAT) rated by the EU thanks to their energy-efficiency and low CO2 and other emissions. The use of five Outotec technologies has resulted in over 4 million fewer tons of CO2 emissions annually (CDP 2010). Adoption of best practice technologies worldwide could save 40-70 million tons of CO2 in non-ferrous metals production alone.
Outotec is continuously developing its technologies and new applications, for example, for industrial effluent treatment. The company is also cooperating with Kemira in developing solutions for water-intensive industrial applications and for oil sands processing.

47 Annual Report 2010Outotec Oyj
To maintain our position as an industry leader and ascertaining profitable growth, our personnel needs to have strong technological expertise,
an innovative attitude,
flexibility, and joint responsibility.
peRsonnel
47 Annual Report 2010Outotec Oyj

48 Annual Report 2010Outotec Oyj
Outotec strives to offer its customers extensive and environmentally sound overall solutions and services. Maintain-ing the company’s industry leadership position and securing profitable growth require strong professional skills and experience from the personnel, as well as innovation, flexibility and shared responsibility. As all projects are differ-ent, Outotec is able to offer its employees challenging and varying duties, competi-tive benefits, the possibility to develop their skills alongside experts in the field, and an international working environ-ment.
At the end of 2010, Outotec had a total of 3,130 employees (December 31, 2009: 3,128), of which 584 employees came from acquired businesses. In 2010, Outotec had on average 3,151 employees (2009: 2,612). The increase was mainly due to acquisitions. Temporary person-nel accounted for about 8% of the total number of employees. At the end of 2010, the company had, in addition to its own personnel, approximately 328 (December 30, 2009: 250) full-time equivalent, con-tracted professionals working in project execution. The number of contracted workers at any given time changes with the active project mix and project com-missioning, local legislation and regula-
0
4
8
12
16
Personnel by age range, %
Personnel by years of services
peRsonnel
developinG opeRaTional Model and oRGanizaTion To suppoRT GRoWTH
Primary and lower secondary level 31.4%
Higher university degree and post graduate 29.4%
Upper secondary level and lower university degree 39.2%
Educational backgroud
Finland 33.7%
Australia 8.7%
Rest of Europe 10.4%
Germany 14.2%
Rest of the world 8.7%
Americas 24.3%
Personnel by country
0
640
1,280
1,920
2,560
3,200
Personnel, persons
06 07 08 09 10
1,7972,144
2,674
3,128 3,130
Age
0
12
24
36
48
60
<5 6-10 11-15 16-20 21-25 26-30 31<Years
<25
26-3
0
31-3
5
36-4
0
41-4
5
46-5
0
51-5
5
56-6
0
>61
20092010
20092010
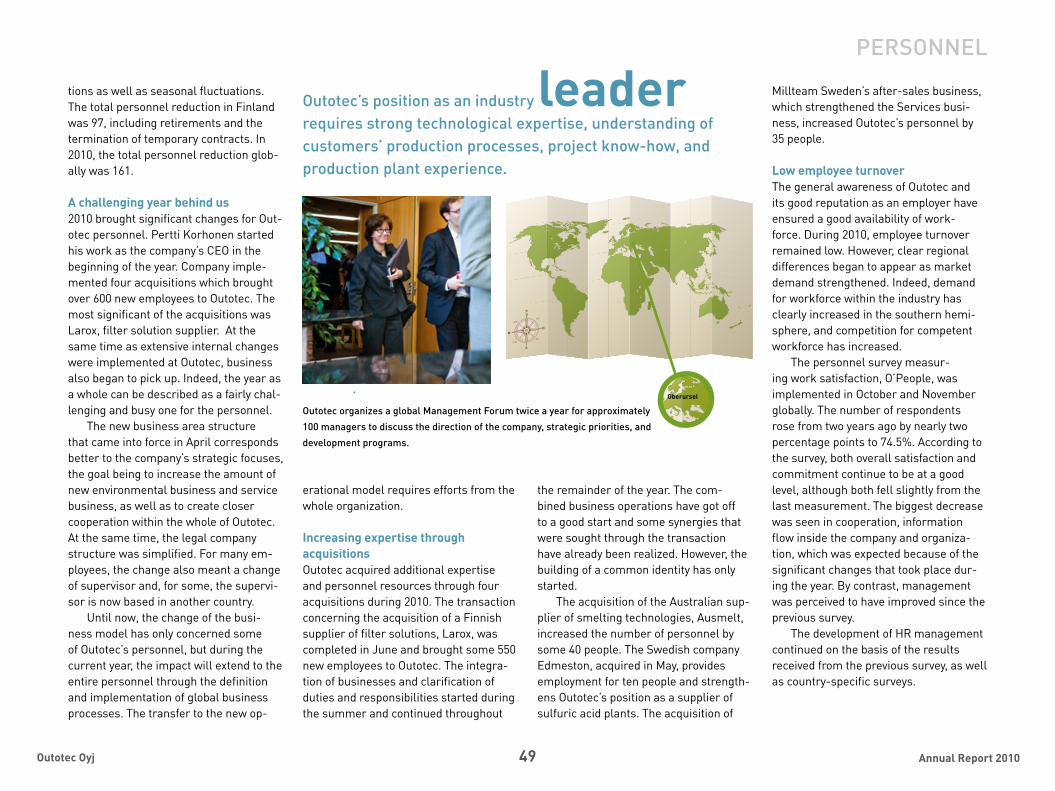
49 Annual Report 2010Outotec Oyj
peRsonnel
tions as well as seasonal fluctuations. The total personnel reduction in Finland was 97, including retirements and the termination of temporary contracts. In 2010, the total personnel reduction glob-ally was 161.
A challenging year behind us2010 brought significant changes for Out-otec personnel. Pertti Korhonen started his work as the company’s CEO in the beginning of the year. Company imple-mented four acquisitions which brought over 600 new employees to Outotec. The most significant of the acquisitions was Larox, filter solution supplier. At the same time as extensive internal changes were implemented at Outotec, business also began to pick up. Indeed, the year as a whole can be described as a fairly chal-lenging and busy one for the personnel.
The new business area structure that came into force in April corresponds better to the company’s strategic focuses, the goal being to increase the amount of new environmental business and service business, as well as to create closer cooperation within the whole of Outotec. At the same time, the legal company structure was simplified. For many em-ployees, the change also meant a change of supervisor and, for some, the supervi-sor is now based in another country.
Until now, the change of the busi-ness model has only concerned some of Outotec’s personnel, but during the current year, the impact will extend to the entire personnel through the definition and implementation of global business processes. The transfer to the new op-
erational model requires efforts from the whole organization.
Increasing expertise through acquisitionsOutotec acquired additional expertise and personnel resources through four acquisitions during 2010. The transaction concerning the acquisition of a Finnish supplier of filter solutions, Larox, was completed in June and brought some 550 new employees to Outotec. The integra-tion of businesses and clarification of duties and responsibilities started during the summer and continued throughout
the remainder of the year. The com-bined business operations have got off to a good start and some synergies that were sought through the transaction have already been realized. However, the building of a common identity has only started.
The acquisition of the Australian sup-plier of smelting technologies, Ausmelt, increased the number of personnel by some 40 people. The Swedish company Edmeston, acquired in May, provides employment for ten people and strength-ens Outotec’s position as a supplier of sulfuric acid plants. The acquisition of
Millteam Sweden’s after-sales business, which strengthened the Services busi-ness, increased Outotec’s personnel by 35 people.
Low employee turnoverThe general awareness of Outotec and its good reputation as an employer have ensured a good availability of work-force. During 2010, employee turnover remained low. However, clear regional differences began to appear as market demand strengthened. Indeed, demand for workforce within the industry has clearly increased in the southern hemi-sphere, and competition for competent workforce has increased.
The personnel survey measur-ing work satisfaction, O’People, was implemented in October and November globally. The number of respondents rose from two years ago by nearly two percentage points to 74.5%. According to the survey, both overall satisfaction and commitment continue to be at a good level, although both fell slightly from the last measurement. The biggest decrease was seen in cooperation, information flow inside the company and organiza-tion, which was expected because of the significant changes that took place dur-ing the year. By contrast, management was perceived to have improved since the previous survey.
The development of HR management continued on the basis of the results received from the previous survey, as well as country-specific surveys.
outotec’s position as an industry leader requires strong technological expertise, understanding of customers’ production processes, project know-how, and production plant experience.
Oberursel
outotec organizes a global Management forum twice a year for approximately
100 managers to discuss the direction of the company, strategic priorities, and
development programs.

50 Annual Report 2010Outotec Oyj
peRsonnel
Versatile means for competence developmentOutotec’s position as an industry leader requires strong technological expertise, understanding of customers’ produc-tion processes, project know-how, and production plant experience. Because Outotec’s way of doing business includes networking and extensive cooperation with customers and subcontractors, the development of interpersonal skills and interaction with representatives of different cultures also bring their own challenges.
Outotec pursues a responsible and sustainable Human Capital policy to ensure that the right kind of competence will continue to be available in the future. The personnel’s educational level is high and continuous self-development is encouraged and supported. Development needs and expectations are reviewed in annual Performance Development Dialogues. Competence development is supported by targeting sufficient financial resources for training. Profes-sional growth is provided through various coaching, mentoring, training, and de-velopment programs, as well as through supplementary training and postgradu-ate studies. Job rotation is also used in an effort to strengthen the personnel’s competence and the company’s flexibility in managing resources.
Open interactionOutotec’s aim is to be an open and equal work community, whose company culture encourages everyone to discuss and develop the company’s operations. Vari-
ous influencing and discussion channels are used with increased activity. The most significant of these are the intra-net, Outotec Round-Table, and meetings with employee representatives, as well as the Works Councils, which are in use in Germany. During 2010, the focus was on the use of the intranet in developing the dialog between management and personnel.
Job grading reaching completenessFair and motivating compensation is achieved with pay that is in line with the demands of the job, performance, and skills. Furthermore, every employee is covered by the bonus system. In addi-tion to the bonus system, about 70 key employees participated in a share-based
Directors, Carl-Gustav Bergström, as its chairman, and Karri Kaitue and Tapani Järvinen as members.
The aim is to emphasize the impor-tance of the development and manage-ment of human capital in a high tech-nology company. The main focus is on making the company the industry’s most attractive employer by facilitating man-agement, well-being, and organization, as well as by ensuring the correct skills and performance level in the implemen-tation of the HC plan. The leadership capacity of current and future Outotec leaders is within HCC’s special focus. In addition, HCC ensures that compensation arrangements support long term busi-ness objectives and growth in share-holder value, and that all human capital practices support the strategic aims of the business and enable the recruitment, development, motivation, and retention of key personnel. The committee will also prepare matters pertaining to the appointment of the CEO and his/her pos-sible deputy and other executives as well as the identification of their successors.
Strengthening a common identityOne of the focus areas for 2011 has been defined as the strengthening and unifica-tion of Outotec’s identity. After several changes and acquisitions, there is a need to focus on common goals, operating methods, and practices based on the company’s values and principles. The strengthening of a common identity and smooth cooperation throughout Outotec supports the company’s goals: growth, profitability, and a strong balance sheet.
incentive program in 2010. Reward bases and job evaluation have been developed in recent years in such a way that they take into account the demands of the job. Thus, rewards for all jobs are based on how demanding the job is, which is transparently and fairly defined, rather than, for example, on the basis of a job title. Job grading had already been implemented in Finland, Peru, Chile, and Brazil. During 2010 it was also completed in Russia, Canada, China, and India. This work will be finalized in the whole of Outotec during 2011.
Human Capital CommitteeOutotec’s Board of Directors established a Human Capital Committee and ap-pointed the Chairman of the Board of
outotec has active cooperation with students of various universities to strengthen employee image
and to attract future employees.
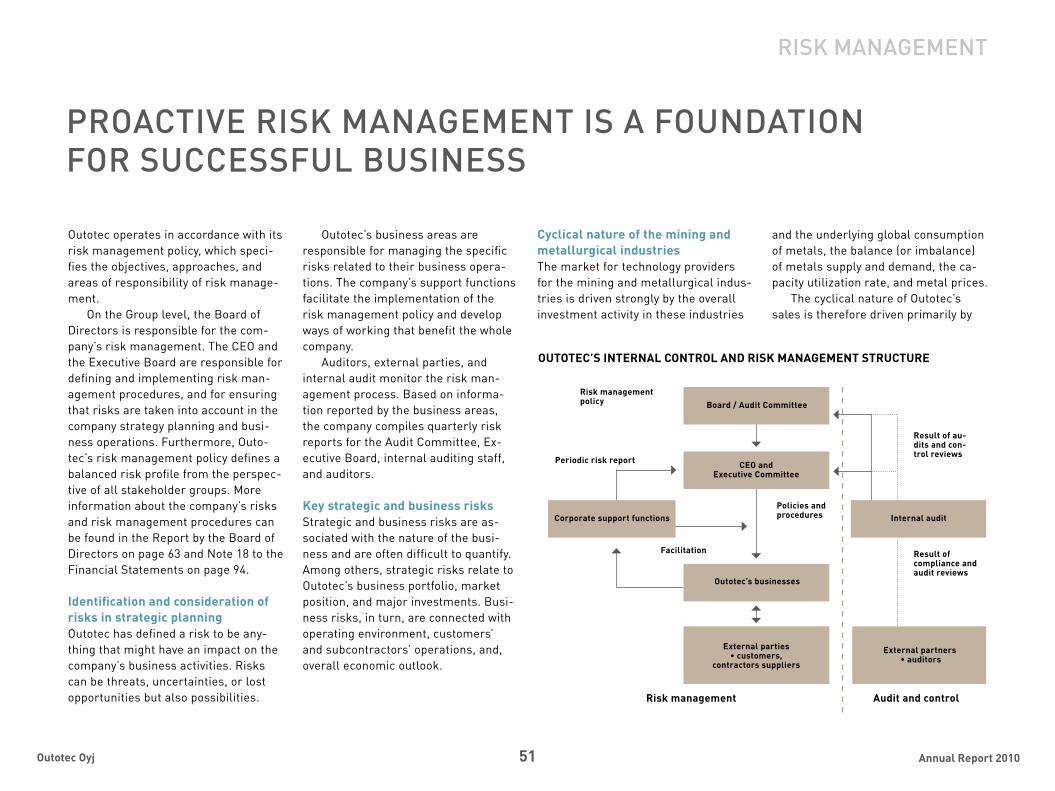
51 Annual Report 2010Outotec Oyj
Outotec operates in accordance with its risk management policy, which speci-fies the objectives, approaches, and areas of responsibility of risk manage-ment.
On the Group level, the Board of Directors is responsible for the com-pany’s risk management. The CEO and the Executive Board are responsible for defining and implementing risk man-agement procedures, and for ensuring that risks are taken into account in the company strategy planning and busi-ness operations. Furthermore, Outo-tec’s risk management policy defines a balanced risk profile from the perspec-tive of all stakeholder groups. More information about the company’s risks and risk management procedures can be found in the Report by the Board of Directors on page 63 and Note 18 to the Financial Statements on page 94.
Identification and consideration of risks in strategic planningOutotec has defined a risk to be any-thing that might have an impact on the company’s business activities. Risks can be threats, uncertainties, or lost opportunities but also possibilities.
RisK ManaGeMenT
pRoaCTive RisK ManaGeMenT is a foundaTion foR suCCessful business
Outotec’s business areas are responsible for managing the specific risks related to their business opera-tions. The company’s support functions facilitate the implementation of the risk management policy and develop ways of working that benefit the whole company.
Auditors, external parties, and internal audit monitor the risk man-agement process. Based on informa-tion reported by the business areas, the company compiles quarterly risk reports for the Audit Committee, Ex-ecutive Board, internal auditing staff, and auditors.
Key strategic and business risksStrategic and business risks are as-sociated with the nature of the busi-ness and are often difficult to quantify. Among others, strategic risks relate to Outotec’s business portfolio, market position, and major investments. Busi-ness risks, in turn, are connected with operating environment, customers’ and subcontractors’ operations, and, overall economic outlook.
Cyclical nature of the mining and metallurgical industries The market for technology providers for the mining and metallurgical indus-tries is driven strongly by the overall investment activity in these industries
and the underlying global consumption of metals, the balance (or imbalance) of metals supply and demand, the ca-pacity utilization rate, and metal prices.
The cyclical nature of Outotec’s sales is therefore driven primarily by
Board / Audit Committee
Outotec’s businesses
External partners•auditors
Risk management policy
Periodic risk report
Facilitation Result of compliance and audit reviews
OUTOTEC’S INTERNAL CONTROL AND RISK MANAGEMENT STRUCTURE
Corporate support functions
CEO and Executive Committee
Internal audit
Result of au-dits and con-trol reviews
Policies and procedures
External parties •customers,
contractors suppliers
Audit and controlRisk management

52 Annual Report 2010Outotec Oyj
the changes in global supply and de-mand related to metals and the capital expenditure plans of the mining and metallurgical companies. In order to be less dependent on the cycles of the mining and metals industries, Outotec has started to strengthen its services offering and to pursue opportunities to sell its technologies to other pro-cess industries such as the fertilizer industry, energy and industrial water treatment.
Competitive environment and changes in customer requirements For decades, Outotec has been able to maintain and strengthen its com-petitive position and market share by continuous investment in research and development in order to offer supe-rior technologies and processes to its customers. Each of Outotec’s business areas operate in somewhat different competitive business environments. For some technologies, the market en-try barrier is high because of the years of practical experience needed in order to successfully design and commission processes meeting the needs required with different ore contents. Outotec closely monitors the markets to stay ahead of the competition and any pos-sible new entrants.
The company’s aim is to develop new technologies and services and to commercialize them. Outotec’s future success will also depend on its ability to enhance its existing technologies and services, address the increasingly
RisK ManaGeMenT
Outotec’s approach
Developing global engineering, shared supply function and, competitive cost structure. Emphasis on minimizing the lifetime cost of customer operations by offering the latest technological developments and performance guarantees.
PROACTIVE RISK MITIGATION
Most of the contracts are fixed price. Outotec secures the cost of raw materials, components, and outsourced work before making an offer to a customer in order to hedge possible price increases in subcontracted materials and work. Additionally, currency risks are the main market risk for Outotec and identifying exposures in a timely and precise manner is a key requirement for successful hedging, also affecting pricing.
Outotec applies strict criteria when adding projects to order intake and backlog. Most projects are cash flow positive starting from an advance payment and continuing with milestone payments. If cancellations occur, committed costs and lost profits must be typically covered by the cancelling party.
Outotec uses hundreds of suppliers around the world where ever it is most feasible for the project. These suppliers include mechanical workshops, component manufacturers and local construction and engineering companies. The relationships are long term and new, critical suppliers undergo financial and quality audits.
Outotec has delivered thousands of projects in the past decades and has strong experience in international project management and execution work in different cultures and conditions. The company has developed a comprehensive project risk management monitoring system called PRIMA (Project Risk Identification and Management). The company has also focused more on the different interpretations of international and local tax rules and regulations which might cause additional direct or indirect taxes thus reducing the company’s net result.
Outotec only enters into new industries where applications have clear technology synergies and which are strongly based on core capabilities.
Outotec’s competitive advantage is highly dependent on skilled personnel. The company offers its personnel the op-portunity for professional development through state-of-the-art facilities and international job rotation opportunities as well as competitive incentive and commitment schemes. Pro-active human capital processes to maintain an attrac-tive employer image and continue to offer world class employment opportunities within the industry.
In order for the company to have sufficient coverage, the Group’s insurance coverage is reviewed regularly and, if needed, the company takes project based additional insurance cover.
Empowering people to focus on customers’ needs and to achieve global and local goals through the new operational structure.
Strengthening local capabilities and expertise and increasing local presence and cultural knowledge.
Further maintaining and developing the flexible asset light operational model and sufficient use of subcontracting as well as following tight cost discipline across all operations.
Outotec’s research and testing facilities are used in testing customers’ raw materials in order to select the optimum process and discover parameters for performance guarantees.
Uncertainty of com-mencement of projects
Cost competition
Uncertainties
Pricing of contracts
Suspension, termination, and alteration of contracts
Dependence on suppliers
Ability to implement large and complex customer projects
New industry applications
Ability to retain key personnel managing in-house resources
Sufficiency of insurance coverage
Global operational model
Political risks
Macroeconomic crisis
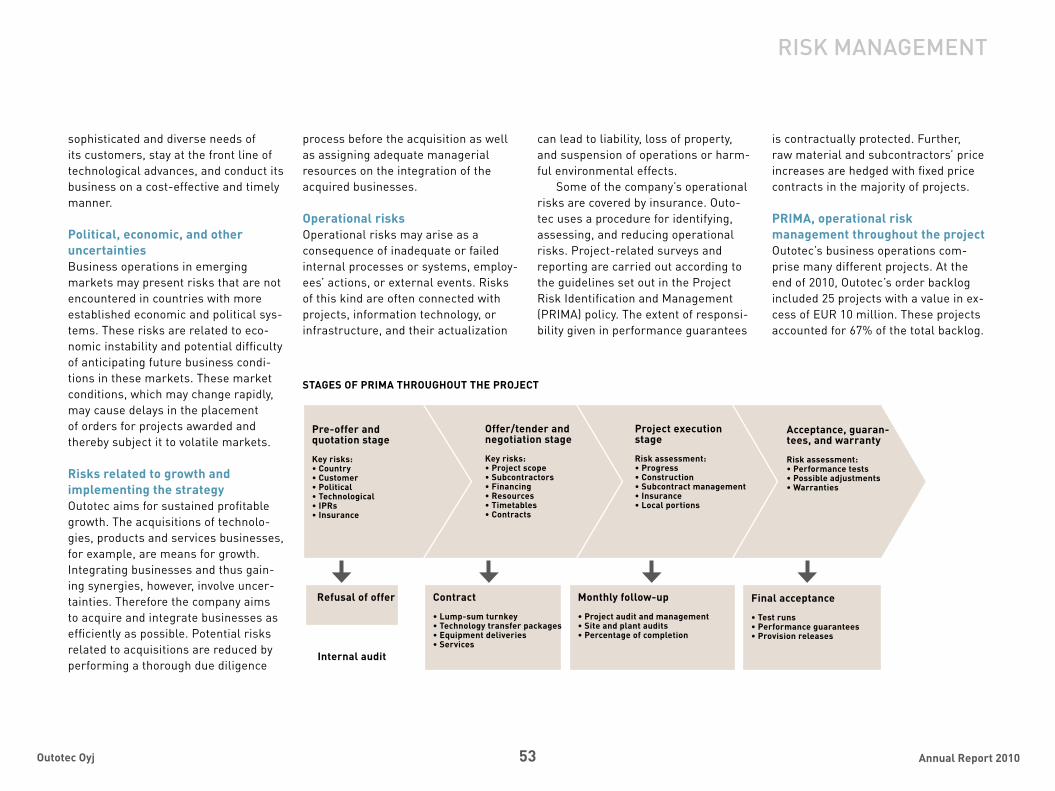
53 Annual Report 2010Outotec Oyj
sophisticated and diverse needs of its customers, stay at the front line of technological advances, and conduct its business on a cost-effective and timely manner.
Political, economic, and other uncertainties Business operations in emerging markets may present risks that are not encountered in countries with more established economic and political sys-tems. These risks are related to eco-nomic instability and potential difficulty of anticipating future business condi-tions in these markets. These market conditions, which may change rapidly, may cause delays in the placement of orders for projects awarded and thereby subject it to volatile markets.
Risks related to growth andimplementing the strategy Outotec aims for sustained profitable growth. The acquisitions of technolo-gies, products and services businesses, for example, are means for growth. Integrating businesses and thus gain-ing synergies, however, involve uncer-tainties. Therefore the company aims to acquire and integrate businesses as efficiently as possible. Potential risks related to acquisitions are reduced by performing a thorough due diligence
process before the acquisition as well as assigning adequate managerial resources on the integration of the acquired businesses.
Operational risks Operational risks may arise as a consequence of inadequate or failed internal processes or systems, employ-ees’ actions, or external events. Risks of this kind are often connected with projects, information technology, or infrastructure, and their actualization
RisK ManaGeMenT
can lead to liability, loss of property, and suspension of operations or harm-ful environmental effects.
Some of the company’s operational risks are covered by insurance. Outo-tec uses a procedure for identifying, assessing, and reducing operational risks. Project-related surveys and reporting are carried out according to the guidelines set out in the Project Risk Identification and Management (PRIMA) policy. The extent of responsi-bility given in performance guarantees
is contractually protected. Further, raw material and subcontractors’ price increases are hedged with fixed price contracts in the majority of projects.
PRIMA, operational risk management throughout the project Outotec’s business operations com-prise many different projects. At the end of 2010, Outotec’s order backlog included 25 projects with a value in ex-cess of EUR 10 million. These projects accounted for 67% of the total backlog.
Pre-offer and quotation stage
Key risks:•Country•Customer•Political•Technological•IPRs•Insurance
Offer/tender and negotiation stage
Key risks:•Projectscope•Subcontractors•Financing•Resources•Timetables•Contracts
Project execution stage
Risk assessment: •Progress•Construction•Subcontractmanagement•Insurance•Localportions
Acceptance, guaran-tees, and warranty
Risk assessment: •Performancetests•Possibleadjustments•Warranties
STAGES OF PRIMA THROUGHOUT THE PROJECT
Refusal of offer Monthly follow-up
•Projectauditandmanagement•Siteandplantaudits•Percentageofcompletion
Final acceptance
•Testruns•Performanceguarantees•Provisionreleases
Internal audit
Contract
•Lump-sumturnkey•Technologytransferpackages•Equipmentdeliveries•Services
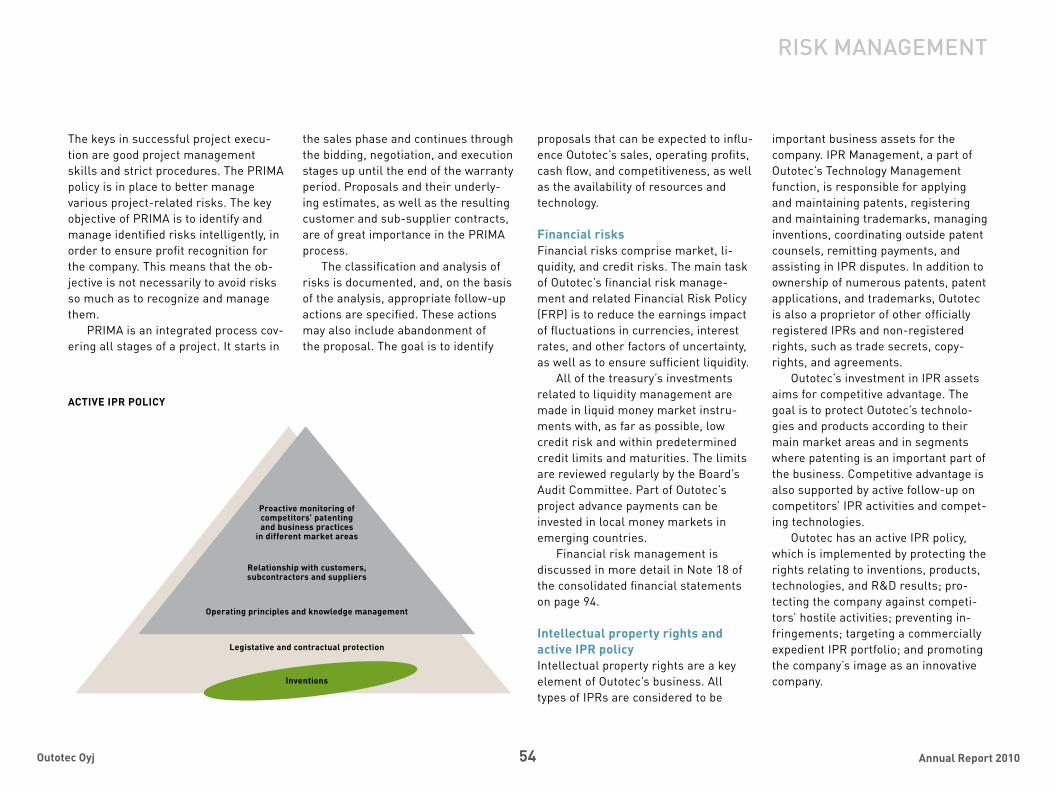
54 Annual Report 2010Outotec Oyj
The keys in successful project execu-tion are good project management skills and strict procedures. The PRIMA policy is in place to better manage various project-related risks. The key objective of PRIMA is to identify and manage identified risks intelligently, in order to ensure profit recognition for the company. This means that the ob-jective is not necessarily to avoid risks so much as to recognize and manage them.
PRIMA is an integrated process cov-ering all stages of a project. It starts in
the sales phase and continues through the bidding, negotiation, and execution stages up until the end of the warranty period. Proposals and their underly-ing estimates, as well as the resulting customer and sub-supplier contracts, are of great importance in the PRIMA process.
The classification and analysis of risks is documented, and, on the basis of the analysis, appropriate follow-up actions are specified. These actions may also include abandonment of the proposal. The goal is to identify
ACTIVE IPR POLICY
Proactive monitoring of competitors’ patenting and business practices
in different market areas
Relationship with customers, subcontractors and suppliers
Operating principles and knowledge management
Legistative and contractual protection
Inventions
proposals that can be expected to influ-ence Outotec’s sales, operating profits, cash flow, and competitiveness, as well as the availability of resources and technology.
Financial risks Financial risks comprise market, li-quidity, and credit risks. The main task of Outotec’s financial risk manage-ment and related Financial Risk Policy (FRP) is to reduce the earnings impact of fluctuations in currencies, interest rates, and other factors of uncertainty, as well as to ensure sufficient liquidity.
All of the treasury’s investments related to liquidity management are made in liquid money market instru-ments with, as far as possible, low credit risk and within predetermined credit limits and maturities. The limits are reviewed regularly by the Board’s Audit Committee. Part of Outotec’s project advance payments can be invested in local money markets in emerging countries.
Financial risk management is discussed in more detail in Note 18 of the consolidated financial statements on page 94.
Intellectual property rights and active IPR policy Intellectual property rights are a key element of Outotec’s business. All types of IPRs are considered to be
important business assets for the company. IPR Management, a part of Outotec’s Technology Management function, is responsible for applying and maintaining patents, registering and maintaining trademarks, managing inventions, coordinating outside patent counsels, remitting payments, and assisting in IPR disputes. In addition to ownership of numerous patents, patent applications, and trademarks, Outotec is also a proprietor of other officially registered IPRs and non-registered rights, such as trade secrets, copy-rights, and agreements.
Outotec’s investment in IPR assets aims for competitive advantage. The goal is to protect Outotec’s technolo-gies and products according to their main market areas and in segments where patenting is an important part of the business. Competitive advantage is also supported by active follow-up on competitors’ IPR activities and compet-ing technologies.
Outotec has an active IPR policy, which is implemented by protecting the rights relating to inventions, products, technologies, and R&D results; pro-tecting the company against competi-tors’ hostile activities; preventing in-fringements; targeting a commercially expedient IPR portfolio; and promoting the company’s image as an innovative company.
RisK ManaGeMenT

55 Financial Statements 2010Outotec Oyj
Outotec OyjFinancial statements 2010

56 Financial Statements 2010Outotec Oyj
all figures in the annual report have been rounded and consequently the sum of individual figures may deviate from the sum presented.Key figures have been calculated using exact figures.
Report by the Board of Directors 57
COnsOlidated finanCial statements, ifRsstatement of comprehensive income 65 statement of financial position 66 statement of cash flows 68 statement of changes in equity 69 notes to the consolidated financial statements 1. corporate information 70 2. accounting principles to the consolidated financial statements 70 3. Operating segments 74 4. Business combinations 78 5. construction contracts 81 6. Other income 81 7. Other expenses 81 8. Function expenses by nature 81 9. employee benefit expenses 82 10. share-based payments 83 11. Finance income and expenses 85 12. income tax expenses 86 13. earnings per share 88 14. intangible assets 89 15. Property, plant and equipment 91 16. investments in associated companies 92 17. available-for-sale financial assets 93 18. Financial risk management 94 19. Derivative instruments 98 20. inventories 99 21. trade and other receivables 100 22. cash and cash equivalents 101 23. equity 101 24. employee benefit obligations 102 25. Provisions 104 26. interest-bearing liabilities 104 27. trade and other payables 105 28. carrying amounts of financial assets and liabilities by categories 106 29. commitments and contingent liabilities 109 30. Disputes and litigations 109 31. Related party transactions 110 32. events after the reporting period 110 33. subsidiaries 111
Key finanCial figuRes, ifRsKey financial figures of the Group 112Quarterly information 113 share-related key figures 113Definitions of key financial figures 114
PaRent COmPany’s finanCial statements, fasincome statement of the parent company 115Balance sheet of the parent company 116cash flow statement of the parent company 117notes to the parent company’s financial statements 118
shares and shareholders 126 auditors’ report 130
COntents

57 Financial Statements 2010Outotec Oyj
Operating environmentthe overall market conditions continued to fur-ther strengthen throughout 2010. the mining and metals industry continued on the recovery path supported by a positive long-term outlook for metals demand in the emerging econo-mies. the production capacity utilization rate increased and investments in new produc-tion were commenced, which also increased equipment and service sales. Following the recession, companies had an accumulated need to invest in their existing operations and investment plans were revitalized. in 2010, the customer negotiation activity was especially strong in copper, gold, and iron projects, but activity around other metals was also recover-ing. the mining and metals industry benefit-ted from strong metals prices; however, the uncertainty that still prevailed in the financial markets continued to have an impact on the investment activities of some companies. Decision-making, particularly regarding major projects involving construction of new capac-ity, took time. Drive for sustainable solutions continued strongly and the requirements on the technology were getting stricter, which is positive for Outotec.
Outotec delivers advanced technology solutions which enable customers to minimize their processes’ life time costs and environ-mental impacts. this has helped in winning new orders with normal gross margins and customary payment terms despite intense competition.
Order intake Order intake in 2010 amounted to eUR 1,394.7 million (2009: eUR 557.1 million), including large plant deliveries, technology and equip-ment deliveries as well as services.
major new orders in 2010:sinter plant for Kalagadi manganese, south •africa (eUR 119 million);
copper roasting, off-gas, and sulfuric acid •plants for codelco, chile (eUR 116 million);Drinking water supply scheme to the am-•para District, sri lanka (eUR 70 million);copper solvent extraction and electrowin-•ning plant for minera lumina copper, chile (eUR 65 million);sintering and ferrochrome smelting tech-•nology for Outokumpu, Finland (eUR 45 million);copper concentrator technology for iRascO, •italy, project in iran (eUR 40 million);Flotation circuit and filtration technology •for australia’s Karara iron Ore project (over eUR 28 million);integrated digestion and evaporation •facility for ma’aden aluminium project in saudi arabia together with Hatch (total eUR 50 million, with roughly equal share of the work between Outotec and Hatch). small portion became effective in the order backlog in 2010 and the rest by project milestones in 2011 and 2012;Flotation technology for First Quantum min-•erals, Finland, and Zambia (eUR 20 million);iron ore sintering plant for steel authority of •india ltd, india (value not disclosed but typi-cally technology solutions with correspond-ing scope range from eUR 20 to 25 million);chromite sintering technology for Xstrata •merafe, south africa (eUR 17 million);copper smelter technology for tongling •non-ferrous metals Group, china (eUR 15 million);electric furnace and related services for •Konkola copper mines, Zambia (eUR 13 million);Precious metal plant for Baiyin non Ferrous •Group, china (eUR 6 million); Kaldo furnace technology for Boliden’s •Rönnskär copper smelter, sweden (value not disclosed).
Pelletizing technology for Bhushan Power & •steel Plant, india (value not disclosed); andsintering technology for JsW steel limited, •india (value not disclosed).
Order backlog the order backlog at the end of 2010 totaled eUR 1,393.1 million, which is 61% higher than at the previous year-end (December 31, 2009: eUR 867.4 million).
at the end of 2010, Outotec’s order backlog included 25 projects with an order backlog value in excess of eUR 10 million, accounting for 67% of the total backlog. management es-timates that roughly 69% (approximately eUR 960 million) of the current backlog value will be delivered in 2011 and the rest in 2012 and beyond. the order backlog at the end of 2010 included roughly eUR 50 million in suspended projects.
Sales and financial resultOutotec’s sales in 2010 totaled eUR 969.6 mil-lion (2009: eUR 877.7 million). the growth in sales came from acquisitions. Underlying sales were affected by the low order backlog at the beginning of the year and because revenue recognition from large orders received in 2010 was slow in the early phases.
the services business, which is included in the sales figures of the three other business areas, totaled eUR 282.5 million in 2010 (2009: eUR 148.6 million), up 90% from the compari-son period and accounting for 29% of sales (2009: 17%). the services business sales grew both organically and through acquisitions. sup-ported by the larox and millteam acquisitions, Outotec achieved its services business sales target of eUR 250-300 million by the end of 2010, which was set at the beginning of 2008.
in the reporting period, the operating profit excluding one-time items and purchase price allocation (PPa) amortizations was eUR
RePORt By tHe BOaRd Of diReCtORs
74.7 million, representing 7.7% of sales. the increase in operating profit before one-time items and PPa amortizations resulted from a higher sales volume, better gross margin of 26.2% (2009: 21.7%), and improvement of fixed cost structure compared to the comparison period. One-time costs related to restructuring in the reporting period amounted to eUR 26.5 million, approximately half of which came from asset write-offs and the rest from costs and provisions caused by personnel reductions and one-time items related to the integration of acquired companies. PPa amortizations for the reporting period were eUR 9.4 million.
Operating profit was eUR 41.6 million (2009: eUR 58.6 million). the unrealized and realized exchange gains related to currency forward contracts, improved profitability by eUR 1.9 million (2009: unrealized and realized loss of eUR 0.1 million). the result for the reporting period also included eUR 2.2 million net positive effect from the ausmelt acquisi-tion, including eUR 3.3 million revaluation gain and eUR 1.1 million acquisition costs.
in 2010, Outotec’s fixed costs were eUR 188.5 million (2009: eUR 131.6 million). the increase was primarily due to the fixed costs of acquired companies and due to higher sales and marketing expenses reflecting the strong market and related tendering and quotation activity.
Outotec’s profit before taxes for the report-ing period was eUR 37.1 million (2009: eUR 60.9 million). it included a net finance expense of eUR 4.5 million (2009: net finance income eUR 2.2 million). the net finance expense in-creased primarily due to low interest rates and fees related to the new financing credit facili-ties. Profit for the period was eUR 26.7 million (2009: eUR 42.3 million), impacted by one-time costs related to restructuring and PPa amorti-zations. taxes totaled eUR 10.4 million (2009: eUR 18.6 million). earnings per share were
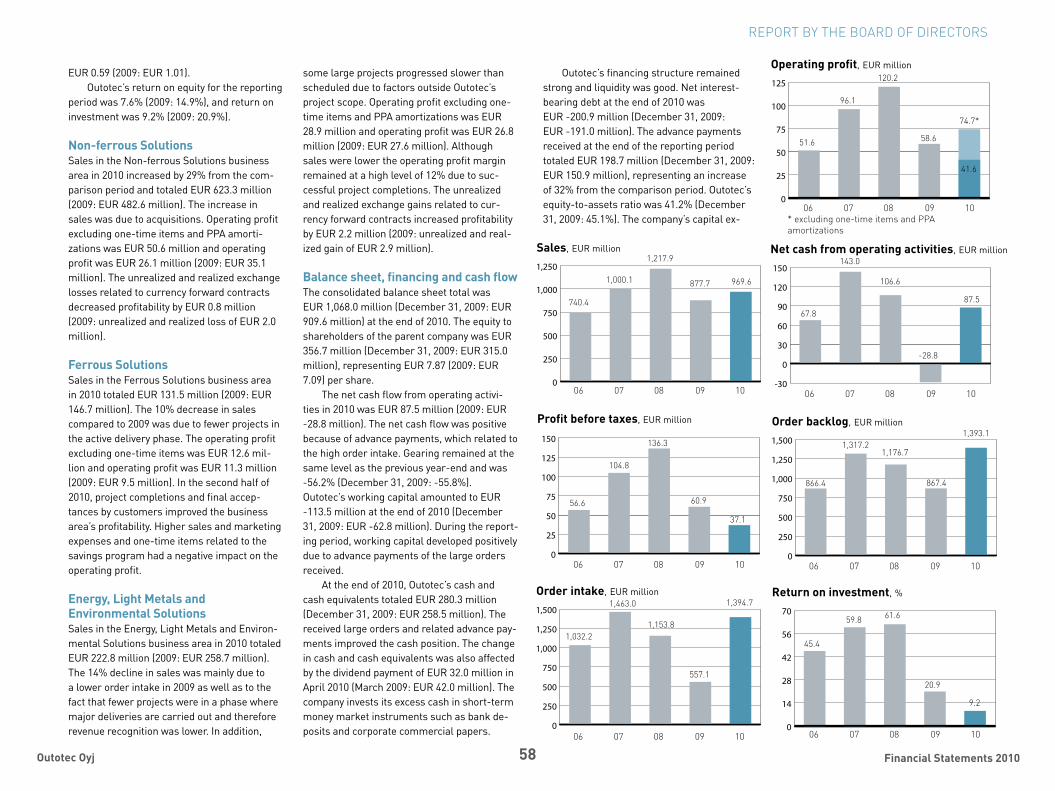
58 Financial Statements 2010Outotec Oyj
eUR 0.59 (2009: eUR 1.01).Outotec’s return on equity for the reporting
period was 7.6% (2009: 14.9%), and return on investment was 9.2% (2009: 20.9%).
Non-ferrous Solutionssales in the non-ferrous solutions business area in 2010 increased by 29% from the com-parison period and totaled eUR 623.3 million (2009: eUR 482.6 million). the increase in sales was due to acquisitions. Operating profit excluding one-time items and PPa amorti-zations was eUR 50.6 million and operating profit was eUR 26.1 million (2009: eUR 35.1 million). the unrealized and realized exchange losses related to currency forward contracts decreased profitability by eUR 0.8 million (2009: unrealized and realized loss of eUR 2.0 million).
Ferrous Solutionssales in the Ferrous solutions business area in 2010 totaled eUR 131.5 million (2009: eUR 146.7 million). the 10% decrease in sales compared to 2009 was due to fewer projects in the active delivery phase. the operating profit excluding one-time items was eUR 12.6 mil-lion and operating profit was eUR 11.3 million (2009: eUR 9.5 million). in the second half of 2010, project completions and final accep-tances by customers improved the business area’s profitability. Higher sales and marketing expenses and one-time items related to the savings program had a negative impact on the operating profit.
Energy, Light Metals and Environmental Solutionssales in the energy, light metals and environ-mental solutions business area in 2010 totaled eUR 222.8 million (2009: eUR 258.7 million). the 14% decline in sales was mainly due to a lower order intake in 2009 as well as to the fact that fewer projects were in a phase where major deliveries are carried out and therefore revenue recognition was lower. in addition,
some large projects progressed slower than scheduled due to factors outside Outotec’s project scope. Operating profit excluding one-time items and PPa amortizations was eUR 28.9 million and operating profit was eUR 26.8 million (2009: eUR 27.6 million). although sales were lower the operating profit margin remained at a high level of 12% due to suc-cessful project completions. the unrealized and realized exchange gains related to cur-rency forward contracts increased profitability by eUR 2.2 million (2009: unrealized and real-ized gain of eUR 2.9 million).
Balance sheet, financing and cash flowthe consolidated balance sheet total was eUR 1,068.0 million (December 31, 2009: eUR 909.6 million) at the end of 2010. the equity to shareholders of the parent company was eUR 356.7 million (December 31, 2009: eUR 315.0 million), representing eUR 7.87 (2009: eUR 7.09) per share.
the net cash flow from operating activi-ties in 2010 was eUR 87.5 million (2009: eUR -28.8 million). the net cash flow was positive because of advance payments, which related to the high order intake. Gearing remained at the same level as the previous year-end and was -56.2% (December 31, 2009: -55.8%). Outotec’s working capital amounted to eUR -113.5 million at the end of 2010 (December 31, 2009: eUR -62.8 million). During the report-ing period, working capital developed positively due to advance payments of the large orders received.
at the end of 2010, Outotec’s cash and cash equivalents totaled eUR 280.3 million (December 31, 2009: eUR 258.5 million). the received large orders and related advance pay-ments improved the cash position. the change in cash and cash equivalents was also affected by the dividend payment of eUR 32.0 million in april 2010 (march 2009: eUR 42.0 million). the company invests its excess cash in short-term money market instruments such as bank de-posits and corporate commercial papers.
REPORT BY THE BOARD OF DIRECTORS
0
250
500
750
1,000
1,250
Sales, eUR million
06 07 08 09 10
0
25
50
75
100
125
Operating profit, eUR million
06 07 08 09 10
0
250
500
750
1,000
1,250
1,500
Order backlog, eUR million
06 07 08 09 10
-30
0
30
60
90
120
150
Net cash from operating activities, eUR million
06 07 08 09 10
0
250
500
750
1,000
1,250
1,500
Order intake, eUR million
06 07 08 09 10
0
25
50
75
100
125
150
Profit before taxes, eUR million
06 07 08 09 10
0
14
28
42
56
70
Return on investment, %
06 07 08 09 10
969.6
740.4
1,000.1
1,217.9
877.7
41.6
51.6
96.1
120.2
58.6
866.4
1,317.21,176.7
867.4
1,393.1
1,394.7
1,032.2
1,463.0
1,153.8
557.1
37.1
56.6
104.8
136.3
60.9
87.5
67.8
143.0
106.6
-28.8
9.2
45.4
59.8 61.6
20.9
74.7*
* excluding one-time items and PPA amortizations
Outotec’s financing structure remained strong and liquidity was good. net interest-bearing debt at the end of 2010 waseUR -200.9 million (December 31, 2009: eUR -191.0 million). the advance payments received at the end of the reporting period totaled eUR 198.7 million (December 31, 2009: eUR 150.9 million), representing an increase of 32% from the comparison period. Outotec’s equity-to-assets ratio was 41.2% (December 31, 2009: 45.1%). the company’s capital ex-

59 Financial Statements 2010Outotec Oyj
penditure in 2010 was eUR 96.7 million (2009: eUR 98.0 million), of which eUR 77.2 million was related to acquisitions. Other capital expenditure included investments mainly in information technology, machinery, and intel-lectual property rights.
at the end of the reporting period guaran-tees for commercial commitments, including advance payment guarantees issued by the parent and other Group companies were eUR 308.1 million (December 31, 2009: eUR 321.3 million). at the end of the reporting period, the total volume of pledges and mortgages was eUR 0.6 million (December 31, 2009: eUR 33.4 million). the reduction since the year-end 2009 was due to the repayment of most of larox’s external credit facilities.
On november 25, 2010, Outotec signed two credit facilities: eUR 500 million multicur-rency Revolving Guarantee issuance Facility and eUR 50 million multicurrency Revolving credit Facility (the “Facilities”). the 3+1+1 year Facilities have been put in place to refinance Outotec’s existing guarantee and revolv-ing credit facilities and to provide Outotec guarantees and liquidity for general corporate purposes.
On april 23, 2010, Outotec established a continuous commercial paper program for domestic investors consisting of a principal amount of eUR 100 million. By the end of the reporting period, Outotec had emitted eUR 10.0 million worth of commercial papers.
Cost savings programOutotec’s aim was to achieve eUR 25 million annualized savings in operational fixed costs, including the fixed costs of sales, by the end of 2010 compared to the fourth quarter of 2009 with full effect in 2011. savings were planned to be achieved through the implementation of the new operational model and synergy benefits from acquisitions. to achieve these savings, one-time costs were expected to be approximately eUR 25 million.
in 2010, one-time items related to the cost savings program and the integration of the acquired businesses totaled eUR 26.5 million. approximately half of these items came from asset write-offs and the rest from provisions related to personnel reductions and other non-personnel related costs. the total personnel reduction in Finland was 97, including retire-ments and the termination of temporary con-
REPORT BY THE BOARD OF DIRECTORS
tracts. in 2010, the total personnel reduction globally was 161.
the cost saving program was closed at the end of 2010 and it will lead, with comparable foreign exchange rates, to eUR 26.2 million annualized operational fixed costs savings, of which eUR 23 million are cash effective. in 2010, the realized cost savings from operation-al fixed costs and one-time items totaled eUR 16.4 million with full effect in 2011.
Corporate structureNew operational model and reporting segments as of april 1, 2010, Outotec’s businesses were re-organized into four business areas, three of which are reporting segments. the new reporting segments are:
Non-ferrous Solutions, • consists of busi-nesses related to the processing of copper, nickel, zinc, lead, gold, silver, and platinum group metals as a full process chain from ore to metal as well as industrial minerals. the acquired businesses larox, ausmelt, and millteam are included in this business area; Ferrous Solutions• , consists of businesses related to the processing of iron ores and other ferriferous materials to produce con-centrates, pellets, sinter, direct reduced and hot briquette iron, ferroalloys, and titanium feedstock;Energy, Light Metals and Environmental •Solutions, consists of businesses related to energy (including oil shale, oil sands, and biomass materials), alumina, aluminum, and light metals processing. the business area’s environmental solutions include sulfuric acid plants, applications for gas cleaning and heat recovery systems, as well as industrial water treatment. the acquisi-tion of edmeston is included in the business area.
Services businessthe services business is included in the figures
of the three reporting segments; however, its sales volume is also reported separately. this business area focuses on developing and grow-ing the service business globally and providing life cycle services to customers.
the business areas are supported by a global matrix structure including market-ing, sales, and local delivery operations in geographical market areas, as well as shared global functions. Globally shared functions al-low for a flexible and efficient use of company technologies, capabilities and resources.
Reflecting the new operational model, Outotec published restated comparison figures with allocations of the one-time items by busi-ness area on June 30, 2010, for the reporting periods January-December 2009 and January-march 2010. Full year figures for the period 2006 to 2010 are published in the context of Outotec’s Financial statements 2010.
the Group’s cost allocation principles in the new reporting segment structure have not been changed and the company continues to apply the same accounting principles as before.
Acquisitionsthe acquisition of larox was closed in June 2010. larox develops and delivers industrial filters for separating solids from liquids and its filtration solutions are primarily used in the mining and metallurgical industries worldwide as well as in chemical processing. With the acquisition, Outotec can now provide complete solutions covering a wide range of technolo-gies and services for the entire value chain from ore to metal. larox recorded sales in 2009 of eUR 150 million; the company had about 550 employees and operated in over 40 countries. the acquisition price was approximately eUR 90 million, which was paid mostly with shares. the targeted eUR 7 million synergy benefits from global sales and service networks as well as administration were partially realized in 2010 and will have full effect in 2011.
the acquisition of ausmelt was closed
Sales by SegmenteUR million 2010 2009 non-ferrous solutions 623.3 482.6Ferrous solutions 131.5 146.7energy, light metals and environmental solutions 222.8 258.7Unallocated items1) and intra-group sales -8.0 -10.3total 969.6 877.7 Operating profit by Segment eUR million 2010 2009 non-ferrous solutions 26.1 35.1Ferrous solutions 11.3 9.5energy, light metals and environmental solutions 26.8 27.6Unallocated2) and intra-group items -22.6 -13.5total 41.6 58.6 1) Unallocated items primarily include invoicing of group management and administrative services.2) Unallocated items primarily include group management and administrative services.
60 Financial Statements 2010Outotec Oyj
in march 2010. ausmelt develops, designs, and supplies the top submerged lance (tsl) smelting technology for the production and recycling of metals and processing of industrial wastes. ausmelt’s tsl technology comple-ments Outotec’s smelting technology portfolio. as a result of the acquisition, Outotec now has the industry’s strongest non-ferrous smelt-ing solutions portfolio covering both primary smelting from small to large-scale plants using a variety of feed materials, such as copper, nickel, ferrous metals, zinc, lead and tin con-centrates, and zinc-bearing residues, as well as the smelting of various secondary and waste materials. an additional benefit of ausmelt technology is that it allows the recovery of valu-able metals from by-products. ausmelt’s sales in 2009 were approximately eUR 10 million and it had 40 employees based mainly in australia and asia. the acquisition price paid in cash was approximately aUD 49 million (approximately eUR 30 million).
Outotec acquired swedish edmeston aB in may 2010. the company has unique capabili-ties in special stainless steel grades suitable for use in highly corrosive environments. the acquisition further strengthens Outotec’s posi-tion especially in sulfuric acid plant solutions through proprietary equipment and particularly in services for own and also other installed plants. edmeston’s sales in 2009 were approxi-mately eUR 10 million and the company em-ployed 10 professionals. the acquisition price, which was paid in cash, was not disclosed.
Outotec acquired millteam sweden’s ser-vice business in march 2010. millteam offers maintenance services, complete installations, installation supervision, maintenance inspec-tions, and service of equipment for mining companies and it has special expertise in grinding mill services. the millteam acquisi-tion supports Outotec’s strategy to expand its service offerings. With its new service center in sweden, Outotec can now provide better life cy-cle services for its customers in europe and the cis region. the terms and conditions related to
the acquisition were realized on april 1, 2010. millteam’s sales in 2009 were approximately eUR 4 million and the company employed 35 professionals. the acquisition price, which was paid in cash, was not disclosed.
Purchase price allocation amortizations related to acquisitions were eUR 9.4 million in 2010 (2011: approximately eUR 4 million).
in December, Outotec announced that it had merged its Finnish subsidiary, Outotec Research Oy, with Outotec (Finland) Oy and transferred the parent company Outotec Oyj’s operative business to Outotec (Finland) Oy from the beginning of 2011. the change in the company structure does not affect Outotec’s current operational model or reporting struc-ture. the integration of acquisitions and the simplification of the Outotec legal company structure worldwide proceeded as planned in 2010 and will continue in 2011.
Research and technology development in the reporting period, Outotec’s research and technology development expenses totaled eUR 28.5 million (2009: eUR 20.5 million), rep-resenting 2.9% of sales (2009: 2.3%). Outotec filed 50 new priority patent applications (2009: 56), and 287 new national patents have been granted (2009: 286).
in December, Outotec commissioned a new cO2 removal pilot plant at its R&D center in Frankfurt am main, Germany. it comple-ments Outotec’s circulating fluidized bed (cFB) pilot plant allowing for the cleaning of process gas from iron ore direct reduction as well as from coal and biomass gasification. the new pilot plant plays an important role in the development of Outotec’s new offerings for the energy industry, providing the testing facilities to reduce the carbon footprint of coal and biomass-based energy production as well as in the testing of oil winning from oil shale and oil sand. the pilot installation also allows Outotec to fully demonstrate its proprietary circofer® process for the direct reduction of
fine iron ores based on coal.in December, Outotec launched new ser-
vice products for filters, namely filter cloths and ceramic plates, which are tailored to per-form with Outotec larox® filters. Filter media are crucial for filtration efficiency. new Outotec larox Filter cloths enable optimized perfor-mance and process results for each application and filter. the filter cloth collection covers the entire permeability range.
in september, Outotec joined an indus-trial research program from the University of alberta aimed at fostering sustainable water use in canadian oil sands extraction. Outotec is currently collaborating with Kemira and suncor energy services, the canadian govern-ment, and the alberta Water Research institute to establish a natural science and engineer-ing Research council of canada (nseRc) industrial research chair titled “Water Quality management for Oil sands extraction” at the University of alberta in edmonton, canada. the five-year long research program focuses on water quality management studies to address water consumption, reuse, and recycling by the in situ oil sands extraction industry.
in september, Outotec and Kemira signed a strategic cooperation agreement to develop, promote, and support the companies’ busi-nesses in minerals and oil sands processing as well as associated industrial water treatment solutions. this cooperation combines Outotec’s capability in minerals and oil sands processing technology with Kemira’s experience in water chemistry and related applications to offer customers process optimization enabling cost-efficiency, sustainability, and quality improve-ments.
in October, Outotec announced its coopera-tion with the national Development corpo-ration of mongolia to conduct a conceptual study for a copper smelter to be located in sainshand, mongolia. the mongolian govern-ment plans to build an industrial complex in sainshand to add value to mineral deposits including its Oyu tolgoi copper mining project
and to diversify its economy.in november, Outotec announced it would
donate eUR 300,000 to the aalto University Foundation, eUR 150,000 to the University of Oulu, eUR 100,000 to the lappeenranta Uni-versity of technology, and eUR 50,000 to the Åbo akademi University. this had originally been decided at Outotec Oyj’s annual General meeting on march 18, 2010, authorizing the Board of Directors to determine a donation not to exceed eUR 600,000 to Finnish universities.
Sustainability in December, Outotec signed the United na-tions Global compact initiative and is com-mitted to its principles on human rights, the environment, labor, and fighting corruption. the Global compact initiative is additional evi-dence of Outotec’s aim to further advance sus-tainability and social responsibility principles in its business practices.
in October, Outotec was ranked third best among nordic companies by the carbon Dis-closure Project (cDP) in the carbon Disclosure leadership index, which is a key component of cDP’s annual nordic 200 Report. Outotec’s score in the cDP ranking was 90/100. Outotec participated in the cDP for the first time in 2009 and was commended for its climate change disclosure.
in april, Outotec and Brazilian alumina producer alunorte received an energy ef-ficiency award at the Hannover messe 2010. alunorte was presented with the “special Recognition” award for using optimization processes in its cyclones to improve heat transfer and cut down on pressure losses thus resulting in energy savings and more stable operation. alunorte uses Outotec® calcining technology in its production.
New strategic priorities and long-term financial targets in november 2010, Outotec announced new strategic priorities and financial targets. the company’s goal remains continuous profit-
REPORT BY THE BOARD OF DIRECTORS
61 Financial Statements 2010Outotec Oyj
able growth. Going forward, Outotec intends to focus on providing sustainable life cycle solutions, which guarantee the best return on a customer’s investment. in addition to further strengthening its technology portfolio for the entire value chain from ore to metals, Outotec plans to leverage its core technology assets in expanding to adjacent industries such as energy and industrial water treatment. the company also plans to strengthen its presence in emerging markets, and targets to improve its productivity and scalability.
New long-term financial targetsnew long-term financial targets to ensure con-tinuous profitable growth:
Growth:• Outotec targets to grow faster than the market resulting in a compound average annual sales growth target in the range of 10-20%. Profitability:• Outotec’s annual operating profit margin from business operations is targeted to be on average at 10%, excluding one-time costs and purchase price alloca-tions of acquired businesses.Balance sheet:• Outotec targets to main-tain a strong balance sheet in order for the company to have operational flexibility and execute acquisitions.
these new targets replace the previous long-term financial targets of annual average ePs growth exceeding 10% along with a 5% operating profit margin floor, and a strong bal-ance sheet.
Dividend policythe Board of Directors adopted a dividend policy in november in which the company aims to propose for the approval of the company’s shareholders’ dividends representing at least 40% of the annual net income of Outotec for the preceding financial year.
the amount of future dividends, if any, will be subject to Outotec’s future earnings, financial, condition, cash flows, and working capital requirements. in addition, investments in either organic growth or acquisitions as part
of Outotec’s growth strategy may impact the level of future dividends.
though the Board of Directors has no reason to believe that dividend payments under this policy will not generally be made, there can be no assurance that any annual dividend will actually be paid, nor can there be any assurance as to the amount to be paid in any given year.
New service business targetOutotec has also set a new growth target for its service business. the company aims to grow the sales of its services to an annual level of eUR 500 million by the end of 2015. Growth is planned to be achieved both organically and through acquisitions, expanding the scope of deliveries and new life cycle service offerings.
Personnelat the end of 2010, Outotec had a total of 3,130 employees (December 31, 2009: 3,128) of which 584 employees came from acquired business. in 2010, Outotec had on average 3,151 employees (2009: 2,612). the average number of Outotec’s personnel increased by 539 from the comparison period mainly through acquisitions. temporary personnel accounted for about 8% of the total number of employees.
at the end of 2010, the company had, in ad-dition to its own personnel, approximately 328 (December 31, 2009: 250) full-time equivalent, contracted professionals working in project execution. the number of contracted work-ers at any given time changes with the active project mix and project commissioning, local legislation and regulations as well as seasonal fluctuations.
in 2010, salaries and other employee benefits totaled eUR 224.4 million (2009: eUR 159.5 million).
in november, Outotec announced that the Board of Directors had decided to establish a Human capital committee and elected carl-Gustaf Bergström, chairman of the Board, as chairman of the committee. Other members
are Karri Kaitue and tapani Järvinen. the Hu-man capital committee is to ensure that all human capital-related practices support the strategic aims of the business and enable the recruitment, development, motivation, and retention of key personnel. the leadership capacity of current and future Outotec leaders is within Hcc’s special focus. in addition, Hcc is to ensure that compensation arrangements support achieving long-term business objec-tives and growth in shareholder value. the committee will also prepare matters pertain-ing to the appointment of the ceO and his/her possible deputy and other executives as well as the identification of their successors.
Changes in top managementin October, Outotec announced the appoint-ment of mr. mikko Puolakka, m.sc. (econ.), as chief financial officer and member of the executive Board as of December 1, 2010.
in February, Outotec announced that a new executive board had been appointed to replace its executive and management committees. the new executive board took charge when Outotec shifted into the new operational model on april 1, 2010. the members of the executive board with responsibility areas are:
Pertti Korhonen, President and chief executive OfficerMikko Puolakka, Finance and controlJari Rosendal, non-ferrous solutions businessPekka Erkkilä, Ferrous solutions businessPeter Weber, energy, light metals and environmental solutions business
Kalle Härkki, services businessMartti Haario, market OperationsMichael Frei, supplyAri Jokilaakso, Human capitalTapio Niskanen, Business infrastructure Mika Saariaho, corporate development
Share-based incentive programs and executive board share ownership plan
Share-based Incentive Program 2008-2010no shares were allocated for the 2009 earnings period. the board of directors also decided not to select individuals or earning criteria for the 2010 earning period since the incentive Pro-gram 2010-2012 replaced the old program.
Share-based Incentive Program 2010-2012Outotec’s board of directors decided to adopt a new share-based incentive program for the company’s key personnel. the program has three earning periods: the calendar years 2010, 2011, and 2012. the board determines the amount of the maximum reward for each individual, the earning criteria, and the targets established for them separately on an annual basis.
the board approved 71 individuals with in the scope of the incentive Program 2010-2012 for the 2010 earning period, which began on January 1, 2010. the reward is based on the achievement of the targets set for cost sav-ings, order intake, and earnings per share. the reward will be paid in 2011 in the company’s shares and as a cash payment which equals income taxes. the individual must hold the earned shares for at least two years following
REPORT BY THE BOARD OF DIRECTORS
distribution of Personnel by Country dec 31, 2010 Dec 31, 2009 change, %
Finland 1,056 1,145 -7.8Germany 444 472 -5.9Rest of europe 327 283 15.5americas 759 740 2.6australia 271 239 13.3Rest of the world 273 249 9.6total 3,130 3,128 0.1
62 Financial Statements 2010Outotec Oyj
the end of the earning period. if the individual’s employment ends during this engagement period, (s)he has to return all or part of the earned shares to the company without com-pensation.
the maximum total reward for the 2010 earning period of the incentive Program 2010-2012 is equal to the value of 361,750 Outotec shares, and the maximum value of the rewards of the entire incentive Program 2010-2012 is equal to approximately 1,000,000 shares, in-cluding the cash payment.
Executive Board share ownership planOn may 21, 2010, Outotec’s board of directors determined a new share ownership plan di-rected to the members of the Outotec executive board. as part of the plan, the executive board members established the Outotec manage-ment Oy company, whose entire share capital is owned by them. the purpose of the plan is to commit executive board members to Outotec by encouraging them to acquire and hold Outo-tec shares and thus increase the company’s shareholder value in the long run. they invest a considerable amount of their own funds in company shares and partly through a loan pro-vided by Outotec. the company’s board of di-rectors granted to Outotec management Oy an interest-bearing loan at the maximum amount of eUR 4,980,000 to finance the acquisition of the Outotec shares. the members of the executive board members hold approximately 0.34% of Outotec shares through the company.
Outotec has consolidated Outotec manage-ment Oy into the Group’s financial statements. at the end of 2010, Outotec management Oy held 191,211 Outotec shares which have been accounted as treasury shares on Outotec’s balance sheet. this has decreased the Group’s equity by eUR 5.1 million. more detailed in-formation regarding the plan’s effects to the Group’s equity are presented in the changes in equity table.
Resolutions of the 2010 Annual General Meeting Outotec Oyj’s annual general meeting was held on march 18, 2010, in espoo, Finland. the meeting was opened by the chairman of the board of directors, mr. Risto Virrankoski, and chaired by mr. tomas lindholm, attorney-at-law.
Financial Statementsthe annual general meeting approved the par-ent company and the consolidated financial statements, and also discharged the board of directors’ members and the ceO from liability for the financial year 2009.
Dividendthe annual general meeting participants decided that a dividend of eUR 0.70 per share be paid for the financial year ended December 31, 2009. the dividends, eUR 32.0 million, were paid on april 8, 2010.
The Board of Directors the annual general meeting participants decided on the number of board members, including chairman and vice chairman, to be six (6). mr. carl-Gustaf Bergström, mr. Karri Kaitue, mr. Hannu linnoinen, and mr. anssi soila were re-elected as members of the board of directors, and ms. eija ailasmaa and mr. tapani Järvinen were elected as new board members for the term expiring at the end of the next annual general meeting. the an-nual general meeting elected mr. carl-Gustaf Bergström as the chairman of the board of directors.
the annual general meeting participants confirmed the remunerations to the board members as follows: chairman eUR 5,000 per month and other board members eUR 3,000 per month each, vice chairman and chairman of the audit committee an additional eUR 1,000 per month each, and each board member eUR 500 for attendance at each board and commit-tee meetings as well as reimbursement for direct costs resulting from board work.
During its assembly meeting the Board of Directors elected mr. Karri Kaitue as the vice chairman of the board of directors. in addition, the board elected ms. eija ailasmaa, mr. anssi soila and mr. Hannu linnoinen as members of the audit committee. mr. linnoinen acts as the chairman of the audit committee.
Auditors KPmG Oy ab, authorized Public accountants, was re-elected as the company’s auditor, with mauri Palvi as auditor in charge.
Board’s authorizations the annual general meeting participants au-thorized the board of directors to resolve the repurchase of the company’s shares as follows:
the company may repurchase the maxi-•mum number of 4,578,037 shares using free equity and deviating from the shareholders’ pre-emptive rights to the shares, provided that the number of shares held by the com-pany will not exceed ten (10) percent of all company shares.the shares are to be repurchased in public •trading on the nasDaQ OmX Helsinki at the price established in the trading at the time of acquisition.
the authorization shall be in force until the next annual general meeting. this authoriza-tion has not been executed as of February 8, 2011.
the annual general meeting participants authorized the board of directors to resolve issues of shares and other special rights enti-tling to shares as follows:
the authorization includes the right to is-•sue new shares, distribute shares held by the company, and the right to issue special rights referred to in chapter 10, section 1 of the companies act. this authorization to the board of directors does not, however, entitle the board of directors to issue share option rights as an incentive to the personnel.the total number of new shares to be is-•sued and shares held by the company to be distributed under the authorization may not
exceed 4,578,037 shares.the board of directors is entitled to set •the terms of the share issue, such as the grounds for determining the subscription price of the shares and the final subscrip-tion price as well as the approval of the subscriptions, the allocation of the issued new shares, and the final amount of issued shares.
the authorizations shall be in force until the next annual general meeting. this autho-rization has not been executed as of February 8, 2011.
the annual general meeting participants amended section 9 of the articles of associa-tion so that the notice to convene the general meeting shall be issued no later than 28 days prior to the general meeting.
Participants also authorized the board of directors to decide on a donation to Finnish universities of their choice from the company’s distributable assets. the amount is not to ex-ceed eUR 600,000.
Outotec’s board of directors executed the authorization given by the annual General meeting 2009. this authorization was executed in conjunction with the larox acquisition. the total number of shares issued was 3,780,373 (2,763,419 shares in December 2009 and 1,016,954 shares in February 2010).
Shares and share capitalOutotec’s shares are listed on the nasDaQ OmX Helsinki (Ote1V). at the end of the report-ing period, Outotec’s share capital was eUR 17,186,442.52 consisting of 45,780,373 shares. each share entitles its holder to one vote at the company’s general shareholder meetings.
Trading, market capitalization and shareholdersin the reporting period, the volume-weighted average price for a share in the company was eUR 28.76; the highest quotation for a share was eUR 47.25 and the lowest eUR 18.85. the trading of Outotec shares in 2010 was nearly 100 million shares, with a total value of over
REPORT BY THE BOARD OF DIRECTORS

63 Financial Statements 2010Outotec Oyj
REPORT BY THE BOARD OF DIRECTORS
eUR 2,879 million. at the end of the report-ing period, Outotec’s market capitalization was eUR 2,117 million and the last quotation for the share was eUR 46.24. at the end of the reporting period, the company did not hold any treasury shares for trading purposes.
Outotec has an agreement with a third-party service provider concerning administra-tion and hedging of the share-based incentive program for key personnel. these shares are accounted for as treasury shares on Outotec’s consolidated balance sheet. at the end of the reporting period, the amount of these treasury shares was 332,534. there have been no pur-chases of Outotec shares based on this agree-ment during the reporting period.
Outotec has consolidated Outotec manage-ment Oy (incentive plan for Outotec executive board members) into the Group’s balance sheet. at the end of the reporting period, Outotec management Oy held 191,211 Outotec shares which have been accounted for as treasury shares on Outotec’s balance sheet. this has decreased the Group’s equity by eUR 5.1 million. more detailed information regard-ing the Plan’s effects on the Group’s equity are presented in the consolidated statement of changes in equity table.
at the end of the reporting period, Outotec had 15,114 shareholders. shares held in 17 nominee registers accounted for 57.4% and Finnish households held roughly 13.6% of all Outotec shares.
Events after the reporting periodOn January 21, 2011, Outotec signed a contract with snc-lavalin, a canadian engineering and construction company, to design and deliver a new copper flash smelting furnace and related services to RtB Bor’s smelter in serbia. the contract value exceeded eUR 60 million.
Short-term risks and uncertainties Risks related to the global operating environmentOutotec’s global business operations are sub-ject to various political, economic, and social
conditions. Operations in global markets may present risks related to economic and political instability. conditions may rapidly change and create delays and changes in order placement and execution.
Risks related to Outotec’s businessin the project risk assessment during the reporting period, all unfinished projects were evaluated and provisions for performance guarantees and warranty period guarantees were updated. there were no material changes in the Group’s project risk provisions.
Due to the international project business, different interpretations of international and local tax rules and regulations may cause addi-tional direct or indirect taxes for Outotec, which would reduce the company’s net result.
at the end of the reporting period, Outo-tec’s order backlog included roughly eUR 50 million in suspended projects. some of the suspended projects may be cancelled or re-negotiated. in any market situation, there is a risk of postponement and delays in project business.
acquisitions are an integral part of Outo-tec’s growth strategy. there is a risk that the estimated synergy benefits will not materialize as planned.
Outotec is involved in a few arbitral and court proceedings. Outotec’s management ex-pects that these cases and their outcome will have no material effect on Outotec’s financial result.
the global economic uncertainty may reduce the demand for Outotec’s products and services. Volatility in sales may affect the oper-ating profit margin as the adjustments in fixed costs may become effective with a delay. Outo-tec’s gross margin is also impacted by project mix. Particularly orders which include license fees have a major impact on the gross margin.
Financial risksthere is a risk that customers and suppliers may experience financial difficulties and a lack of financing may result in project delays as
well as bankruptcies, which can also result in losses for Outotec. these risks are reduced by advance and milestone payments and letters of credit. in the reporting period, there were no material credit losses related to payments by Outotec’s counter-parties and at the year-end all receivables were reviewed and credit loss provisions were updated.
Outotec’s business model is based pri-marily on customer advance payments and on-demand guarantees issued by Outotec’s relationship banks. changes in advance pay-ments received have an impact on the liquidity of Outotec. exposure to on-demand guarantees has remained high. cash held by Outotec is primarily invested in short-term bank deposits and in Finnish corporate short-term com-mercial papers. the lower interest rate levels reduce the interest income generated from these investments.
more than half of Outotec’s total cash flow is denominated in euros. the rest is divided among various currencies, including the Us dollar, australian dollar, Brazilian real, cana-dian dollar, and south african rand. the weight of any given currency in new projects can fluctuate substantially, but most cash-flow-related risks are hedged over the short- and long-term. in the short-term, currency fluc-tuations may create volatility in the operating profit. the forecasted and probable cash flows are selectively hedged and are always on the basis of separate decisions and risk analysis. natural hedging is used as widely as possible and the remaining open foreign exchange exposures related to committed cash flows are fully hedged using derivative instruments. the cost of hedging is taken into account in project pricing.
Market outlookthe international monetary Fund estimates the global economy will grow at a rate of 4.4% in 2011. While advanced economies are estimat-ed to grow by approximately 2.5%, develop-ing economies are growing at a rate of 6.5%. the purchasing manager index has globally
been above the 50-point index value indicating steady growth rates in manufacturing, albeit with some trend differences across econo-mies. these factors in conjunction with strong metals prices imply a good metals demand for 2011.
Based on market institutes’ estimates, demand for the most important metals is expected to grow by 4 to 7% annually. the greatest demand still comes from developing countries in which construction is strong and many industries are rapidly growing. the focus, and the construction, of additional capacity have shifted considerably over the past decade. the greatest growth potential lies not only in the emerging markets such as india, china, and cis, but particularly in countries which are rich in raw materials, such as Brazil and chile, or rich in energy resources, such as the middle east region, thereby catering to the growing demand of the emerging markets. in contrast, demand growth for metals in europe, north america, africa, and australia has been flat.
several drivers can be seen in Outotec’s customer industries, with the most significant involving sustainable technologies, compa-nies focusing on their core capability areas, networking and emphasis on cooperation, strong growth in developing countries while the growth in developed countries is evening out. the progress of globalization as well as urbanization increases the need for metals but, at the same time, their production brings about further load on the environment.
Despite the capacity increases implement-ed over the last few years, metals production is not sufficient to satisfy the continuously growing demand. companies in the mining and metals industries will need to increase their production and make it more efficient. tight-ening efficiency and environmental require-ments and the decreasing metal content of ore bodies continue to attract investments in plant modernization, optimization, and increased au-tomation. Rising energy prices are also driving the industry to improve processes in order to achieve lower unit costs.

64 Financial Statements 2010Outotec Oyj
REPORT BY THE BOARD OF DIRECTORS
in addition, there is a continuous need for modernizing and debottlenecking at mine sites and metals processing plants as well as for building more energy-efficient and sustainable plants. according to several mining and metals companies’ announcements, their invest-ments will increase in 2011 compared to 2010. Following the recession, many sales projects have been reactivated, but industry lead times are long, especially in large investments. Po-larization of the global metals market is also seen when new planned investments in metals refining are moving closer to the end markets in emerging economies.
Non-ferrous Solutionsthe activity in the non-ferrous technology market continues to strengthen. Primarily gold and copper projects are being devel-oped. investments in new mining production are progressing faster than investments in the downstream metals processing technolo-gies. competition continues to be tight for new projects. However, long-term fundamentals are strong as ore grades decline and more processing capacity and advanced technology solutions will be needed, both in concentrators and metals refining. Yet, environmental regula-tions grow tougher and the cost of energy and water is climbing; increasing the need for new and modern technological solutions. in 2010, Outotec’s leading market position in providing complete solutions to the ore-to-metal value chain was further enhanced with its acquisi-tions of larox, ausmelt, and millteam, which brought additional technologies and service capabilities to the company.
Ferrous Solutionsthere are strong signs that the demand for raw materials used in steel making, iron ore, and coking coal will continue at record levels. the demand for stainless steel raw materials shows strong growth and the activity in ferroal-loy projects is continuously strengthening. Bra-zil, india, and south africa continue to rapidly develop their infrastructure and to utilize their
large natural resource base. there are several steel plant expansions and new investments under development particularly in Brazil and india, catering mainly to the chinese market where concentrates and pellets are in continu-ous demand. Outotec’s sustainable solutions - both in ferroalloys as well as in iron ore sintering, and pelletizing technologies – con-tinue to be in strong demand because of their energy efficiency and environmental aspects. in the future, unconventional techniques, such as the direct reduction of iron ore, offer more and more opportunities to use lower grade raw material resources as well as optimized energy production and the reduction of cO2 emissions.
Energy, Light Metals and Environmental SolutionsRising oil prices and the depletion of oil re-serves increases the demand for alternative energy sources, such as oil shale, oil sands, and biomass. the world’s recoverable oil shale and oil sand resources are at least ten times greater than those of conventional oil reserves, with large deposits found in the Us, canada, Brazil, china, Jordan, Russia, and estonia. Outotec and eesti energia have jointly devel-oped a new technology enefit using Outotec’s circulating fluidized bed core technology. this technology will be used in eesti energia’s oil shale plant currently under construction in narva, estonia. the enefit technology can be applied globally for processing oil shales and oil sands.
the demand for aluminum is also grow-ing. consequently, aluminum and thus bauxite and alumina projects are being revitalized, not only in china, and in regions which cater to the chinese market, but also in locations where bauxite and in particular low-cost energy is available. thus, the middle east is leveraging its advantageous energy position by building new smelters and refining capacity.
the business area’s environmental solu-tions include sulfuric acid plants as well as applications for gas cleaning and heat recovery
systems. the outlook for the sulfuric acid market remains positive as sulfuric acid is needed in hydrometallurgical processes and is produced as a by-product in the pyrometallur-gical processes, including the minimization of the environmental impacts of the process. the sulfuric acid market is also driven by continu-ous need from the fertilizer industry. in addi-tion to sulfuric acid plants, any metallurgical processes require off-gas cleaning and effluent and water treatment technologies to limit envi-ronmental impacts. Outotec’s market position as a supplier of advanced sulfuric acid plants has been further strengthened by its acquisi-tion of edmeston.
new opportunities in environmental technologies, such as materials recycling and waste management as well as industrial waste water treatment are continuously increasing.
Services businessOutotec’s services business is driven by capacity utilization levels, modernizations, upgrades, and new capital investment projects. customer needs for spare parts, services, and modernizations are increasing due to re-commissioning of production lines. customers have various needs for services ranging from single spare parts to completely outsourced service agreements. this industry trend cre-ates growth opportunities on many levels and supports the company’s goal to be a life cycle partner for its customers. the acquired busi-nesses will further bolster Outotec’s service offering and capabilities globally.
Financial guidance for 2011Based on a strong opening order backlog and active market, in 2011:
order intake is expected to continue to grow,•sales are expected to grow to approximately •eUR 1.25-1.35 billion, and operating profit is expected to improve from •2010 and operating profit margin from busi-ness operations is expected to be approxi-mately 8-9%.
Operating profit is dependent on exchange rates, product mix, timing of new orders, and project completions.
Board of directors proposal for profit distribution the Board of Directors of Outotec proposes to the annual General meeting that a dividend of eUR 0.75 per share be paid from Outotec Oyj’s distributable funds for December 31, 2010, and that any remaining distributable funds be allocated to retained earnings. the suggested dividend record date is march 25, 2011, with the dividend to be paid on april 8, 2011. according to the financial statement for December 31, 2010, the parent company’s distributable funds total eUR 202.3 million. the proposed dividend corresponds to 129% of the Group’s profit for the financial year 2010.there have been no substantial changes in the financial position of the company after the balance sheet date. according to the Board of Directors, the liquidity of the company is good and the proposed profit sharing will not affect the solvency of the company.
Corporate Governance Statementthe corporate governance statement has been given as a separate statement and it is avail-able from Outotec’s website at www.outotec.com/cg.
espoo, February 8, 2011Outotec OyjBoard of Directors
carl-Gustaf Bergström (chairman) Karri Kaitue (Vice chairman)eija ailasmaatapani Järvinen Hannu linnoinenanssi soila
Pertti Korhonen, President and ceO
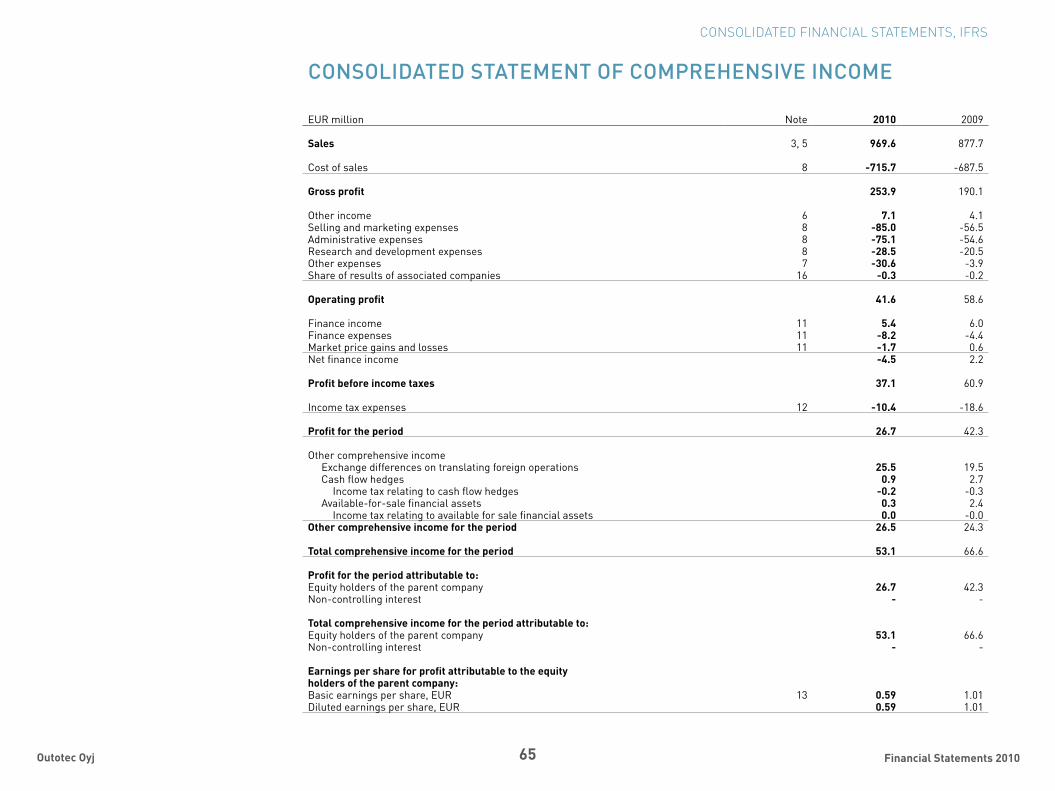
65 Financial Statements 2010Outotec Oyj
COnsOlidated statement Of COmPReHensive inCOme
eUR million note 2010 2009
Sales 3, 5 969.6 877.7
cost of sales 8 -715.7 -687.5
Gross profit 253.9 190.1
Other income 6 7.1 4.1selling and marketing expenses 8 -85.0 -56.5administrative expenses 8 -75.1 -54.6Research and development expenses 8 -28.5 -20.5Other expenses 7 -30.6 -3.9share of results of associated companies 16 -0.3 -0.2
Operating profit 41.6 58.6
Finance income 11 5.4 6.0Finance expenses 11 -8.2 -4.4market price gains and losses 11 -1.7 0.6net finance income -4.5 2.2
Profit before income taxes 37.1 60.9
income tax expenses 12 -10.4 -18.6
Profit for the period 26.7 42.3
Other comprehensive incomeexchange differences on translating foreign operations 25.5 19.5cash flow hedges 0.9 2.7
income tax relating to cash flow hedges -0.2 -0.3available-for-sale financial assets 0.3 2.4
income tax relating to available for sale financial assets 0.0 -0.0Other comprehensive income for the period 26.5 24.3
Total comprehensive income for the period 53.1 66.6
Profit for the period attributable to:equity holders of the parent company 26.7 42.3non-controlling interest - -
Total comprehensive income for the period attributable to:equity holders of the parent company 53.1 66.6non-controlling interest - -
Earnings per share for profit attributable to the equityholders of the parent company:Basic earnings per share, eUR 13 0.59 1.01Diluted earnings per share, eUR 0.59 1.01
CONSOLIDATED FINANCIAL STATEMENTS, IFRS
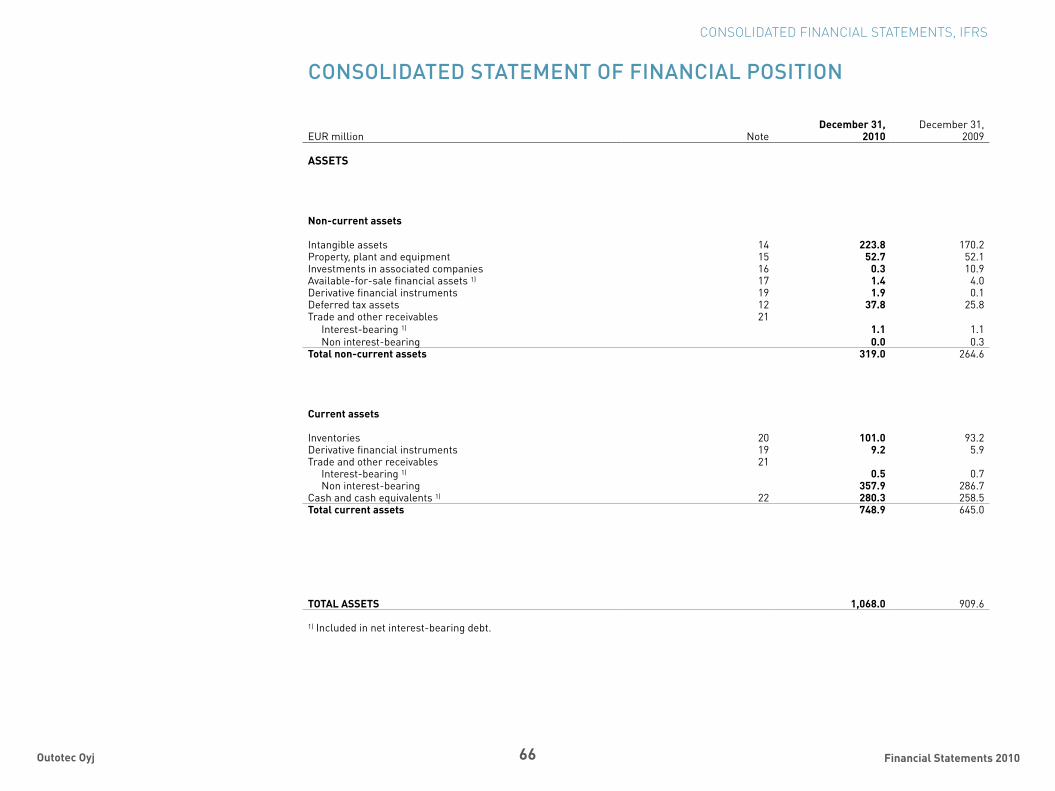
66 Financial Statements 2010Outotec Oyj
COnsOlidated statement Of finanCial POsitiOn
December 31, December 31,eUR million note 2010 2009
ASSETS
Non-current assets
intangible assets 14 223.8 170.2Property, plant and equipment 15 52.7 52.1investments in associated companies 16 0.3 10.9available-for-sale financial assets 1) 17 1.4 4.0Derivative financial instruments 19 1.9 0.1Deferred tax assets 12 37.8 25.8trade and other receivables 21
interest-bearing 1) 1.1 1.1non interest-bearing 0.0 0.3
Total non-current assets 319.0 264.6
Current assets
inventories 20 101.0 93.2Derivative financial instruments 19 9.2 5.9trade and other receivables 21
interest-bearing 1) 0.5 0.7non interest-bearing 357.9 286.7
cash and cash equivalents 1) 22 280.3 258.5Total current assets 748.9 645.0
TOTAL ASSETS 1,068.0 909.6
1) included in net interest-bearing debt.
CONSOLIDATED FINANCIAL STATEMENTS, IFRS

67 Financial Statements 2010Outotec Oyj
COnsOlidated statement Of finanCial POsitiOn
December 31, December 31,eUR million note 2010 2009
EQUITY AND LIABILITIES
Equity attributable to the equity holders of the parent company
share capital 17.2 16.8share premium fund 20.2 20.2treasury shares -9.7 -4.6Reserve for invested non-restricted equity 87.7 63.4Other reserves 0.4 0.3Retained earnings 214.3 176.6Profit for the period 26.7 42.3
356.7 315.0
Non-controlling interest 1.0 27.4Total equity 23 357.7 342.4
Non-current liabilities
interest-bearing debt 1) 26 56.6 41.2Derivative financial instruments 19 2.5 0.0Deferred tax liabilities 12 46.8 49.0employee benefits 24 25.4 24.7Provisions 25 18.3 22.4trade and other payables 27 5.2 2.2Total non-current liabilities 154.7 139.4
Current liabilities
interest-bearing debt 1) 26 25.7 32.0Derivative financial instruments 19 10.0 7.9current tax liabilities 15.4 10.7Provisions 25 23.7 22.3trade and other payables 27 480.7 354.9Total current liabilities 555.5 427.8
Total liabilities 710.2 567.2
TOTAL EQUITY AND LIABILITIES 1,068.0 909.6
1) included in net interest-bearing debt.
CONSOLIDATED FINANCIAL STATEMENTS, IFRS
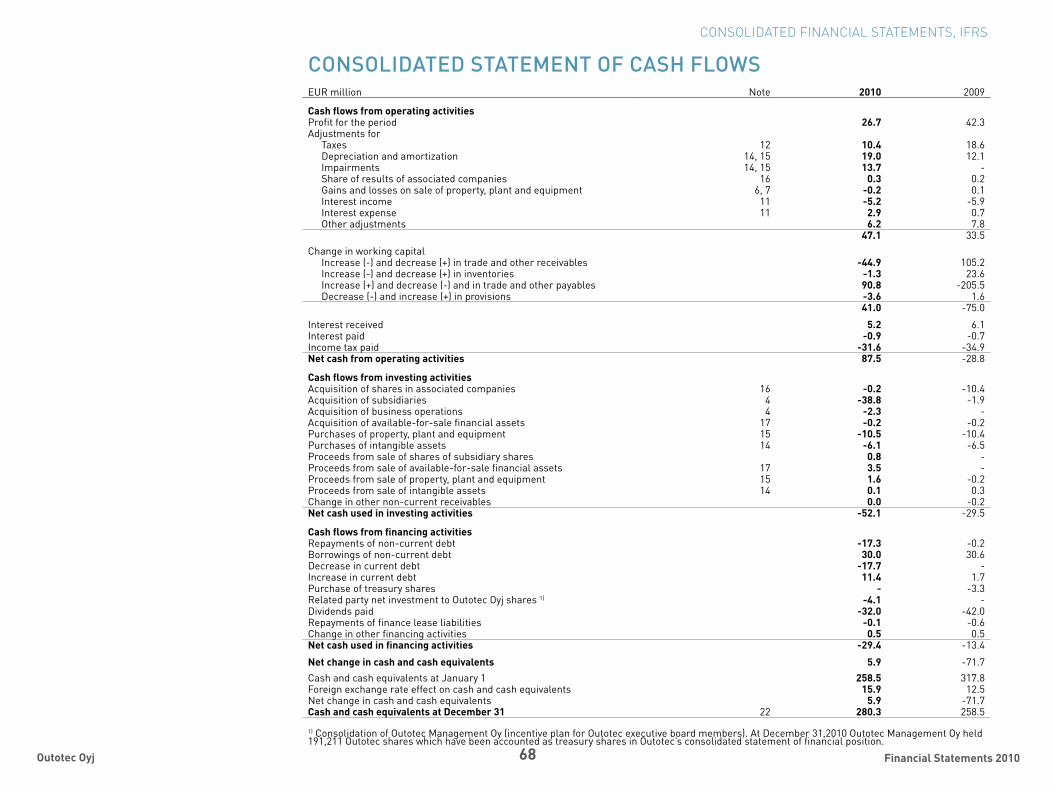
68 Financial Statements 2010Outotec Oyj
COnsOlidated statement Of CasH flOwseUR million note 2010 2009
Cash flows from operating activitiesProfit for the period 26.7 42.3adjustments for
taxes 12 10.4 18.6Depreciation and amortization 14, 15 19.0 12.1impairments 14, 15 13.7 -share of results of associated companies 16 0.3 0.2Gains and losses on sale of property, plant and equipment 6, 7 -0.2 0.1interest income 11 -5.2 -5.9interest expense 11 2.9 0.7Other adjustments 6.2 7.8
47.1 33.5change in working capital
increase (-) and decrease (+) in trade and other receivables -44.9 105.2increase (-) and decrease (+) in inventories -1.3 23.6increase (+) and decrease (-) and in trade and other payables 90.8 -205.5Decrease (-) and increase (+) in provisions -3.6 1.6
41.0 -75.0
interest received 5.2 6.1interest paid -0.9 -0.7income tax paid -31.6 -34.9Net cash from operating activities 87.5 -28.8
Cash flows from investing activitiesacquisition of shares in associated companies 16 -0.2 -10.4acquisition of subsidiaries 4 -38.8 -1.9acquisition of business operations 4 -2.3 -acquisition of available-for-sale financial assets 17 -0.2 -0.2Purchases of property, plant and equipment 15 -10.5 -10.4Purchases of intangible assets 14 -6.1 -6.5Proceeds from sale of shares of subsidiary shares 0.8 -Proceeds from sale of available-for-sale financial assets 17 3.5 -Proceeds from sale of property, plant and equipment 15 1.6 -0.2Proceeds from sale of intangible assets 14 0.1 0.3change in other non-current receivables 0.0 -0.2Net cash used in investing activities -52.1 -29.5
Cash flows from financing activitiesRepayments of non-current debt -17.3 -0.2Borrowings of non-current debt 30.0 30.6Decrease in current debt -17.7 -increase in current debt 11.4 1.7Purchase of treasury shares - -3.3Related party net investment to Outotec Oyj shares 1) -4.1 -Dividends paid -32.0 -42.0Repayments of finance lease liabilities -0.1 -0.6change in other financing activities 0.5 0.5Net cash used in financing activities -29.4 -13.4
Net change in cash and cash equivalents 5.9 -71.7cash and cash equivalents at January 1 258.5 317.8Foreign exchange rate effect on cash and cash equivalents 15.9 12.5net change in cash and cash equivalents 5.9 -71.7Cash and cash equivalents at December 31 22 280.3 258.5
1) consolidation of Outotec management Oy (incentive plan for Outotec executive board members). at December 31,2010 Outotec management Oy held 191,211 Outotec shares which have been accounted as treasury shares in Outotec’s consolidated statement of financial position.
CONSOLIDATED FINANCIAL STATEMENTS, IFRS
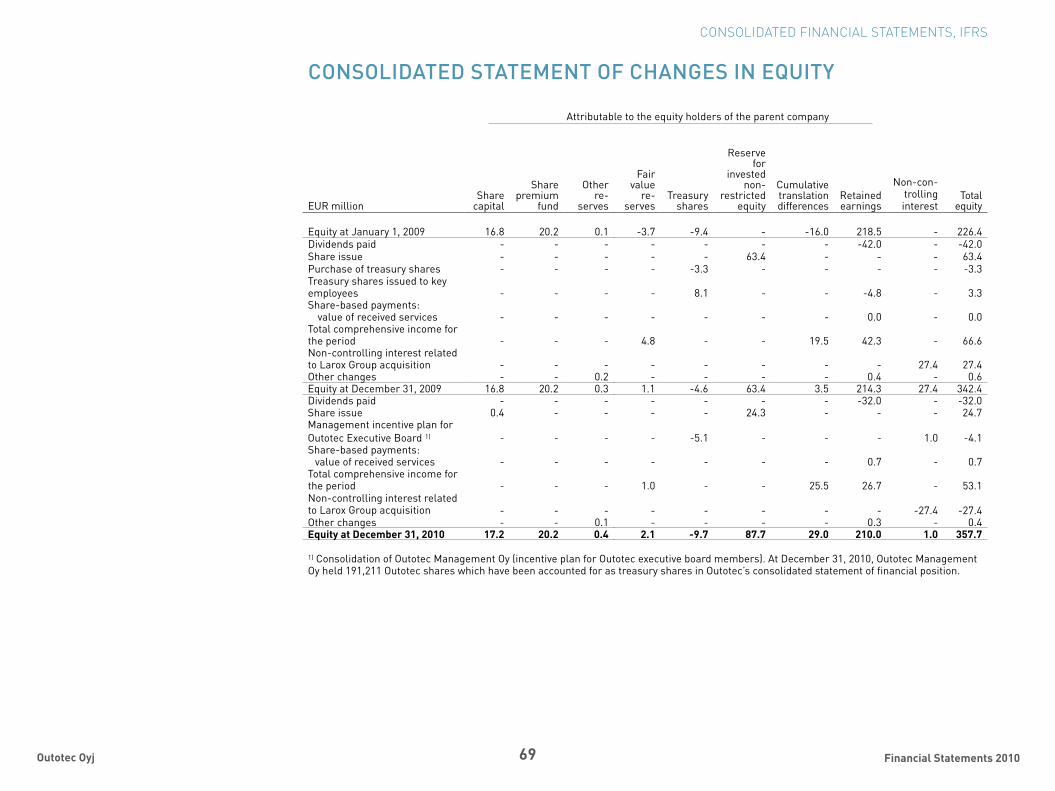
69 Financial Statements 2010Outotec Oyj
CONSOLIDATED FINANCIAL STATEMENTS, IFRS
COnsOlidated statement Of CHanges in equity
attributable to the equity holders of the parent company
eUR millionshare
capital
share premium
fund
Other re-
serves
Fair value
re-serves
treasury shares
Reserve for
invested non-
restricted equity
cumulative translation differences
Retained earnings
non-con-trolling interest
total equity
equity at January 1, 2009 16.8 20.2 0.1 -3.7 -9.4 - -16.0 218.5 - 226.4Dividends paid - - - - - - - -42.0 - -42.0share issue - - - - - 63.4 - - - 63.4Purchase of treasury shares - - - - -3.3 - - - - -3.3treasury shares issued to key employees - - - - 8.1 - - -4.8 - 3.3share-based payments: value of received services - - - - - - - 0.0 - 0.0total comprehensive income for the period - - - 4.8 - - 19.5 42.3 - 66.6non-controlling interest related to larox Group acquisition - - - - - - - - 27.4 27.4Other changes - - 0.2 - - - - 0.4 - 0.6equity at December 31, 2009 16.8 20.2 0.3 1.1 -4.6 63.4 3.5 214.3 27.4 342.4Dividends paid - - - - - - - -32.0 - -32.0share issue 0.4 - - - - 24.3 - - - 24.7management incentive plan for Outotec executive Board 1) - - - - -5.1 - - - 1.0 -4.1share-based payments: value of received services - - - - - - - 0.7 - 0.7total comprehensive income for the period - - - 1.0 - - 25.5 26.7 - 53.1non-controlling interest related to larox Group acquisition - - - - - - - - -27.4 -27.4Other changes - - 0.1 - - - - 0.3 - 0.4Equity at December 31, 2010 17.2 20.2 0.4 2.1 -9.7 87.7 29.0 210.0 1.0 357.7
1) consolidation of Outotec management Oy (incentive plan for Outotec executive board members). at December 31, 2010, Outotec management Oy held 191,211 Outotec shares which have been accounted for as treasury shares in Outotec’s consolidated statement of financial position.
70 Financial Statements 2010Outotec Oyj
1. Corporate informationOutotec Oyj (“the company” or “Parent compa-ny”), is a Finnish public limited liability company organized under the laws of Finland with its registered office in espoo. the parent company, Outotec Oyj, has been listed on the nasDaQ OmX Helsinki since 2006.
Outotec is a leading global provider of pro-cess solutions, technologies, and services for the mining and metallurgical industries. the compa-ny utilizes its extensive experience and advanced process know-how by providing plants, equip-ment, and services based mainly on proprietary technologies. Outotec works in close partnership with its customers and provides environmentally sound and energy saving solutions.
Outotec and its subsidiaries (collectively “the Group“ or “Outotec“) operate through four business areas of which three are reported operating segments: non-ferrous solutions, Ferrous solutions and energy, light metals and environmental solutions. the fourth business area is services and it is reported under the three operating segments.
in 2010, Outotec had 3,130 employees in 24 countries and generated sales of eUR 969.6 million.
a copy of the financial statements of Outotec is available at the Group’s website www.outotec.com.
2. Accounting principles used in the consolidated financial statements
Basis of preparationthe consolidated financial statements of Outotec have been prepared in compliance with interna-tional Financial Reporting standards (iFRs) as adopted by the european Union by applying the ias and iFRs standards as well as sic and iFRic interpretations in force at December 31, 2010. notes to the consolidated financial statements
nOtes tO tHe COnsOlidated finanCial statementshave been prepared also in accordance with Finn-ish accounting standards and Finnish corporate legislation. the consolidated financial statements are presented in millions of euros and have been prepared on the historical cost basis, unless otherwise stated in the accounting principles or disclosures.
Adoption of new and amended standards in 2010-2011Outotec has applied the following revised stan-dards from the beginning of 2010:
iFRs 3 Business combinations. the revised •standard allows entity to measure non-con-trolling interest at fair value or at proportion-ate share of the underlying net assets. in business combinations achieved in stages, previously held equity interest shall be mea-sured at fair value at acquisition date and the result of the fair valuation shall be recognized in profit or loss. costs related to acquisition shall be expensed when incurred. the revised standard has been applied to the acquisition of ausmelt ltd, millteam sweden’s service business and edmeston aB. the ausmelt ltd shares acquired in 2009 have been measured at fair value and the fair value change has been recognized in profit or loss. in addition, costs related to acquisitions have been recog-nized in profit or loss when incurred.ias 27 consolidated and separate Financial •statements. accounting for changes in a parent’s ownership interest in a subsidiary de-pends on whether the change results in a loss or gain of control. changes that do not result in a loss or gain of control are accounted for as equity transactions and when changes result in loss or gain of control transaction is recognized in profit or loss. the revised standard has been applied to the acquisition of ausmelt ltd, millteam sweden’s service business and edmeston aB. the previously
acquired ausmelt ltd shares were valued at fair value when Outotec reached the majority ownership and the result was recognized in profit or loss.iFRs annual improvements.•
in addition Outotec has applied the following revised standards from the beginning of 2010, which do not have an impact on the Group’s financial statements.
iFRs 2 Group cash-settled share-Based Pay-•ment transactions.ias 39 Financial instruments: Recognition •and measurement: eligible Hedged items.
Outotec will estimate the impacts of the fol-lowing standards and interpretations will apply them from the financial period beginning Janu-ary 1, 2011, onwards:
ias 24 Related Party Disclosures.•ias 32 Financial instruments: Presentation: •classification of Rights issues.iFRic 14 – Prepayments of a minimum Fund-•ing Requirement.iFRic 19 extinguishing Financial liabilities •with equity instruments.
Use of estimatesthe preparation of the financial statements in accordance with iFRs requires management to make estimates and assumptions that affect the reported amounts of assets and liabilities, as well as the disclosure of contingent assets and liabilities at the date of the financial state-ments, and the reported amounts of income and expenses during the reporting period. accounting estimates are employed in the financial state-ments to determine reported amounts, including the realizability of certain assets, the useful lives of tangible and intangible assets, revenue recognition of long-term construction contracts, income taxes, project liabilities pension obliga-tions, and impairment of goodwill. the basis for the estimates is described in more detail in these
accounting principles and in connection with the relevant disclosure to the financial state-ment. although these estimates are based on management’s best knowledge of current events and actions, actual results may differ from the estimates used in the financial statements.
Principles of consolidation the consolidated financial statements include the parent company Outotec Oyj and all subsid-iaries where over 50% of a subsidiary’s voting rights are controlled directly or indirectly by the parent company, or the parent company is otherwise in control of the company. also the existence of the potential controlling interest has been taken into consideration when the instru-ments of the potential right of control can be implemented at the time of the assessment. Dis-posed subsidiaries are included in the consoli-dated financial statement until the controlling right is finished and acquired subsidiaries from the date where the Group has gained the control. associated companies, where Outotec holds voting rights of 20–50% and in which Outotec has significant influence, but not control, over the financial and operating policies, are included in the consolidated financial statements using the equity method. When Outotec’s share of losses exceeds the interest in the associated company, the carrying amount is reduced to nil and recog-nition of further losses is discontinued except to the extent that the Group has incurred obliga-tions in respect of the associated companies. the interest in an associated company is the car-rying amount of the investment under the equity method together with any long-term interest that, in substance, forms part of the investor’s net investment in the associated company. the Group’s share of the result of the associated companies has been presented as separate item in the statement of comprehensive income. the Group’s share of changes in associated compa-

71 Financial Statements 2010Outotec Oyj
nies’ other comprehensive income have been booked similarly. associated companies of the Group have not had other comprehensive income items in the reporting period 2009 or 2010.acquired companies are accounted for using the purchase method, according to which the assets, liabilities, and contingent liabilities of the acquired company are measured at fair value at the date of acquisition. Goodwill arising on an acquisition represents the excess of the cost of the acquisition, non-controlling interest and previous ownership at the acquired subsidiary over the fair value of the net identifiable assets, liabilities, and contingent liabilities acquired. the share of the non-controlling interest is recognized at the fair value or value which cor-responds with the relative share of the acquired entity’s net assets. Goodwill is not amortized but tested for impairment at least annually. subsid-iaries acquired during the year are included in the consolidated financial statements from the date of their acquisition and disposed subsidiar-ies are included up to the date of sale.
the purchase price related to subsidiary acquisitions includes possible assets at the fair value, liabilities of the acquirer for the ear-lier owners of the company and issued equity shares. also possible contingent liabilities or assets at the fair value are considered as a part of the payment. costs related to the acquisition are recognized in profit or loss when incurring or when services are rendered.
all intra-group transactions, receivables, liabilities, and unrealized margins, as well as distribution of profits within the Group, are elimi-nated in the consolidation. net profit or loss for the reporting period and comprehensive income items are allocated to the parent company’s shareholders and non-controlling interest par-ties and are presented in the comprehensive income. the share of the non-controlling interest is disclosed separately from the equity belonging to the shareholders of the parent company. the comprehensive income is allocated to the share-holders of the parent company and non-control-
ling parties even if this concludes to a negative share for the non-controlling interest unless non-controlling interest has no conclusive appli-cation to cover the loss exceeding the invest-ment. changes in subsidiary shares that do not conclude the loss of the control are reported as changes in equity. acquisitions before January 1, 2010 are treated with previous standards.
in consolidated financial statements trans-lation differences, that arise from translating hedging instruments of net investments in for-eign operations, debts, and similar investments, are booked to other comprehensive income and cumulative translation difference is presented in equity. translation reserve and post acquisi-tion cumulative translation differences from acquired foreign companies are booked to other comprehensive income and presented as a separate item in equity.
Operating segmentsan operating segment is a group of assets and operations engaged in providing products or services that are subject to risks and returns that are different from those of other operating segments. the operating segments are based on the Group’s internal organization and finan-cial reporting structure.
Reflecting the new operational model announced in 2010, Outotec’s business structure has changed. Financial reporting according to the new structure began on april 1, 2010. the new reportable operating segments according to iFRs 8 are non-ferrous solutions, Ferrous solutions, and energy, light metals and envi-ronmental solutions.
Geographical information is based on the main areas where the Group has activities and sales and is divided as follows: Finland, Germany, rest of europe, north america, south america, australia and Oceania, asia, and africa.
Foreign currency transactionsitems of each subsidiary included in the consolidated financial statements are mea-
sured using the currency that best reflects the economic substance of the underlying events and circumstances relevant to that subsidiary (“the functional currency”). the consolidated financial statements are presented in euros, which is the functional currency of the parent company. Group companies’ foreign currency transactions are translated into functional currencies using the exchange rates prevailing at the dates of the transactions. monetary assets and liabilities denominated in foreign currencies are translated into functional currencies at the exchange rates prevailing at the reporting date. Foreign exchange gains and losses resulting from the settlement or translation of monetary interest-bearing assets and liabilities denominated in foreign curren-cies and related derivatives are recognized in financial income and expenses. Foreign exchange differences arising in respect of other financial instruments are included in operating profit under sales, purchases or other income and expenses. comprehensive income and cash flows of subsidiaries, whose functional and reporting currencies is not euro, are translated into euros at the average exchange rates during the financial period. their statements of financial positions are translated at the exchange rates prevailing at the reporting date. the differences between average exchange rates and reporting date rates are entered into equity and the change entered in other comprehensive income.
Revenue recognitionsales are recognized after the significant risks and rewards that are connected with owner-ship have been transferred to the buyer, and the Group retains neither a continuing managerial involvement to the degree usually associated with ownership, nor effective control of those goods. Revenues from services are recorded when the service has been performed. sales are shown net of indirect sales taxes and discounts.
Revenue from long-term construction contracts is recognized based on the stage of completion when the outcome of the project can
be reliably measured. the outcome of the project can be measured reliably, when total contract revenues and expenses can be measured reliably and when the progress of the project can be mea-sured reliably and it is probable that the economic benefits associated with the project will flow to the Group. When the outcome of the project can-not be measured reliably, revenue shall be recog-nized only to the extent of contract costs incurred that is probable that they will be recoverable.
the stage of completion is measured by using the cost-to-cost method under which the percentage of completion is defined as the ratio of costs incurred to total estimated costs. Revenue recognition according to the stage of completion is based on the estimates of anticipated contract revenues and expenses and on the reliable measurement of the project progress. Revenue recognized and result will be adjusted if the estimates of the project outcome change. the cumulative effect of a change in the estimates will be recorded in the financial period in which the change was first time estimated and known. the expected loss of the project shall be recognized as an expense immediately.
all unfinished projects under the method of the percentage of completion are reviewed and the needed project liabilities are updated. in projects where the stage of completion is close to 100%, liabilities for performance guarantees, warranty period guarantees, possible provisions for project losses, and changes in accruals for project expenses are evaluated and made. Risks related to new commercialized products are also evaluated and quantified, and the necessary accruals are reserved.
license income is recognized on an accrual basis in accordance with the substance of the relevant technology transfer agreement.
Research and development expensesResearch and development expenses are expensed as they are incurred, except for certain development costs, which are capitalized when it is probable that a development project will gener-
NOTES TO THE CONSOLIDATED FINANCIAL STATEMENTS
72 Financial Statements 2010Outotec Oyj
ate future economic benefits, and certain criteria, including commercial and technological feasibility, have been met. capitalized development expenses comprise mainly materials, supplies, direct labor, and related overhead costs. the carrying value of capitalized development expenses in the state-ment of financial position represents the cost less accumulated depreciation and any impairment charges. capitalized development expenses are amortized on a systematic basis over their expect-ed useful live; however, up to 10 years. if the car-rying value of capitalized development expenses exceeds the amount of the cash flows expected to be generated by the asset, the difference shall be recognized as an expense immediately.
Income tax expensesthe Group income tax expense includes taxes of the Group companies based on taxable profit for the period, together with tax adjustments for pre-vious periods and the change in deferred income taxes. the income tax effects of items recognized directly in equity or in other comprehensive income are similiarly recognized. the share of results of associated companies is reported in the statement of comprehensive income as calculated from net profit and thus includes the income tax charge. Deferred income taxes are stated using the liability method, as measured with enacted tax rates, to reflect the net tax effects of all tempo-rary differences between the financial reporting and tax bases of assets and liabilities. the main temporary differences arise from the timing dif-ferences of the percentage of completion method, project provisions, purchase price allocation, other untaxed reserves and provisions, tax loss-carry forwards, depreciation difference on property, plant and equipment, pension provisions, valuation gains and losses on derivative instruments and other deductible or taxable temporary differences. Deductible temporary differences are recognized as a deferred tax asset to the extent that it is prob-able that future taxable profits will be available, against which the deductible temporary difference can be utilized.
Non-recurring itemsnon-recurring or one-time items are unusual items in the statement of comprehensive income that do not occur regularly and thus are not normal business operations in Outotec. they are one-time expenses that the management does not expect to encounter again. non-recurring items are reported under other operating expenses and defined in the notes.
Goodwill and other intangible assetsGoodwill arising on an acquisition represents the excess of the cost of the acquisition over the fair value of the net identifiable assets, liabilities, and contingent liabilities acquired. Goodwill is stated at cost and is not amortized, but tested annually for impairment. in respect of associated compa-nies, the carrying amount of goodwill is included in the carrying amount of the investment.
Other intangible assets include customer relationships, capitalized development expenses, patents, copyrights, licenses, and software. the valuation of intangible assets acquired in a business combination is based on fair value. Development costs or acquisition costs of new software clearly associated with an identifiable product, which will be controlled by the Group and has probable economic benefit exceed-ing its cost beyond one year, are recognized as an intangible asset and depreciated over the software’s expected useful life. associated costs include staff costs of the development team and an appropriate portion of overhead. an intangible asset is recognized only if it is probable that the future economic benefits that are attributable to the asset will flow to the Group, and the cost of the asset can be measured reliably. all other expenditure is expensed as incurred.
Periods of amortization used for intangible assets are:intangible rights 3–20 years software 3–10 years
Property, plant and equipmentProperty, plant and equipment acquired by
group companies are stated at historical cost, less impairment, except the assets of acquired companies that were stated at their fair values at the date of acquisition. Depreciation is calculated based on the useful lives of the assets. the car-rying value of the property, plant and equipment in the statement of financial position represents the cost less accumulated depreciation and any impairment charges.
Depreciation is based on the following expected useful lives:Buildings 10–20 yearsmachinery and equipment 5–20 yearsResearch and development equipment 3–10 yearsland is not depreciated.
the expected useful lives of non-current assets are reviewed at each reporting date and, where they differ significantly from previous estimates, depreciation periods are changed accordingly. Ordinary repairs and maintenance costs are charged to the statement of compre-hensive income during the financial year in which they are incurred. the cost of major renovations is included in the asset’s carrying amount when it is probable that the Group will derive future economic benefits in excess of the originally assessed standard of performance of the existing asset. major renovations are depreciated over the useful lives of the related assets. Gains and losses on sales and disposals are determined by comparing the received proceeds with the carry-ing amount and are included in operating profit.
Government grantsGovernment or other grants are recognized as income on a systematic basis over the periods necessary to match them with the related costs, which they are intended to compensate. invest-ment grants are recognized as revenue on a systematic basis over the useful life of the asset. in the statement of financial position, investment grants are deducted from the value of the asset they relate to.
ImpairmentsProperty, plant and equipment and other non-current assets, including goodwill and intangible assets, are reviewed for potential impairment whenever events or changes in circumstances indicate that the carrying amount of an asset may not be recoverable. Goodwill and intangible assets which are not yet available for use are tested at least annually. For the purposes of assessing impairment, assets are grouped at the lowest cash generating unit level for which there is separately identifiable, mainly independent, cash inflows and outflows. an impairment loss is the amount by which the carrying amount of the assets exceeds the recoverable amount. the recoverable amount is the asset’s value in use. the value in use is determined by reference to discounted future net cash flows expected to be generated by the asset. a previously recog-nized impairment loss is reversed only if there has been a change in the estimates used to determine the recoverable amount. However, the reversal must not result in the adjusted value being higher than the carrying amount that would have been determined if no impairment loss had been recognized in prior years. impairment losses recognized for goodwill are not reversed.
Leasesleases of property, plant and equipment, where the Group has substantially all the rewards and risks of ownership, are classified as finance leases. Finance leases are capitalized at the commencement of the lease term at the lower of the fair value of the leased property or the estimated present value of the underlying lease payments. each lease payment is allocated between the capital liability and finance charges, to achieve a constant interest rate on the finance balance outstanding. the corresponding rental obligations, net of finance charges, are included in interest-bearing liabilities with the interest element of the finance charge being recognized in the statement of comprehensive income over the lease period. Property, plant and equip-
NOTES TO THE CONSOLIDATED FINANCIAL STATEMENTS
73 Financial Statements 2010Outotec Oyj
ment acquired under finance lease contracts are depreciated over the shorter of the useful life of the asset or lease period. leases of assets, where the lessor retains all the risks and benefits of ownership, are classified as operating leases. Payments made under other rental agreements, are expensed on a straight-line basis over the lease periods.
Financial instrumentsFinancial instruments are classified as loans and receivables, held-to-maturity investments, available-for-sale financial assets, financial liabilities at amortized cost, and financial assets and liabilities at fair value through profit and loss. equity investments are classified as available-for-sale financial assets. interest-bearing securities and convertible loan receivables are classified as financial assets at fair value through profit and loss. Highly liquid marketable securities with maturity not exceeding three months are classi-fied as cash equivalents.
according to the iFRs 7 standard, the company is required to classify available-for-sale financial assets into the following fair value hierarchy levels:
level 1 - fair values are measured using quoted •prices (unadjusted) in active markets for identi-cal instrumentslevel 2 - fair values are measured using •directly or indirectly observable inputs, other than those included in level 1 level 3 - fair values are measured using inputs •that are not based on observable market data.
available-for-sale financial assets, as well as financial assets and liabilities at fair value through profit and loss, are measured at fair value and the valuation is based on quoted rates and market prices and appropriate valuation models. Unlisted equity securities for which fair value cannot be reliably measured are recognized at cost less impairment. the unrealized fair value changes of available-for-sale financial assets are recognized in other comprehensive income and presented in fair value reserve of equity net of taxes. in the event such an asset is disposed of,
the accumulated fair value changes are released from equity to financial income and expenses in the statement of comprehensive income. impair-ments of available-for-sale financial assets are recognized in the statement of comprehensive income. Purchases and sales of available-for-sale financial assets are recognized at the trade date.
loans and receivables as well as all financial liabilities, except for derivatives, are recog-nized at the settlement date and measured at amortized cost using the effective interest rate method. transaction costs are included in the initially recognized amount. the need for impair-ment is assessed separately for each loan receiv-able and when realized it is deducted from the carrying value. the impairment shall be based on evidence that it is probable that the Group will not be able to collect the loan receivable according to initial terms. Financial assets and liabilities at fair value through profit and loss are recognized at the trade date and measured at fair value.
all derivatives, including embedded deriva-tives, are initially recognized at fair value on the date Outotec has entered into the derivative contract, and are subsequently re-measured at fair value. Determination of fair values is based on quoted market prices and rates, discounting of cash flows, and option valuation models.
Fair values of currency forwards and swaps are determined by discounting the future nominal cash flows with relevant interest rates and then converting the discounted cash flows to the base currency using spot rates. the fair value of currency options is determined by utilizing com-monly applied option valuation models.
the majority of Outotec’s derivatives are hedging underlying operative transactions although in accordance with the ias 39 standard they are not classified as hedging instruments as they do not meet the ias 39 standard criteria for hedge accounting. the fair value changes of these derivatives are recognized in operat-ing profit under other income and expenses. However, if the derivative is assigned to financial items, the fair value changes are recognized in
NOTES TO THE CONSOLIDATED FINANCIAL STATEMENTS
financial income and expenses.For those projects where cash flow hedge
accounting is applied, the effectiveness of the hedge is tested and documented according to ias 39. the hedge results are recognized in the statement of comprehensive income in the same periods as the project revenue. the hedged cash flows are mainly customer prepayments that are recognized as revenue in the statement of comprehensive income using the percentage of completion method. the respective propor-tion of the hedge results has been recognized in the statement of comprehensive income as an adjustment to sales, and the remaining part in the other comprehensive income and presented in the cash flow hedge reserve in equity. the amounts in the cash flow hedge reserve also include a respective proportion of the realized result of hedges of customer prepayments that have already taken place but not recognized in statement of comprehensive income.
all recognized fair value changes to equity are net of tax.
Commitments and contingent liabilities Outotec Oyj has issued commercial guarantees in connection with long-term construction contracts on its own and on behalf of its sub-sidiaries. Guarantees have been given in order to secure customers’ advance payments or counter secure commercial guarantees given by a bank to a customer or financing needs of local subsidiaries. certain guarantees relate also to other commercial contractual obligations.
Guarantees, pledges, and mortgages have been presented as commitments and contingent liabilities in notes to the consolidated financial statements.
Guarantees issued will be discharged as agreed under the terms of the commercial contract and the contract of guarantee.
Inventoriesinventories are stated at the lower of cost or net realizable value. cost is determined by the weighted average cost method or FiFO method
(first-in, first-out). the cost of finished goods and work in progress comprises raw materials, direct labor, other direct costs, and related produc-tion overheads, but excludes borrowing costs. net realizable value is the estimated selling price in the ordinary course of business, less the estimated costs of completion and the estimated costs necessary to make the sale.
Trade receivablestrade receivables are carried at their anticipated realizable value, which is the original invoice amount less an estimated valuation allowance for impairment of these receivables. a valuation allowance for impairment of trade receivables is made when there is objective evidence that the Group will not be able to collect all amounts due according to the original terms of the receivables.
Cash and cash equivalents cash and cash equivalents comprise cash in hand, deposits held at call with banks, other short-term highly liquid investments with original maturities of three months or less, and bank overdrafts. Bank overdrafts are included within borrowings in current liabilities in the statement of financial position.
Treasury sharesthe purchase of treasury shares with associ-ated transaction costs has been deducted from shareholder’s equity in the consolidated financial statements.
ProvisionsProvisions are recognized in the statement of financial position when Outotec has a present legal or constructive obligation as a result of a past event, and it is probable that an outflow of economic benefits will be required to settle the obligation and a reliable estimate can be made of the amount of the obligation. Provisions can arise from warranty period guarantees or provisions for project losses, restructuring plans, litigation, tax or from environmental plans.
74 Financial Statements 2010Outotec Oyj
Employee benefitsPension obligationsGroup companies in different countries have various pension plans in accordance with local conditions and practices. the plans are classified as either defined contribution plans or defined benefit plans. the contributions to defined contribution plans are charged to the statement of comprehensive income in the year to which they relate. the present value of the obligation of defined benefit plans is determined using the projected unit credit method. in calculating the Group’s obligation with respect to a plan, the extent to which the cumulative unrecognized actuarial gain or loss exceeds the greater of the present value of the defined benefit obligation by more than 10% is identified. that excess portion is recognized in the statement of comprehensive income over the expected average remaining working lives of the employees participating in the plan. Otherwise, the actuarial gain or loss is not recognized.
Share-based payments
Share-based incentive program 2008-2010no shares were allocated for the 2009 earnings period. the board of directors also decided not to select individuals or earning criteria for the 2010 earning period since the incentive Program 2010-2012 replaced the old program.
Share-based incentive program 2010-2012Outotec’s board of directors decided to adopt a new share-based incentive program for the company’s key personnel. the program has three earning periods: calendar years 2010, 2011 and 2012. the board determines the amount of the maximum reward for each individual, the earning criteria and the targets established for them sep-arately on an annual basis. the board approved 71 individuals in the scope of the incentive Program 2010-2012 for the 2010 earning period, which began on January 1, 2010. the reward is based on the achievement of the targets set for
cost savings, order intake and earnings per share. the reward will be paid in 2011 in the company’s shares and as a cash payment which equals income taxes and comparable to tax expenses. the individual must hold the earned shares for at least two years following the end of the earning period. if the individual’s employment ends during this engagement period, (s)he has to return all or part of the earned shares to the company without compensation. since the share reward is paid as a combination of shares and cash, the measure-ment of the fair value of the reward is made according to iFRs 2.
the fair value of share-based payment is measured on the day on which the share-based payment plan is agreed upon between the counterparties. since the person is not entitled to receive dividends during the earning period, the dividends expected to be paid have been deducted from the share price of the grant date when mea-suring the fair value. the component settled in shares will be recognized in shareholders’ equity and the payment settled in cash in liabilities. correspondingly, the fair value of the liability incurred in respect of a cash-settled transaction is remeasured on each reporting date until the reward payment, and the fair value of the liability will thus change in accordance with the Outotec share price.
Dividendsthe dividend proposed by the Board of Direc-tors is not deducted from distributable equity until approved by the annual General meeting of shareholders.
Earnings per shareBasic earnings per share is calculated by dividing the net profit attributable to the equity holders of the parent company by the weighted aver-age number of shares in issue during the year, excluding purchased treasury shares. Diluted earnings per share is calculated as if the war-rants and options were exercised at the beginning of the period. in addition to the weighted average
number of shares outstanding, the denomina-tor includes the incremental shares obtained through the assumed exercise of the warrants and options. the assumption of exercise is not reflected in earnings per share when the exercise price of the warrants and options exceeds the average market price of the shares during the period. the warrants and options have a diluting effect only when the average market price of the share during the period exceeds the exercise price of the warrants and options.
3. Operating SegmentsOutotec’s business operations are divided into operating segments. the operating segments are based on the Group’s internal organization and financial reporting structure. the new opera-tional model of Outotec was published in 2010 which changed Outotec’s organization. Reflecting the new operational model Outotec’s reportable operating segments are: non-ferrous solutions, Ferrous solutions and energy, light metals and environmental solutions. comparable figures of 2009 have been updated for the segments of the new operational model.
Pricing of inter-segment transactions is based on current market prices. segment assets and liabilities are operative items, which are used in a segment’s business operations or which can on a reasonable basis be allocated to the seg-ments. Unallocated items include taxes, financial items, and items which are common for the whole group. investments consist of additions in intangible and tangible assets, which are used on during more than one financial year.
Non-ferrous Solutionsnon-ferrous solutions consists of businesses related to the processing of copper, nickel, zinc, lead, gold, silver and platinum group metals as a full process chain from ore to metal as well as industrial minerals. the offering of the business area comprises technologies based on propri-etary product development, engineering, produc-tion equipment, system integrations, project
deliveries, as well as training, maintenance, and spare parts services. Deliveries may vary from small equipment deliveries to large solutions and services. its advanced technologies are used to process copper, nickel, zinc, lead, gold, silver, platinum metals, and industrial minerals. the international customers of the business area mainly consist of mining companies, non-ferrous metals producers, as well as engineering and project firms. the acquired businesses larox, ausmelt and millteam are included in this busi-ness area.
Ferrous SolutionsFerrous solutions consists of businesses related to the processing of iron ores and other ferrifer-ous materials to produce concentrates, pellets, sinter, direct reduced and hot briquette iron, ferroalloys and titanium feedstock. the offering of the business area includes feasibility studies, engineering, process equipment, automation, project implementation, and services cover-ing the life-cycle of a plant. Due to their energy efficiency and environmental soundness, many of the processes developed by the business area are rated best available technologies according to the eU’s classification. Ferrous solutions’ customers are producers of steel and ferroalloys around the world.
Energy, Light Metals and Environmental Solutionsenergy, light metals and environmental solutions consists of businesses related to energy (incl. oil shale, oil sands and biomass materials) alumina, aluminum and light metals processing. Business areas solutions include sulfuric acid plants, applications for gas cleaning and heat recovery as well as the treatment of industrial and munici-pal wastewater. the acquisition of edmeston is included in this business area.
NOTES TO THE CONSOLIDATED FINANCIAL STATEMENTS

75 Financial Statements 2010Outotec Oyj
3.1 Operating Segments
eUR millionNon-ferrous
SolutionsFerrous
Solutions
Energy,Light Metals
and Envi-ronmental
SolutionsReportable
segments
Unallo-cateditems
Inter-segment elimina-
tionsConsoli-
dated
2010
external sales 618.3 130.6 220.7 969.6 -0.0 - 969.6inter-segment sales 5.0 0.9 2.1 8.0 11.9 -19.9 -sales 623.3 131.5 222.8 977.6 11.9 -19.9 969.6share of results of associated companies - - -0.3 -0.3 - - -0.3Operating profit 26.1 11.3 26.8 64.2 -22.6 - 41.6Financial income and expenses - - - - - - -4.5Profit before income taxes - - - - - - 37.1income tax expenses - - - - - - -10.4Profit for the period - - - - - - 26.7
Depreciation and amortization -16.3 -0.9 -3.3 -20.5 -1.0 - -21.5impairments -10.6 -0.8 -0.4 -11.7 -2.0 - -13.7
non interest-bearing assets 518.4 73.4 131.9 723.7 29.9 -26.8 726.8investments in associated companies - - 0.3 0.3 - - 0.3interest-bearing assets - - - - - - 283.2current tax assets - - - - - - 19.9Deferred tax assets - - - - - - 37.8total assets - - - - - - 1,068.0
non interest-bearing liabilities 335.7 11.3 234.9 581.9 10.6 -26.8 565.7interest-bearing liabilities - - - - - - 82.3current tax liabilities - - - - - - 15.4Deferred tax liabilities - - - - - - 46.8total liabilities - - - - - - 710.2
capital expenditure 72.4 1.5 19.0 92.9 3.9 - 96.7
NOTES TO THE CONSOLIDATED FINANCIAL STATEMENTS

76 Financial Statements 2010Outotec Oyj
eUR millionnon-ferrous
solutionsFerrous
solutions
energy, light metals and
environmental solutions
Reportablesegments
Unallocateditems
inter-segment
eliminationsconsoli-
dated
2009
external sales 473.7 146.6 257.3 877.5 0.1 - 877.7inter-segment sales 8.9 0.1 1.5 10.4 10.8 -21.3 -sales 482.6 146.7 258.7 888.0 11.0 -21.3 877.7share of results of associated companies - - -0.2 -0.2 - - -0.2Operating profit 35.1 9.5 27.6 72.1 -13.5 - 58.6Financial income and expenses - - - - - - 2.2Profit before income taxes - - - - - - 60.9income tax expenses - - - - - - -18.6Profit for the period - - - - - - 42.3
Depreciation and amortization -7.7 -0.4 -3.3 -11.4 -0.7 - -12.1
non interest-bearing assets 361.5 44.3 137.5 543.4 25.7 24.8 593.9investments in associated companies 10.6 - 0.3 10.9 - - 10.9interest-bearing assets - - - - - - 264.2current tax assets - - - - - - 14.8Deferred tax assets - - - - - - 25.8total assets - - - - - - 909.6
non interest-bearing liabilities 199.0 10.9 241.1 451.1 4.1 -20.8 434.3interest-bearing liabilities - - - - - - 73.2current tax liabilities - - - - - - 10.7Deferred tax liabilities - - - - - - 49.0total liabilities - - - - - - 567.2
-
capital expenditure 85.9 2.3 4.5 92.7 5.3 - 98.0
NOTES TO THE CONSOLIDATED FINANCIAL STATEMENTS

77 Financial Statements 2010Outotec Oyj
NOTES TO THE CONSOLIDATED FINANCIAL STATEMENTS
3.2 Information about geographical areas
eUR million Finland GermanyRest of
europe 1)north
americasouth
america
austra-lia and
Oceania asia africa
inter-area
elimina-tions
invest-ments in
associated companies
Consoli-dated
2010
sales by destination 2) 42.8 10.2 138.4 98.8 225.5 117.9 218.3 117.6 - - 969.6sales by origin 3) 336.0 245.5 35.9 97.9 125.3 182.0 30.8 73.6 -157.4 - 969.6non-current assets 3) 131.7 50.3 20.3 12.1 5.7 19.7 1.3 1.7 33.6 0.3 276.5capital expenditure 3) 43.4 2.8 19.7 0.7 0.9 28.5 0.4 0.4 - - 96.7
2009
sales by destination 2) 58.9 2.3 130.9 41.2 237.1 49.7 280.7 76.8 - - 877.7sales by origin 3) 228.2 329.0 37.3 57.3 117.8 115.4 12.6 46.8 -66.8 - 877.7non-current assets 3) 146.2 49.3 1.6 12.4 4.8 4.5 0.8 0.9 1.9 10.9 233.6capital expenditure 3) 83.0 5.4 0.7 0.7 1.1 6.0 0.7 0.3 - - 98.0
1) includes cis countries. 2) sales by destination is presented for external sales.3) sales, non-current assets, and capital expenditure are presented by the location of the company.
3.3 Information about major customersin 2010 and in 2009, there were no such external customers from which recognized sales would
have been over ten percent of Group’s total sales.
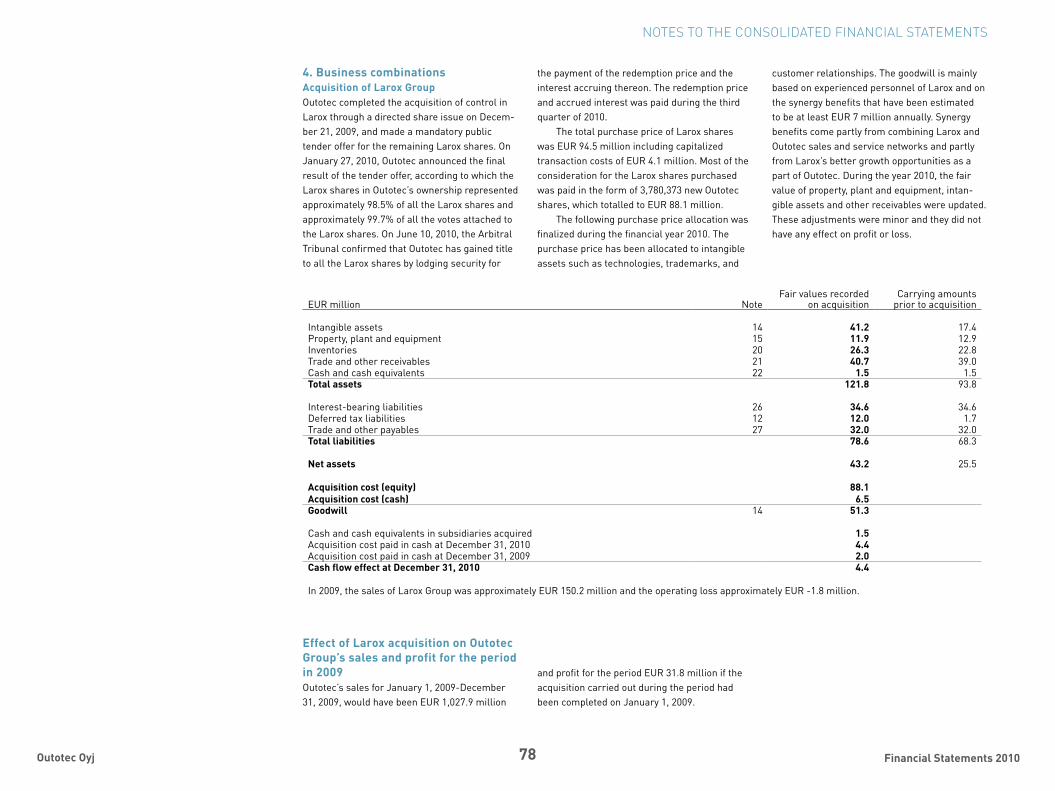
78 Financial Statements 2010Outotec Oyj
NOTES TO THE CONSOLIDATED FINANCIAL STATEMENTS
eUR million noteFair values recorded
on acquisitioncarrying amounts
prior to acquisition
intangible assets 14 41.2 17.4Property, plant and equipment 15 11.9 12.9inventories 20 26.3 22.8trade and other receivables 21 40.7 39.0cash and cash equivalents 22 1.5 1.5Total assets 121.8 93.8
interest-bearing liabilities 26 34.6 34.6Deferred tax liabilities 12 12.0 1.7trade and other payables 27 32.0 32.0Total liabilities 78.6 68.3
Net assets 43.2 25.5
Acquisition cost (equity) 88.1Acquisition cost (cash) 6.5Goodwill 14 51.3
cash and cash equivalents in subsidiaries acquired 1.5acquisition cost paid in cash at December 31, 2010 4.4acquisition cost paid in cash at December 31, 2009 2.0Cash flow effect at December 31, 2010 4.4
in 2009, the sales of larox Group was approximately eUR 150.2 million and the operating loss approximately eUR -1.8 million.
4. Business combinationsAcquisition of Larox GroupOutotec completed the acquisition of control in larox through a directed share issue on Decem-ber 21, 2009, and made a mandatory public tender offer for the remaining larox shares. On January 27, 2010, Outotec announced the final result of the tender offer, according to which the larox shares in Outotec’s ownership represented approximately 98.5% of all the larox shares and approximately 99.7% of all the votes attached to the larox shares. On June 10, 2010, the arbitral tribunal confirmed that Outotec has gained title to all the larox shares by lodging security for
the payment of the redemption price and the interest accruing thereon. the redemption price and accrued interest was paid during the third quarter of 2010.
the total purchase price of larox shares was eUR 94.5 million including capitalized transaction costs of eUR 4.1 million. most of the consideration for the larox shares purchased was paid in the form of 3,780,373 new Outotec shares, which totalled to eUR 88.1 million.
the following purchase price allocation was finalized during the financial year 2010. the purchase price has been allocated to intangible assets such as technologies, trademarks, and
customer relationships. the goodwill is mainly based on experienced personnel of larox and on the synergy benefits that have been estimated to be at least eUR 7 million annually. synergy benefits come partly from combining larox and Outotec sales and service networks and partly from larox’s better growth opportunities as a part of Outotec. During the year 2010, the fair value of property, plant and equipment, intan-gible assets and other receivables were updated. these adjustments were minor and they did not have any effect on profit or loss.
Effect of Larox acquisition on Outotec Group’s sales and profit for the period in 2009Outotec’s sales for January 1, 2009-December 31, 2009, would have been eUR 1,027.9 million
and profit for the period eUR 31.8 million if the acquisition carried out during the period had been completed on January 1, 2009.
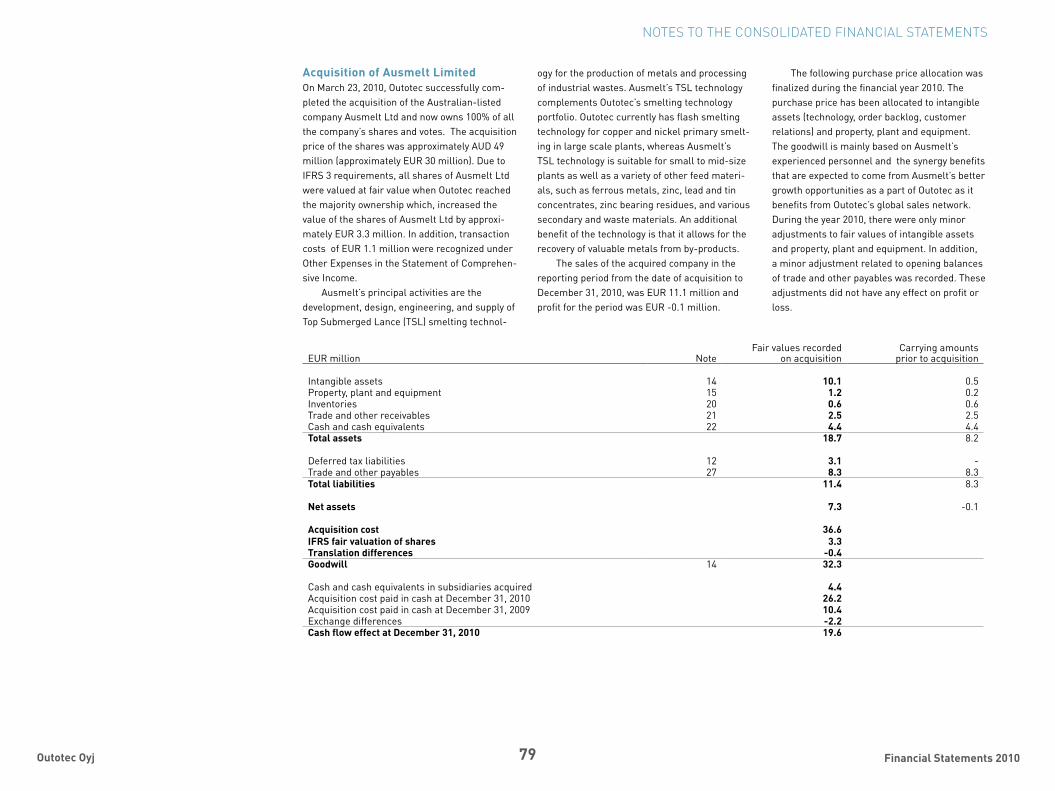
79 Financial Statements 2010Outotec Oyj
NOTES TO THE CONSOLIDATED FINANCIAL STATEMENTS
eUR million noteFair values recorded
on acquisitioncarrying amounts
prior to acquisition
intangible assets 14 10.1 0.5Property, plant and equipment 15 1.2 0.2inventories 20 0.6 0.6trade and other receivables 21 2.5 2.5cash and cash equivalents 22 4.4 4.4Total assets 18.7 8.2
Deferred tax liabilities 12 3.1 -trade and other payables 27 8.3 8.3Total liabilities 11.4 8.3
Net assets 7.3 -0.1
Acquisition cost 36.6IFRS fair valuation of shares 3.3Translation differences -0.4Goodwill 14 32.3
cash and cash equivalents in subsidiaries acquired 4.4acquisition cost paid in cash at December 31, 2010 26.2acquisition cost paid in cash at December 31, 2009 10.4exchange differences -2.2Cash flow effect at December 31, 2010 19.6
Acquisition of Ausmelt LimitedOn march 23, 2010, Outotec successfully com-pleted the acquisition of the australian-listed company ausmelt ltd and now owns 100% of all the company’s shares and votes. the acquisition price of the shares was approximately aUD 49 million (approximately eUR 30 million). Due to iFRs 3 requirements, all shares of ausmelt ltd were valued at fair value when Outotec reached the majority ownership which, increased the value of the shares of ausmelt ltd by approxi-mately eUR 3.3 million. in addition, transaction costs of eUR 1.1 million were recognized under Other expenses in the statement of comprehen-sive income.
ausmelt’s principal activities are the development, design, engineering, and supply of top submerged lance (tsl) smelting technol-
ogy for the production of metals and processing of industrial wastes. ausmelt’s tsl technology complements Outotec’s smelting technology portfolio. Outotec currently has flash smelting technology for copper and nickel primary smelt-ing in large scale plants, whereas ausmelt’s tsl technology is suitable for small to mid-size plants as well as a variety of other feed materi-als, such as ferrous metals, zinc, lead and tin concentrates, zinc bearing residues, and various secondary and waste materials. an additional benefit of the technology is that it allows for the recovery of valuable metals from by-products.
the sales of the acquired company in the reporting period from the date of acquisition to December 31, 2010, was eUR 11.1 million and profit for the period was eUR -0.1 million.
the following purchase price allocation was finalized during the financial year 2010. the purchase price has been allocated to intangible assets (technology, order backlog, customer relations) and property, plant and equipment. the goodwill is mainly based on ausmelt’s experienced personnel and the synergy benefits that are expected to come from ausmelt’s better growth opportunities as a part of Outotec as it benefits from Outotec’s global sales network. During the year 2010, there were only minor adjustments to fair values of intangible assets and property, plant and equipment. in addition, a minor adjustment related to opening balances of trade and other payables was recorded. these adjustments did not have any effect on profit or loss.
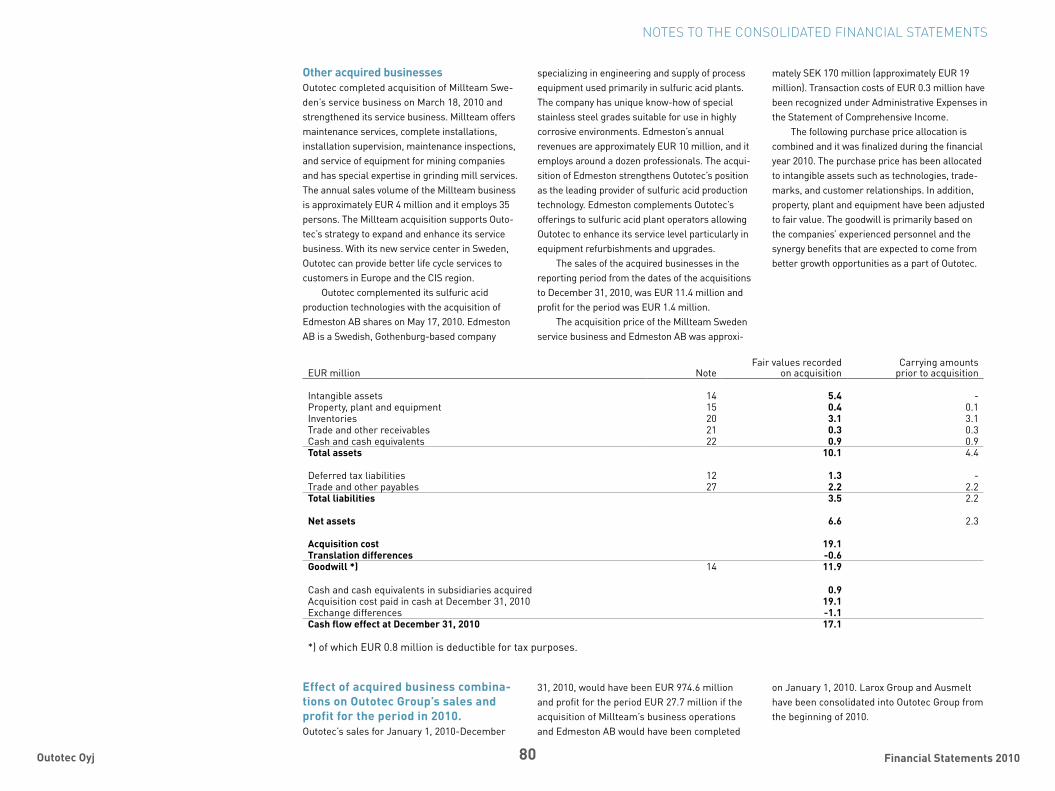
80 Financial Statements 2010Outotec Oyj
NOTES TO THE CONSOLIDATED FINANCIAL STATEMENTS
Other acquired businessesOutotec completed acquisition of millteam swe-den’s service business on march 18, 2010 and strengthened its service business. millteam offers maintenance services, complete installations, installation supervision, maintenance inspections, and service of equipment for mining companies and has special expertise in grinding mill services. the annual sales volume of the millteam business is approximately eUR 4 million and it employs 35 persons. the millteam acquisition supports Outo-tec’s strategy to expand and enhance its service business. With its new service center in sweden, Outotec can provide better life cycle services to customers in europe and the cis region.
Outotec complemented its sulfuric acid production technologies with the acquisition of edmeston aB shares on may 17, 2010. edmeston aB is a swedish, Gothenburg-based company
specializing in engineering and supply of process equipment used primarily in sulfuric acid plants. the company has unique know-how of special stainless steel grades suitable for use in highly corrosive environments. edmeston’s annual revenues are approximately eUR 10 million, and it employs around a dozen professionals. the acqui-sition of edmeston strengthens Outotec’s position as the leading provider of sulfuric acid production technology. edmeston complements Outotec’s offerings to sulfuric acid plant operators allowing Outotec to enhance its service level particularly in equipment refurbishments and upgrades.
the sales of the acquired businesses in the reporting period from the dates of the acquisitions to December 31, 2010, was eUR 11.4 million and profit for the period was eUR 1.4 million.
the acquisition price of the millteam sweden service business and edmeston aB was approxi-
mately seK 170 million (approximately eUR 19 million). transaction costs of eUR 0.3 million have been recognized under administrative expenses in the statement of comprehensive income.
the following purchase price allocation is combined and it was finalized during the financial year 2010. the purchase price has been allocated to intangible assets such as technologies, trade-marks, and customer relationships. in addition, property, plant and equipment have been adjusted to fair value. the goodwill is primarily based on the companies’ experienced personnel and the synergy benefits that are expected to come from better growth opportunities as a part of Outotec.
eUR million noteFair values recorded
on acquisitioncarrying amounts
prior to acquisition
intangible assets 14 5.4 -Property, plant and equipment 15 0.4 0.1inventories 20 3.1 3.1trade and other receivables 21 0.3 0.3cash and cash equivalents 22 0.9 0.9Total assets 10.1 4.4
Deferred tax liabilities 12 1.3 -trade and other payables 27 2.2 2.2Total liabilities 3.5 2.2
Net assets 6.6 2.3
Acquisition cost 19.1Translation differences -0.6Goodwill *) 14 11.9
cash and cash equivalents in subsidiaries acquired 0.9acquisition cost paid in cash at December 31, 2010 19.1exchange differences -1.1Cash flow effect at December 31, 2010 17.1
*) of which eUR 0.8 million is deductible for tax purposes.
Effect of acquired business combina-tions on Outotec Group’s sales and profit for the period in 2010. Outotec’s sales for January 1, 2010-December
31, 2010, would have been eUR 974.6 million and profit for the period eUR 27.7 million if the acquisition of millteam’s business operations and edmeston aB would have been completed
on January 1, 2010. larox Group and ausmelt have been consolidated into Outotec Group from the beginning of 2010.
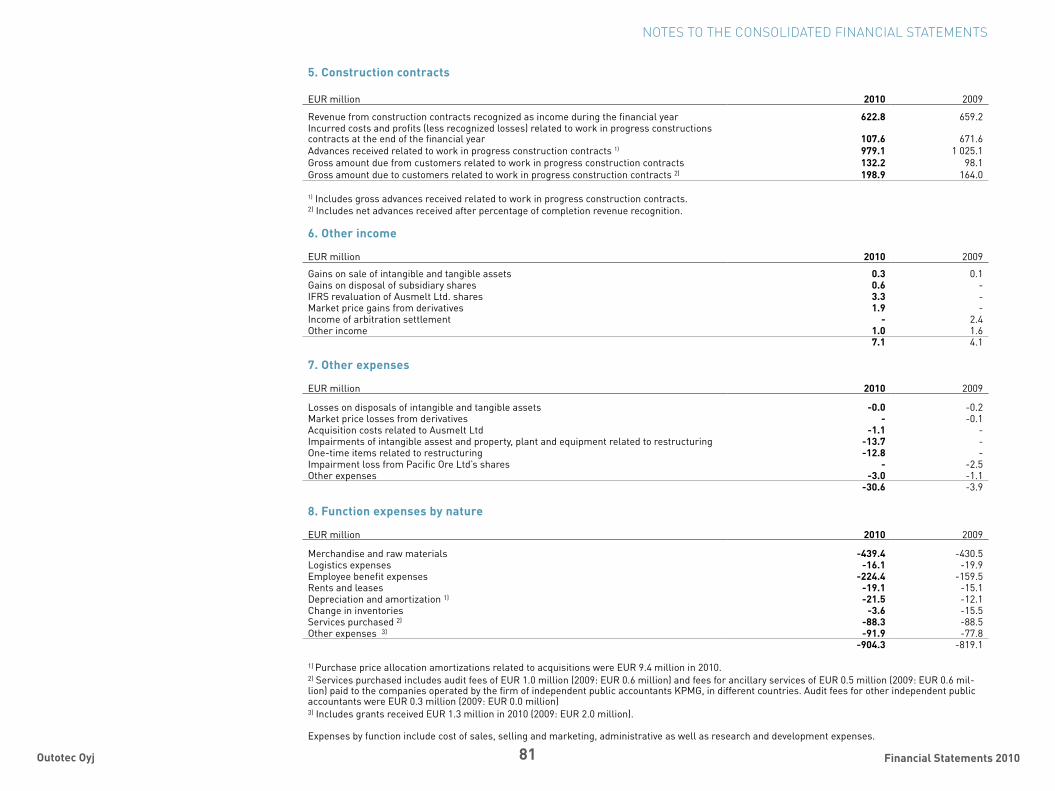
81 Financial Statements 2010Outotec Oyj
NOTES TO THE CONSOLIDATED FINANCIAL STATEMENTS
5. Construction contracts
eUR million 2010 2009
Revenue from construction contracts recognized as income during the financial year 622.8 659.2incurred costs and profits (less recognized losses) related to work in progress constructions contracts at the end of the financial year 107.6 671.6advances received related to work in progress construction contracts 1) 979.1 1 025.1Gross amount due from customers related to work in progress construction contracts 132.2 98.1Gross amount due to customers related to work in progress construction contracts 2) 198.9 164.0
1) includes gross advances received related to work in progress construction contracts.2) includes net advances received after percentage of completion revenue recognition.
6. Other income
eUR million 2010 2009
Gains on sale of intangible and tangible assets 0.3 0.1Gains on disposal of subsidiary shares 0.6 -iFRs revaluation of ausmelt ltd. shares 3.3 -market price gains from derivatives 1.9 -income of arbitration settlement - 2.4Other income 1.0 1.6
7.1 4.1
7. Other expenses
eUR million 2010 2009
losses on disposals of intangible and tangible assets -0.0 -0.2market price losses from derivatives - -0.1acquisition costs related to ausmelt ltd -1.1 -impairments of intangible assest and property, plant and equipment related to restructuring -13.7 -One-time items related to restructuring -12.8 -impairment loss from Pacific Ore ltd’s shares - -2.5Other expenses -3.0 -1.1
-30.6 -3.9
8. Function expenses by nature
eUR million 2010 2009
merchandise and raw materials -439.4 -430.5logistics expenses -16.1 -19.9employee benefit expenses -224.4 -159.5Rents and leases -19.1 -15.1Depreciation and amortization 1) -21.5 -12.1change in inventories -3.6 -15.5services purchased 2) -88.3 -88.5Other expenses 3) -91.9 -77.8
-904.3 -819.1
1) Purchase price allocation amortizations related to acquisitions were eUR 9.4 million in 2010.2) services purchased includes audit fees of eUR 1.0 million (2009: eUR 0.6 million) and fees for ancillary services of eUR 0.5 million (2009: eUR 0.6 mil-lion) paid to the companies operated by the firm of independent public accountants KPmG, in different countries. audit fees for other independent public accountants were eUR 0.3 million (2009: eUR 0.0 million)3) includes grants received eUR 1.3 million in 2010 (2009: eUR 2.0 million).
expenses by function include cost of sales, selling and marketing, administrative as well as research and development expenses.

82 Financial Statements 2010Outotec Oyj
9. Employee benefit expenses
eUR million 2010 2009
Wages and salaries -181.2 -132.9termination benefits -5.8 -0.4social security costs -17.3 -11.5Pension and other post-employment benefits
Defined benefit plans -2.2 -1.8Defined contribution plans -11.7 -12.2Other post-employment benefits -0.2 -0.2
Other personnel expenses -6.0 -0.6-224.4 -159.5
NOTES TO THE CONSOLIDATED FINANCIAL STATEMENTS
Share-based incentive programs
Share-based Incentive Program 2008-2010no shares were allocated for the 2009 earnings period. the board of directors also decided not to select individuals or earning criteria for the 2010 earning period since the incentive Program 2010-2012 replaced the old program.
Share-based Incentive Program 2010-2012Outotec’s board of directors decided to adopt a new share-based incentive program for the com-pany’s key personnel. the program comprises three earning periods: calendar years 2010, 2011 and 2012. the board determines the amount of the maximum reward for each individual, the earning criteria and the targets established for
them separately on an annual basis. the board approved 71 individuals within
the scope of the incentive Program 2010-2012 for the 2010 earning period, which began on January 1, 2010. the reward is based on the achievement of the targets set for cost savings, order intake and earnings per share. the reward will be paid in 2011 in the company’s shares and as a cash payment which equals income taxes. the person must hold the earned shares for at least two years following the end of the earning period. if the person’s employment ends during this engagement period, (s)he has to return all or part of the earned shares to the company without compensation.
the maximum total reward for the 2010 earning period of the incentive Program 2010-
2012 is equal to the value of 361,750 Outotec shares, and the maximum value of the rewards of the entire incentive Program 2010-2012 is equal to approximately 1,000,000 shares, includ-ing the cash payment.
For more information about share-based incentive program, please see note 10. share-based payments.
For more information about key manage-ment employee benefits, please see note 31. Related party transactions.
Other income and expenses comprise the following non-recurring items, which have affected financial performance for the period:
Non-recurring items
eUR million 2010 2009
One-time costs related to restructuring -26.5 -net effect on acquisition costs and revaluation of ausmelt ltd. shares 2.2 -Gains on disposal of subsidiary shares 0.6 -impairment loss from Pacific Ore ltd's shares - -2.5arbitration settlement - 2.4

83 Financial Statements 2010Outotec Oyj
NOTES TO THE CONSOLIDATED FINANCIAL STATEMENTS
Share ownership plan 2010-2012 share ownership plan 2008-2010
Basic information concerning the share ownership plan Earning period 2010 earning period 2009 earning period 2008
Grant datesapril 23, 2010 march 30, 2009, and June 30,
2009march 3, 2008
Form of the reward shares and cash shares and cash shares and cashtarget group Key employees Key employees Key employeesmaximum number of shares 1) 500,000 249,000 82,500Beginning of earning period January 1, 2010 January 1, 2009 January 1, 2008end of earning period December 31, 2010 December 31, 2009 December 31, 2008Vesting conditions ePs, cost savings,
order intake deducted with cancellations
employment until the end of the restriction period
Operating profit, profit for the period, order intake deducted
with cancellations employment until the end
of the restriction period
ePs, order backlog and turnover of services business
employment until the end of the restriction period
end of restriction period January 1, 2013 January 1, 2012 January 1, 2011maximum contractual life, years 2.7 2.8 2.8Remaining contractual life, years 2.0 expired expirednumber of persons at December 31, 2010
68 - -
1) the maximum amount of the share reward includes a component to be paid in cash. the amount of cash to be paid corresponds to a maximum 1.5 times the value of shares at the time of transfer.
the changes in the amounts of share ownership plan in the 2010 financial year are presented in the table below. since the cash component of the share reward is also recognised as a share-based expense, the amounts below are presented in gross terms, i.e. the share reward figures include both the reward paid in shares and a number of shares corresponding to the amount of the reward paid in cash.
10. Share-based paymentsin april 2010 the Board of Directors of Outo-tec Oyj agreed to establish the share Owner-ship Plan 2010-2012. the plan was estab-lished as a part of the incentive and commit-ment program for the key personnel of the company and its subsidiaries. the plan offers the target group the opportunity to earn the company shares as a reward for achieving targets established for the earning period. the plan includes three earning periods, each with a duration of one calendar year.
Under the plan a reward of up to 500,000 shares may be given and also a cash payment of up to the amount needed for payment of the taxes and tax-related costs incurred by the key
persons as a result of the reward at the time the shares are transferred.
the plan includes three earning periods, which are the calendar years 2010, 2011, and 2012. the Board of Directors shall determine the amount of the maximum reward, the earning criteria and the targets established for them separately on an annual basis. the attaining of the targets established for the earning criteria will determine how large a portion of the maxi-mum will be paid to the key persons.
the reward paid on the basis of the share ownership plan will be paid during the spring of the year following the close of the earning period as a combination of shares and a cash.
the reward will not be paid if the person’s
employment ends before the close of the earning period. the person must also hold the earned shares and remain employed for at least two years after the close of the earning period.
share-based incentive program 2010-2012 replaces the old program. Under the share-based incentive program 2008-2010 Outotec shares were allocated to key employees only from the earnings period 2008. the restriction period of the earning period 2008 ended on December 31, 2010. From the earning period 2009 no shares were paid, the reward was paid in cash based on average rate of Outotec share in February 2010.

84 Financial Statements 2010Outotec Oyj
Measurement of the fair value of the share reward Granted 2010 Granted 2009 Granted 2008
share price at the grant date, eUR 28.10 24.17 37.28 expected dividends, eUR 0.70 0.59 1.76 Fair value per share accounted for as equity-settled reward, eUR 27.40 24.03 35.52 Fair value per share of the cash-settled reward at the settlement date / at the end of the period, eUR 45.77 27.20 15.09 Fair value at December 31, 2010, EUR million 5.4 0.4 0.7
Effect on earnings during the period and financial position at December 31, 2010, eUR million Granted 2010 Granted 2009 Granted 2008 Total
expenses recognized for the period from share-based payments 1.4 0.2 0.3 1.8 expenses accounted for as equity-settled share-based payment 0.5 0.0 0.2 0.7 Value of liability for cash-settled share-based payments at December 31, 2010 0.9 0.3 - 1.2
Effect on earnings during the period and financial position at December 31, 2009, eUR million Granted 2009 Granted 2008 total
expenses recognized for the period from share-based payments 0.2 0.3 0.5expenses accounted for as equity-settled share-based payment 0.1 0.2 0.3Value of liability for cash-settled share-based payments at December 31, 2009 0.1 - 0.1
NOTES TO THE CONSOLIDATED FINANCIAL STATEMENTS
Changes in 2010 financial year earning period 2010 earning period 2009 earning period 2008 Total
Gross amounts at January 1, 2010 2), number of shares Outstanding at the beginning of the period - 249,000 14,687 263,687
Changes during the period, number of sharesshare rewards granted 410,450 - 410,450share rewards returned - 247,115 - 247,115share rewards paid - 1,885 - 1,885share rewards forfeited (includes returned shares) - 1,885 14,687 16,572
Gross amounts at December 31, 2010 2), number of sharesOutstanding at the end of the period 3) 410,450 - - 410,450exercisable at the end of the period 410,450 - - 410,450
2) number of shares include cash-settled payments of the plan (in terms of number of shares). 3) Weighted remaining contractual life in years was 2.0.
Fair value of the share rewardinputs to the fair value determination of the rewards expensed during the financial year 2010 are listed in the table below as weighted average
values. the total fair value of the rewards is based on the company’s estimate at Decem-ber 31, 2010, as to the number of shares to be eventually vested.
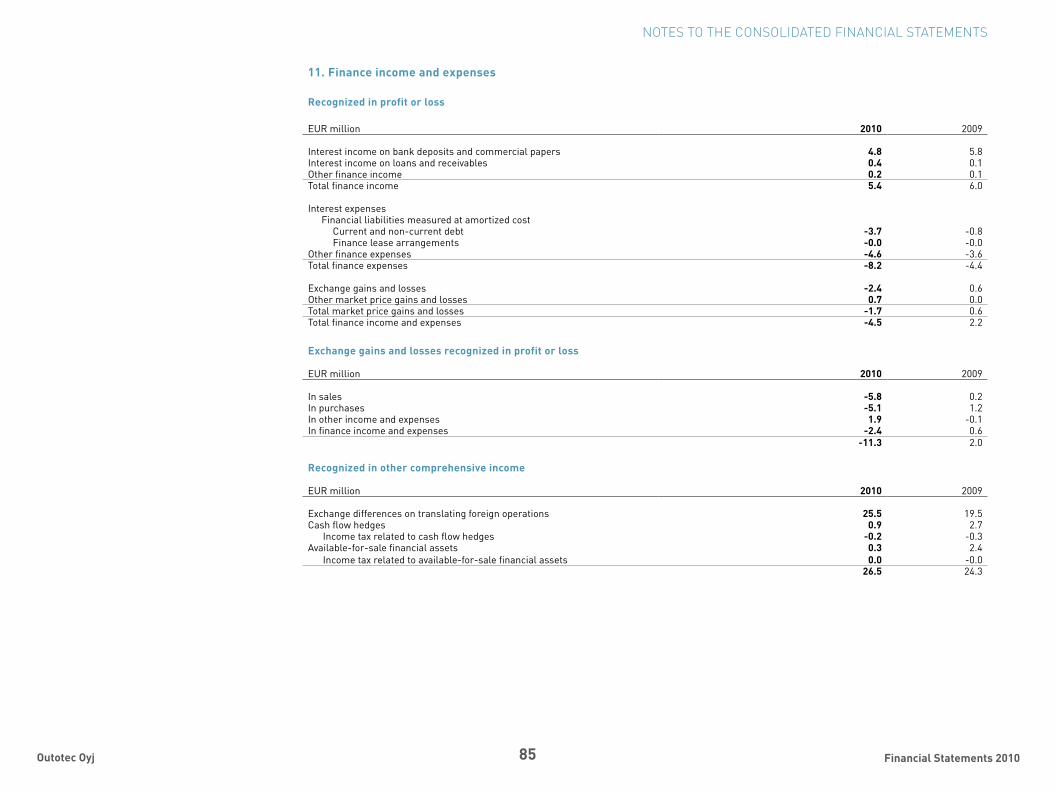
85 Financial Statements 2010Outotec Oyj
NOTES TO THE CONSOLIDATED FINANCIAL STATEMENTS
Exchange gains and losses recognized in profit or loss
eUR million 2010 2009
in sales -5.8 0.2in purchases -5.1 1.2in other income and expenses 1.9 -0.1in finance income and expenses -2.4 0.6
-11.3 2.0
Recognized in other comprehensive income
eUR million 2010 2009
exchange differences on translating foreign operations 25.5 19.5cash flow hedges 0.9 2.7 income tax related to cash flow hedges -0.2 -0.3available-for-sale financial assets 0.3 2.4 income tax related to available-for-sale financial assets 0.0 -0.0
26.5 24.3
11. Finance income and expenses
Recognized in profit or loss
eUR million 2010 2009
interest income on bank deposits and commercial papers 4.8 5.8interest income on loans and receivables 0.4 0.1Other finance income 0.2 0.1total finance income 5.4 6.0
interest expensesFinancial liabilities measured at amortized cost
current and non-current debt -3.7 -0.8Finance lease arrangements -0.0 -0.0
Other finance expenses -4.6 -3.6total finance expenses -8.2 -4.4
exchange gains and losses -2.4 0.6Other market price gains and losses 0.7 0.0total market price gains and losses -1.7 0.6total finance income and expenses -4.5 2.2

86 Financial Statements 2010Outotec Oyj
NOTES TO THE CONSOLIDATED FINANCIAL STATEMENTS
12. Income tax expenses
Income tax expenses recognized in profit or loss
eUR million 2010 2009
Current taxesaccrued taxes for the year
Finnish companies -1.1 -1.5companies outside Finland -29.9 -14.9
tax adjustments for prior yearsFinnish companies 0.4 1.8companies outside Finland -0.3 0.9
-30.9 -13.7Deferred taxesDeferred taxes
Finnish companies 9.9 -1.3companies outside Finland 9.1 -3.7
effect of consolidation and eliminations 1.5 0.220.5 -4.9
Total income tax expenses -10.4 -18.6
Income taxes recognized in other comprehensive income
eUR million 2010 2009
income tax relating to cash flow hedges -0.2 -0.3income tax relating to available-for-sale investment 0.0 -0.0
-0.2 -0.3
The difference between income taxes at the statutory tax rate in Finland (26%) and income taxes recognized in profit or loss is reconciled as follows:
eUR million 2010 2009
Hypothetical income taxes at Finnish tax rate on consolidated profit before tax -9.6 -15.8effect of different tax rates outside Finland -1.6 -0.5non-credited foreign withholding taxes -0.8 -1.2tax effect of non-deductible expenses and tax exempt income -0.8 -0.9tax effect of losses for which no deferred tax asset is recognized -0.5 -1.0Previous year losses for which deferred tax asset is recognized 0.0 -Utilization of tax losses for which no deferred tax asset was recognized 0.2 0.1effect of consolidation and eliminations 0.4 0.0taxes for prior years 0.1 0.0effect of enacted change in future tax rates 1.3 0.0share-based payment plan tax deduction in excess of iFRs cost 0.0 1.3Other items 0.9 -0.5income taxes recognized in profit or loss -10.4 -18.6Deferred taxes in consolidated statement of financial position
eUR million 2010 2009
non-current deferred tax assets 37.8 25.8non-current deferred tax liabilities 46.8 49.0
-9.0 -23.2
Deferred taxes have been reported as a net balance of those companies that file a consolidated tax return or that may otherwise be consolidated for cur-rent tax purposes.
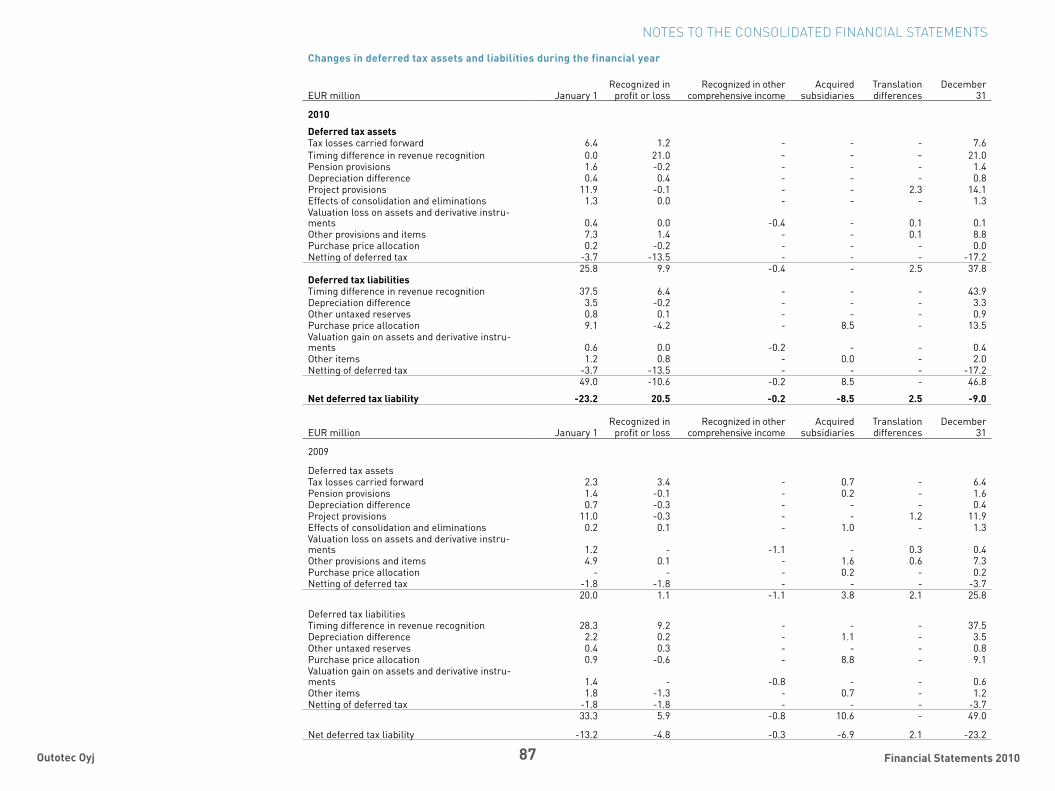
87 Financial Statements 2010Outotec Oyj
NOTES TO THE CONSOLIDATED FINANCIAL STATEMENTS
Changes in deferred tax assets and liabilities during the financial year
eUR million January 1Recognized in
profit or lossRecognized in other
comprehensive incomeacquired
subsidiariestranslation differences
December 31
2010
Deferred tax assetstax losses carried forward 6.4 1.2 - - - 7.6timing difference in revenue recognition 0.0 21.0 - - - 21.0Pension provisions 1.6 -0.2 - - - 1.4Depreciation difference 0.4 0.4 - - - 0.8Project provisions 11.9 -0.1 - - 2.3 14.1effects of consolidation and eliminations 1.3 0.0 - - - 1.3Valuation loss on assets and derivative instru-ments 0.4 0.0 -0.4 - 0.1 0.1Other provisions and items 7.3 1.4 - - 0.1 8.8Purchase price allocation 0.2 -0.2 - - - 0.0netting of deferred tax -3.7 -13.5 - - - -17.2
25.8 9.9 -0.4 - 2.5 37.8Deferred tax liabilitiestiming difference in revenue recognition 37.5 6.4 - - - 43.9Depreciation difference 3.5 -0.2 - - - 3.3Other untaxed reserves 0.8 0.1 - - - 0.9Purchase price allocation 9.1 -4.2 - 8.5 - 13.5Valuation gain on assets and derivative instru-ments 0.6 0.0 -0.2 - - 0.4Other items 1.2 0.8 - 0.0 - 2.0netting of deferred tax -3.7 -13.5 - - - -17.2
49.0 -10.6 -0.2 8.5 - 46.8
Net deferred tax liability -23.2 20.5 -0.2 -8.5 2.5 -9.0
eUR million January 1Recognized in
profit or lossRecognized in other
comprehensive incomeacquired
subsidiariestranslation differences
December 31
2009
Deferred tax assetstax losses carried forward 2.3 3.4 - 0.7 - 6.4Pension provisions 1.4 -0.1 - 0.2 - 1.6Depreciation difference 0.7 -0.3 - - - 0.4Project provisions 11.0 -0.3 - - 1.2 11.9effects of consolidation and eliminations 0.2 0.1 - 1.0 - 1.3Valuation loss on assets and derivative instru-ments 1.2 - -1.1 - 0.3 0.4Other provisions and items 4.9 0.1 - 1.6 0.6 7.3Purchase price allocation - - - 0.2 - 0.2netting of deferred tax -1.8 -1.8 - - - -3.7
20.0 1.1 -1.1 3.8 2.1 25.8
Deferred tax liabilitiestiming difference in revenue recognition 28.3 9.2 - - - 37.5Depreciation difference 2.2 0.2 - 1.1 - 3.5Other untaxed reserves 0.4 0.3 - - - 0.8Purchase price allocation 0.9 -0.6 - 8.8 - 9.1Valuation gain on assets and derivative instru-ments 1.4 - -0.8 - - 0.6Other items 1.8 -1.3 - 0.7 - 1.2netting of deferred tax -1.8 -1.8 - - - -3.7
33.3 5.9 -0.8 10.6 - 49.0
net deferred tax liability -13.2 -4.8 -0.3 -6.9 2.1 -23.2

88 Financial Statements 2010Outotec Oyj
NOTES TO THE CONSOLIDATED FINANCIAL STATEMENTS
13. Earnings per share
2010 2009
Profit attributable to the equity holders of the parent company, eUR million 26.7 42.3Weighted average number of shares, in thousands 45,357 41,844earnings per share for profit attributable to the equity holders of the parent company: Basic earnings per share, eUR 0.59 1.01 Diluted earnings per share, eUR 0.59 1.01
Basic and diluted earnings per share are calculated by dividing the profit attributable to equity holders of the parent company by the weighted average number of shares outstanding. since Outotec has not granted any options, there is no dilution.
Deferred tax assets of eUR 5.0 million (2009: eUR 3.6 million) have not been recognized in the consolidated financial statements because the realization of the tax benefit included in these assets is not probable. the majority of these unrecognized deferred tax assets relate to tax losses and tax credits amounting to eUR 15.7 million (2009: eUR 12.7 million), of which eUR 4.8 million will expire within five years, eUR
10.8 million after five years, and eUR 0.1 million never.
the consolidated balance sheet includes net deferred tax assets of eUR 15.6 million (2009: eUR 9.8 million) in subsidiaries, which have generated losses in the current or in a prior year. the recognition of the assets is based on result estimates, which indicate that the realization of these deferred tax assets is probable.
Deferred tax liability on all undistributed earnings of subsidiaries, calculated according to iFRs, has not been recognized on the consoli-dated financial statements because distribution of the earnings is within the control of Outotec and such distribution is not probable within the foreseeable future. the amount of such undis-tributed earnings in subsidiaries was, at the end of the year 2010, eUR 204.6 million (2009: eUR 173.2 million).
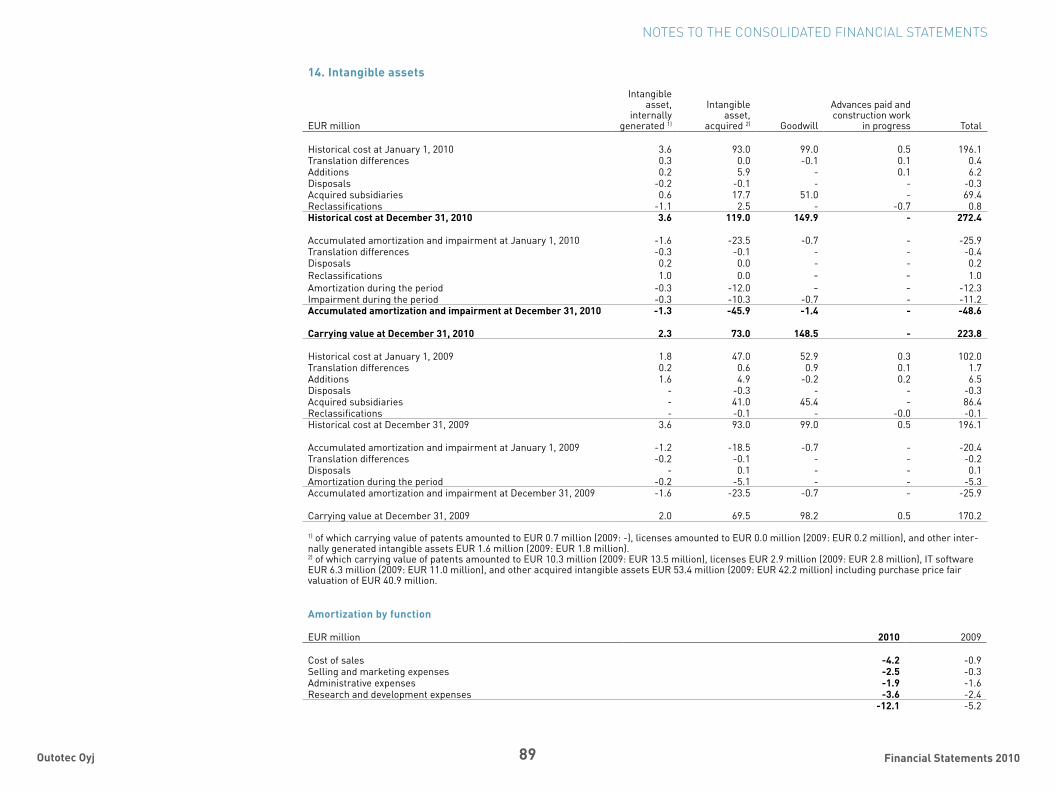
89 Financial Statements 2010Outotec Oyj
NOTES TO THE CONSOLIDATED FINANCIAL STATEMENTS
14. Intangible assets
eUR million
intangible asset,
internally generated 1)
intangible asset,
acquired 2) Goodwill
advances paid and construction work
in progress total
Historical cost at January 1, 2010 3.6 93.0 99.0 0.5 196.1translation differences 0.3 0.0 -0.1 0.1 0.4additions 0.2 5.9 - 0.1 6.2Disposals -0.2 -0.1 - - -0.3acquired subsidiaries 0.6 17.7 51.0 - 69.4Reclassifications -1.1 2.5 - -0.7 0.8Historical cost at December 31, 2010 3.6 119.0 149.9 - 272.4
accumulated amortization and impairment at January 1, 2010 -1.6 -23.5 -0.7 - -25.9translation differences -0.3 -0.1 - - -0.4Disposals 0.2 0.0 - - 0.2Reclassifications 1.0 0.0 - - 1.0amortization during the period -0.3 -12.0 - - -12.3impairment during the period -0.3 -10.3 -0.7 - -11.2Accumulated amortization and impairment at December 31, 2010 -1.3 -45.9 -1.4 - -48.6
Carrying value at December 31, 2010 2.3 73.0 148.5 - 223.8
Historical cost at January 1, 2009 1.8 47.0 52.9 0.3 102.0translation differences 0.2 0.6 0.9 0.1 1.7additions 1.6 4.9 -0.2 0.2 6.5Disposals - -0.3 - - -0.3acquired subsidiaries - 41.0 45.4 - 86.4Reclassifications - -0.1 - -0.0 -0.1Historical cost at December 31, 2009 3.6 93.0 99.0 0.5 196.1
accumulated amortization and impairment at January 1, 2009 -1.2 -18.5 -0.7 - -20.4translation differences -0.2 -0.1 - - -0.2Disposals - 0.1 - - 0.1amortization during the period -0.2 -5.1 - - -5.3accumulated amortization and impairment at December 31, 2009 -1.6 -23.5 -0.7 - -25.9
carrying value at December 31, 2009 2.0 69.5 98.2 0.5 170.2
1) of which carrying value of patents amounted to eUR 0.7 million (2009: -), licenses amounted to eUR 0.0 million (2009: eUR 0.2 million), and other inter-nally generated intangible assets eUR 1.6 million (2009: eUR 1.8 million).2) of which carrying value of patents amounted to eUR 10.3 million (2009: eUR 13.5 million), licenses eUR 2.9 million (2009: eUR 2.8 million), it software eUR 6.3 million (2009: eUR 11.0 million), and other acquired intangible assets eUR 53.4 million (2009: eUR 42.2 million) including purchase price fair valuation of eUR 40.9 million.
Amortization by function
eUR million 2010 2009
cost of sales -4.2 -0.9selling and marketing expenses -2.5 -0.3administrative expenses -1.9 -1.6Research and development expenses -3.6 -2.4
-12.1 -5.2
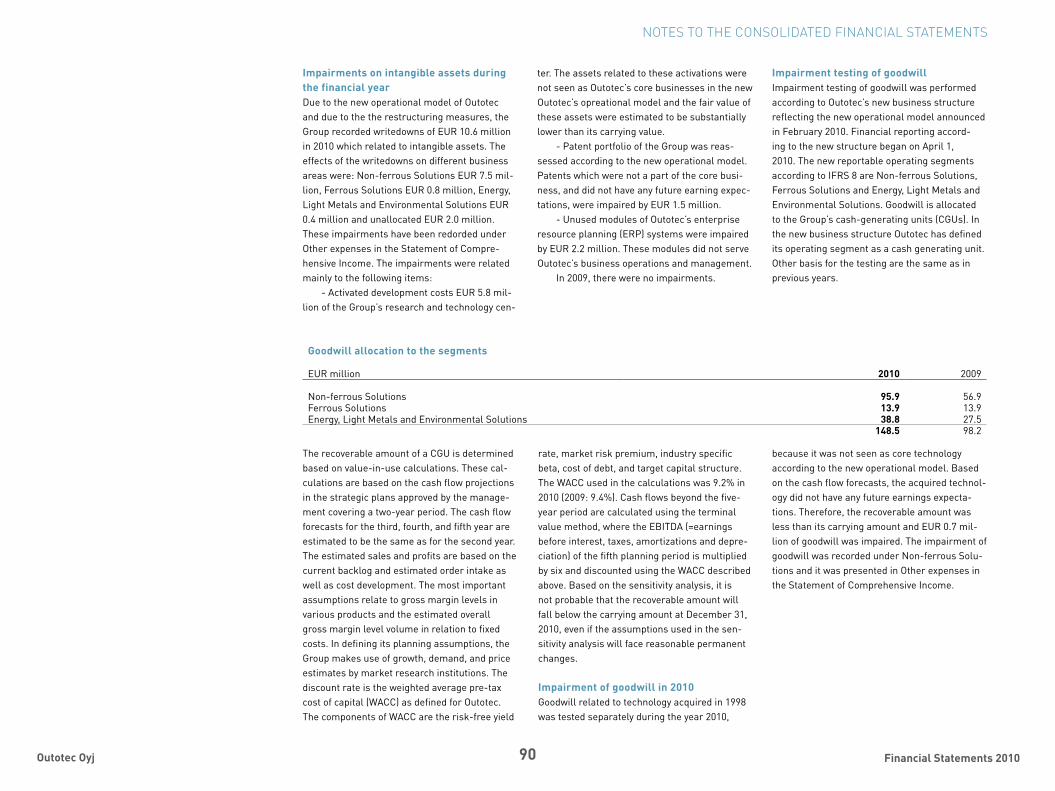
90 Financial Statements 2010Outotec Oyj
NOTES TO THE CONSOLIDATED FINANCIAL STATEMENTS
Goodwill allocation to the segments
eUR million 2010 2009
non-ferrous solutions 95.9 56.9Ferrous solutions 13.9 13.9energy, light metals and environmental solutions 38.8 27.5
148.5 98.2
the recoverable amount of a cGU is determined based on value-in-use calculations. these cal-culations are based on the cash flow projections in the strategic plans approved by the manage-ment covering a two-year period. the cash flow forecasts for the third, fourth, and fifth year are estimated to be the same as for the second year. the estimated sales and profits are based on the current backlog and estimated order intake as well as cost development. the most important assumptions relate to gross margin levels in various products and the estimated overall gross margin level volume in relation to fixed costs. in defining its planning assumptions, the Group makes use of growth, demand, and price estimates by market research institutions. the discount rate is the weighted average pre-tax cost of capital (Wacc) as defined for Outotec. the components of Wacc are the risk-free yield
rate, market risk premium, industry specific beta, cost of debt, and target capital structure. the Wacc used in the calculations was 9.2% in 2010 (2009: 9.4%). cash flows beyond the five-year period are calculated using the terminal value method, where the eBitDa (=earnings before interest, taxes, amortizations and depre-ciation) of the fifth planning period is multiplied by six and discounted using the Wacc described above. Based on the sensitivity analysis, it is not probable that the recoverable amount will fall below the carrying amount at December 31, 2010, even if the assumptions used in the sen-sitivity analysis will face reasonable permanent changes.
Impairment of goodwill in 2010Goodwill related to technology acquired in 1998 was tested separately during the year 2010,
because it was not seen as core technology according to the new operational model. Based on the cash flow forecasts, the acquired technol-ogy did not have any future earnings expecta-tions. therefore, the recoverable amount was less than its carrying amount and eUR 0.7 mil-lion of goodwill was impaired. the impairment of goodwill was recorded under non-ferrous solu-tions and it was presented in Other expenses in the statement of comprehensive income.
Impairments on intangible assets during the financial yearDue to the new operational model of Outotec and due to the the restructuring measures, the Group recorded writedowns of eUR 10.6 million in 2010 which related to intangible assets. the effects of the writedowns on different business areas were: non-ferrous solutions eUR 7.5 mil-lion, Ferrous solutions eUR 0.8 million, energy, light metals and environmental solutions eUR 0.4 million and unallocated eUR 2.0 million. these impairments have been redorded under Other expenses in the statement of compre-hensive income. the impairments were related mainly to the following items:
- activated development costs eUR 5.8 mil-lion of the Group’s research and technology cen-
ter. the assets related to these activations were not seen as Outotec’s core businesses in the new Outotec’s opreational model and the fair value of these assets were estimated to be substantially lower than its carrying value.
- Patent portfolio of the Group was reas-sessed according to the new operational model. Patents which were not a part of the core busi-ness, and did not have any future earning expec-tations, were impaired by eUR 1.5 million.
- Unused modules of Outotec’s enterprise resource planning (eRP) systems were impaired by eUR 2.2 million. these modules did not serve Outotec’s business operations and management.
in 2009, there were no impairments.
Impairment testing of goodwillimpairment testing of goodwill was performed according to Outotec’s new business structure reflecting the new operational model announced in February 2010. Financial reporting accord-ing to the new structure began on april 1, 2010. the new reportable operating segments according to iFRs 8 are non-ferrous solutions, Ferrous solutions and energy, light metals and environmental solutions. Goodwill is allocated to the Group’s cash-generating units (cGUs). in the new business structure Outotec has defined its operating segment as a cash generating unit. Other basis for the testing are the same as in previous years.
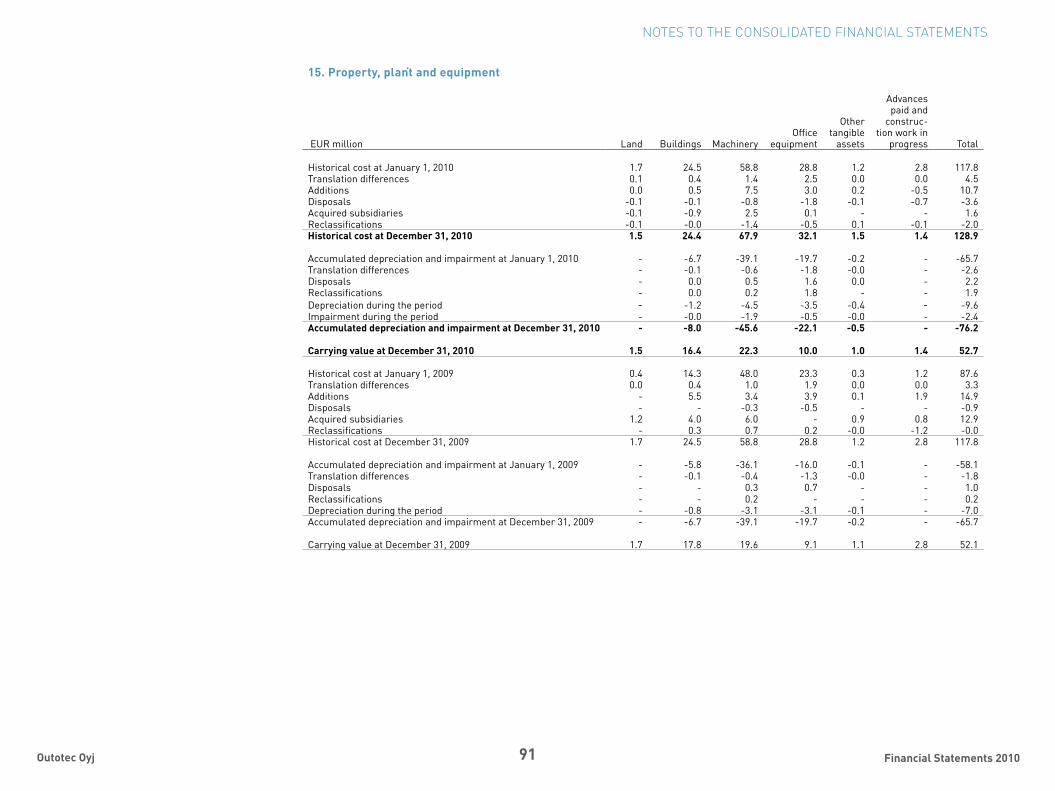
91 Financial Statements 2010Outotec Oyj
NOTES TO THE CONSOLIDATED FINANCIAL STATEMENTS
15. Property, plant and equipment
eUR million land Buildings machineryOffice
equipment
Other tangible
assets
advances paid and
construc-tion work in
progress total
Historical cost at January 1, 2010 1.7 24.5 58.8 28.8 1.2 2.8 117.8translation differences 0.1 0.4 1.4 2.5 0.0 0.0 4.5additions 0.0 0.5 7.5 3.0 0.2 -0.5 10.7Disposals -0.1 -0.1 -0.8 -1.8 -0.1 -0.7 -3.6acquired subsidiaries -0.1 -0.9 2.5 0.1 - - 1.6Reclassifications -0.1 -0.0 -1.4 -0.5 0.1 -0.1 -2.0Historical cost at December 31, 2010 1.5 24.4 67.9 32.1 1.5 1.4 128.9
accumulated depreciation and impairment at January 1, 2010 - -6.7 -39.1 -19.7 -0.2 - -65.7translation differences - -0.1 -0.6 -1.8 -0.0 - -2.6Disposals - 0.0 0.5 1.6 0.0 - 2.2Reclassifications - 0.0 0.2 1.8 - - 1.9Depreciation during the period - -1.2 -4.5 -3.5 -0.4 - -9.6impairment during the period - -0.0 -1.9 -0.5 -0.0 - -2.4Accumulated depreciation and impairment at December 31, 2010 - -8.0 -45.6 -22.1 -0.5 - -76.2
Carrying value at December 31, 2010 1.5 16.4 22.3 10.0 1.0 1.4 52.7
Historical cost at January 1, 2009 0.4 14.3 48.0 23.3 0.3 1.2 87.6translation differences 0.0 0.4 1.0 1.9 0.0 0.0 3.3additions - 5.5 3.4 3.9 0.1 1.9 14.9Disposals - - -0.3 -0.5 - - -0.9acquired subsidiaries 1.2 4.0 6.0 - 0.9 0.8 12.9Reclassifications - 0.3 0.7 0.2 -0.0 -1.2 -0.0Historical cost at December 31, 2009 1.7 24.5 58.8 28.8 1.2 2.8 117.8
accumulated depreciation and impairment at January 1, 2009 - -5.8 -36.1 -16.0 -0.1 - -58.1translation differences - -0.1 -0.4 -1.3 -0.0 - -1.8Disposals - - 0.3 0.7 - - 1.0Reclassifications - - 0.2 - - - 0.2Depreciation during the period - -0.8 -3.1 -3.1 -0.1 - -7.0accumulated depreciation and impairment at December 31, 2009 - -6.7 -39.1 -19.7 -0.2 - -65.7
carrying value at December 31, 2009 1.7 17.8 19.6 9.1 1.1 2.8 52.1

92 Financial Statements 2010Outotec Oyj
NOTES TO THE CONSOLIDATED FINANCIAL STATEMENTS
Assets leased by finance lease agreements
eUR million 2010 2009
Historical cost 0.3 0.8translation differences 0.0 0.1acquired subsidiaries - 0.0Reclassifications -0.1 -0.5accumulated depreciation -0.0 -0.1carrying value at December 31 0.3 0.3
all finance lease agreements are related to machinery and equipment.
16. Investments in associated companies
eUR million 2010 2009
investments in associated companies at costHistorical cost at January 1 11.0 0.1translation differences 1.3 -additions 0.2 11.0Disposal -11.8 -Historical cost at December 31 0.7 11.0
equity adjustment to investments in associated companies at January 1 -0.2 0.0share of results of associated companies -0.3 -0.2Disposal - -equity adjustment to investments in associated companies at December 31 -0.5 -0.2
Carrying value of investments in associated companies at December 31 0.3 10.9
Depreciation by function eUR million 2010 2009
cost of sales -3.4 -2.6selling and marketing expenses -1.3 -0.6administrative expenses -2.1 -1.9Research and development expenses -2.5 -1.8
-9.4 -6.9
Impairments on property, plant and equip-ment during the financial yearDuring 2010, an impairment loss of eUR 1.8 million was recognized related to the Group’s research and technology center’s capitalized as-sets. according to the new Outotec’s operational model published in 2010, these assets were not seen as Outotec’s core businesses. therefore,
the fair value of these assets were estimated to be substantially lower than its carrying value. these assets were included in non-ferrous solutions business area. the impairment loss has been recognized in Other expenses in the statement of comprehensive income.
in addition, Outotec recorded some minor impairments of property, plant and equip-
ment. these impairments were related to more efficient operative business of Outotec’s new operational model. these impairments were mainly recorded under non-ferrous business area and presented under Other expenses in the statement of comprehensive income.
in 2009, there were no impairments.

93 Financial Statements 2010Outotec Oyj
17. Available-for-sale financial assets
eUR million 2010 2009
carrying value at January 1 4.0 0.5translation differences 0.0 0.0additions 0.2 0.2Disposals -3.5 -Fair value changes 0.3 -0.2acquired subsidiaries 0.4 3.6carrying value at December 31 1.4 4.0
listed equity securities 0.5 0.2Unlisted equity securities 0.9 3.8
Fair value 1.4 4.0available-for-sale financial assets transferred to profit and loss - 2.5acquisition value -1.1 -6.5Fair value changes 0.3 0.1Deferred tax liability 0.0 -0.0Fair value reserve in equity 0.3 0.1
NOTES TO THE CONSOLIDATED FINANCIAL STATEMENTS
Summary of financial information for associated companies
eUR million Domicile assets liabilities sales Profit/loss Ownership, %
2010
enefit Outotec technology Oü estonia 0.5 0.6 - -0.0 40.0Greenexergy aB sweden 0.8 0.1 0.2 -0.4 45.0middle east metals Processing company ltd saudi arabia 0.3 0.2 - - 49.0
2009
ausmelt ltd 1) australia - - - - 37.6enefit Outotec technology Oü estonia 0.0 - - -0.0 40.0Greenexergy aB sweden 0.7 0.1 0.1 -0.4 45.0middle east metals Processing company ltd saudi arabia 0.3 0.2 - - 49.0
1) Financial information of ausmelt limited as per December 31, 2009, was not available for Outotec.

94 Financial Statements 2010Outotec Oyj
18. Financial risk management Financial Risk Management and Insurancesaccording to Outotec’s Financial Risk manage-ment policy the ceO and the executive Board monitor the implementation of risk management procedures in coordination with the Board of Directors. the cFO is responsible for imple-mentation and development of financial risk management.
the audit committee oversees how the management monitors compliance with the Group’s risk management policies and procedures, and reviews the adequacy of the risk management framework in relation to the risks faced by the Group. the audit committee is assisted by internal audit, which undertakes both regular and ad hoc reviews of risk manage-ment controls and procedures.
Financial risks consist of market, credit, and liquidity risks. market risks are caused by changes in foreign exchange and interest rates, as well as commodity or other prices. especially changes in foreign exchange rates may have a significant impact on the Group’s earnings, cash flows, and balance sheet. as the main principle, Outotec’s business units hedge their market
risks by entering into agreements with the Group treasury, which does most of the financial contracts with banks and other financial institu-tions. Outotec’s treasury is also responsible for managing certain Group-level risks, such as interest rate risk and foreign currency transac-tion risk in accordance with the Financial Risk management policy. the Group is sensitive to price fluctuations of raw materials, external suppliers and subcontractors. Price fluctuation is prevented and the availability of raw materials ascertained by long-term contracts, the timing of the acquisitions, and fixed contract prices.
Foreign exchange rate riska major part of Outotec’s sales is in euros, Us dollars, australian dollars, and south african rand. a significant part of costs arise in euros, Us dollars, australian dollars, and south african rand.
the overall objective of foreign exchange risk management is to limit the short-term negative impact on earnings and cash flow from exchange rate fluctuations, therefore increasing the predictability of the financial results.
Foreign exchange risk is the principal market risk within Outotec and, as such, has a
significant potential impact on the income state-ment and balance sheet.
the currencies related to sales and costs can vary materially, depending on the projects. Outotec hedges most of its fair value risk. cash flow risk related to firm commitments is hedged almost completely, within subsidiary specific limits defined in Financial Risk management policy, where as forecasted and probable cash flows are hedged only selectively with financial instruments based on separate decisions. a major part of cash flow risk hedging takes place operatively i.e. by matching sales and cost cur-rencies, and the remaining net open positions are normally hedged with derivative contracts (typically forward agreements). subsidiary-level foreign exchange exposures are monitored and consolidated on a monthly basis.
a substantial part of derivative contracts hedge underlying business transactions, although they do not fulfill the criteria for applying hedge accounting according to ias 39. However, Outotec applies hedge accounting for derivative contracts in selected projects. in this description of financial risk management the term hedging has been used in its broadest sense, and therefore it also includes usage of
Transaction risk
UsD exposure in companiesreporting in eUR
UsD exposure in companiesreporting in aUD
aUD exposure in companiesreporting in eUR
eUR exposure in companiesreporting in seKeUR million
2010 2009 2010 2009 2010 2009 2010 2009
Bank accounts 1.0 1.2 3.5 1.5 0.2 0.3 7.2 0.4trade receivables 7.6 7.6 6.2 4.6 7.1 1.6 5.8 6.2trade payables -1.5 -2.9 -0.4 -1.8 -0.5 -0.9 -3.3 -5.5loans and receivables 8.0 11.3 - - 33.7 15.8 - -net balance sheet exposure 15.1 17.2 9.2 4.3 40.4 16.8 9.7 1.1
sales order book 17.3 28.1 68.1 12.8 2.7 1.0 77.9 5.6Purchase order book -1.3 -3.9 -28.0 -7.1 -1.1 -1.4 -50.4 -2.4
16.0 24.2 40.1 5.7 1.6 -0.4 27.4 3.2
Hedges:Foreign exchange forward contracts -30.8 -30.7 -49.3 -10.2 -43.3 5.4 -38.0 -4.5Foreign currency options - -2.3 - - - -1.5 - -total net exposure 0.3 8.4 0.0 -0.2 -1.4 20.3 -0.9 -0.2
NOTES TO THE CONSOLIDATED FINANCIAL STATEMENTS

95 Financial Statements 2010Outotec Oyj
Sensitivity of financial instruments on foreign currency exchange rates
2010 2009
eUR millionEffect on
profit or lossEffect on
equityeffect on
profit or losseffect on
equity
+/-10% change in eUR/UsD exchange rate +1.4/-1.7 +0.0/-0.0 -0.9/+1.0 +1.6/-1.9+/-10% change in eUR/aUD exchange rate +0.3/-0.3 -1.9/+2.3+/-10% change in eUR/seK exchange rate -2.6/+3.1 -0.3/+0.4+/-10% change in aUD/UsD exchange rate +4.1/-4.1 +0.6/-0.6
the following assumptions were made when calculating the sensitivity to changes in exchange rates:the variation in currency is assumed to be +/- 10%. the position includes currency denominated financial assets and liabilities, such as borrowings, deposits, trade and other receivables, liabilities, and cash and cash equivalents, as well as derivative financial instruments. the position excludes order book items.
NOTES TO THE CONSOLIDATED FINANCIAL STATEMENTS
non-hedge-accounted derivatives.Outotec does not typically hedge its equity
translation risk. the total non-euro-denomi-nated equity of Outotec’s foreign subsidiaries and associated companies was on December 31, 2010 eUR 237.7 million (December 31, 2009: eUR 145.1 million).
in certain cases commercial contracts may include so-called embedded derivatives, the volume of these may at times amount to a substantial share of all derivatives.
On December 31, 2010, Outotec had the following foreign exchange derivative contract amounts, including embedded derivatives (more detailed information of foreign exchange expo-sures in note 19):
eUR million 2010 2009
Foreign exchange derivative contracts 444.4 319.3
see the tables “transaction risk” and ”sensitiv-ity of financial instruments on foreign exchange rates”
Interest rate riskthe relevance of interest rate risks for Outotec has before 2010 been limited due to the small amount of debts carrying interest. as a conse-quence the acquisition of the larox shares and
drawdown of tyel pension loans during the last quarter of 2009, the amount of interest-bearing debt increased, exposing the Group to interest rate risk, which is the risk of repricing and price caused by the changes in market interest rates. to control interest rate risks the Group disperses its loans in fixed and floating rate instruments. total loan risk position is stabilized by changing the portion of fixed and foreign currency denomi-nated debts. the share of fixed rate loans of all interest-bearing debt was 40%.
a significant part of the financial invest-ments have a short-term interest rate as a refer-ence rate. On December 31, 2010, Outotec had eUR 280.3 million of cash and cash equivalent funds (December 31, 2009: eUR 258.5 million), the majority of which is invested in short-term money market instruments. the advance pay-ments received from projects in the emerging markets and the related financial investments occasionally cause interest rate risks. the larg-est interest rate exposures are in euros, south african rand, Brazilian reais, and australian dollars.
the Group does not account for any fixed rate financial assets and liabilities at fair value through profit or loss, and the Group does not designate derivatives (interest rate swaps) as hedging instruments under a fair value hedge accounting model. therefore a change in interest
rates at the reporting date would not affect profit or loss for fixed rate instruments. at the end of the financial year the Group had no open interest rate forward agreements or interest rate swaps.
For variable rate interest-bearing financial instruments a shift of one percentage point would have increased (decreased) profit or loss by eUR 1.2 million for December 31, 2010 (December 31, 2009: eUR 1.5 million)
Securities price riskOutotec is the owner of 5 million shares of Pacific Ore limited. the shares are quoted on asX of australia. Outotec does not have any material amounts of other listed equity securities which are classified as available-for-sale.
Credit riskscredit risk arises from the potential failure of a counterparty to meet its contractual payment obligations. in addition, counterparty risk arises in conjunction with financial investments and hedging instruments. the objective of credit and counterparty risk management is to minimize in a cost efficient manner the losses incurred as a result of a counterparty not fulfilling its obligations.
Outotec’s trade receivables and other potential sources of sales contract-related credit risk are generated by a large number of
96 Financial Statements 2010Outotec Oyj
NOTES TO THE CONSOLIDATED FINANCIAL STATEMENTS
customers worldwide, but occasionally risk con-centrations may develop due to large individual contracts. Outotec’s Project Risk management Policy (PRima) has been created to manage the various project-related risks and address them in a more concised manner (see page 53). the PRima policy and related procedures require identification of counterparty risks in a project together with the evaluation of the available and cost efficient mitigation of risks with contractual terms and/or different financial instruments. the credit risks related to business operations can be mitigated, for example, by the use of advance payments and other payment terms under sales contracts, project-specific credit insurances and letters of credit. the trade receivable exposures are reviewed regularly in Outotec’s project level reporting. the reporting of overdue external trade receivables was intensified during 2010. Geographically the trade receivables are mostly from asia 28.0% (December 31, 2009: 20.5%), south america 21.7% (December 31, 2009: 21.6%), africa 13.3% (December 31, 2009: 18.4%), and north america 10.4% (December 31, 2009: 12.8%). more detailed analysis of trade receiv-ables is included in note 21.
Outotec’s treasury manages a substantial part of the credit risk related to the Group’s financial investments. Outotec seeks to reduce these risks by limiting the counterparties to banks, other financial institutions, and other counterparties, which have a good credit stand-ing. investments related to liquidity management are made in liquid money market instruments with, as far as possible, low credit risk and within pre-agreed credit limits and maturities. the limits are reviewed regularly. Part of Outotec’s project advance payments can be invested in local money markets in emerging countries.
the total amount of credit risk is the carrying amount of group financial assets that amounted to eUR 652.4 million on December 31, 2010, (December 31, 2009: eUR 557.0 million). see note 28.
InsurancesOutotec Oyj acquires Group-wide insurances on a case by case basis covering all or part of Group companies’ insurance needs. Furthermore Outotec companies acquire local insurances on a case by case basis in separately defined areas and specific delivery contracts. the most important insurance lines relate to liability. On the other hand, decisions to insure credit risks in projects are usually made on a project by project basis.
General liability is the most important line of insurance and a major part of insurance premiums paid relate to these types of risks. For production units Outotec has adequate property damage and business interruption insurance cover.
Liquidity riskOutotec ensures required liquidity through a combination of cash management, liquid invest-ment portfolios, and committed and uncom-mitted facilities. liquidity and refinancing risks are sought to be reduced with the availability of a sufficient amount of credit lines, which have a balanced maturity profile. efficient cash and liquidity management also reduces liquidity risk.
Outotec’s treasury raises centrally most of the Group’s interest-bearing debt. During 2010 the need for external debt on the Group level has continued to be limited. However, in order to strengthen its financial reserves, Outotec raised a new eUR 30 million seven-year loan from the nordic investment Bank and refinanced its existing eUR 50 million revolving credit facility through syndication arrangement. the former loan was fully drawn in December 2010 and the latter remains as a backup financial reserve. Outotec’s subsidiaries have had some local credit lines of their own, which mostly have been counter-guaranteed by Outotec Oyj. the share of long-term loans was 82% of the total interest-bearing loan portfolio.
the Group maintains the following commit-ted line of credit:
eUR 50 million multicurrency revolving credit •facility that is unsecured
see the tables “contractual cash flows of liabilities” and “cash and cash equivalents and committed unutilized credit facilities”.
Capital management Outotec’s capital structure is characterized by a low gearing ratio (-56.2 % on December 31, 2010 and –55.8 % on December 31, 2009). Outotec has not defined a target level for gearing or other financial ratios. the Board’s target is to maintain a strong capital base in order to maintain inves-tor, creditor, and market confidence and to sus-tain future development of the business and the capability to pay dividends. the capital structure of the Group is reviewed by the Board of Direc-tors on a regular basis. Outotec has a mandate to purchase its own shares on the market.
there were no changes in the Group’s approach to capital management during the year.
certain externally imposed capital require-ments exist. Outotec’s main credit facilities include financial covenants, which define a minimum level of liquidity and net worth for the Group. the Group has operated in compliance with the covenants during 2006-2010.

97 Financial Statements 2010Outotec Oyj
NOTES TO THE CONSOLIDATED FINANCIAL STATEMENTS
loans from financial institutionsFinance charges -0.4 -0.1 -0.0 -0.0 - - -0.6Repayments -23.1 -3.6 -2.0 -0.4 -0.4 - -29.5
loans from pension institutionsFinance charges -0.9 -0.7 -0.5 -0.3 -0.1 -0.0 -2.4Repayments -8.6 -9.7 -7.4 -6.3 -6.3 -0.4 -38.7
Finance lease liabilitiesRents -0.2 -0.1 -0.1 - - - -0.4
Other non-current loansFinance charges -0.2 -0.2 -0.2 -0.1 -0.1 -0.6 -1.4Repayments -0.2 -0.2 -0.5 -0.4 -0.3 -3.0 -4.6
Derivative liabilitiesDesignated as cash flow hedges
Outflow -3.4 - - - - - -3.4inflow 3.2 - - - - - 3.2
Other foreign exchange forward contractsOutflow -116.6 -1.2 - - - - -117.8inflow 109.8 1.1 - - - - 110.9
Other foreign exchange option contractsOutflow -0.1 - - - - - -0.1
trade payables -71.7 - - - - - -71.7
1) Repayments in 2010 are included in current debt.average maturity of long-term debt was 2.5 years and the average interest rate 2.69%.
Contractual cash flows of liabilities at December 31, 2010
eUR million 2011 1) 2012 2013 2014 2015 2016- total
loans from financial institutionsFinance charges -1.0 -0.8 -0.7 -0.6 -0.4 -0.3 -3.8Repayments -15.7 -0.5 -7.2 -7.2 -6.8 -10.0 -47.5
loans from pension institutionsFinance charges -0.7 -0.5 -0.3 -0.1 -0.0 -0.0 -1.6Repayments -9.7 -7.5 -6.3 -6.3 -0.2 -0.2 -30.2
Finance lease liabilitiesRents -0.2 -0.1 - - - - -0.4
Other long-term loansFinance charges -0.2 -0.2 -0.1 -0.1 -0.1 -0.5 -1.2Repayments -0.2 -0.5 -0.4 -0.3 -0.3 -2.7 -4.4
Derivative liabilitiesOther foreign exchange forward contracts
Outflow -146.0 -22.3 -0.4 - - - -168.8inflow 137.2 20.1 0.4 - - - 157.7
trade payables -72.8 - - - - - -72.8
1) Repayments in 2011 are included in current debt.all non-current debt will be repaid by the end of 2023. average maturity of long-term debt was 3.17 years and the average interest rate 2.49%.
Contractual cash flows of liabilities at December 31, 2009
eUR million 2010 1) 2011 2012 2013 2014 2015 total

98 Financial Statements 2010Outotec Oyj
Cash and cash equivalents and committed unutilized credit facilities
eUR million 2010 2009
cash at bank and in hand 155.3 110.2short-term bank deposits 76.4 79.1cash equivalent marketable securities 48.5 69.2Overdraft facilities 19.7 25.2Revolving credit facility 50.0 50.0
19. Derivative instrumentsFair values of forward contracts
eUR million Positive fair value Negative fair value
Remaining maturity <1 year 1-2 years 2-3 years <1 year 1-2 years 2-3 years
2010Foreign exchange forward contracts
Designated as cash flow hedges 0.0 - - - - -Other foreign exchange forward contracts 9.2 1.1 0.9 -10.0 -1.6 -0.9
total 9.2 1.1 0.9 -10.0 -1.6 -0.9
2009Foreign exchange forward contracts
Designated as cash flow hedges 1.6 0.0 - -0.1 - -Other foreign exchange forward contracts 4.4 0.1 - -7.7 -0.0 -
Other foreign exchange options 0.0 - - -0.1 - -total 5.9 0.1 - -7.9 -0.0 -
NOTES TO THE CONSOLIDATED FINANCIAL STATEMENTS
all sales project related commercial guarantees are included in short-term liabilities as they secure ongoing contractual obligations. How-
ever, claims that affect liquidity have historically been rare. Regarding commercial guarantees two claims of eUR 1.9 million and eUR 2.7 mil-
lion were made in 2010. Ultimately both claims were settled without payment being made to beneficiaries.
Fair values are estimated based on market rates and prices and discounted future cash flows.
in 2010 hedge accounting was terminated in
compliance with ias 39 in seven sales contract
Maturity analysis for guarantee contracts at December 31, 2010
eUR million 2011 2012 2013 2014 2015 2016
Guarantees for financing -17.0 -7.3 -6.1 -6.1 - -all commercial guarantees including down payment guarantees -308.0 - - - - -0.1
related cash flow hedge plans out of which five were in Outotec Filters Oy, formerly larox Oyj.
Maturity analysis for guarantee contracts at December 31, 2009
eUR million 2010 2011 2012 2013 2014 2015
Guarantees for financing -20.0 -7.9 -7.0 -6.1 -6.1 -all commercial guarantees including down payment guarantees -320.9 -0.3 - - - -0.1
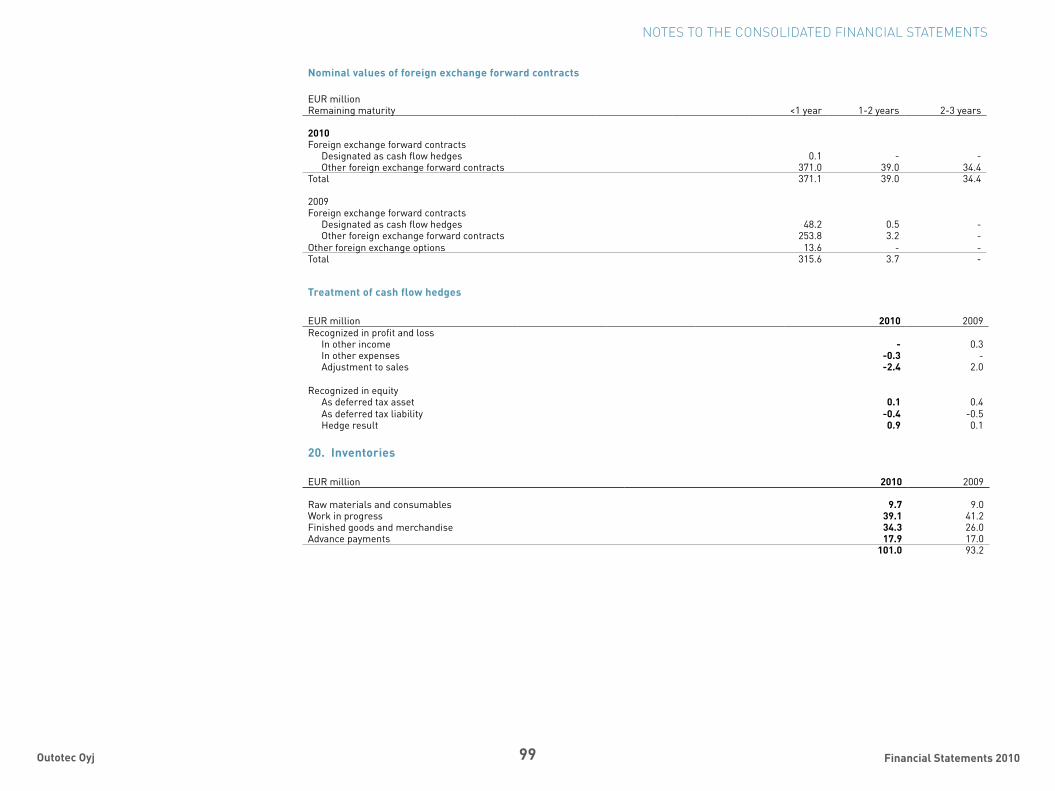
99 Financial Statements 2010Outotec Oyj
20. Inventories
eUR million 2010 2009
Raw materials and consumables 9.7 9.0Work in progress 39.1 41.2Finished goods and merchandise 34.3 26.0advance payments 17.9 17.0
101.0 93.2
Treatment of cash flow hedges eUR million 2010 2009Recognized in profit and loss
in other income - 0.3in other expenses -0.3 -adjustment to sales -2.4 2.0
Recognized in equityas deferred tax asset 0.1 0.4as deferred tax liability -0.4 -0.5Hedge result 0.9 0.1
Nominal values of foreign exchange forward contracts
eUR millionRemaining maturity <1 year 1-2 years 2-3 years
2010Foreign exchange forward contracts
Designated as cash flow hedges 0.1 - -Other foreign exchange forward contracts 371.0 39.0 34.4
total 371.1 39.0 34.4
2009Foreign exchange forward contracts
Designated as cash flow hedges 48.2 0.5 -Other foreign exchange forward contracts 253.8 3.2 -
Other foreign exchange options 13.6 - -total 315.6 3.7 -
NOTES TO THE CONSOLIDATED FINANCIAL STATEMENTS

100 Financial Statements 2010Outotec Oyj
21. Trade and other receivables
eUR million 2010 2009
Non-current
interest-bearingsubordinated loans receivable 1.1 1.1
non interest-bearingOther receivables 0.0 0.3
Current
interest-bearingloans receivable 0.5 0.7
non interest-bearingtrade receivables 172.1 142.5Project related receivables 134.8 100.5current tax assets 19.9 14.8Vat receivable 16.4 17.8Grants and subsidies receivable 0.1 0.4Other accruals 8.1 4.4Other receivables 6.5 6.3
357.9 286.7trade receivables (gross) 175.8 144.6
Doubtful trade receivablesDoubtful trade receivables at January 1 2.0 2.0translation differences 0.0 0.2additions 2.7 0.6Deductions -0.5 -0.2Recovery of doubtful receivables -0.6 -0.6Doubtful trade receivables at December 31 3.6 2.0
Total trade receivables 172.1 142.5
The ageing of trade receivables:not due 104.6 66.7Overdue by:
Between 1 and 30 days 33.2 24.5Between 31 and 60 days 5.7 9.8more than 60 days 32.2 43.5
total trade receivables (gross) 175.8 144.6
Trade receivables by geographic regionFinland 3.2 5.8Germany 1.5 2.4cis 6.7 1.1Rest of europe 16.8 14.3north america 17.8 18.2south america 37.3 30.8australia 17.7 14.5asia 48.2 29.2africa 22.9 26.2total 172.1 142.5
trade receivables are according to the customer’s location.
NOTES TO THE CONSOLIDATED FINANCIAL STATEMENTS

101 Financial Statements 2010Outotec Oyj
23. Equity
eUR millionnumber of shares
1,000 shares share capital share premium fundReserve for invested
non-restricted equity total
At December 31, 2010 45,780 17.2 20.2 87.7 125.1at December 31, 2009 44,763 16.8 20.2 63.4 100.4
22. Cash and cash equivalents
eUR million 2010 2009
cash at bank and in hand 155.3 110.2short-term bank deposits 76.4 79.1cash equivalent marketable securities 48.5 69.2
280.3 258.5
NOTES TO THE CONSOLIDATED FINANCIAL STATEMENTS
Outotec Oyj’s shares were entered into the Finnish Book-entry securities system on september 25, 2006. according to the articles of association, the maximum number of Outotec Oyj shares is 100.0 million. each share entitles its holder to one vote at the general meetings of shareholders of the com-pany.
Fair value reserveFair value reserves include movements in the fair value of the available-for-sale financial assets and cash flow hedge result deferred to equity.
Other reservesOther reserves include the reserve fund and oth-er reserves. the reserve fund includes amounts transferred from the distributable equity under the articles of association or by a decision by Gener-al meeting of shareholders. Other reserves include other items based on the local regulations of the group companies.
Reserve for invested non-restricted equityOutotec completed the acquisition of control in lar-ox through a directed share issue on December 21, 2009, and made a mandatory public tender offer for the remaining larox shares. On January 27, 2010, Outotec announced the final result of the tender of-fer, according to which the larox shares in Outo-
tec’s ownership represented approximately 98.5% of all the larox shares and approximately 99.7% of all the votes attached to the larox shares. On June 10, 2010, the arbitral tribunal confirmed that Outo-tec had gained title to all the larox shares by lodg-ing security for the payment of the redemption price and the interest accruing thereon. most of the con-sideration for the larox shares purchased was paid in the form of 3,780,373 (2009: 2,763,419) new Out-otec shares which totaled eUR 88.1 million (2009: eUR 63.4 million). eUR 0.4 million of these new Out-otec shares are reported under share capital and eUR 87.7 million under the reserve for invested non-restricted equity.
Treasury sharesOutotec has an agreement with a third-party ser-vice provider concerning administration and hedging of a share-based incentive program for key person-nel. as part of this agreement, for hedging the un-derlying cash flow risk, the service provider has pur-chased Outotec shares during 2008 and 2009. the purchase of Outotec shares by a third-party service provider has been funded by Outotec and account-ed for as treasury shares in Outotec’s consolidat-ed balance sheet. at the end of the year 2010, the amount of these treasury shares was 332,534 (2009: 332,534). Outotec’s consolidated balance sheet and consolidated changes in equity reflect the substance
of the arrangement with a deduction amounting to eUR 4.6 million (2009: eUR 4.6 million) in equity. this amount represents the consideration paid for the shares by the third-party service provider.
On may 21, 2010, Outotec’s board of directors determined a new share ownership plan direct-ed to the members of the Outotec executive board. as part of the plan, the executive board members established Outotec management Oy, whose en-tire share capital is owned by them. the purpose of the plan is to commit executive board mem-bers to Outotec by encouraging them to acquire and hold Outotec shares and thus increase the compa-ny’s shareholder value in the long run. Outotec has consolidated Outotec management Oy (incentive plan for Outotec executive board members) into the Group’s balance sheet. at the end of the reporting period, Outotec management Oy held 191,211 Out-otec shares which have been accounted for as trea-sury shares on Outotec’s balance sheet. this has decreased the Group’s equity by eUR 5.1 million.
Dividendthe Board of Directors will propose a dividend of eUR 0.75 per share for 2010. the parent company’s distributable funds were eUR 202.3 million at De-cember 31, 2010.
a majority of Outotec’s investments were made in the following currencies: euro, australian dollar, and south african Rand. the relevant reference
rate of euro has varied during 2010 between 0.4 - 0.85%. the australian dollar reference rate varied between 3.5 - 5.1%. For south african Rand the
relevant reference rate was Prime, the value of which varied between 9.0 - 10.5%. Prime has decreased during 2010.
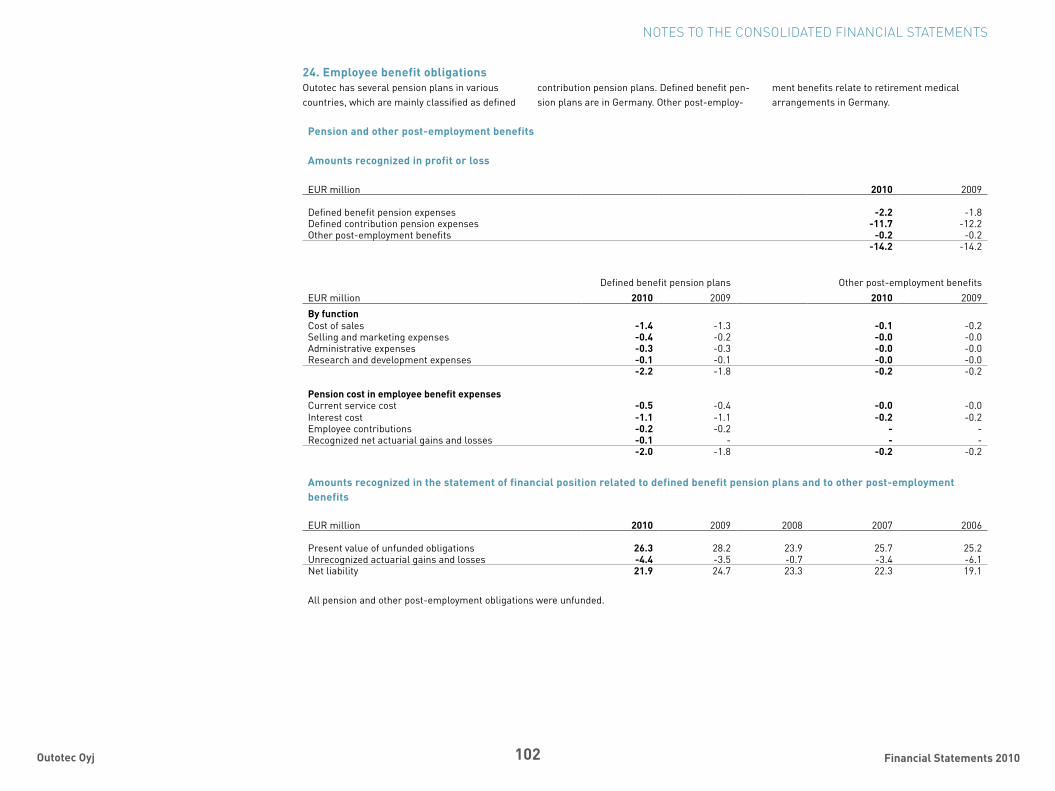
102 Financial Statements 2010Outotec Oyj
Pension and other post-employment benefits
Amounts recognized in profit or loss
eUR million 2010 2009
Defined benefit pension expenses -2.2 -1.8Defined contribution pension expenses -11.7 -12.2Other post-employment benefits -0.2 -0.2
-14.2 -14.2
Defined benefit pension plans Other post-employment benefitseUR million 2010 2009 2010 2009By function cost of sales -1.4 -1.3 -0.1 -0.2selling and marketing expenses -0.4 -0.2 -0.0 -0.0administrative expenses -0.3 -0.3 -0.0 -0.0Research and development expenses -0.1 -0.1 -0.0 -0.0
-2.2 -1.8 -0.2 -0.2
Pension cost in employee benefit expensescurrent service cost -0.5 -0.4 -0.0 -0.0interest cost -1.1 -1.1 -0.2 -0.2employee contributions -0.2 -0.2 - -Recognized net actuarial gains and losses -0.1 - - -
-2.0 -1.8 -0.2 -0.2
Amounts recognized in the statement of financial position related to defined benefit pension plans and to other post-employment benefits
eUR million 2010 2009 2008 2007 2006
Present value of unfunded obligations 26.3 28.2 23.9 25.7 25.2Unrecognized actuarial gains and losses -4.4 -3.5 -0.7 -3.4 -6.1net liability 21.9 24.7 23.3 22.3 19.1
all pension and other post-employment obligations were unfunded.
NOTES TO THE CONSOLIDATED FINANCIAL STATEMENTS
24. Employee benefit obligationsOutotec has several pension plans in various countries, which are mainly classified as defined
contribution pension plans. Defined benefit pen-sion plans are in Germany. Other post-employ-
ment benefits relate to retirement medical arrangements in Germany.

103 Financial Statements 2010Outotec Oyj
Reconciliation of liability
Other post-employment benefitsDefined benefit pension plans eUR million 2010 2009 2010 2009
net liability at January 1 21.0 19.7 3.7 3.6net periodic pension cost in profit or loss 1.9 1.8 0.1 0.2Benefits paid -0.9 -0.9 -0.2 -0.2change in plan provisions 0.0 - -0.1 -acquisition of subsidiaries 0.0 0.5 0.0 0.1net liability at December 31 21.9 21.0 3.5 3.7
Movement in the present value of the defined benefit obligation
Other post-employment benefitsDefined benefit pension plans eUR million 2010 2009 2010 2009
Unfunded obligation at January 1 24.9 20.6 3.3 3.3service cost 0.5 0.4 0.0 0.0interest cost 1.1 1.1 0.2 0.2Unrecognized actuarial gains and losses 0.6 3.0 0.3 -0.1employee contributions 0.2 0.2 0.0 -Benefits paid -1.0 -0.9 -0.2 -0.2change in plan provisions 0.0 - -0.1 -acquisition of subsidiaries 0.0 0.5 0.0 0.1Unfunded obligation at December 31 26.3 24.9 3.4 3.3
Principal actuarial assumptions
% 2010 2009
Discount rate 5.0 5.14 - 5.90Future benefit increase expectation 2.0 2.0
Pensions do not depend on salary development.
NOTES TO THE CONSOLIDATED FINANCIAL STATEMENTS

104 Financial Statements 2010Outotec Oyj
25. Provisions
eUR million Project provisions 1) Other provisions 2) 2010
Non-currentProvisions at January 1 22.4 - 22.4translation differences 0.1 - 0.1additions 7.5 - 7.5acquired subsidiaries - - -Provisions utilized during the period -10.0 - -10.0Provisions released -0.6 - -0.6Other changes -1.1 - -1.1Provisions at December 31 18.3 - 18.3
CurrentProvisions at January 1 17.1 5.3 22.3translation differences 1.4 0.1 1.5additions 17.6 5.2 22.8acquired subsidiaries - 0.2 0.2Provisions utilized during the period -7.8 -2.7 -10.5Provisions released -9.4 -1.3 -10.8Other changes 1.1 -3.2 -2.1Provisions at December 31 20.0 3.6 23.7
Provisions are based on best estimates on the balance sheet date.
1) non-current project provisions include eUR 17.3 million warranty provisions and eUR 1.0 million project loss provisions at December 31, 2010. current project provisions include eUR 19.9 million warranty provisions and eUR 0.2 million project loss provisions at December 31, 2010. 2) current other provisions include eUR 1.4 million restructuring provisions at December 31, 2010
26. Interest-bearing liabilities
Carrying amount Fair value
eUR million 2010 2009 2010 2009
Non-currentloans from financial institutions 31.7 6.5 31.7 6.4loans from pension institutions 20.5 30.2 20.3 29.8Finance lease liabilities 0.1 0.2 0.1 0.2Other non-current loans 4.2 4.4 4.2 4.4
56.6 41.2 56.4 40.7
Current loans from financial institutions 5.7 23.1 5.8 23.1loans from pension institutions 9.7 8.6 10.3 9.2Finance lease liabilities 0.2 0.2 0.2 0.2Other current loans 10.1 0.2 10.1 0.2
25.7 32.0 26.4 32.6
loans have been valued at current market rates which causes differencies against carrying values.
NOTES TO THE CONSOLIDATED FINANCIAL STATEMENTS

105 Financial Statements 2010Outotec Oyj
27. Trade and other payables
eUR million 2010 2009
Non-currentOther non-current liabilities 5.2 2.2
Currenttrade payables 72.8 71.7advances received 198.7 150.9Project-related liabilities 134.8 84.7accrued employee-related expenses 38.8 29.6Vat payable 8.0 3.1Withholding tax and social security liabilities 5.5 4.4Other accruals 18.9 9.1Other payables 3.1 1.4
480.7 354.9all trade and other payables were non interest-bearing.
Finance lease liabilities
eUR millionMinimum lease payments 2010
minimum leasepayments 2009
Present value of minimum lease payments 2010
Present value of minimum lease payments 2009
not later than 1 year 0.2 0.2 0.2 0.21-2 years 0.1 0.2 0.1 0.12-3 years - 0.1 - 0.13-4 years - 0.0 - 0.04-5 years - - - -Future finance charges -0.0 -0.0 - -
0.3 0.4 0.3 0.4
NOTES TO THE CONSOLIDATED FINANCIAL STATEMENTS

106 Financial Statements 2010Outotec Oyj
28. Carrying amounts of financial assets and liabilities by categories
2010eUR million
Financial assets at fair value
through profit or loss
Loans and receivables
Available-for-sale
financial assets
Financial liabilities at
fair value through
profit or loss
Financial liabilities
measured at amortized
cost
Carrying amounts
by balance sheet item Fair value
Non-current financial assetsDerivative assets Foreign exchange forward contracts 1.9 - - - - 1.9 1.9Other shares and securities - - 1.4 - - 1.4 1.4trade and other receivables interest-bearing - 1.1 - - - 1.1 1.1 non interest-bearing - 0.0 - - - 0.0 0.0Current financial assetsDerivative assets Foreign exchange forward contracts 9.2 - - - - 9.2 9.2 Foreign exchange options - - - - - - -trade and other receivables interest-bearing - 0.5 - - - 0.5 0.5 non interest-bearing - 357.9 - - - 357.9 357.9cash and cash equivalents - 280.3 - - - 280.3 280.3Carrying amount by category 11.2 639.8 1.4 - - 652.4 652.4
Non-current financial liabilitiesloans from financial institutions - - - - 31.7 31.7 31.7loans from pension institutions - - - - 20.5 20.5 20.3Finance lease liabilities - - - - 0.1 0.1 0.1Derivative liabilities Foreign exchange forward contracts - - - 2.5 - 2.5 2.5Other non-current loans - - - 4.2 4.2 4.2Other non-current liabilities - - - 5.2 5.2 5.2Current financial liabilitiesloans from financial institutions - - - - 5.7 5.7 5.8loans from pension institutions - - - - 9.7 9.7 10.3Finance lease liabilities - - - - 0.2 0.2 0.2Derivative liabilities Foreign exchange forward contracts - - - 10.0 - 10.0 10.0 Foreign exchange options - - - - - - -Other current loans - - - - 10.1 10.1 10.1trade payables - - - - 72.8 72.8 72.8Carrying amount by category - - - 12.5 160.3 172.8 173.3
NOTES TO THE CONSOLIDATED FINANCIAL STATEMENTS
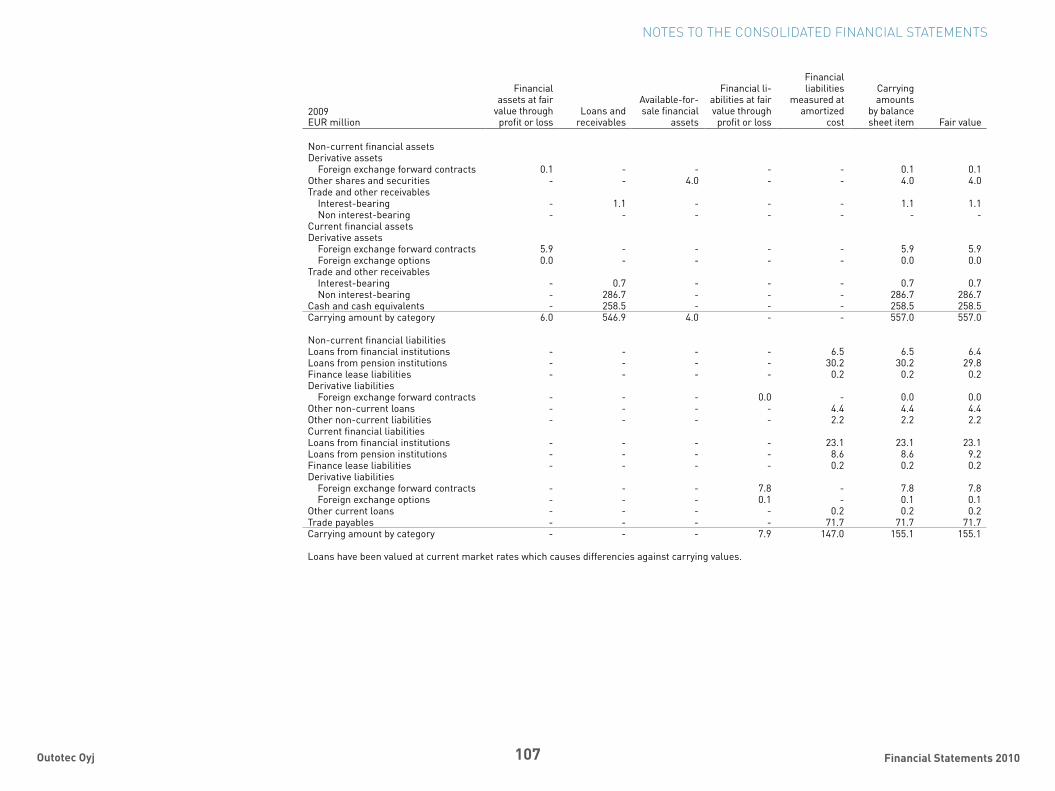
107 Financial Statements 2010Outotec Oyj
2009eUR million
Financial assets at fair
value through profit or loss
loans and receivables
available-for-sale financial
assets
Financial li-abilities at fair value through profit or loss
Financial liabilities
measured at amortized
cost
carrying amounts
by balance sheet item Fair value
non-current financial assetsDerivative assets Foreign exchange forward contracts 0.1 - - - - 0.1 0.1Other shares and securities - - 4.0 - - 4.0 4.0trade and other receivables interest-bearing - 1.1 - - - 1.1 1.1 non interest-bearing - - - - - - -current financial assetsDerivative assets Foreign exchange forward contracts 5.9 - - - - 5.9 5.9 Foreign exchange options 0.0 - - - - 0.0 0.0trade and other receivables interest-bearing - 0.7 - - - 0.7 0.7 non interest-bearing - 286.7 - - - 286.7 286.7cash and cash equivalents - 258.5 - - - 258.5 258.5carrying amount by category 6.0 546.9 4.0 - - 557.0 557.0
non-current financial liabilitiesloans from financial institutions - - - - 6.5 6.5 6.4loans from pension institutions - - - - 30.2 30.2 29.8Finance lease liabilities - - - - 0.2 0.2 0.2Derivative liabilities Foreign exchange forward contracts - - - 0.0 - 0.0 0.0Other non-current loans - - - - 4.4 4.4 4.4Other non-current liabilities - - - - 2.2 2.2 2.2current financial liabilitiesloans from financial institutions - - - - 23.1 23.1 23.1loans from pension institutions - - - - 8.6 8.6 9.2Finance lease liabilities - - - - 0.2 0.2 0.2Derivative liabilities Foreign exchange forward contracts - - - 7.8 - 7.8 7.8 Foreign exchange options - - - 0.1 - 0.1 0.1Other current loans - - - - 0.2 0.2 0.2trade payables - - - - 71.7 71.7 71.7carrying amount by category - - - 7.9 147.0 155.1 155.1
loans have been valued at current market rates which causes differencies against carrying values.
NOTES TO THE CONSOLIDATED FINANCIAL STATEMENTS

108 Financial Statements 2010Outotec Oyj
2010
eUR million Level 1 Level 2 Level 3 Total
available-for-sale financial assets 0.5 - 0.9 1.4Derivative financial assets - 11.2 - 11.2
0.5 11.2 0.9 12.6
Derivative financial liabilities - 12.5 - 12.5- 12.5 - 12.5
2009
available-for-sale financial assets 0.2 - 3.8 4.0Derivative financial assets - 6.0 - 6.0
0.2 6.0 3.8 10.0
Derivative financial liabilities - 7.9 - 7.9- 7.9 - 7.9
NOTES TO THE CONSOLIDATED FINANCIAL STATEMENTS
Fair value hierarchythe iFRs 7 standard requires use of a three-level fair value hierarchy of financial instruments. For
more information, please see the principles to the consolidated financial statements.
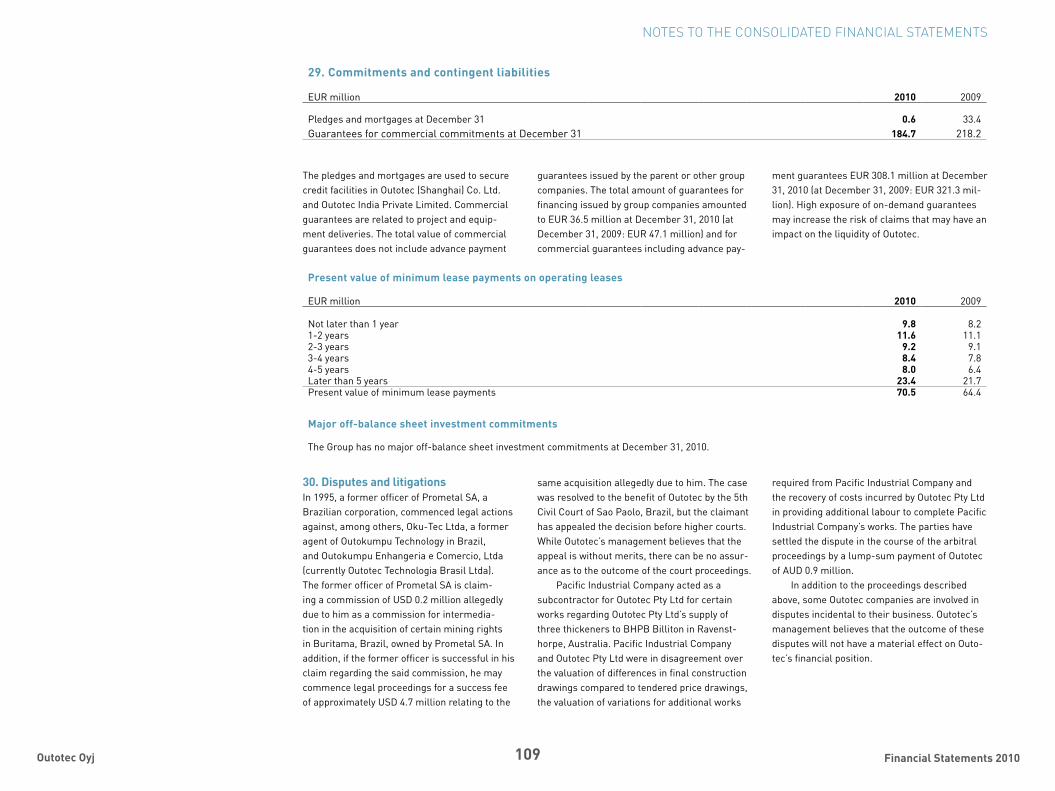
109 Financial Statements 2010Outotec Oyj
NOTES TO THE CONSOLIDATED FINANCIAL STATEMENTS
30. Disputes and litigationsin 1995, a former officer of Prometal sa, a Brazilian corporation, commenced legal actions against, among others, Oku-tec ltda, a former agent of Outokumpu technology in Brazil, and Outokumpu enhangeria e comercio, ltda (currently Outotec technologia Brasil ltda). the former officer of Prometal sa is claim-ing a commission of UsD 0.2 million allegedly due to him as a commission for intermedia-tion in the acquisition of certain mining rights in Buritama, Brazil, owned by Prometal sa. in addition, if the former officer is successful in his claim regarding the said commission, he may commence legal proceedings for a success fee of approximately UsD 4.7 million relating to the
same acquisition allegedly due to him. the case was resolved to the benefit of Outotec by the 5th civil court of sao Paolo, Brazil, but the claimant has appealed the decision before higher courts. While Outotec’s management believes that the appeal is without merits, there can be no assur-ance as to the outcome of the court proceedings.
Pacific industrial company acted as a subcontractor for Outotec Pty ltd for certain works regarding Outotec Pty ltd’s supply of three thickeners to BHPB Billiton in Ravenst-horpe, australia. Pacific industrial company and Outotec Pty ltd were in disagreement over the valuation of differences in final construction drawings compared to tendered price drawings, the valuation of variations for additional works
29. Commitments and contingent liabilities
eUR million 2010 2009
Pledges and mortgages at December 31 0.6 33.4Guarantees for commercial commitments at December 31 184.7 218.2
the pledges and mortgages are used to secure credit facilities in Outotec (shanghai) co. ltd. and Outotec india Private limited. commercial guarantees are related to project and equip-ment deliveries. the total value of commercial guarantees does not include advance payment
guarantees issued by the parent or other group companies. the total amount of guarantees for financing issued by group companies amounted to eUR 36.5 million at December 31, 2010 (at December 31, 2009: eUR 47.1 million) and for commercial guarantees including advance pay-
ment guarantees eUR 308.1 million at December 31, 2010 (at December 31, 2009: eUR 321.3 mil-lion). High exposure of on-demand guarantees may increase the risk of claims that may have an impact on the liquidity of Outotec.
Present value of minimum lease payments on operating leases
eUR million 2010 2009
not later than 1 year 9.8 8.21-2 years 11.6 11.12-3 years 9.2 9.13-4 years 8.4 7.84-5 years 8.0 6.4later than 5 years 23.4 21.7Present value of minimum lease payments 70.5 64.4
Major off-balance sheet investment commitments
the Group has no major off-balance sheet investment commitments at December 31, 2010.
required from Pacific industrial company and the recovery of costs incurred by Outotec Pty ltd in providing additional labour to complete Pacific industrial company’s works. the parties have settled the dispute in the course of the arbitral proceedings by a lump-sum payment of Outotec of aUD 0.9 million.
in addition to the proceedings described above, some Outotec companies are involved in disputes incidental to their business. Outotec’s management believes that the outcome of these disputes will not have a material effect on Outo-tec’s financial position.
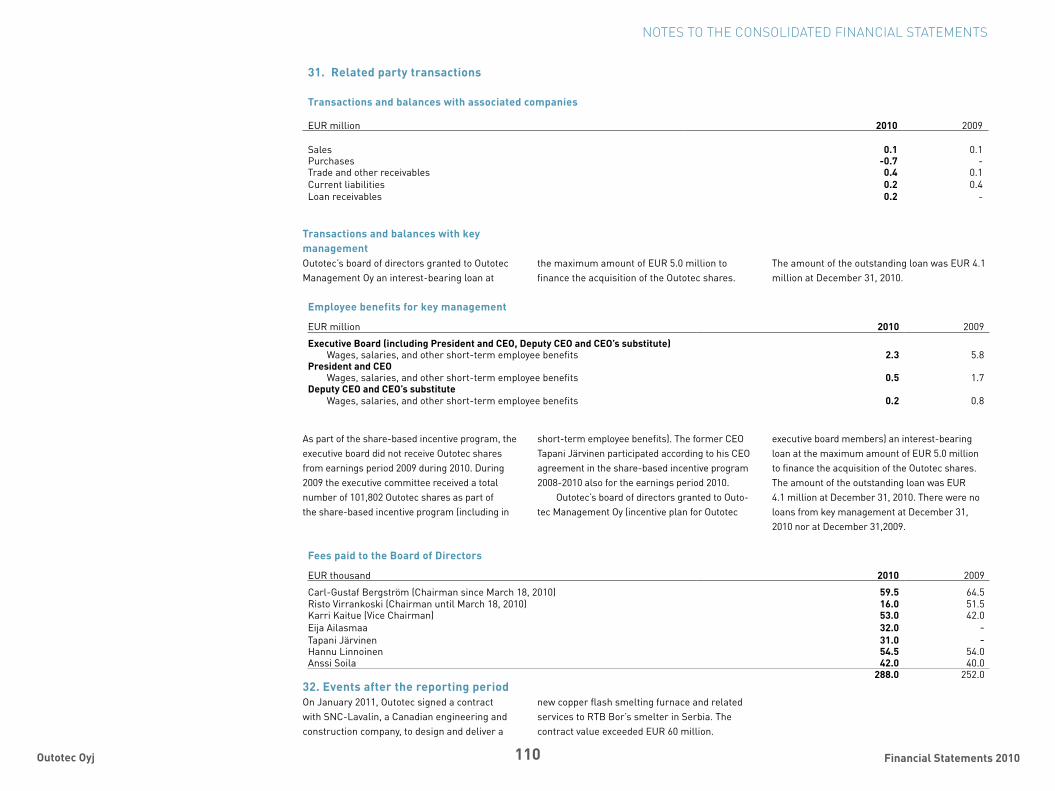
110 Financial Statements 2010Outotec Oyj
31. Related party transactions
Transactions and balances with associated companies
eUR million 2010 2009
sales 0.1 0.1Purchases -0.7 -trade and other receivables 0.4 0.1current liabilities 0.2 0.4loan receivables 0.2 -
NOTES TO THE CONSOLIDATED FINANCIAL STATEMENTS
Transactions and balances with key managementOutotec’s board of directors granted to Outotec management Oy an interest-bearing loan at
the maximum amount of eUR 5.0 million to finance the acquisition of the Outotec shares.
Employee benefits for key management
eUR million 2010 2009
Executive Board (including President and CEO, Deputy CEO and CEO’s substitute)Wages, salaries, and other short-term employee benefits 2.3 5.8
President and CEOWages, salaries, and other short-term employee benefits 0.5 1.7
Deputy CEO and CEO’s substituteWages, salaries, and other short-term employee benefits 0.2 0.8
as part of the share-based incentive program, the executive board did not receive Outotec shares from earnings period 2009 during 2010. During 2009 the executive committee received a total number of 101,802 Outotec shares as part of the share-based incentive program (including in
short-term employee benefits). the former ceO tapani Järvinen participated according to his ceO agreement in the share-based incentive program 2008-2010 also for the earnings period 2010.
Outotec’s board of directors granted to Outo-tec management Oy (incentive plan for Outotec
executive board members) an interest-bearing loan at the maximum amount of eUR 5.0 million to finance the acquisition of the Outotec shares. the amount of the outstanding loan was eUR 4.1 million at December 31, 2010. there were no loans from key management at December 31, 2010 nor at December 31,2009.
Fees paid to the Board of Directors
eUR thousand 2010 2009
carl-Gustaf Bergström (chairman since march 18, 2010) 59.5 64.5Risto Virrankoski (chairman until march 18, 2010) 16.0 51.5Karri Kaitue (Vice chairman) 53.0 42.0eija ailasmaa 32.0 -tapani Järvinen 31.0 -Hannu linnoinen 54.5 54.0anssi soila 42.0 40.0
288.0 252.032. Events after the reporting periodOn January 2011, Outotec signed a contract with snc-lavalin, a canadian engineering and construction company, to design and deliver a
new copper flash smelting furnace and related services to RtB Bor’s smelter in serbia. the contract value exceeded eUR 60 million.
the amount of the outstanding loan was eUR 4.1 million at December 31, 2010.
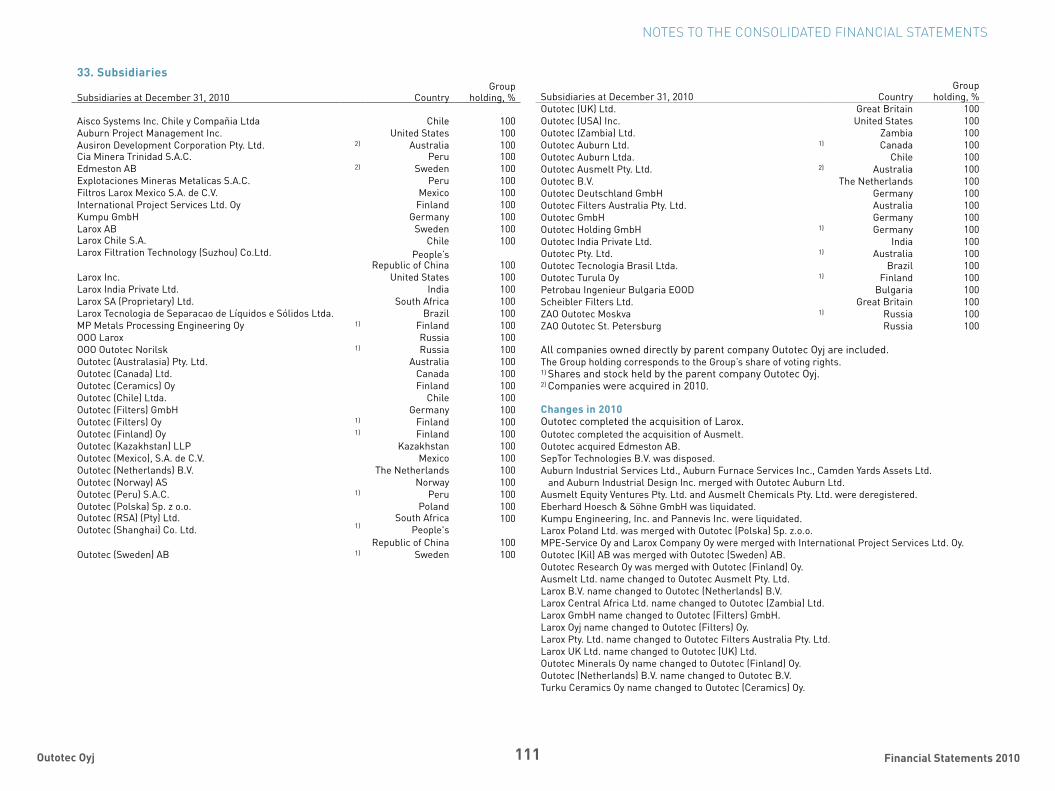
111 Financial Statements 2010Outotec Oyj
33. Subsidiaries
subsidiaries at December 31, 2010 countryGroup
holding, %
aisco systems inc. chile y compañia ltda chile 100auburn Project management inc. United states 100ausiron Development corporation Pty. ltd. 2) australia 100cia minera trinidad s.a.c. Peru 100edmeston aB 2) sweden 100explotaciones mineras metalicas s.a.c. Peru 100Filtros larox mexico s.a. de c.V. mexico 100international Project services ltd. Oy Finland 100Kumpu GmbH Germany 100larox aB sweden 100larox chile s.a. chile 100larox Filtration technology (suzhou) co.ltd. People’s
Republic of china 100larox inc. United states 100larox india Private ltd. india 100larox sa (Proprietary) ltd. south africa 100larox tecnologia de separacao de líquidos e sólidos ltda. Brazil 100mP metals Processing engineering Oy 1) Finland 100OOO larox Russia 100OOO Outotec norilsk 1) Russia 100Outotec (australasia) Pty. ltd. australia 100Outotec (canada) ltd. canada 100Outotec (ceramics) Oy Finland 100Outotec (chile) ltda. chile 100Outotec (Filters) GmbH Germany 100Outotec (Filters) Oy 1) Finland 100Outotec (Finland) Oy 1) Finland 100Outotec (Kazakhstan) llP Kazakhstan 100Outotec (mexico), s.a. de c.V. mexico 100Outotec (netherlands) B.V. the netherlands 100Outotec (norway) as norway 100Outotec (Peru) s.a.c. 1) Peru 100Outotec (Polska) sp. z o.o. Poland 100Outotec (Rsa) (Pty) ltd. south africa 100Outotec (shanghai) co. ltd. 1) People's
Republic of china 100Outotec (sweden) aB 1) sweden 100
subsidiaries at December 31, 2010 countryGroup
holding, %Outotec (UK) ltd. Great Britain 100Outotec (Usa) inc. United states 100Outotec (Zambia) ltd. Zambia 100Outotec auburn ltd. 1) canada 100Outotec auburn ltda. chile 100Outotec ausmelt Pty. ltd. 2) australia 100Outotec B.V. the netherlands 100Outotec Deutschland GmbH Germany 100Outotec Filters australia Pty. ltd. australia 100Outotec GmbH Germany 100Outotec Holding GmbH 1) Germany 100Outotec india Private ltd. india 100Outotec Pty. ltd. 1) australia 100Outotec tecnologia Brasil ltda. Brazil 100Outotec turula Oy 1) Finland 100Petrobau ingenieur Bulgaria eOOD Bulgaria 100scheibler Filters ltd. Great Britain 100ZaO Outotec moskva 1) Russia 100ZaO Outotec st. Petersburg Russia 100
all companies owned directly by parent company Outotec Oyj are included.the Group holding corresponds to the Group’s share of voting rights.1) shares and stock held by the parent company Outotec Oyj.2) companies were acquired in 2010.
Changes in 2010Outotec completed the acquisition of larox.Outotec completed the acquisition of ausmelt.Outotec acquired edmeston aB.septor technologies B.V. was disposed. auburn industrial services ltd., auburn Furnace services inc., camden Yards assets ltd. and auburn industrial Design inc. merged with Outotec auburn ltd. ausmelt equity Ventures Pty. ltd. and ausmelt chemicals Pty. ltd. were deregistered.eberhard Hoesch & söhne GmbH was liquidated.Kumpu engineering, inc. and Pannevis inc. were liquidated.larox Poland ltd. was merged with Outotec (Polska) sp. z.o.o.mPe-service Oy and larox company Oy were merged with international Project services ltd. Oy.Outotec (Kil) aB was merged with Outotec (sweden) aB.Outotec Research Oy was merged with Outotec (Finland) Oy.ausmelt ltd. name changed to Outotec ausmelt Pty. ltd.larox B.V. name changed to Outotec (netherlands) B.V.larox central africa ltd. name changed to Outotec (Zambia) ltd.larox GmbH name changed to Outotec (Filters) GmbH.larox Oyj name changed to Outotec (Filters) Oy.larox Pty. ltd. name changed to Outotec Filters australia Pty. ltd.larox UK ltd. name changed to Outotec (UK) ltd.Outotec minerals Oy name changed to Outotec (Finland) Oy.Outotec (netherlands) B.V. name changed to Outotec B.V.turku ceramics Oy name changed to Outotec (ceramics) Oy.
NOTES TO THE CONSOLIDATED FINANCIAL STATEMENTS

112 Financial Statements 2010Outotec Oyj
Key finanCial figuRes Of tHe gROuP
2010 2009 2008 2007 20061)
Scope of activitysales eUR million 969.6 877.7 1,217.9 1,000.1 740.4- change in sales % 10.5 -27.9 21.8 35.1 33.1- exports from and sales outside Finland, of total sales % 95.6 93.6 95.0 95.7 97.3
capital expenditure eUR million 96.7 98.0 23.9 11.6 8.0- in relation to sales % 10.0 11.2 2.0 1.2 1.1Research and development expenses eUR million 28.5 20.5 20.2 19.9 19.2- in relation to sales % 2.9 2.3 1.7 2.0 2.6Personnel at December 31 3,130 3,128 2,674 2,144 1,797- average for the year 3,151 2,612 2,483 2,031 1,825Order backlog at the end of the period eUR million 1,393.1 867.4 1,176.7 1,317.2 866.4Order intake eUR million 1,394.7 557.1 1,153.8 1,463.0 1,032.2
ProfitabilityOperating profit eUR million 41.6 58.6 120.2 96.1 51.6- in relation to sales % 4.3 6.7 9.9 9.6 7.0Profit before taxes eUR million 37.1 60.9 136.3 104.8 56.6- in relation to sales % 3.8 6.9 11.2 10.5 7.6Gross margin % 26.2 21.7 21.5 20.4 20.7Return on equity % 7.6 14.9 42.6 43.3 29.1Return on investment % 9.2 20.9 61.6 59.8 45.4
Financing and financial positionequity-to-assets ratio at the end of the period % 41.2 45.1 35.0 38.2 36.9Gearing at the end of the period % -56.2 -55.8 -139.0 -136.4 -118.0net interest-bearing debt at the end of the period eUR million -200.9 -191.0 -314.6 -292.9 -170.0net cash from operating activities eUR million 87.5 -28.5 106.6 143.0 67.8Dividends eUR million 34.3 2) 32.0 42.0 39.9 14.7
1) combined basis 2) the Board of Directors’ proposal to the annual General meeting on march 22, 2011.
kEY FINANCIAL FIguRES, IFRS

113 Financial Statements 2010Outotec Oyj
sHaRe-Related Key figuRes2010 2009 2008 2007 20061)
earnings per share eUR 0.59 1.01 2.25 1.85 0.88
equity per share eUR 7.87 7.09 5.43 5.11 3.43
Dividend per share eUR 0.752) 0.70 1.00 0.95 0.35Dividend payout ratio % 128.8 75.7 44.7 51.4 39.7Dividend yield % 1.6 2.8 9.3 2.5 1.5
Price/earnings ratio 78.6 24.5 4.8 20.4 25.7
Development of share priceaverage trading price eUR 28.76 17.39 26.28 36.03 14.23lowest trading price eUR 18.85 9.30 8.52 19.25 12.40Highest trading price eUR 47.25 24.87 45.76 54.75 22.76trading price at the end of the period eUR 46.24 24.74 10.80 37.60 22.70
market capitalization at the end of the period eUR million 2,116.9 1,107.4 453.6 1,579.2 953.4
Development in trading volumetrading volume 1,000 shares 99,942 106,506 158,008 138,813 88,736in relation to weightedaverage number of shares % 220.3 254.5 378.1 330.5 211.3
adjusted average number of shares 45,356,862 41,843,793 41,790,417 42,000,000 42,000,000number of shares at the end of the period 3) 45,332,738 44,435,787 41,735,000 42,000,000 42,000,000
1) combined basis2) the Board of Directors’ proposal to the annual General meeting on march 22, 20113) number of registered shares at December 31, 2010, was 45,780,373 (at December 31, 2009: 44,763,419).
quaRteRly infORmatiOn (unaudited)eUR million Q1/09 Q2/09 Q3/09 Q4/09 Q1/10 Q2/10 Q3/10 Q4/10
Salesnon-ferrous solutions 129.9 132.2 104.6 115.9 113.5 141.3 144.6 223.9Ferrous solutions 27.7 34.2 34.9 49.9 20.0 32.9 35.5 43.2energy, light metals and environmental solutions 76.8 74.3 51.3 56.3 54.6 52.6 50.3 65.3
Unallocated items1) and intra-group sales -2.7 -3.1 -2.2 -2.3 -1.0 -3.0 -1.8 -2.2total 231.6 237.6 188.7 219.8 187.0 223.8 228.5 330.3
Operating profitnon-ferrous solutions 10.5 7.3 9.4 7.9 -15.4 4.8 13.5 23.2Ferrous solutions 1.6 0.2 2.6 5.1 -2.5 1.4 4.2 8.2energy, light metals and environmental solutions 7.0 9.2 4.6 6.8 10.0 1.9 3.5 11.4
Unallocated items2) and intra-group items -2.7 -2.7 -1.5 -6.5 -2.2 -2.6 -3.1 -14.7total 16.3 13.9 15.1 13.3 -10.1 5.5 18.1 28.1
Order backlog at the end of period 1,090.4 966.6 980.0 867.4 1,155.7 1,310.1 1,332.2 1,393.1
1) Unallocated items primarily include invoicing of group management and administrative services.2) Unallocated items primarily include group management and administrative services.
kEY FINANCIAL FIguRES, IFRS
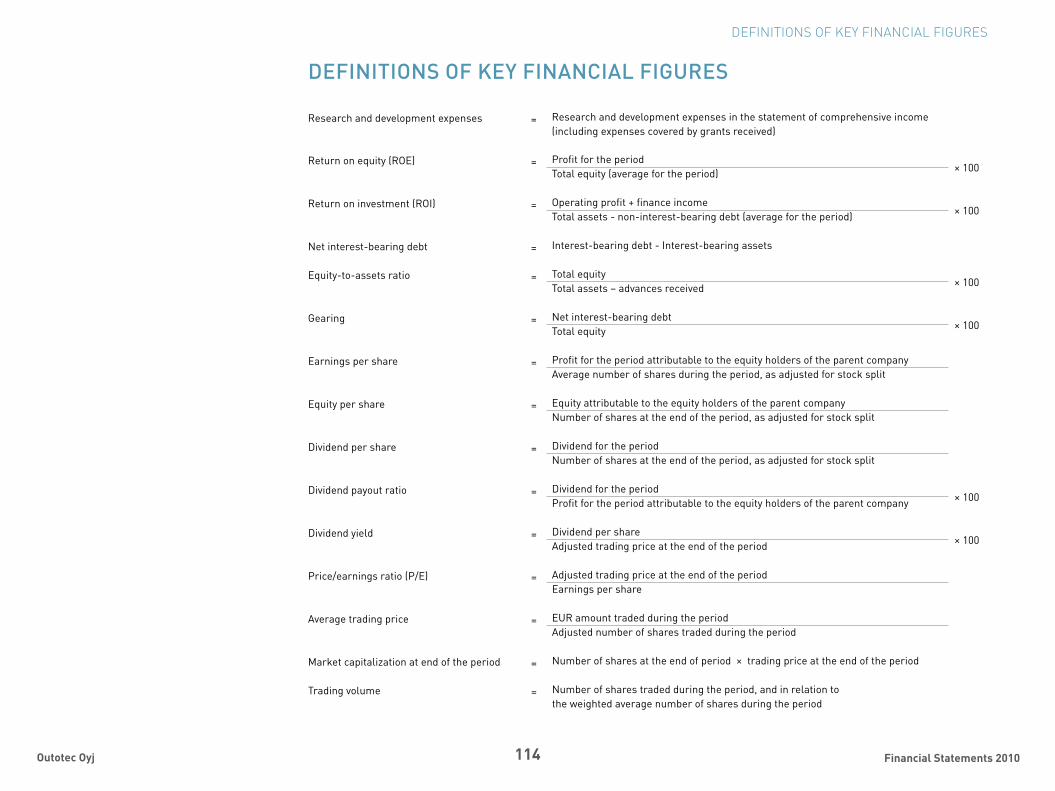
114 Financial Statements 2010Outotec Oyj
definitiOns Of Key finanCial figuRes
Research and development expenses = Research and development expenses in the statement of comprehensive income(including expenses covered by grants received)
Return on equity (ROe) = Profit for the period× 100total equity (average for the period)
Return on investment (ROi) = Operating profit + finance income× 100total assets - non-interest-bearing debt (average for the period)
net interest-bearing debt = interest-bearing debt - interest-bearing assets
equity-to-assets ratio = total equity × 100total assets – advances received
Gearing = net interest-bearing debt× 100total equity
earnings per share = Profit for the period attributable to the equity holders of the parent companyaverage number of shares during the period, as adjusted for stock split
equity per share = equity attributable to the equity holders of the parent companynumber of shares at the end of the period, as adjusted for stock split
Dividend per share = Dividend for the periodnumber of shares at the end of the period, as adjusted for stock split
Dividend payout ratio = Dividend for the period× 100Profit for the period attributable to the equity holders of the parent company
Dividend yield = Dividend per share× 100adjusted trading price at the end of the period
Price/earnings ratio (P/e) = adjusted trading price at the end of the periodearnings per share
average trading price = eUR amount traded during the periodadjusted number of shares traded during the period
market capitalization at end of the period = number of shares at the end of period × trading price at the end of the period
trading volume = number of shares traded during the period, and in relation tothe weighted average number of shares during the period
DEFINITIONS OF kEY FINANCIAL FIguRES

115 Financial Statements 2010Outotec Oyj
inCOme statement Of tHe PaRent COmPany
eUR million note 2010 2009
Sales 2, 3 115.3 100.5
cost of sales 4 -85.7 -71.4Gross profit 29.6 29.1
Other operating income 5 27.9 24.9selling and marketing expenses -16.1 -11.3administrative expenses -24.0 -12.9Research and development expenses -19.8 -14.1Other operating expenses 9 -2.4 -4.4Operating profit -4.8 11.3
Finance income 10 29.2 41.2Finance expenses 11 -17.6 -11.5net finance income 11.7 29.7
Profit before extraordinary items 6.9 41.0
extraordinary items 12 3.6 11.7Profit before appropriations and taxes 10.5 52.7
appropriations 13 0.0 -income tax expenses 14 -0.8 1.2Profit for the period 9.7 53.9
PARENT COMPANY’S FINANCIAL STATEMENTS, FAS

116 Financial Statements 2010Outotec Oyj
BalanCe sHeet Of tHe PaRent COmPany
eUR million note Dec 31, 2010 Dec 31, 2009
ASSETS
Non-current assets 15
intangible assets 15.9 18.3Property, plant and equipment 1.7 1.9non-current financial assets 397.0 318.9Total non-current assets 414.6 339.0
Current assets
inventories 16 7.1 3.7non-current receivables 17 27.5 2.8current receivables 17 104.5 90.2cash and cash equivalents 133.3 173.2Total current assets 272.3 270.0
TOTAL ASSETS 687.0 609.0
EQUITY AND LIABILITIES
Shareholders' equity 18
share capital 17.2 16.8share premium fund 20.2 20.2treasury shares -4.6 -4.6Reserve for invested non-restricted equity 87.7 63.4Retained earnings 104.9 82.8Profit for the period 9.7 53.9Total shareholders' equity 235.2 232.5
Appropriations 13 0.3 0.4
Provisions 19 6.8 2.6
Liabilities 20
non-current liabilities 41.1 13.8current liabilities 403.6 359.7Total liabilities 444.7 373.5
TOTAL EQUITY AND LIABILITIES 687.0 609.0
PARENT COMPANY’S FINANCIAL STATEMENTS, FAS
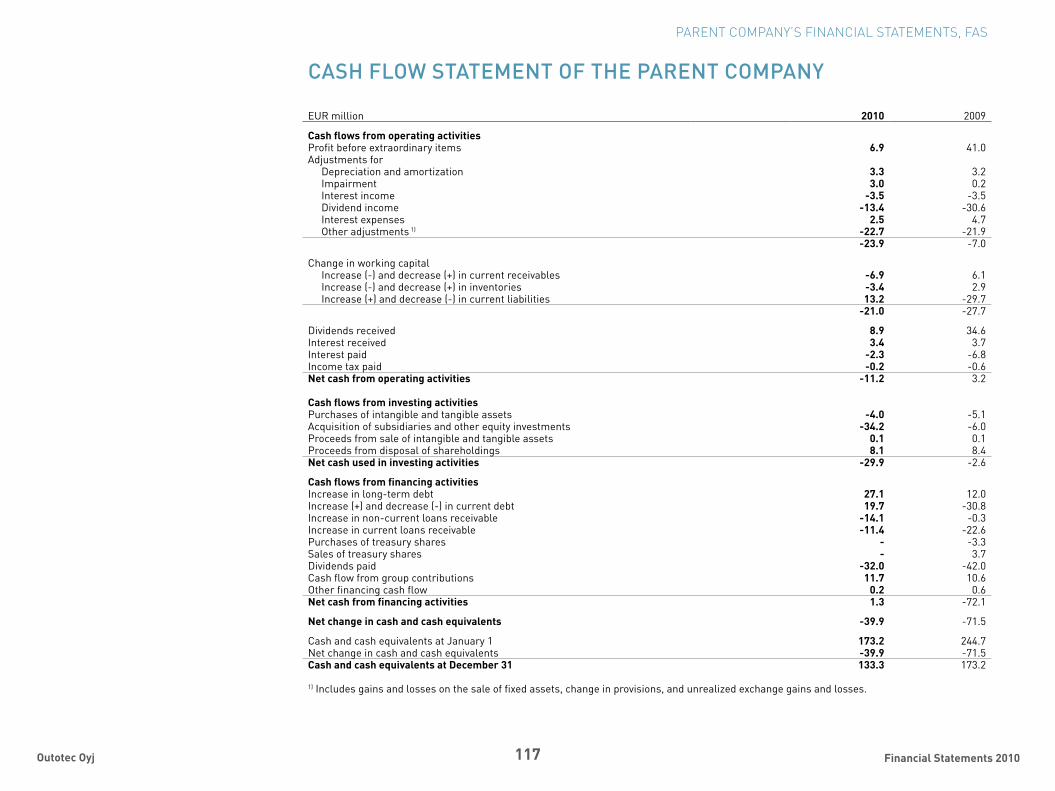
117 Financial Statements 2010Outotec Oyj
CasH flOw statement Of tHe PaRent COmPany
eUR million 2010 2009
Cash flows from operating activitiesProfit before extraordinary items 6.9 41.0adjustments for
Depreciation and amortization 3.3 3.2impairment 3.0 0.2interest income -3.5 -3.5Dividend income -13.4 -30.6interest expenses 2.5 4.7Other adjustments 1) -22.7 -21.9
-23.9 -7.0
change in working capital increase (-) and decrease (+) in current receivables -6.9 6.1increase (-) and decrease (+) in inventories -3.4 2.9increase (+) and decrease (-) in current liabilities 13.2 -29.7
-21.0 -27.7
Dividends received 8.9 34.6interest received 3.4 3.7interest paid -2.3 -6.8income tax paid -0.2 -0.6Net cash from operating activities -11.2 3.2
Cash flows from investing activitiesPurchases of intangible and tangible assets -4.0 -5.1acquisition of subsidiaries and other equity investments -34.2 -6.0Proceeds from sale of intangible and tangible assets 0.1 0.1Proceeds from disposal of shareholdings 8.1 8.4Net cash used in investing activities -29.9 -2.6
Cash flows from financing activitiesincrease in long-term debt 27.1 12.0increase (+) and decrease (-) in current debt 19.7 -30.8increase in non-current loans receivable -14.1 -0.3increase in current loans receivable -11.4 -22.6Purchases of treasury shares - -3.3sales of treasury shares - 3.7Dividends paid -32.0 -42.0cash flow from group contributions 11.7 10.6Other financing cash flow 0.2 0.6Net cash from financing activities 1.3 -72.1
Net change in cash and cash equivalents -39.9 -71.5
cash and cash equivalents at January 1 173.2 244.7net change in cash and cash equivalents -39.9 -71.5Cash and cash equivalents at December 31 133.3 173.2
1) includes gains and losses on the sale of fixed assets, change in provisions, and unrealized exchange gains and losses.
PARENT COMPANY’S FINANCIAL STATEMENTS, FAS
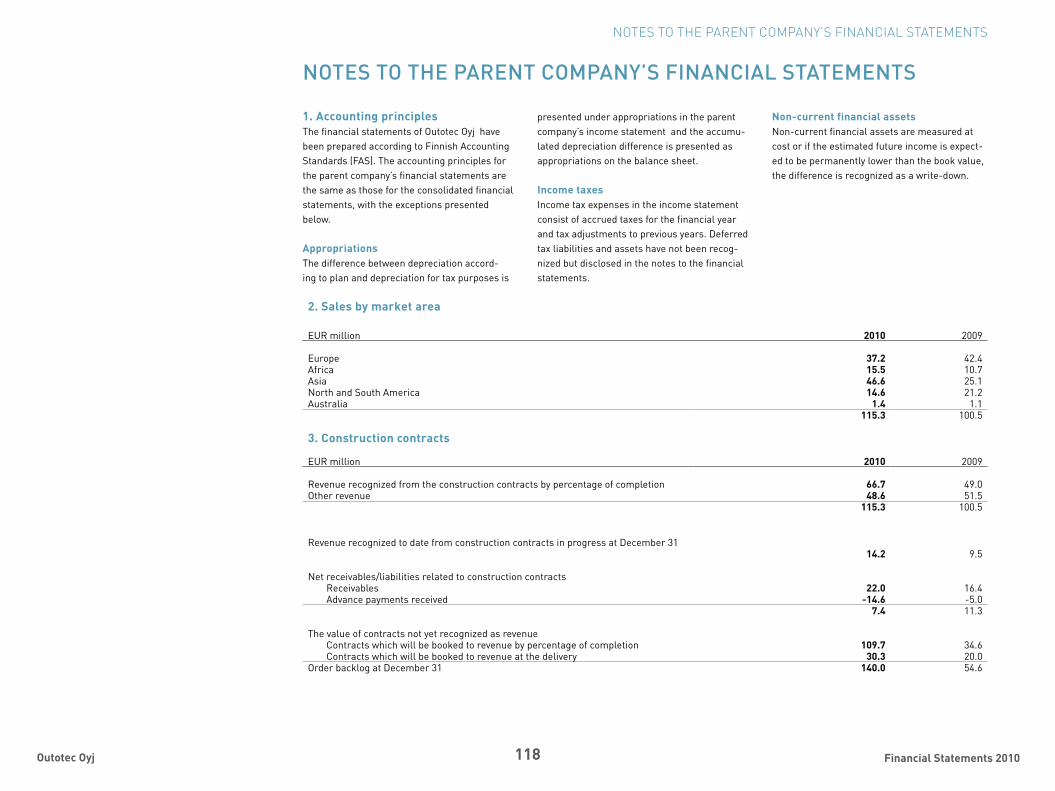
118 Financial Statements 2010Outotec Oyj
nOtes tO tHe PaRent COmPany’s finanCial statements
1. Accounting principlesthe financial statements of Outotec Oyj have been prepared according to Finnish accounting standards (Fas). the accounting principles for the parent company’s financial statements are the same as those for the consolidated financial statements, with the exceptions presented below.
Appropriationsthe difference between depreciation accord-ing to plan and depreciation for tax purposes is
2. Sales by market area
eUR million 2010 2009
europe 37.2 42.4africa 15.5 10.7asia 46.6 25.1north and south america 14.6 21.2australia 1.4 1.1
115.3 100.5
3. Construction contracts
eUR million 2010 2009
Revenue recognized from the construction contracts by percentage of completion 66.7 49.0Other revenue 48.6 51.5
115.3 100.5
Revenue recognized to date from construction contracts in progress at December 3114.2 9.5
net receivables/liabilities related to construction contracts Receivables 22.0 16.4 advance payments received -14.6 -5.0
7.4 11.3
the value of contracts not yet recognized as revenue contracts which will be booked to revenue by percentage of completion 109.7 34.6 contracts which will be booked to revenue at the delivery 30.3 20.0
Order backlog at December 31 140.0 54.6
NOTES TO THE PARENT COMPANY’S FINANCIAL STATEMENTS
presented under appropriations in the parent company’s income statement and the accumu-lated depreciation difference is presented as appropriations on the balance sheet.
Income taxesincome tax expenses in the income statement consist of accrued taxes for the financial year and tax adjustments to previous years. Deferred tax liabilities and assets have not been recog-nized but disclosed in the notes to the financial statements.
Non-current financial assetsnon-current financial assets are measured at cost or if the estimated future income is expect-ed to be permanently lower than the book value, the difference is recognized as a write-down.

119 Financial Statements 2010Outotec Oyj
4. Cost of sales
eUR million 2010 2009
merchandise and supplies -63.4 -40.3logistics expenses -1.5 -1.8employee benefit expenses -17.2 -17.2Rents and leases -2.7 -0.5Depreciation and amortization -0.1 -0.2change in inventories 3.4 -2.9services purchased -3.5 -6.9Other expenses -0.8 -1.5
-85.7 -71.4
5. Other operating income
eUR million 2010 2009
Gains on the sale of intangible and tangible assets and financial assets 26.6 24.4exchange gains of forward contracts 1.3 0.5
27.9 24.9
6. Personnel expenses
eUR million 2010 2009
Wages and salaries -27.1 -22.2Pension contributions -4.1 -5.0Other personnel expenses -1.4 -1.6
-32.7 -28.9
of which wages and salaries for key managementmembers of the Board of Directors -0.3 -0.3ceO, Deputy ceO and ceO’s substitute -0.7 -2.4Other members of executive committee -1.0 -1.6
-2.0 -4.3
as part of the share-based incentive plans, the executive Board did not receive Outotec shares from earnings period 2009 during 2010 (2009: 70,958 Outotec shares from earnings period 2008).
On may 21, 2010 Outotec’s board of directors determined a new share ownership plan directed to the members of Outotec executive board. Outotec’s board of directors granted to Outotec management Oy an interest-bearing loan at the maximum amount of eUR 5.0 million to finance the acquisition of the Outotec shares. the amount of the outstanding loan was eUR 4.1 million at December 31, 2010. there were no loans to key management at Decem-ber 31, 2009.
there are no special pension arrangements for key management, instead pension arrangements are according to normal legislation.
Number of personnel 2010 2009
average number of personnel for the period 410 429Personnel at December 31 401 427
7. Auditor fees
eUR million 2010 2009
KPmGauditing fees 0.1 0.1tax advising fees 0.1 0.1Other services 0.4 0.5
0.6 0.6
NOTES TO THE PARENT COMPANY’S FINANCIAL STATEMENTS
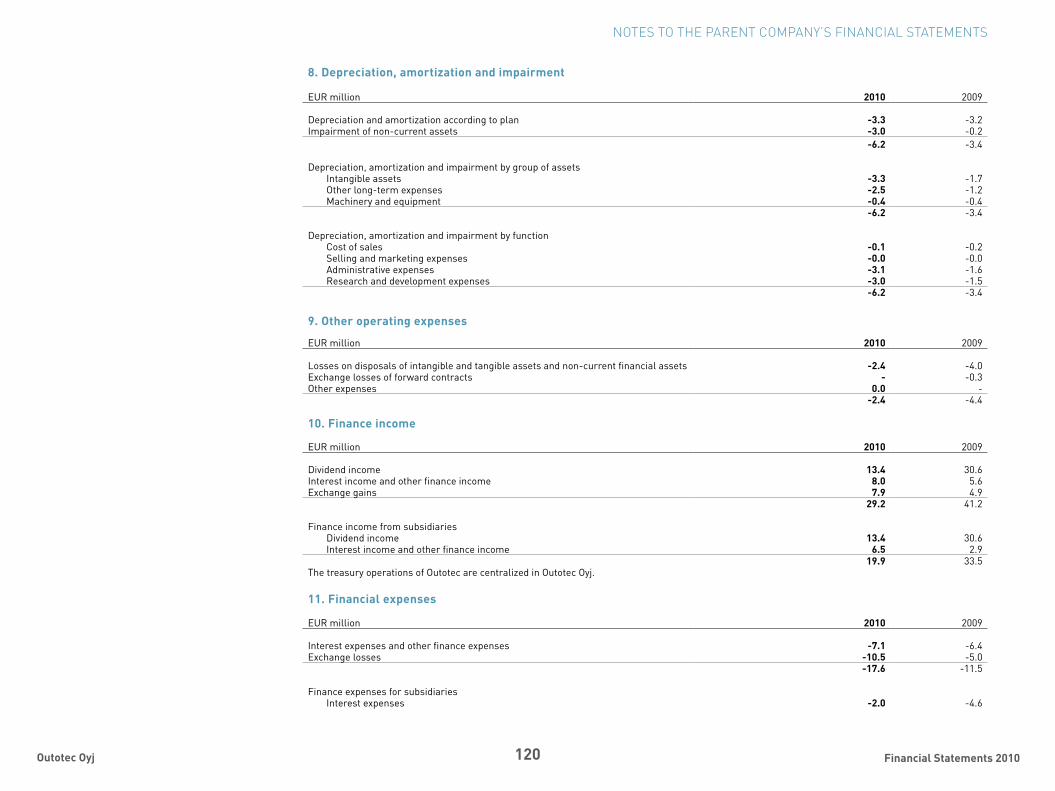
120 Financial Statements 2010Outotec Oyj
8. Depreciation, amortization and impairment
eUR million 2010 2009
Depreciation and amortization according to plan -3.3 -3.2impairment of non-current assets -3.0 -0.2
-6.2 -3.4
Depreciation, amortization and impairment by group of assets intangible assets -3.3 -1.7 Other long-term expenses -2.5 -1.2 machinery and equipment -0.4 -0.4
-6.2 -3.4
Depreciation, amortization and impairment by function cost of sales -0.1 -0.2 selling and marketing expenses -0.0 -0.0 administrative expenses -3.1 -1.6 Research and development expenses -3.0 -1.5
-6.2 -3.4
9. Other operating expenses
eUR million 2010 2009
losses on disposals of intangible and tangible assets and non-current financial assets -2.4 -4.0exchange losses of forward contracts - -0.3Other expenses 0.0 -
-2.4 -4.4
10. Finance income
eUR million 2010 2009
Dividend income 13.4 30.6interest income and other finance income 8.0 5.6exchange gains 7.9 4.9
29.2 41.2
Finance income from subsidiaries Dividend income 13.4 30.6 interest income and other finance income 6.5 2.9
19.9 33.5the treasury operations of Outotec are centralized in Outotec Oyj.
11. Financial expenses
eUR million 2010 2009
interest expenses and other finance expenses -7.1 -6.4exchange losses -10.5 -5.0
-17.6 -11.5
Finance expenses for subsidiaries interest expenses -2.0 -4.6
NOTES TO THE PARENT COMPANY’S FINANCIAL STATEMENTS
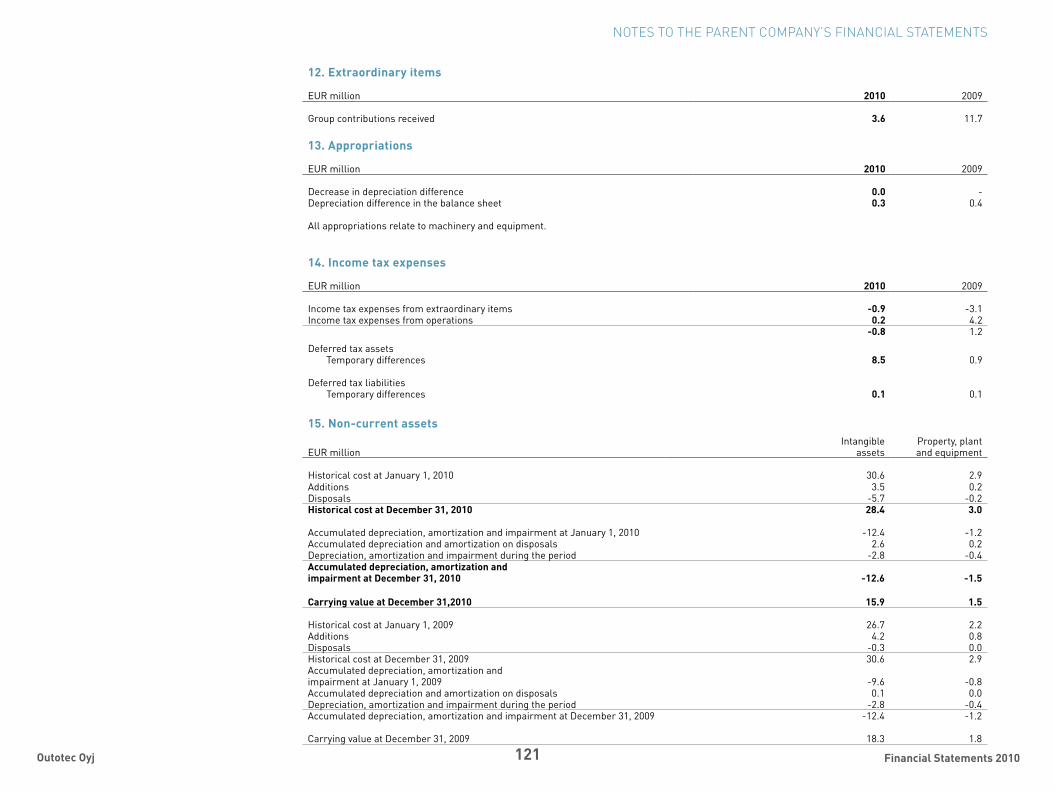
121 Financial Statements 2010Outotec Oyj
15. Non-current assets
eUR millionintangible
assetsProperty, plantand equipment
Historical cost at January 1, 2010 30.6 2.9additions 3.5 0.2Disposals -5.7 -0.2Historical cost at December 31, 2010 28.4 3.0
accumulated depreciation, amortization and impairment at January 1, 2010 -12.4 -1.2accumulated depreciation and amortization on disposals 2.6 0.2Depreciation, amortization and impairment during the period -2.8 -0.4Accumulated depreciation, amortization andimpairment at December 31, 2010 -12.6 -1.5
Carrying value at December 31,2010 15.9 1.5
Historical cost at January 1, 2009 26.7 2.2additions 4.2 0.8Disposals -0.3 0.0Historical cost at December 31, 2009 30.6 2.9accumulated depreciation, amortization andimpairment at January 1, 2009 -9.6 -0.8accumulated depreciation and amortization on disposals 0.1 0.0Depreciation, amortization and impairment during the period -2.8 -0.4accumulated depreciation, amortization and impairment at December 31, 2009 -12.4 -1.2
carrying value at December 31, 2009 18.3 1.8
12. Extraordinary items
eUR million 2010 2009
Group contributions received 3.6 11.7
13. Appropriations
eUR million 2010 2009
Decrease in depreciation difference 0.0 -Depreciation difference in the balance sheet 0.3 0.4
all appropriations relate to machinery and equipment.
14. Income tax expenses
eUR million 2010 2009
income tax expenses from extraordinary items -0.9 -3.1income tax expenses from operations 0.2 4.2
-0.8 1.2
Deferred tax assets temporary differences 8.5 0.9
Deferred tax liabilities temporary differences 0.1 0.1
NOTES TO THE PARENT COMPANY’S FINANCIAL STATEMENTS
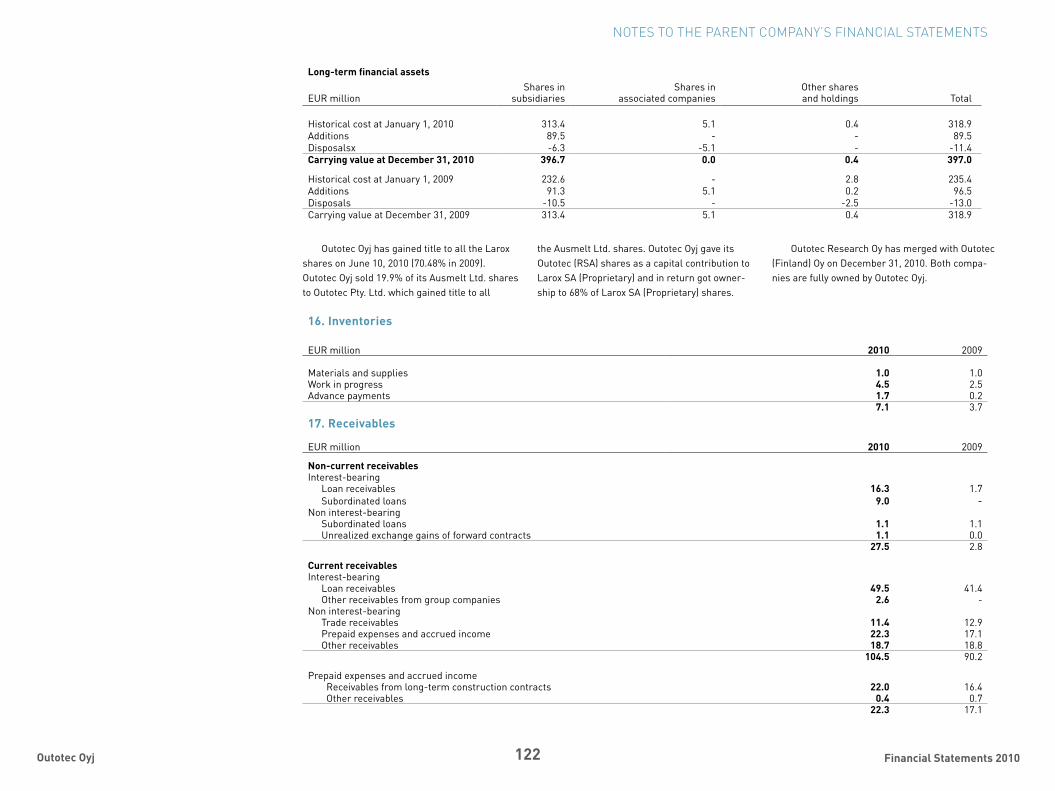
122 Financial Statements 2010Outotec Oyj
16. Inventories
eUR million 2010 2009
materials and supplies 1.0 1.0Work in progress 4.5 2.5advance payments 1.7 0.2
7.1 3.7
17. Receivables
eUR million 2010 2009
Non-current receivablesinterest-bearing
loan receivables 16.3 1.7subordinated loans 9.0 -
non interest-bearingsubordinated loans 1.1 1.1Unrealized exchange gains of forward contracts 1.1 0.0
27.5 2.8
Current receivablesinterest-bearing
loan receivables 49.5 41.4Other receivables from group companies 2.6 -
non interest-bearingtrade receivables 11.4 12.9Prepaid expenses and accrued income 22.3 17.1Other receivables 18.7 18.8
104.5 90.2
Prepaid expenses and accrued income Receivables from long-term construction contracts 22.0 16.4 Other receivables 0.4 0.7
22.3 17.1
NOTES TO THE PARENT COMPANY’S FINANCIAL STATEMENTS
Long-term financial assetsshares in
subsidiariesshares in
associated companiesOther shares and holdings totaleUR million
Historical cost at January 1, 2010 313.4 5.1 0.4 318.9additions 89.5 - - 89.5Disposalsx -6.3 -5.1 - -11.4Carrying value at December 31, 2010 396.7 0.0 0.4 397.0
Historical cost at January 1, 2009 232.6 - 2.8 235.4additions 91.3 5.1 0.2 96.5Disposals -10.5 - -2.5 -13.0carrying value at December 31, 2009 313.4 5.1 0.4 318.9
Outotec Oyj has gained title to all the larox shares on June 10, 2010 (70.48% in 2009). Outotec Oyj sold 19.9% of its ausmelt ltd. shares to Outotec Pty. ltd. which gained title to all
the ausmelt ltd. shares. Outotec Oyj gave its Outotec (Rsa) shares as a capital contribution to larox sa (Proprietary) and in return got owner-ship to 68% of larox sa (Proprietary) shares.
Outotec Research Oy has merged with Outotec (Finland) Oy on December 31, 2010. Both compa-nies are fully owned by Outotec Oyj.

123 Financial Statements 2010Outotec Oyj
eUR million 2010 2009
Receivables from subsidiaries
Non-current receivablesinterest-bearing
loan receivables 16.3 1.7 subordinated loans 9.0 -Current receivablesinterest-bearing
loan receivables 49.5 41.4Other receivables from group companies 2.6 -
non interest-bearingtrade receivables 6.1 4.6Prepaid expenses and accrued income 0.2 0.1Other receivables 10.1 14.7
93.8 62.5
18. Shareholders’ equity
eUR million 2010 2009
share capital 17.2 16.8share premium fund 20.2 20.2treasury shares -4.6 -4.6Reserve for invested non-restricted equity 87.7 63.4Retained earnings at January 1 136.7 127.0Dividend -32.0 -42.0change in value of treasury shares - -2.7Dividend related to treasury shares 0.2 0.6Profit for the period 9.7 53.9total shareholders' equity at December 31 235.2 232.5
Distributable funds Reserve for invested non-restricted equity 87.7 63.4Retained earnings 104.9 82.8Profit for the period 9.7 53.9Distributable funds at December 31 202.3 200.1
Outotec Oyj has entered into an agreement with a third-party service provider concerning the administration and hedging of a share-based incentive program for key personnel. as part of this agreement, for hedging the underlying cash flow risk, the service provider has purchased 500,000 Outotec shares during 2008-2009 that have been funded by Outotec Oyj and accounted for as treasury shares on the balance sheet.
Outotec completed acquisition of control in larox through directed share issue at Decem-ber 21, 2009 and made a mandatory public tender offer for the remaining larox shares. On January 27, 2010 Outotec announced the final result of the tender offer, according to which the larox shares in Outotec ownership represented approximately 98.5% of all the larox shares. On June 10, 2010 Outotec Oyj gained title to all the
larox shares. most of the consideration for the larox shares purchased was paid in the form of 3,780,373 (2009: 2,763,419) new Outotec shares which totalled to eUR 88.1 million (2009: eUR 63.4 million). eUR 0.4 million of these new Outo-tec shares are reported under share capital and eUR 87.7 million under the reserve for invested non-restricted equity.
NOTES TO THE PARENT COMPANY’S FINANCIAL STATEMENTS
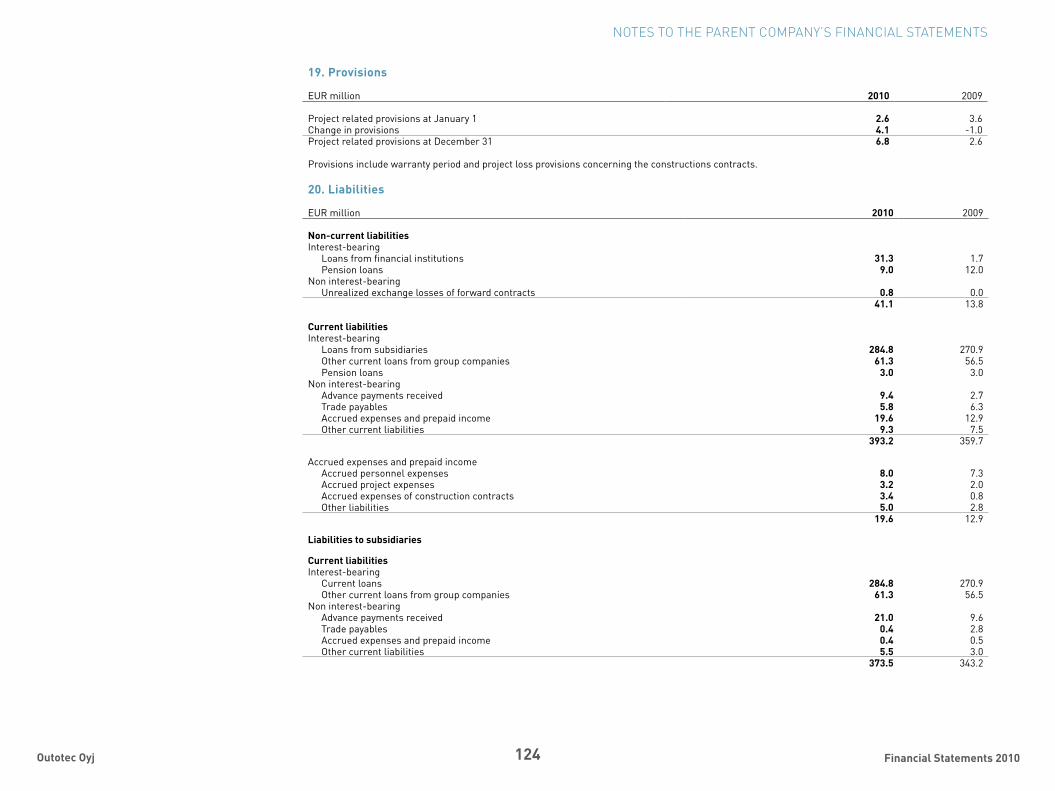
124 Financial Statements 2010Outotec Oyj
20. Liabilities
eUR million 2010 2009
Non-current liabilitiesinterest-bearing
loans from financial institutions 31.3 1.7Pension loans 9.0 12.0
non interest-bearingUnrealized exchange losses of forward contracts 0.8 0.0
41.1 13.8
Current liabilitiesinterest-bearing
loans from subsidiaries 284.8 270.9Other current loans from group companies 61.3 56.5Pension loans 3.0 3.0
non interest-bearingadvance payments received 9.4 2.7trade payables 5.8 6.3accrued expenses and prepaid income 19.6 12.9Other current liabilities 9.3 7.5
393.2 359.7
accrued expenses and prepaid incomeaccrued personnel expenses 8.0 7.3accrued project expenses 3.2 2.0accrued expenses of construction contracts 3.4 0.8Other liabilities 5.0 2.8
19.6 12.9
Liabilities to subsidiaries
Current liabilitiesinterest-bearing
current loans 284.8 270.9Other current loans from group companies 61.3 56.5
non interest-bearingadvance payments received 21.0 9.6trade payables 0.4 2.8accrued expenses and prepaid income 0.4 0.5Other current liabilities 5.5 3.0
373.5 343.2
NOTES TO THE PARENT COMPANY’S FINANCIAL STATEMENTS
19. Provisions
eUR million 2010 2009
Project related provisions at January 1 2.6 3.6change in provisions 4.1 -1.0Project related provisions at December 31 6.8 2.6
Provisions include warranty period and project loss provisions concerning the constructions contracts.

125 Financial Statements 2010Outotec Oyj
21. Commitments
eUR million 2010 2009
Guarantees On behalf of subsidiaries
For financing 24.5 26.6 For other commitments 260.0 265.3
On behalf of own commercial commitments 15.3 31.8(excluding advance payment guarantees)
NOTES TO THE PARENT COMPANY’S FINANCIAL STATEMENTS
the total value of commercial guarantees issued by the parent company on behalf of subsidiaries includes advance payment guarantees of eUR
92.9 million (at December 31, 2009: eUR 87.6 million).
the total amount of guarantees for com-
mercial commitments including advance pay-ment guarantees issued by the parent company amounted to eUR 297.7 million (at December 31, 2009: eUR 303.5 million).
Minimum future lease payments on operating leases not later than 1 year 0.6 0.5later than 1 year 0.5 0.5
Other financial commitmentslong-term rental agreements
termination year 2012 2.5 2.4 termination year 2017 25.4 29.1
22. Derivative instruments
eUR million 2010 2009
net fair valuescontracts made with financial institutions 2.4 -0.3contracts made with subsidiaries -3.5 -0.1
-1.1 -0.4nominal valuescontracts made with financial institutions 283.7 200.8contracts made with subsidiaries 203.4 133.7
487.1 334.4
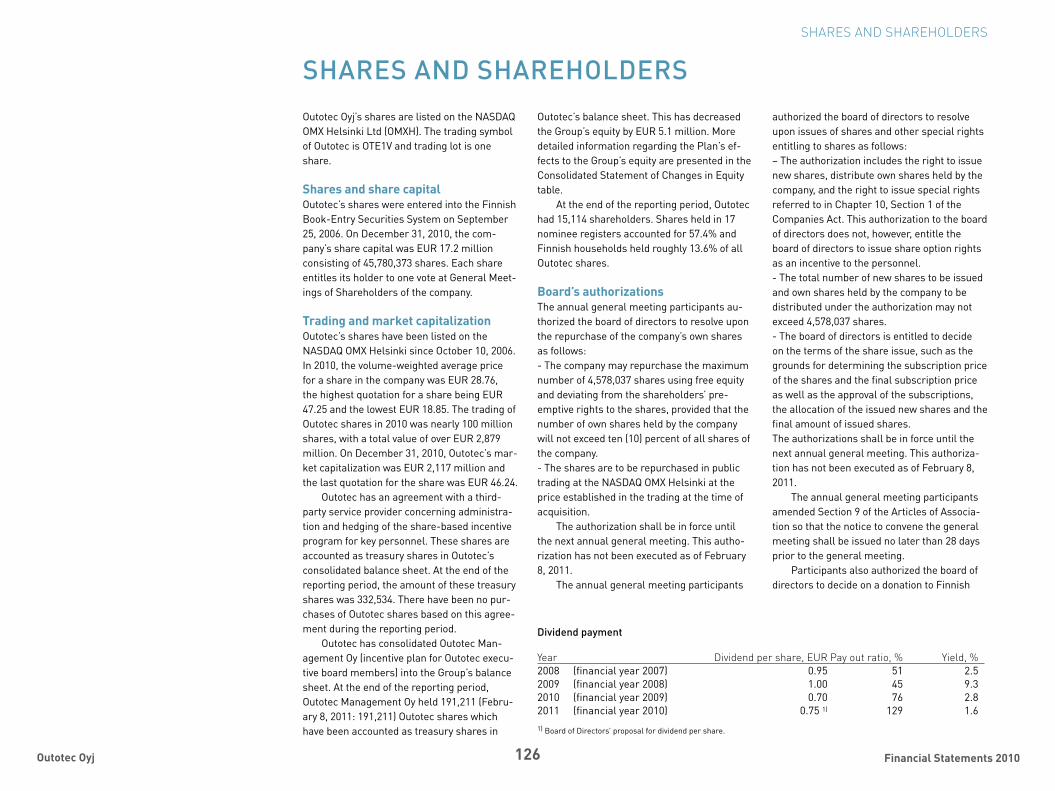
126 Financial Statements 2010Outotec Oyj
Outotec Oyj’s shares are listed on the nasDaQ OmX Helsinki ltd (OmXH). the trading symbol of Outotec is Ote1V and trading lot is one share.
Shares and share capitalOutotec’s shares were entered into the Finnish Book-entry securities system on september 25, 2006. On December 31, 2010, the com-pany’s share capital was eUR 17.2 million consisting of 45,780,373 shares. each share entitles its holder to one vote at General meet-ings of shareholders of the company.
Trading and market capitalizationOutotec’s shares have been listed on the nasDaQ OmX Helsinki since October 10, 2006. in 2010, the volume-weighted average price for a share in the company was eUR 28.76, the highest quotation for a share being eUR 47.25 and the lowest eUR 18.85. the trading of Outotec shares in 2010 was nearly 100 million shares, with a total value of over eUR 2,879 million. On December 31, 2010, Outotec’s mar-ket capitalization was eUR 2,117 million and the last quotation for the share was eUR 46.24.
Outotec has an agreement with a third-party service provider concerning administra-tion and hedging of the share-based incentive program for key personnel. these shares are accounted as treasury shares in Outotec’s consolidated balance sheet. at the end of the reporting period, the amount of these treasury shares was 332,534. there have been no pur-chases of Outotec shares based on this agree-ment during the reporting period.
Outotec has consolidated Outotec man-agement Oy (incentive plan for Outotec execu-tive board members) into the Group’s balance sheet. at the end of the reporting period, Outotec management Oy held 191,211 (Febru-ary 8, 2011: 191,211) Outotec shares which have been accounted as treasury shares in
sHaRes and sHaReHOldeRsOutotec’s balance sheet. this has decreased the Group’s equity by eUR 5.1 million. more detailed information regarding the Plan’s ef-fects to the Group’s equity are presented in the consolidated statement of changes in equity table.
at the end of the reporting period, Outotec had 15,114 shareholders. shares held in 17 nominee registers accounted for 57.4% and Finnish households held roughly 13.6% of all Outotec shares.
Board’s authorizationsthe annual general meeting participants au-thorized the board of directors to resolve upon the repurchase of the company’s own shares as follows: - the company may repurchase the maximum number of 4,578,037 shares using free equity and deviating from the shareholders’ pre-emptive rights to the shares, provided that the number of own shares held by the company will not exceed ten (10) percent of all shares of the company.- the shares are to be repurchased in public trading at the nasDaQ OmX Helsinki at the price established in the trading at the time of acquisition.
the authorization shall be in force until the next annual general meeting. this autho-rization has not been executed as of February 8, 2011.
the annual general meeting participants
authorized the board of directors to resolve upon issues of shares and other special rights entitling to shares as follows:– the authorization includes the right to issue new shares, distribute own shares held by the company, and the right to issue special rights referred to in chapter 10, section 1 of the companies act. this authorization to the board of directors does not, however, entitle the board of directors to issue share option rights as an incentive to the personnel.- the total number of new shares to be issued and own shares held by the company to be distributed under the authorization may not exceed 4,578,037 shares.- the board of directors is entitled to decide on the terms of the share issue, such as the grounds for determining the subscription price of the shares and the final subscription price as well as the approval of the subscriptions, the allocation of the issued new shares and the final amount of issued shares.the authorizations shall be in force until the next annual general meeting. this authoriza-tion has not been executed as of February 8, 2011.
the annual general meeting participants amended section 9 of the articles of associa-tion so that the notice to convene the general meeting shall be issued no later than 28 days prior to the general meeting.
Participants also authorized the board of directors to decide on a donation to Finnish
dividend payment
Year Dividend per share, EuR Pay out ratio, % Yield, %2008 (financial year 2007) 0.95 51 2.52009 (financial year 2008) 1.00 45 9.32010 (financial year 2009) 0.70 76 2.82011 (financial year 2010) 0.75 1) 129 1.6 1) Board of Directors’ proposal for dividend per share.
SHARES AND SHAREHOLDERS

127 Financial Statements 2010Outotec Oyj
Universities of its choice from the distributable assets of the company. The amount is not to exceed EUR 600,000. Based on this autho-rization in November Outotec donated EUR 300,000 to Aalto University Foundation, EUR 150,000 to University of Oulu, EUR 100,000 to Lappeenranta University of Technology and EUR 50,000 to Åbo Akademi University.
Board and management shareholdingThe total share holding of the Board of Direc-tors, CEO and Executive Board at the end of 2010 was 264,325 shares, including shares owned through Outotec Management Oy (191,211 shares). More details of the individual shareholdings can be found on the company’s website at www.outotec.com/cg.
Dividend policyThe Board of Directors adopted a dividend policy in November 2010 whereby the company aims to propose for the approval of the com-
shares and shareholders
pany’s shareholders dividends representing at least 40% of the annual net income of Outotec for the preceding financial year.
The amount of future dividends, if any, will be subject to Outotec’s future earnings, finan-cial, condition, cash flows, and working capital requirements. In addition, investments in either organic growth or acquisitions as part of Outotec’s growth strategy may impact the level of future dividends. Although the Board of Di-rectors has no reason to believe that dividend payments under this policy will not generally be made, there can be no assurance that any annual dividend will actually be paid, nor can there be any assurance as to the amount to be paid in any given year.
Board of directors proposal for profit distribution The Board of Directors of Outotec proposes to the Annual General Meeting that a dividend of EUR 0.75 per share be paid from Outotec Oyj´s
distributable funds for December 31, 2010, and that any remaining distributable funds be allocated to retained earnings. The suggested dividend record date is March 25, 2011, with the dividend to be paid on April 8, 2011. According to the financial statement for December 31, 2010, the parent company dis-tributable funds total EUR 202.3 million. The proposed dividend corresponds to 129% of the Group´s profit for the financial year 2010.There have been no substantial changes in the financial position of the company after the balance sheet date. According to the Board of Directors, the liquidity of the company is good and the proposed profit sharing will not affect the solvency of the company.
Share-related key figureS2010 2009
Earnings per share EUR 0.59 1.01Equity per share EUR 7.87 7.09Dividend per share EUR 0.751) 0.70 Dividend payout ratio % 128.8 75.7Dividend yield % 1.6 2.8Price/earnings ratio 78.6 24.5Development of share price
Average trading price EUR 28.76 17.39Lowest trading price EUR 18.85 9.30Highest trading price EUR 47.25 24.87Trading price at the end of period EUR 46.24 24.74
Market capitalization at the end of period EUR million 2,116.9 1,107.4Development in trading volume
Trading volume 1 000 shares 99,942 106,506In relation to weighted averagenumber of shares % 220.3 254.5
Adjusted average number of shares 45,356,862 41,843,793Number of shares at the end of period 2) 45,332,738 44,435,787
1) The Board of Directors’ proposal to the Annual General Meeting on March 22, 2011 2) Number of registered shares at December 31, 2010 was 45,780,373 (at December 31, 2009: 44,763,419).

128 Financial Statements 2010Outotec Oyj
SHARES AND SHAREHOLDERS
Share price performance and trading volume
eUR Share/1,000 pcs
Outotec Oyj, OTE1VOMX Helsinki Industrials Price Index
10/06 *) 2007 2008 2009 2010
distRiButiOn Of sHaReHOldings On deCemBeR 31, 2010
average sharehold-ing, no of shares
number of shareholders
% of shareholders
number of shares
% of share capitalnumber of shares
1 – 100 6,219 41.15 390,272 0.85 63101 - 500 6,361 42.09 1,661,549 3.63 261501 - 1 000 1,382 9.14 1,083,966 2.37 7841001 - 5 000 911 6.03 1,930,040 4.22 2,1195 001 - 10 000 108 0.72 811,746 1.77 7,51610 001 - 50 000 82 0.54 1,875,438 4.10 22,87150 001 - 100 000 14 0.09 1,050,382 2.29 75,027100 001 - 500 000 31 0.21 6,179,796 13.50 199,348500 001 - 6 0.04 30,797,184 67.27 5,132,864nominee registered shares 17 26,297,308 57.44 1,546,900total 15,114 100.00 45,780,373
0
2,000
4,000
6,000
8,000
10,000
0
15
30
45
60
Trading volume
*) Initial public offering on October 10, 2006. Trading volume was 56,076,374 during week 41.

129 Financial Statements 2010Outotec Oyj
sHaReHOldeRs By gROuP On deCemBeR 31, 2010number of
shareholders% of
shareholders number
of shares% of
share capitalshareholder group
Finnish corporations 872 5.77 1,901,888 4.15Finance and insurance institutions 74 0.49 3,431,037 7.50Public sector and public organizations 22 0.15 5,652,673 12.35Households 13,855 91.67 6,294,779 13.75non-profit organizations 194 1.28 1,126,429 2.46Foreign owners 97 0.64 1,076,259 2.35total 15,114 100.00 19,483,065 42.56nominee registered shares 26,297,308 57.44total 45,780,373 100.00
laRgest sHaReHOldeRs On deCemBeR 31, 2010number of shares % name
ilmarinen mutual Pension insurance company 2,628,343 5.74Varma mutual Pension insurance company 1,674,173 3.66the state Pension Fund 624,666 1.36OP-Delta Fund 430,000 0.94evli alexander management Oy 332,534 0.73Päivi Karoliina Kupias 312,461 0.68capillary Oy 294,091 0.64Veritas Pension insurance company ltd 285,000 0.62timo Vartiainen 280,499 0.61Katariina aaltonen 279,292 0.61total 7,141,059 15.60
SHARES AND SHAREHOLDERS

130 Financial Statements 2010Outotec Oyj
auditORs’ RePORtTo the Annual General Meeting of Outotec OyjWe have audited the accounting records, the financial statements, the report of the Board of Directors, and the administration of Outotec Oyj for the year ended December 31, 2010. the financial statements comprise the consolidated statement of financial position, statement of comprehensive income, state-ment of changes in equity, statement of cash flows, and notes to the consolidated financial statements, as well as the parent company’s balance sheet, income statement, cash flow statement and notes to the financial state-ments.
Responsibility of the Board of Direc-tors and the President and CEOthe Board of Directors and the President and ceO are responsible for the prepara-tion of consolidated financial statements that give a true and fair view in accordance with international Financial Reporting standards (iFRs) as adopted by the eU, as well as for the preparation of financial statements and the report of the Board of Directors that give a true and fair view in accordance with the laws and regulations governing the preparation of the financial statements and the report of the Board of Directors in Finland. the Board of Directors is responsible for the appropriate arrangement of the control of the company’s accounts and finances, and the President and ceO shall see to it that the accounts of the company are in compliance with the law and that its financial affairs have been arranged in a reliable manner.
Auditors’ ResponsibilityOur responsibility is to express an opinion on the financial statements, on the consolidated financial statements and on the report of the Board of Directors based on our audit. the
auditing act requires that we comply with the requirements of professional ethics. We conducted our audit in accordance with good auditing practice in Finland. Good auditing practice requires that we plan and perform the audit to obtain reasonable assurance about whether the financial statements and the report of the Board of Directors are free from material misstatement, and whether the members of the Board of Directors of the parent company and the President and ceO are guilty of an act or negligence which may result in liability in damages towards the company or have violated the limited liability companies act or the articles of association of the company.
an audit involves performing procedures to obtain audit evidence about the amounts and disclosures in the financial statements and the report of the Board of Directors. the procedures selected depend on the audi-tor’s judgment, including the assessment of the risks of material misstatement, whether due to fraud or error. in making those risk assessments, the auditor considers internal control relevant to the entity’s preparation of financial statements and report of the Board of Directors that give a true and fair view in order to design audit procedures that are appropriate in the circumstances, but not for the purpose of expressing an opinion on the effectiveness of the company’s internal con-trol. an audit also includes evaluating the ap-propriateness of accounting policies used and the reasonableness of accounting estimates made by management, as well as evaluat-ing the overall presentation of the financial statements and the report of the Board of Directors.
We believe that the audit evidence we have obtained is sufficient and appropriate to provide a basis for our audit opinion.
Opinion on the consolidated financial statementsin our opinion, the consolidated financial statements give a true and fair view of the financial position, financial performance, and cash flows of the group in accordance with international Financial Reporting standards (iFRs) as adopted by the eU.
Opinion on the company’s financial statements and the report of the Board of Directorsin our opinion, the financial statements and the report of the Board of Directors give a true and fair view of both the consolidated and the parent company’s financial perfor-mance and financial position in accordance with the laws and regulations governing the preparation of the financial statements and the report of the Board of Directors in Finland. the information in the report of the Board of Directors is consistent with the in-formation in the financial statements.
espoo, February 18, 2011
KPmG OY aB
mauri Palviauthorized Public accountant
AuDITORS’ REPORT

131 Financial Statements 2010Outotec Oyj
BO
aRD
OF D
iRectO
Rs
Carl-Gustaf BergströmChairman of the Board of directorsB.sc. (econ.)b. 1945, finnish citizen
Board member since 2006Chairman of the Human Capital Committee
member of the Board of directors of dacke PmC Holding aB, förlags aB sydvästkusten and gunnebo industrier aBshareholding: 1 000 Outotec sharesindependent of the company and owner
Karri Kaituevice Chairman of the Board of directorsll.lic.b. 1964, finnish citizen
Board member since 2006member of the Human Capital Committee
deputy CeO of Outokumpu OyjChairman of the Board of direc-tors of destia ltd,member of the Board of directors of Cargotec Corporationno Outotec shareholdingindependent of the company and owner
Tapani Järvinenm.sc. (eng.), lic.sc. (tech.)b. 1946, finnish citizen
Board member since 2010member of the Human Capital Committee
President and CeO of Outotec 2003-2009member of the Board of direc-tors of talvivaara mining Plc, Konecranes Oyj, Okmetic Oyj, normet Oy, dragon mining nl, Chairman of the Board of direc-tors of finnish-latin american trade association, laatukeskus excellence finland Oy, industry Council and technology academy of finland and Cleantech finland Business forumshareholding: 30,684 Outotec sharesnot independent of the company and owner
Anssi Soilam.sc. (eng.), B.sc. (econ.)b. 1949, finnish citizen
Board member since 2006 member of the audit Committee
vice Chairman of the Board of directors of Outokumpu Oyj, member of the Board of directors of attendo Holding aB, dna ltd, normet group ltd and lindström Oyshareholding: 3,200 Outotec sharesindependent of the company and owner
Eija Ailasmaa m. Pol. sc, graduate of the sanoma school of Journalismb. 1950, finnish citizen
Board member since 2010member of the audit Committee
CeO of sanoma magazines B.vvice Chairman of the Board of directors of solidium Oy, mem-ber of the Board of directors of Huhtamäki Oyjno shareholdingindependent of the company and owner
Hannu LinnoinenB.sc. (econ.), ll.m.b. 1957, finnish citizen
Board member since 2006Chairman of the audit Committee
senior executive vice President and Chief financial Officer of sRv group PlcChairman of the Board of direc-tors of greenstream network Plc,member of the Board of directors of garantia insurance Company ltdshareholding: 4,100 Outotec sharesindependent of the company and owner
131 Financial Statements 2010Outotec Oyj

132 Financial Statements 2010Outotec Oyj
Pertti KorhonenPresident and CeOChairman of the executive Boardm. sc. (electronics engineering)b. 1961, finnish citizen
member of the executive Board since 2009employed by Outotec since 2009shareholding: 3,000 Outotec shares*)Positions of trust:member of the Board of Ra-utaruukki Oyj, elisa Oyj and veho group Oy, member of the finnish Council ofinternational Chamber of Com-merce, member of the Council of association of finnish steel and metal Producers, member of the advisory Board of finnish defense forces
Kalle HärkkiPresident, services business areaPh. d. (tech.)b. 1969, finnish citizen
Responsibilities: services busi-nessmember since 2010employed by Outotec since 2006employed by Outokumpu group 1998–2006shareholding: 333 Outotec shares*)
Peter WeberPresident, energy, light metals and environmental solutions business areaPh.d. (tech.)b. 1963, german citizen
Responsibilities: energy, light metals and environmental solu-tions businessmember since 2006employed by Outotec since 2006employed by Outokumpu group 1992-2006shareholding: 12,300 Outotec shares*)Positions of trust:member of the Board of directors of enefit Outotec technology Oü
Michael Freisenior vice President, supplyPh. d. (tech.)b. 1968, swiss citizen
Responsibilities: supply, including sourcing, manufacturing and sup-ply chainmember since 2010employed by Outotec since 2010shareholding*)
Tapio Niskanensenior vice President, Business infrastructure m. sc. (engineering)b. 1959, finnish citizen
Responsibilities: Business infra-structuremember since 2010employed by Outotec since 2010shareholding: 10 Outotec shares*)
Ari Jokilaaksosenior vice President, Human CapitalPh.d. (tech.)b. 1961, finnish citizen
Responsibilities: Human Capitalmember since 2010employed by Outotec since 2006employed by Outokumpu group 1998-2006shareholding*)
eXecU
tiVe BO
aRD
members of Outotec executive and management Committee 1 January – 31 march 2010 were:
Pertti Korhonen, vesa-Pekka takala, martti Haario, Kalle Härkki, ari Jokilaakso, markku Jortikka,
Kari Knuutila, Outi lampela, Harry linnarinne, Jari Rosendal, and Peter weber.
more detailed information about the executive Board members is available at www.outotec.com/cg
132 Financial Statements 2010Outotec Oyj

133 Financial Statements 2010Outotec Oyj
Mika SaariahoChief strategy Officer, strategyPh. d. (tech.)b. 1973, finnish citizen
Responsibilities: corporate development, strategy process, mergers & acquisitions, integration processesmember since 2010employed by Outotec since 2010employed by Outokumpu group 2004–2007shareholding*)
Jari RosendalPresident, non-ferrous solutions busi-ness aream. sc. (eng.)b. 1965, finnish citizen
Responsibilities: non-ferrous businessmember since 2006employed by Outotec since 2006employed by Outokumpu group 1989-2006shareholding: 12,009 Outotec shares*)
Pekka ErkkiläPresident, ferrous solutions business aream. sc. (eng.)b. 1958, finnish citizen
Responsibilities: ferrous solutions businessmember since 2010employed by Outotec since 2010employed by Outokumpu group 1983–2000 and 2004–2010shareholding: 2,000 Outotec shares*)Positions of trust:member of the Board of directors of uni-versity of Oulu and grängesberg iron aB,
Mikko PuolakkaChief financial Officerm.sc. (econ.)b. 1969, finnish citizen
Responsibilities: financial and business control, tax management, financing and treasury, investor relations, communica-tions, internal audit, risk managementmember since 2010employed by Outotec since 2010shareholding *)Positions of trust:member of the Board of gold gemex Oy
Martti Haarioexecutive vice President, market Operationsm.sc. (Chem.)b. 1954, finnish citizen
Responsibilities: marketing develop-ment and management of the global sales organisationmember since 2010employed by Outotec since 2006employed by Outokumpu group 1987-2006shareholding: 4,478 Outotec shares*)
eXecU
tiVe BO
aRD
*) members of the executive Board are shareholders of Outotec management Oy which owns
191 211 shares of Outotec Oyj (december 31, 2010). more info at www.outotec.com/cg
133 Financial Statements 2010Outotec Oyj

134 Financial Statements 2010Outotec Oyj
Outotec’s corporate Governance statement has been given separately from the finan-cial statements and report and it is available on Outotec’s website. in addition, Outotec’s corporate Governance Policy in its entirety is published and maintained on Outotec’s web-site at www.outotec.com/cg.
Board of directors and committeesthe annual General meeting of Outotec on march 18, 2010, elected the following mem-bers: carl-Gustaf Bergström (chairman), Karri Kaitue (Vice chairman), Hannu linnoi-nen (chairman of the audit committee), eija ailasmaa and anssi soila. in 2010, the Board of Directors met 14 times. the average at-tendance of members at Board meetings was 100%. the fees paid to the Board of Directors in 2010 totaled eUR 288,000.
Audit Committeethe members of the audit committee are: Hannu linnoinen (chairman), eija ailasmaa and anssi soila. in 2010, the audit commit-tee assembled 4 times and all members were present.
Human Capital Committeethe Board of directors established a Hu-man capital committee in november and elected carl-Gustaf Bergström, chairman of the Board, as chairman of the committee. Other members are Karri Kaitue and tapani Järvinen. more information regarding the committee’s can be found on page 50.
Dividend for the financial year 2009the annual General meeting on march 18, 2010 decided that a dividend of eUR 0.70 per share will be paid from the financial year that ended December 31, 2009. the dividend (total of eUR 32.0 million) was paid on april 8, 2010.
Authorizationsthe Board of Directors of Outotec used the authorization made by the annual General
CORPORate gOveRnanCe in 2010
meeting on march 18, 2010 and donated 600,000 euros to Finnish universities.
the Board of Directors of Outotec used the issuance of shares authorization, made by the annual General meeting on march 18, 2009, in conjunction with the acquisition of larox. a total of 3,780,373 new shares were issued (2,763,419 shares in December 2009 and 1,016,954 shares in February 2010).
President and CEOthe President and ceO of Outotec Oyj is Pertti Korhonen (b. 1961). mr Korhonen started at Outotec on september 1, 2009, acted as cOO from October 1, 2009 and assumed the ceO duties on January 1, 2010.
Further information regarding the Presi-dent and ceO and Board of Directors can be found at www.outotec.com/cg.
fees paid to the Board of directors in 2010 eUR ailasmaa eija 32,000Bergström carl-Gustaf 59,500Järvinen tapani 31,000Kaitue Karri 53,000linnoinen Hannu 54,500soila anssi 42,000Virrankoski Risto 16,000total 288,000
Remuneration paid to the CeO and executive Board members (incl. CeO’s substitute) in 2010 share-basedeUR Wages Benefits Bonuses benefits totalceO 467,947 17,140 12,852 2,044 499,984Other executive Board*) 1,546,865 91,915 133,264 9,117 1,781,162*) executive Board as of 1 april 2010 on pages 132-133
CORPORATE gOVERNANCE IN 2010
Board member participation in 2010 Board meeting audit CommitteeBergström carl-Gustaf, chairman*) 14/14 1/1Kaitue Karri, vice chairman 14/14ailasmaa eija 11/11 3/3linnoinen Hannu 14/14 4/4Järvinen tapani 11/11soila anssi 14/14 3/3Virrankoski Risto**) 3/3*) chairman of the Board of Directors as of 18.3.2010, member of the audit committee until 18.3.2010**) chairman of the Board of Directors until 18.3.2010

135 Financial Statements 2010Outotec Oyj
CORPORATE gOVERNANCE IN 2010
Management incentive programsShare-based Incentive Program 2008-2010no shares were allocated for the 2009 earnings period. the board of directors also decided not to select individuals or earning criteria for the 2010 earning period since the incentive Pro-gram 2010-2012 replaced the old program.
Share-based Incentive Program 2010-2012Outotec’s board of directors decided to adopt a new share-based incentive program for the company’s key personnel. the program has three earning periods: calendar years 2010, 2011 and 2012. the board determines the amount of the maximum reward for each individual, the earning criteria and the targets established for them separately on an annual basis.
the board approved 71 individuals in the scope of the incentive Program 2010-2012 for the 2010 earning period, which began on January 1, 2010. the reward is based on the achievement of the targets set for cost sav-ings, order intake and earnings per share. the reward will be paid in 2011 in the com-pany’s shares and as a cash payment which equals income taxes. the individual must hold the earned shares for at least two years
following the end of the earning period. if the individual’s employment ends during this engagement period, (s)he has to return all or part of the earned shares to the company without compensation.
the maximum total reward for the 2010 earning period of the incentive Program 2010-2012 is equal to the value of 361,750 Outotec shares, and the maximum value of the rewards of the entire incentive Program 2010-2012 is equal to approximately 1,000,000 shares, in-cluding the cash payment.
Executive Board share ownership planOn may 21, 2010 Outotec’s board of direc-tors determined a new share ownership plan directed to the members of the Outotec execu-tive board. as part of the plan, the executive board members established Outotec manage-ment Oy company, whose entire share capital is owned by them. the purpose of the plan is to commit executive board members to Outotec by encouraging them to acquire and hold Outo-tec shares and thus increase the company’s shareholder value in the long run. they invest a considerable amount of their own funds in company shares and partly through a loan pro-vided by Outotec. the company’s board of di-
rectors granted to Outotec management Oy an interest-bearing loan at the maximum amount of eUR 4,980,000 to finance the acquisition of the Outotec shares. the members of the executive board members hold approximately 0.34% of Outotec shares through the company.
Outotec has consolidated Outotec manage-ment Oy into the Group’s financial statements. at the end of 2010, Outotec management Oy held 191,211 Outotec shares which have been accounted as treasury shares in Outotec’s bal-ance sheet. this has decreased the Group’s equity by eUR 5.1 million. more detailed information regarding the plan’s effects to the Group’s equity are presented in the consolidat-ed statement of changes in equity table.
AuditKPmG Oy ab, authorized public accountants, was re-elected as the company’s auditor, with mauri Palvi as auditor-in-charge. in 2010, the company paid a fee of eUR 997,000 (2009: 630,000) for the auditing services. addition-ally, the company paid eUR 461,000 (2009: 596,000) for non-auditing related consulta-tion.

136 Financial Statements 2010Outotec Oyj
Interim reports 2011January - march 2011, Friday april 29•January - June 2011, Friday July 29•January - september 2011, thursday, •October 27
Annual General Meeting 2011the annual General meeting 2011 will be held on tuesday, march 22, 2011 at 11:00 am (Gmt +2) at Dipoli, Otakaari 24, espoo, Finland. more information: www.outotec.com/agm.
Dividendthe Board of Directors proposes to the an-nual General meeting that a dividend of eUR 0.75 per share be paid. the Board’s dividend proposal is on page 64 of this annual report. more information: www.outotec.com/agm.
Share informationlisting: nasDaQ OmX Helsinki, OmXHtrading symbol: Ote1Vnumber of shares: 45,780,373 (February 8, 2011)sector: industryisin: Fi0009014575
Analystsanalysts following Outotec: www.outotec.com/investors.
Consensusconsensus estimates collected by Vara Re-search Oy and provided by Valuatum Oy: www.outotec.com/investors.
Investor relations contactms Riitta lind, executive assistant, iRtel.: +358 (0)20 529 2005, [email protected]
investOR infORmatiOn