sustainable supply chain analysis of shrimp in indonesia
TRANSCRIPT

Mita Eka Fitriani, Mita
Supervised by Prof. Dr. Jacques Trienekens
Co-Supervised by dr. Gerben van der Velde
Sustainable Supply Chain Analysis of Shrimp in Indonesia to meet European Market Demand
FINAL REPORT

PAGE 2
Table of Contents
Abstract ......................................................................................................................... 4
1. Introduction ........................................................................................................... 4
2. Literature Review .................................................................................................. 7
2.1 Sustainability ......................................................................................................... 7
2.2 Shrimp Supply Chain Practices ......................................................................... 12
2.3 Market Demands (European Market) toward sustainability ......................... 15
3. Conceptual Framework ...................................................................................... 19
4. Methodology ........................................................................................................ 20
4.1 Research Design................................................................................................... 20
4.2 Sample selection................................................................................................... 20
4.3 Data collection ..................................................................................................... 21
4.4 Analysis of Data ................................................................................................... 26
5. Result .................................................................................................................... 26
5.1 Interviews with the farmers ............................................................................... 26
5.2 Expert interview ................................................................................................... 46
5.3 Exporter interview ............................................................................................... 47
5.4 Stakeholder interview .......................................................................................... 48
5.5 Middlemen interview ........................................................................................... 49
6. Discussion ............................................................................................................. 50
7. Problems and Limitations .................................................................................. 56
8. Conclusion ............................................................................................................ 57
9. Recommendations ............................................................................................... 59
References ................................................................................................................... 60
Appendices 1: List of Questions for shrimp farmers interview ............................. 67
Appendices 2: List of Questions for an expert interview ....................................... 70
Appendices 3: List of Questions for an exporter interview.................................... 70
Appendices 4: List of Questions for stakeholders’ interview................................. 71
Appendices 5: List of Questions for traders or middlemen interview .................. 71
Appendices 6: Frequencies ........................................................................................ 72
Appendices 7: Frequency Table ............................................................................... 73
Appendices 8: The biggest challenges to cultivate shrimp ..................................... 79
Appendices 9: The expectation from government .................................................. 80
PAGE 3
Appendices 10: Interview with the Experts ............................................................. 81
Appendices 11: Interview with the Exporter........................................................... 86
Appendices 12: Interview with the Stakeholders .................................................... 88
Appendices 13: Interview with the Middlemen....................................................... 91
PAGE 4
Abstract
The European market appears promising for Indonesian shrimp farmers due to the high
demand for shrimp in European countries. However, the European market is not an easy
market to enter. Western market tends to have specific requirements that need to be
fulfilled; specifically, sustainability. This paper investigates how far the shrimp supply
chain in Indonesia can comply with the demand for sustainable shrimp in the European
market. To obtain an insight into the sustainable shrimp supply chain, interviews have
been conducted with farmers, stakeholders, middlemen, exporters and experts.
Ultimately, this paper argues that sustainable shrimp supply chain practices have not
yet been fully implemented in Indonesia, seeing that numerous improvements are
required. It is recommended for all the players in the shrimp supply chain to cooperate
and support each other. Moreover, it is essential that an efficient sustainable supply
chain is created by optimising the technology, system and networks throughout the
supply chain.
1. Introduction
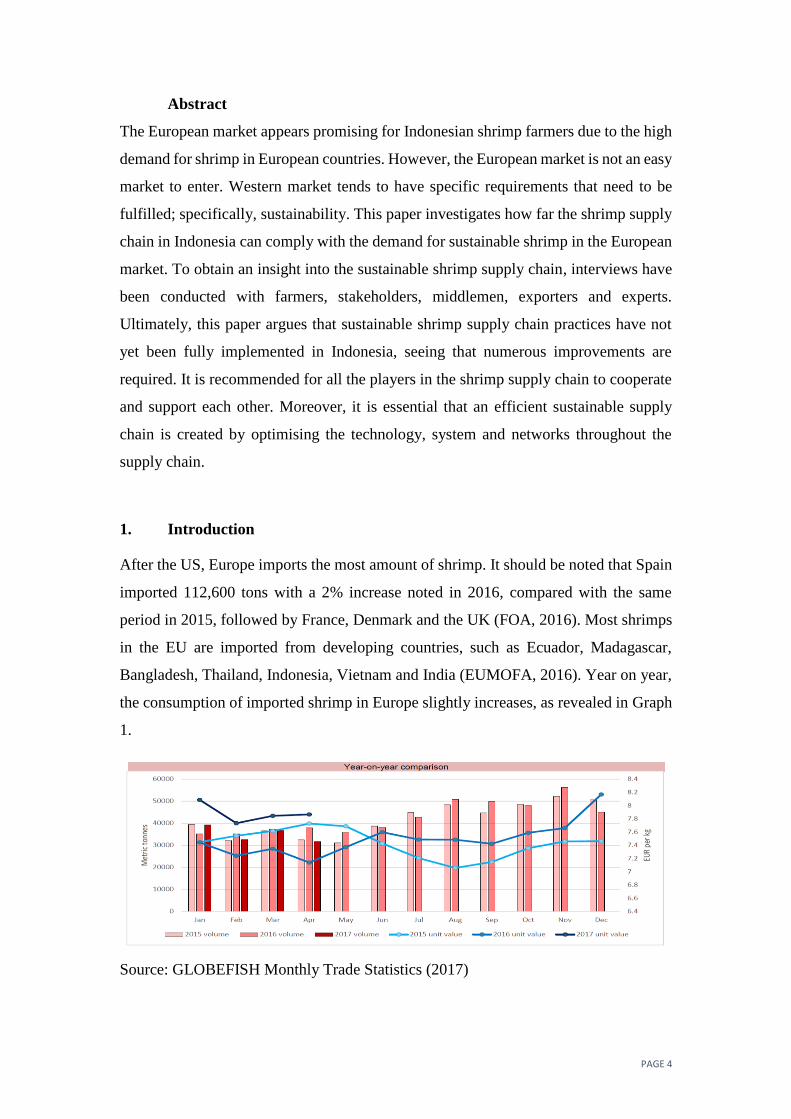
After the US, Europe imports the most amount of shrimp. It should be noted that Spain
imported 112,600 tons with a 2% increase noted in 2016, compared with the same
period in 2015, followed by France, Denmark and the UK (FOA, 2016). Most shrimps
in the EU are imported from developing countries, such as Ecuador, Madagascar,
Bangladesh, Thailand, Indonesia, Vietnam and India (EUMOFA, 2016). Year on year,
the consumption of imported shrimp in Europe slightly increases, as revealed in Graph
1.
Source: GLOBEFISH Monthly Trade Statistics (2017)

PAGE 5
Regarding shrimp, this indicates that gaining a significant market share in Europe
would appear to be profitable. Nevertheless, to enter the European market, exporters
must understand and comply with the requirements for shrimp imported into Europe,
such as EU approval, transparent traceability and trustworthy certificates pertaining to
catches, health and hygiene, for quality assurance purposes (CBI, 2015). Moreover,
Oorschot et al. (2004), claimed clear certification is used to guarantee reliability for the
consumer. In Northern Europe, organic certification is required for the niche market.
Additional certification related to the sustainability of shrimp, which are commonly
found in the European Union are IFS, BRC, ASC, MSC and GLOBAL GAP (CBI,
2015).
It is important to mention that the European Union (EU) also focuses on sustainability
issues concerning its products (American Chamber of Commerce of Europe, 2004).
Based on Kievitsbosch (2015), sustainability is crucial for building a competitive
market by considering the social and environmental impact of production activities.
Sustainability must be applied, not only in production processes but also in the supply
chain. Sustainable supply chain means:
a. Products are produced safely and in a way that promotes good health to fulfil
people’s demands, so they can obtain nutritional food. This includes providing
important information on products
b. Sustain financial viability and social differences in villages and cities
c. Create a continuing income from sustainable land management, not only by means
of the market but also through payments for greater profit
d. Use natural resources efficiently
e. Protect the environment by reducing energy waste, using resources effectively and
harnessing renewable resources
f. Assure product safety and hygiene practices in the workplace and consider social
responsibility together with employee training
g. Implement high standards regarding animal health and welfare
h. Extend the availability of resources to satisfy society's demand by utilising unused
land (DEFRA, 2002).
However, several countries that export shrimps have not yet entirely met European
demand for sustainable shrimp production and supply chain. The CBI (2015), stated
shrimp farming in Asia had been blamed for its negative effects on society and the
PAGE 6
environment. Furthermore, shrimp farming in Indonesia has had a devastating effect on
the environment. Mangrove deforestation has occurred along the coastline and land has
been transformed into shrimp ponds. For example, on one island in Indonesia, 18000
ponds were built from Aceh to Lampung. It was claimed that this is the largest shrimp
farm in the world. Furthermore, by increasing shrimp production, trash fish, which is
used for feeding the farmed shrimp in the form of pellets will be overused. It is assumed
that 900,000 tons of trash fish, which are dependent on trawling and bycatch, are
necessary for fish feed (Gillet, 2008).
If Indonesia can meet demand for sustainability, it has the potential to fulfil European
shrimp consumption. Gillet (2008), argued that shrimp production in Indonesia,
especially for Penaeus vannamei (Pacific White Shrimp) has export potential, given
that Indonesia can harvest more than 400000 tons of shrimp each year with household
shrimp farming contributing approximately 65000. As such, if Indonesia wishes to
expand its shrimp market to the European Union, it is required to create sustainable
shrimp production and supply chain.
Research Objective
The objective of this research is to achieve an insight into the sustainable supply chain
of shrimp in Indonesia to comply with the demands of the European market.
Research Question
• General Research Question: To what extent the Indonesian shrimp supply chain
complies with the demands of European market for sustainable shrimp?
• Sub Research Question:
1. What are the European market demands for sustainable shrimp?
2. What changes can be made in supply chain practices in Indonesia to comply
with the demands of the European market?
3. What are the challenges and how can they be solved to comply with sustainable
shrimp which is demanded by the European market?

PAGE 7
2. Literature Review
In this literature review, a brief explanation is given with regard to sustainability
complete with its indicators consisting of economic, social and environmental aspects.
It is important to recognise the explanation related to sustainability, since it can explain
what type of sustainability aspects the researcher will use to gather data from farmers
and other respondents. Furthermore, the overview of shrimp supply chain practices is
shown in the literature review in order to confirm whether the various types of shrimp
farming in Indonesia has fulfilled the sustainable aspects of shrimp farming and
conforms to the previous research. As considered, activities in shrimp farming will be
included in the supply chain of sustainable shrimp, as the main route in shrimp supply
chain. However, prior to assessing the sustainability of shrimp farming in Indonesia,
the researcher needed to analyse the market demands, especially the European market
concerning sustainability, which is drawn in the literature review. Finally, the obtained
data will be related to the literature review.
2.1 Sustainability
Sustainability is defined as a concept which focuses on the well-being of humankind in
the future by considering three crucial pillars; specifically, social, economic and
environmental (Kuhlman & Farrington, 2010). Each pillar provides an example of
specific topics employed to assess sustainability in the supply chain.
Sustainability
Indicator Topics Sub topics Description
Economic
Economic Structure
Economic
Performance GDP per Capita
Consumption and
Production Patterns
Energy and material
use
The percent and
intensity of material
and renewable
energy use
Waste Production
Waste Generation
and management
Waste Recycling and
Reuse
Social Equity Poverty
Percent of
Population Living
below the Poverty
Line
Employment
Employment
condition
Unemployment Rate,
Child Labour

PAGE 8
Health Healthcare delivery
Percent of
population with
access to primary
health care facilities
Environmental
Oceans, Seas and
Coast Coastal Zone
Mangrove
Concentration along
the coast
Aquaculture Fisheries Use of chemicals
Biodiversity Ecosystem
Protected Area as
a % of Total Area
Source: United Nation Publication (2007)
There are three important side-effects related to the sustainability of shrimp farming,
such as mangrove deforestation, fishmeal for shrimp feeding and water pollution. Based
on Barbier and Cox, WRM and Lebel et al., (2002) in a case of shrimp farming, there
are two crucial topics of sustainability caused by mangrove deforestation, in addition
to environmental and social issues. According to environmental conditions,
deforestation can induce erosion, increase CO2, produce problems in the fisheries sector
and furthermore, cause a shortage of clean water. These environmental problems can
technically be overcome by the displacement of shrimp ponds from mangrove areas by
way of open-water Integrated Multi-Trophic Aquaculture (IMTA), mangrove
restoration and the use of the REDD+ program which is involved in reforestation,
afforestation and forest conservation (Ahmed et al., 2017). An additional suggestion
which comes from Joffre et al., (2015), states that there is a need to build a regulatory
framework that illustrates the economic advantages of the integration between
mangrove and shrimp production for farmers, so they recognise the importance of
mangroves for shrimp cultivation. Moreover, according to social aspects, mangrove
destruction also has possibility to decrease food security.
Naylor et al., (2000), commented that aquaculture activities such as shrimp farming
have a detrimental effect and deplete fish supplies, as fishmeal is the main nutritional
feed for shrimp. However, Cruz-Suárez (2010), offered a solution to that problem by
harnessing green seaweed (Ulva clathrate). This specific method can decrease the ratio
of commercial feed for shrimp by virtually 50%.
PAGE 9
It should also be pointed out that shrimp farming triggers water pollution. This problem
is produced by overfeeding, algal bloom due to water waste and the use of cyanide to
clean the shrimp farm (Dewalt et al., 2002).
Conversely, shrimp farming activity leads to several advantages for certain
communities. In coastal Mexico, shrimp farming employs approximately 600
permanents workers for 6000 ha of ponds. The employees are paid fairly, much greater
than the minimum salary in the region. Moreover, they obtain free meals daily and an
annual bonus. The other social advantages reported are improvements in infrastructure,
for instance roads, electricity and the water supply (Dewalt et al., 2002). Paul and Vogl
(2011), also concur that shrimp farming can have a positive impact on society and the
economy in Bangladesh. Regarding this, it is asserted that poverty declines, whilst the
food security is enhanced, and people can gain employment as middlemen and
exporters.
By examining the advantages and disadvantages, Chim et al. (2009), suggested the
establishment of environmental friendly facilities and continuous studies to overcome
the social and ecological problems. By doing so, shrimp farmers will be more united
and adaptable to current market demand. Besides that, BPS (2016) theory related to
sustainable development along coastal and marine regions, can be applied to ensure
sustainable development with regards to the shrimp production and the shrimp supply
chain. Initially, the integration of environmental development around ponds is
necessary. Consequently, waste pollution should decline seeing as harmful chemical
substances are avoided during each stage of the shrimp production. The use of
renewable energy also needs to be considered, together with social, economic and
culture awareness. Finally, it is essential to mention that legal practices are required to
enhance the performance and guarantee reliable information about shrimp production.
Plus, every single stage needs to be managed to achieve sustainable development.
Additionally, Smith (2008), states that the crucial elements required to develop the
sustainable supply chain consist of supply chain variety and the assurance of product
quality related to social, economic and environmental impacts in the supply chain.
Moreover, trust among stakeholders, cooperation and strict standards are another
significant aspect to generate sustainable supply chain practices. Sverdrup (2017), also
stated that to overcome the problem of unsustainability, certain actions can be taken,
including:

PAGE 10
a. Each player in the sustainable market is required to focus on their own rules. In this
case, the government may focus on constructing sustainable regulations, while the
farmers need to set the rules concerning shrimp production based on the
requirement of sustainable shrimp in the supply chain.
b. There is a need to have a better understanding of the problems which trigger
unsustainability by using system analysis. By doing so, it will be easier to attain
solutions to overcome the obstacles in meeting the sustainability aspects.
c. Feedback about the rules by means of active governance is crucial. This means that
it is important for the government to know how far their regulations can fit with the
farmers situation.
d. Governments need to establish clear rules related to sustainability under law. By
doing so, the rules will be more legitimate and supply chain actors can clearly
employ the regulation.
As such, to create sustainability in shrimp farming, there must be a close relationship
between land suitability, capacity of the ponds, organisations and social aspects (Farkan
et al., 2017). Similarly, sustainability can also be adopted from the Department of
Fisheries’ programme in Thailand. Tookwinas et al. (1999), state that the programme
includes:
a. Regular shrimp farming examinations by coastal aquaculture authority holders.
They are responsible for controlling diseases and technical services in shrimp farm.
b. Fulfilling European Union requirements related to water quality, red tide and farm
sanitation. This activity is recorded frequently according to the timeline.
c. Controlling the quality and safety of exported shrimp in order to maintain consumer
confidence.
d. Managing the water circulation and water system to preserve the sustainable shrimp
farming system.
When the particular countries cannot manage sustainability, they will not be allowed to
export shrimp to European countries. This occurs in Bangladesh, where the decrease in
food safety standards and disorganised sustainable shrimp supply chain, meant that the
EU prevented shrimp being imported from the country for several weeks. That
particular action had a substantial impact on Bangladesh’s economy. However, after
undertaking an evaluation and rearranging the sustainable aspect, Bangladesh was
PAGE 11
finally able to obtain access to the lucrative European market. This incident suggests
that Europe considers sustainability to be a crucial factor with regards to importing
products, etc, (Alam and Pokrant, 2009).
In general, not all countries can comply with the European Union requirements with
respect to sustainable shrimp. In Indonesia, there are five challenges related to
developing sustainable shrimp (Hanafi & Ahmad, 1999).
a. Poor shrimp culture management:
- Shrimp feed quality is unclear, so farmers select the feed by trial-and-error. This
has not only impacts on the environment, but also on economic aspects.
Concerning the environment, unsuitable feed can generate more effluent, which
means that the farmers can face capital loss.
- Certification seems expensive and complicated among small farmers. It can
occur due to little knowledge about adapting the certification and less
knowledge about the advantage of certification.
- There is a lack of information among small farmers concerning chemicals that
are illegal in shrimp farming. This lack of information means that farmers may
keep using dangerous chemicals and harm the environment.
b. Environmental issues
- Unmanageable ponds cause several outbreaks of diseases. This indicates that
when the ponds are incorrectly designed, farmers cannot handle and overcome
these outbreaks.
- There are polluted sites around ponds due to the overuse of pesticides and
moreover, industry effluent.
c. Economic obstacle
- Mining activity around the farm may endanger the quality of water. When it
occurs, quality can be affected and decline. Moreover, mining activity in
Indonesia cannot be stopped because the mining companies hold considerable
power and it is alleged that corruption takes place too.
d. Social conflicts
- Conflict generally occurs between paddy farmers or environmentalists and
shrimp farmers because it is believed that shrimp farming activity harms the
environment. There is also conflict between fishermen and shrimp farmers as

PAGE 12
shrimp farmers use fish for feeding the shrimp, so automatically the fishermen
catch fewer fish.
e. Legality
- Scant attention is paid to creating proper regulations related to sustainable
shrimp farming. If sustainable regulation is clear, strict and applicable,
sustainability can be achieved easily and effectively.
2.2 Shrimp Supply Chain Practices
The shrimp supply chain can be divided into several stages, such as hatchery, grow-out,
processing and transport. The hatchery stage entails Spirulina, small squid, mussels and
micro-algae for feeding the shrimp larvae together with antibiotics, such as
oxytetracycline, fuizolidone and EDTA (Dewalt et al., 2002). Hatcheries in China can
be divided into two distinct types: industrial-scale and small-scale (family-based). The
first type requires considerable investment due to the latest technology and importing
brood stock from the United States which has brood stock which is of a superior quality.
On the contrary, the small-scale hatchery is categorised by low capital and traditional
technology resulting in lower quality shrimp seed (Cao, 2012). In this type of hatchery,
seed quotas of shrimp require transparent co-management which is organised by local
groups of farmers (Truong et al., 2014). For a better insight, the detailed characteristic
of supply chain of shrimp which is adopted from China is shown below (Table 2) (Cao,
2012):
Stage Intensive supply chain Semi-intensive supply chain
Hatchery - Import Hawaii SPF (specific-
pathogen free) broodstock by
air
- Produce F1 (1st generation)
post-larvae with higher
survival & growth rates
- Industrial-scale, commercial
based
- Use local domesticated
broodstock
- Produce F2 (2nd generation)
post-larvae
- Small scale, family based
Grow-out - Use F1 post-larvae
- High stocking density (160-
200 post-larvae/m2)
- High water exchange rate
(8%-15% daily)
- Frequent aeration
- No fertilizer used
- Use F2 post-larvae
- Medium-low stocking
density (50-80 post-
larvae/m2)
- Low water exchange rate
(1%-3% daily)
- Rare aeration

PAGE 13
- High feed conversion ratio
(FCR), average 1.6
- Culture cycle: 100 days/crop
- High unit production (8.000
kg/ha)
- Fertilizer used
- Low FCR, average 0.97
- Culture cycle: 100-120
days/crop
- Low unit production (2500
kg/ha)
Post-farming - Processed as head-off, shell-
on frozen shrimp
- Export to US
- Processed as head-off, shell-
on frozen shrimp
- Sell in domestic markets
In Indonesia, farms growing shrimp seed are commonly distinguished by three main
types, traditional, semi-intensive and intensive farms. In intensive farms, farmers use
pellets and advanced tools like aerators to generate high yield, semi-intensive ponds
use fertiliser to increase the natural water production and the traditional pond system
lets the shrimps grow without any special treatment until they are harvested (Diana,
2009). According to Farkan et al., (2016), of the three methods employed, the most
productive pond is the intensive pond. This is because the intensive pond is able to
produce a greater yield compared to extensive and semi-intensive ponds. The yields can
reach 5-15 MT/ha. The factors which trigger greater yields include skilled labour to
maintain shrimp production and the use of cutting edge technology (Dewalt et al.,
2002). However, intensive farming can be detrimental for the environment due to
higher feed, energy and electricity consumption, besides the production of gas
emissions which is equal to 23.1±(2.6 kg of SO2 equiv, 36.9 ± (4.3 kg of PO4 equiv
and 3.1 ± (0.4 t of CO2 equiv. When it is related to soil condition as a result of intensive
farming, soil can be damaged by an increase in effluent, produced by ammonia and the
suspended solids in shrimp faeces (Cao, 2011).
Semi-intensive farming, which is different to intensive farming, may generate 1-3
MT/ha and require ponds which cover 4-10 ha (Dewalt et al., 2002). Regarding
Indonesia, it was discovered that the most suitable type of farm is the medium scale
semi-intensive farming (Kusumastanto et al., 1998). The reason for this is related to the
risks involved semi-intensive farming, for instance shrimp harvest failure due to
diseases and land limitations concerning shrimp farming, is much lower than intensive
farming. In addition, semi-intensive farming may employ more unskilled labour, so that
unemployment levels in the community decrease. Those are also the solutions for
shrimp farmers who have limited capital to develop their farms. The last type of shrimp
farming in Indonesia is traditional farming. Traditional shrimp farming requires low
PAGE 14
quantities of feed, given that the shrimps are not only fed by commercial feed, but also
by natural feed from the environment, such as wild post larvae. It also produces the
lowest yield of shrimp, approximately 1 MT/ha (Dewalt et al. 2002). Diana (2009),
assumed that when the intensity of shrimp farming rises, cost and effluent production
will level off. It means that although traditional shrimp farming generates the least
shrimp production, it is the most sustainable type of shrimp farming due to the cost and
the production of less waste.
The shrimp commonly has a segmented body structure which is divided into three parts:
the head, thorax and abdomen. Additionally, shrimp can be sold frozen head-on, head-
off and peeled (shrimp without a skin). Nonetheless, before being spread out
commercially in the market, quality is maintained by shrimp producers in two ways;
specifically, harvesting and handling. Regarding harvesting, to obtain high quality
shrimp, the main procedures are washing, weighing and cooling at a temperature of 0-
4oC, together with the addition of sodium metabisulphite to avoid melanosis and red-
head, prior to be delivered to the market. Subsequently, in the second part, shrimps are
cleaned, sorted and stored as frozen shrimp at -20 degrees Celsius for export standards
(FAO, 2006). Processing and packaging are identified as costly stages in shrimp
production due to various requirements. In Mexico, the producers need to spend 1
million USD annually for these separate stages (Dewalt et al., 2002).
For frozen cooked shrimp, shrimp is processed in an intensive way to maintain the
quality. Firstly, the farmer can store the shrimp in ice, immediately after harvesting. It
can preserve the quality of the shrimp until it reaches the processing plant. Next, the
shrimps need to be classified. The high-quality shrimp will be washed in cold water
(278K). In order to ensure the shrimps are tender, they are cooked in an ambient
temperature of 372K. Afterwards, the shrimp are cooled down to 255K prior to the
coating process which uses ice as the main material (Lai & Ye, 2017). As such, to
maintain the quality of the shrimp along its supply chain, there is a need for clear
regulation for fishermen, sufficient technology and good practice in production (Wati
et al., 2013).
The shrimp supply chain cannot be separated from government intervention since in
terms of Supply Chain Management (SCM), there is an absolute need for the actors
involved in the supply chain to cooperate with the suppliers and stakeholders in the

PAGE 15
entire supply chain. This is known as external cooperation and involves suppliers, the
government and local communities in the supply chain (Monczka et al., 2015).
Additionally, Cooper et al. (1997), stated that supply chain management is an
integrative philosophy which organises the flow of materials from suppliers to the
customers. In India, there is a trend in which small farmers have a partnership with the
government. This has led to better management and environmental improvement as the
government, in this case regulates shrimp production by reducing the waste and
chemical use (Philips & Subasinghe, 2006). In other words, for the entire supply chain,
it is necessary to consider Supply Chain Management (SCM), seeing that it has played
a crucial role in enabling farmer to collaborate with other players in the supply chain,
to achieve a win-win situation (Vural, 2015). Furthermore, Yi et al.(2016), offered
another perspective to support small farmers in developing countries, especially in
Indonesia, which comprises several steps:
a. The government may set the policies which encourage the development of
hatcheries and feed mills facilitated by sophisticated technology, so that farmers
can embrace the modernisation of shrimp farming in order to increase productivity.
b. Loans for small farmers must be more accessible to overcome the capital
constraints. By doing so, small farmers can change the development of shrimp
farming and include the use of high-end technology.
In the supply chain of shrimp, farmers also need to cooperate with the processor
(middleman) and exporter. In Thailand, the relationship between farmers and
processors is more about product traceability by way of publishing a movement
document (MD). The shrimp farmer will provide the MD and give it to the processor
or exporter. Next, the processor and exporter have to take the document to the
Department of Fisheries with the aim of acquiring the shrimp certification (Ekmaharaj,
2006)
2.3 Market Demands (European Market) toward sustainability
Aquaculture products have been expanding both locally and globally to feed the
growing population with the assumption that each person will consume one and a half
kilogram of seafood in 2020 (Diana, 2009). Shrimp, for instance, is believed to be the
most valued product in the global fisheries market with growth reaching more than 8%
per year and twice in 20 years (FAO, 2004; Bostick, 2008). Shrimp is exported
PAGE 16
internationally to three main markets: the United States, Japan and Europe. In this
research, the European market is the principal target of the Indonesian export. Several
reasons exist behind the decision to choose the European Union as an object of this
research. In 2009, frozen shrimps became the most popular fisheries product exported
to the European Union (Lord, 2010). In later years, demand for shrimp in the European
Union achieved 25% of global imports with a value of 513,000 tons or USD 4.3 billion
(CBI, 2015). Inevitably, it indicates that consumption in Europe continues to increase.
Moreover, it was discovered that imported shrimp is obtained from developing
countries, such as Thailand, Bangladesh, Ecuador and India. Thus, Indonesia will have
a large opportunity to expand its shrimp market to European countries (Van Duijn et
al., 2012).
In addition, the European currency (the Euro) appears stable in the trade market which
implies that the EU’s economic performance is constant. Nevertheless, there have been
demand for shrimp in the European market has been affected by several factors. One of
them is the prerequisite for sustainable shrimp, especially in European countries.
European countries also have stringent rules correlated with import regulations.
Consequently, the imported shrimps must be free from drugs, chemicals and antibiotics.
Hence, the European market compels exporter countries to have a guaranteed
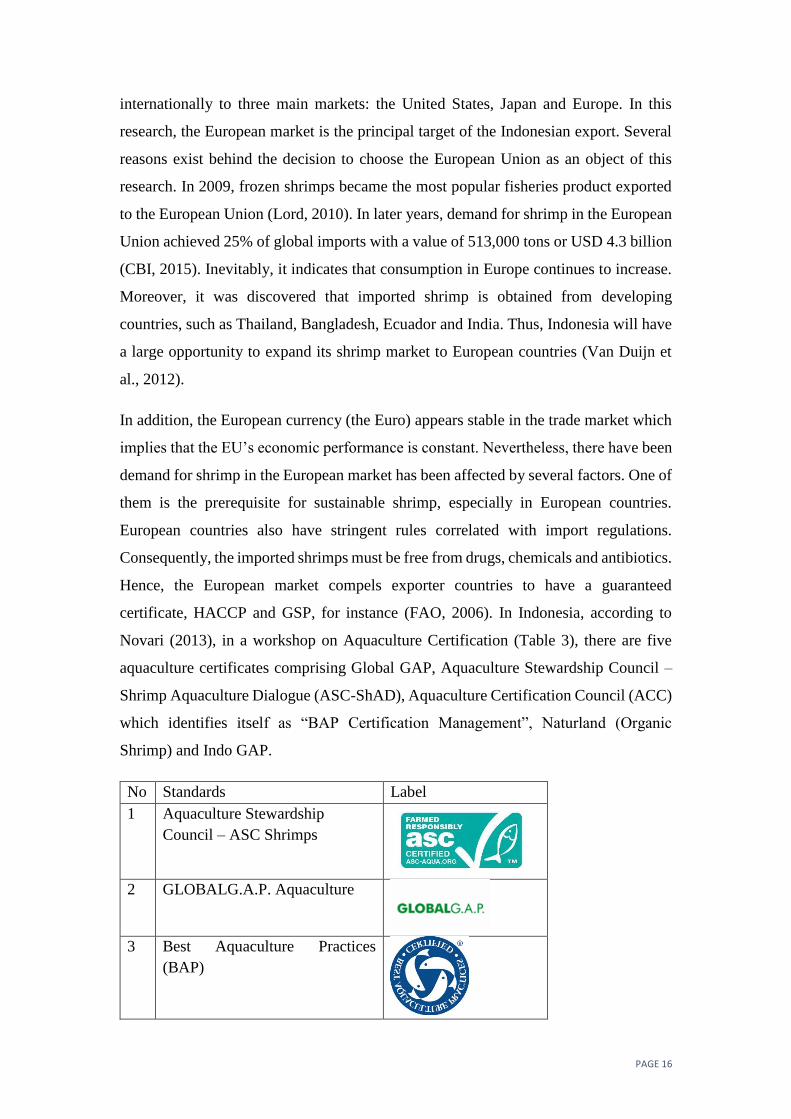
certificate, HACCP and GSP, for instance (FAO, 2006). In Indonesia, according to
Novari (2013), in a workshop on Aquaculture Certification (Table 3), there are five
aquaculture certificates comprising Global GAP, Aquaculture Stewardship Council –
Shrimp Aquaculture Dialogue (ASC-ShAD), Aquaculture Certification Council (ACC)
which identifies itself as “BAP Certification Management”, Naturland (Organic
Shrimp) and Indo GAP.
No Standards Label
1 Aquaculture Stewardship
Council – ASC Shrimps
2 GLOBALG.A.P. Aquaculture
3 Best Aquaculture Practices
(BAP)

PAGE 17
4 IndoGAP
5 Organic Certification
Source: www.standardsmap.org
The goal of ASC is to implement the ASC certification standard, which appeared in
2014 via the market. Therefore, ASC is vital certification if farmers intend to enter the
European market. However, according to Douma & van Wijk (2012), the ASC does not
represent clear objectives and direction, which results in less concern for extensive
shrimp farmers and exporters to embrace this certificate. The ASC also charges a
substantial amount of money which is a burden for small farmers. However,
stakeholders in Indonesia assume that the ASC is an appropriate certificate as the
objectives of the ASC are similar to theirs. In this case, the stakeholders comprise the
government and NGOs.
When farmers obtain organic certification, it indicates they have organic farming
practices. Organic farming can benefit farmers in several ways, like what happened in
Bangladesh (Paul et al., 2013). As a consequence of introducing organic certification,
farmers in Bangladesh can increase their quality of life by earning more income. They
also have contributed to a sustainable environment, which in turn, has increase their
social status. Moreover, by embracing organic farming, the diseases that afflict shrimp
can be reduced significantly. This means organic farming is a positive way to increase
sustainability in shrimp farming. In India, organic farming is also selected as a solution
for creating sustainable shrimp farming, especially regarding economic and
environmental aspects (Knowler et al., 2009). As a result, shrimp can achieve a
premium price by means of organic shrimp farming because it promotes shrimp which
is free from chemical feeds.
The other alternative certification commonly found in Indonesia is known as BMPs
(Better Management Practices). This certificate allows the user to demonstrate concern
about social and environmental issues, as it is acknowledged that BMPs are the standard
for farming practices with regards to creating a save environment (Kusumawati & Bush,
2015).

PAGE 18
The Indonesia MMAF (Ministry of Marine Affairs and Fisheries) department has
established both regulations and standards of certification to promote good aquaculture
practices, namely “Cara Budidaya Ikan yang Baik” (CBIB) alternatively termed
IndoGAP. CBIB certification does not include social standards because it focuses more
on the minimum requirements of BMP which is concerned about food safety. The CBIB
certification certifies most local farmers, improves practice gradually and is not strict
(Van Schaik, 2010).
Fayet (2014), argued that the different implementation and certification mechanisms
can enhance small farmers practices in sustainable supply chain governance systems
and help them to create market access. Nevertheless, multiple standards can create
confusion for buyers, farmers, etc. Oosterveer (2006), also agreed that certification and
labelling are able to assist farmers in delivering information to customers as long as it
can fit with the behaviour of the consumers, which these days tend to consider the
ecological aspects more thoroughly.
Again, sustainable seafood products are the priority in the European market. Hence,
sustainability must be applied not only in the production process, but also throughout
the entire supply chain. When concern over sustainability is high, it results in extremely
safe products that can be traced easily throughout the process. This makes certification
and eco-labelling a pre-requisite for exporter countries to compete in the European
market, particularly in Southern and Northern Europe. However, small fishermen still
consider the standards associated with exporting to Europe, as well as the high import
tariffs to be relatively high, which in turn creates a barrier for them in relation to
exporting the shrimp (Van Duijn et al., 2012).
PAGE 19
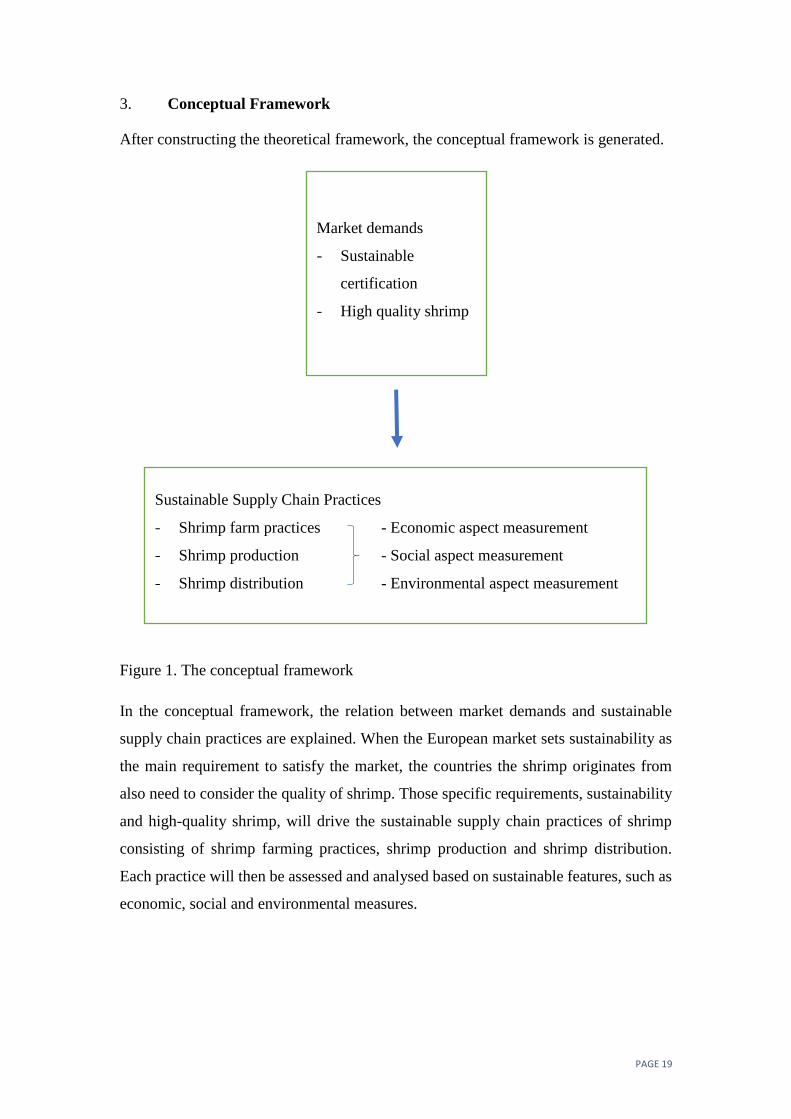
3. Conceptual Framework
After constructing the theoretical framework, the conceptual framework is generated.
Figure 1. The conceptual framework
In the conceptual framework, the relation between market demands and sustainable
supply chain practices are explained. When the European market sets sustainability as
the main requirement to satisfy the market, the countries the shrimp originates from
also need to consider the quality of shrimp. Those specific requirements, sustainability
and high-quality shrimp, will drive the sustainable supply chain practices of shrimp
consisting of shrimp farming practices, shrimp production and shrimp distribution.
Each practice will then be assessed and analysed based on sustainable features, such as
economic, social and environmental measures.
Market demands
- Sustainable
certification
- High quality shrimp
Sustainable Supply Chain Practices
- Shrimp farm practices - Economic aspect measurement
- Shrimp production - Social aspect measurement
- Shrimp distribution - Environmental aspect measurement

PAGE 20
4. Methodology
4.1 Research Design
This study was a combination of qualitative and quantitative research. The qualitative
research design comprised a case study, whilst the quantitative research design was a
cross-sectional study. The cross-sectional study is selected because in this research, the
researcher was identifying the condition of the population and obtaining information
by connecting with the respondents (Kumar, 2011). The case study is selected for
several reasons:
a. It helps researchers to explore and understand the case comprehensively in a
flexible way (Gilbert, 2008).
b. There will be assumptions, suggestions and opinions from the respondents as a
result of the open-ended questions asked in the in-depth interviews.
c. It suits the aim of this research, which is to gain an insight into the sustainable
supply chain of shrimp so as to comply with the demands of the European
market, as the case study will enable the researcher to acquire considerable
information and a greater insight into the situation (Kumar, 2011).
4.2 Sample selection
In this research, the respondents are shrimp farmers, exporters, experts and
stakeholders. As this study is qualitative research, the sample is selected to make the
gathered information reach saturation point (Kumar, 2011). West Nusa Tenggara, a
province in Indonesia, has the second lowest gross regional product per capita and has
the potential be a sustainable shrimp exporter since the province is the third largest
shrimp producer in Indonesia. Consequently, my research was conducted in this region.
Interviews were conducted with 30 shrimp farmers, 2 exporters, 5 middlemen, 5 experts
and 5 people in charge of governance (staffs, director and the assistant director).
Farmers were chosen according to the type of farm they operate. The farmers who
participate in traditional, semi-intensive and intensive farming are the respondents in
this research. Thus, there will be 10 farmers for each specific type of farming. Exporters
were selected based on their work experience. Regarding the experts, they were selected
according to their experience. This means that their experience should be related to
marine and fisheries issues. Additionally, people who are in charge of governance were
selected from the Marine and Fisheries Department.
PAGE 21
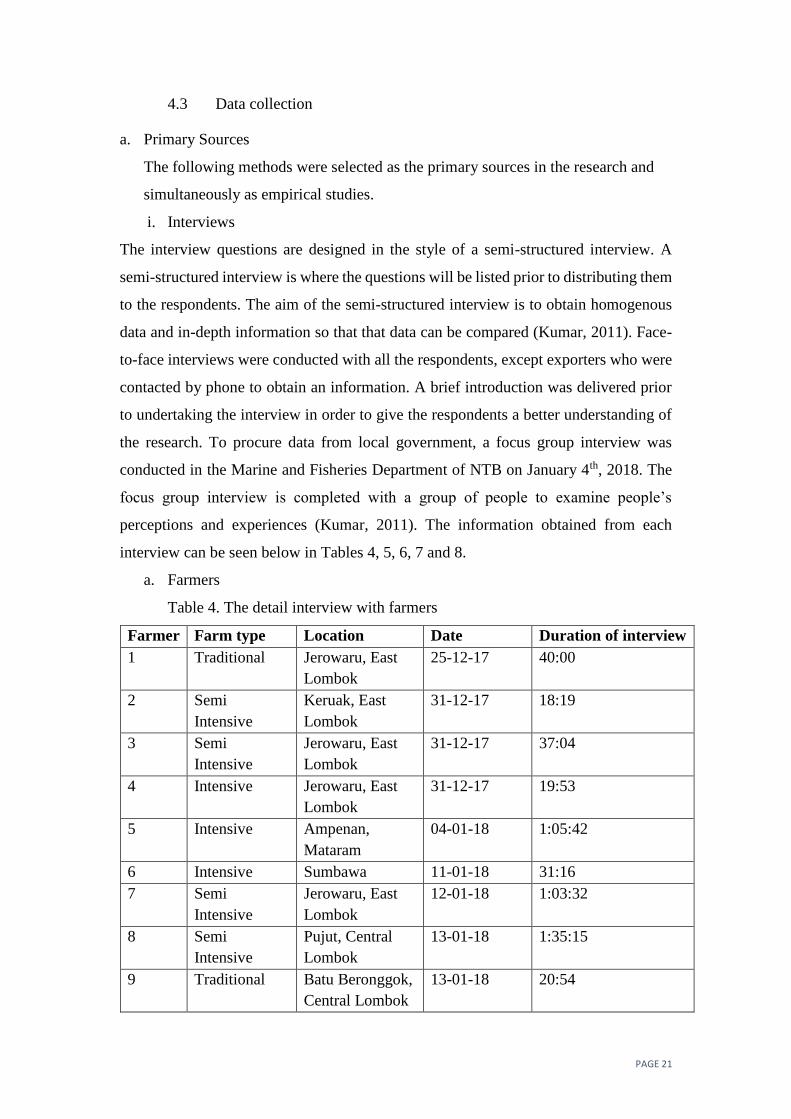
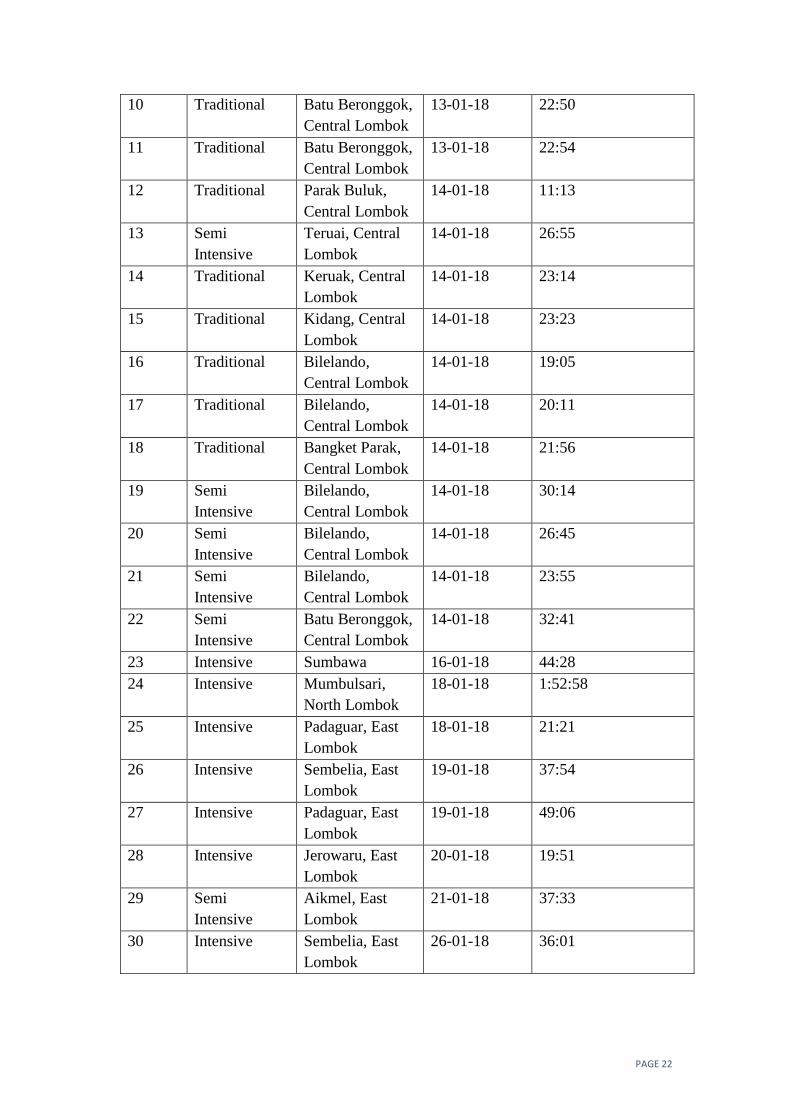
4.3 Data collection
a. Primary Sources
The following methods were selected as the primary sources in the research and
simultaneously as empirical studies.
i. Interviews
The interview questions are designed in the style of a semi-structured interview. A
semi-structured interview is where the questions will be listed prior to distributing them
to the respondents. The aim of the semi-structured interview is to obtain homogenous
data and in-depth information so that that data can be compared (Kumar, 2011). Face-
to-face interviews were conducted with all the respondents, except exporters who were
contacted by phone to obtain an information. A brief introduction was delivered prior
to undertaking the interview in order to give the respondents a better understanding of
the research. To procure data from local government, a focus group interview was
conducted in the Marine and Fisheries Department of NTB on January 4th, 2018. The
focus group interview is completed with a group of people to examine people’s
perceptions and experiences (Kumar, 2011). The information obtained from each
interview can be seen below in Tables 4, 5, 6, 7 and 8.
a. Farmers
Table 4. The detail interview with farmers
Farmer Farm type Location Date Duration of interview
1 Traditional Jerowaru, East
Lombok
25-12-17 40:00
2 Semi
Intensive
Keruak, East
Lombok
31-12-17 18:19
3 Semi
Intensive
Jerowaru, East
Lombok
31-12-17 37:04
4 Intensive Jerowaru, East
Lombok
31-12-17 19:53
5 Intensive Ampenan,
Mataram
04-01-18 1:05:42
6 Intensive Sumbawa 11-01-18 31:16
7 Semi
Intensive
Jerowaru, East
Lombok
12-01-18 1:03:32
8 Semi
Intensive
Pujut, Central
Lombok
13-01-18 1:35:15
9 Traditional Batu Beronggok,
Central Lombok
13-01-18 20:54
PAGE 22
10 Traditional Batu Beronggok,
Central Lombok
13-01-18 22:50
11 Traditional Batu Beronggok,
Central Lombok
13-01-18 22:54
12 Traditional Parak Buluk,
Central Lombok
14-01-18 11:13
13 Semi
Intensive
Teruai, Central
Lombok
14-01-18 26:55
14 Traditional Keruak, Central
Lombok
14-01-18 23:14
15 Traditional Kidang, Central
Lombok
14-01-18 23:23
16 Traditional Bilelando,
Central Lombok
14-01-18 19:05
17 Traditional Bilelando,
Central Lombok
14-01-18 20:11
18 Traditional Bangket Parak,
Central Lombok
14-01-18 21:56
19 Semi
Intensive
Bilelando,
Central Lombok
14-01-18 30:14
20 Semi
Intensive
Bilelando,
Central Lombok
14-01-18 26:45
21 Semi
Intensive
Bilelando,
Central Lombok
14-01-18 23:55
22 Semi
Intensive
Batu Beronggok,
Central Lombok
14-01-18 32:41
23 Intensive Sumbawa 16-01-18 44:28
24 Intensive Mumbulsari,
North Lombok
18-01-18 1:52:58
25 Intensive Padaguar, East
Lombok
18-01-18 21:21
26 Intensive Sembelia, East
Lombok
19-01-18 37:54
27 Intensive Padaguar, East
Lombok
19-01-18 49:06
28 Intensive Jerowaru, East
Lombok
20-01-18 19:51
29 Semi
Intensive
Aikmel, East
Lombok
21-01-18 37:33
30 Intensive Sembelia, East
Lombok
26-01-18 36:01

PAGE 23
b. Experts
Table 5. The detail interview with experts
Expert Position Location Date Duration of interview
1 Lecturer in
Fishery
Department,
Mataram
University
Mataram 21-12-17 1:17:16
2 Lecturer in
Fishery
Department
Mataram
University
Mataram 22-12-17 35:22
3 Aquaculture
Technician from
Caroen Pokphand
company
North
Lombok
22-12-17 58:51
4 Aquaculture
Technician from
Matahari Sakti
company
East
Lombok
25-12-17 35:35
5 Aquaculture
Technician from
CJ CheilJedang
Mataram 10-01-18 37:13
c. Stakeholders Focus Group
Table 6. The detail interview with stakeholders
Focus
Group
Position Location Date Duration of
interview
1 - Head of Marine and Fisheries
Department NTB
- Head of Coastal Resources
Supervision and Management
and Small Islands Department
of Marine and Fisheries NTB
Province
- Head of Power Reinforcement.
Competitiveness of Marine
Products and Fishery
Mataram 29-12-17 47:58
2 Staff at Department of Marine and
Fisheries Central Lombok
Keruai,
Central
Lombok
14-01-18 30:00

PAGE 24
3 - Head of Fish Quarantine Center
for Quality Control and Fishery
Products Safety
- Staff of Fish Quarantine Center
for Quality Control and Fishery
Products Safety
Ampenan,
Mataram
23-01-18 1:03:49
d. Exporters
Table 7. The detail interview with exporters
Exporter Company Location Date Duration of interview
1 Depasena
Group
Lampung,
South
Sumatera
19-01-18 18:17
2 - Banyuwangi,
East Java
22-01-18 40:23
e. Middlemen
Table 8. The detail interview with middlemen
Middlemen Location Date Duration of interview
1 Senggigi Ampenan,
Mataram
28-12-17 31:59
2 Fishing Harbor
Hall, East Lombok
30-12-17 21:15
3 Labuhan Haji, East
Lombok
30-12-17 33:59
4 Keruak, East
Lombok
31-12-17 20:04
5 Labuhan Haji, East
Lombok
11-01-18 31:55
ii. Observation
Before conducting the interview, participant observation was conducted. Kumar (2011)
expressed that participant observation is a strategy to create a close relationship while
conducting research and assists with gathering more accurate information because the
researcher will be involved in the supply chain of shrimp. The observation was
conducted from 18 December 2017 to 20 January 2018 in NTB, Indonesia. The
observation included getting involved in cultivating and harvesting shrimp as well as
monitoring the activities of the traders.

PAGE 25
Summary of Data Collection
1. What are the European market demands for sustainable shrimp?
Table 9. Data collection regarding sub research question 1
Required question Research Method
Information related to European market
demand
Literature study
Information related to sustainability Literature study
2. What changes can be made in supply chain practices in Indonesia to comply
with the demands of the European market?
Table 10. Data collection regarding sub research question 2
Required question Research Method
Information about the necessary changes
of shrimp production practices
Literature study
Information about the necessary changes
of shrimp production practices in West
Nusa Tenggara
Literature study, interview and
observation
3. What are the challenges and how can they be solved to comply with sustainable
shrimp which the European market demands?
Table 11. Data collection regarding sub research question 3
Required question Research Method
Information about the challenges that
farmers’ face to comply with European
market
Literature study
Information about the challenges that
farmers’ face in West Nusa Tenggara
Literature study, interview and
observation
The solution of farmers’ problem to
comply with the European market
demand
Literature study
The solution of farmers’ problem in
West Nusa Tenggara to comply with the
European market demand
Literature study, interview and
observation
b. Secondary Sources
Secondary sources were obtained from academic articles, books, reports, journals and
the Internet.

PAGE 26
4.4 Analysis of Data
Data has been analysed based on two classifications.
- Qualitative research: Data related to qualitative research from farmers, exporters,
experts and stakeholders have been translated into English because the interviews
were conducted using the Indonesian language, Bahasa Indonesia. The interviews
were recorded. Subsequently, the data was formulated and modified into tables,
graphs and further explanations.
- Quantitative research: Raw data obtained from the respondents was edited and
examined to gain clean data, minimise errors and maximise comprehensiveness and
consistencies (Kumar, 2011). The data was then coded and classified according to
nominal or ordinal scales prior to being translated and calculated by means of SPSS.
5. Result
5.1 Interviews with the farmers
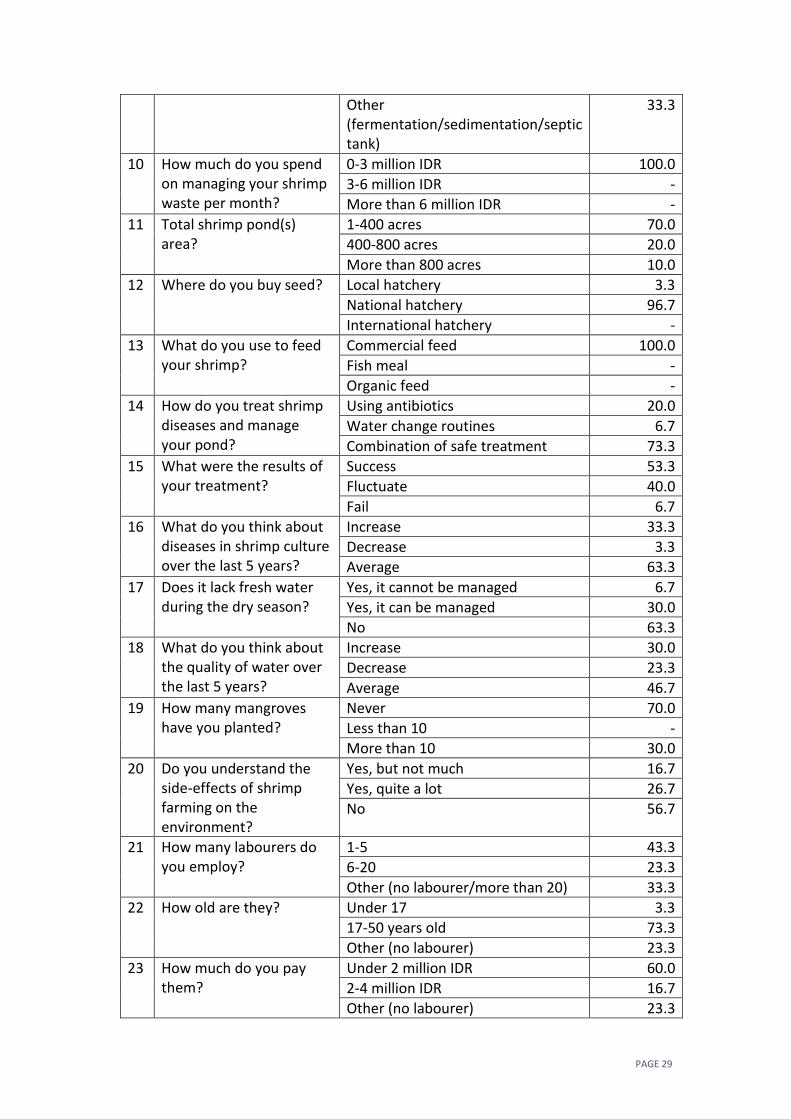
a. Sustainability Aspect
Table 12 reveals the frequency statistics for data obtained from interviews
conducted with the farmers. Virtually all the shrimp farmers have experienced
an increase in income with 40% generating less than 20 million IDR, 40%
obtaining more than 100 million IDR in profit and the remainder 20-100 million
IDR. However, the farmers admitted that they not only generate a profit, but
they can generate losses occasionally. The shrimps are mostly bought by
multiple buyers, such as end consumers, middlemen and exporters. The shrimp
farmers confess that they do not have any difficulties selling the shrimp because
shrimp is in high demand in both local and national markets.
Most farmers build their shrimp ponds with their own money. Nonetheless, it is
undeniable that some make use of bank loans as the source of their capital.
Capital used to build shrimp ponds varies, depending on the type of shrimp
ponds and the pond area. Renewable energy has not yet been used for shrimp
farming due to a lack of interest in sustainable energy. However, BPS (2016),
stated that renewable energy is required to build a shrimp supply chain that is
sustainable. Shrimp effluent is thrown into the sea primarily, however the
effluent also can be managed by use of the recycling process, such as

PAGE 27
fermentation, sedimentation and use of septic tanks. Expenditure is estimated to
be less than 3 million IDR per month. The pond areas that farmers have cover
approximately 1-400 acres. Shrimp seed is typically bought from national
hatcheries to obtain national quality standards for shrimp and to feed them.
Additionally, farmers are likely to buy commercial feed produced by shrimp
feed companies in Indonesia, such as CP Prima, JAPFA, Matahari Sakti,
Universal Agri Bisnisindo and Gold Coin.
If the shrimp is affected by disease, most farmers replace the water ponds
regularly with a combination of safe treatments to eradicate the contamination.
However, the result of the treatment varies; 40% fail and 50% succeed. Farmers
believe that the number of diseases to affect shrimp in the last five years has
remained constant and moreover, there has been no improvement. Shrimps can
be affected by white faeces syndrome, white spot syndrome and infectious
myonecrosis virus. However, the availability of water for shrimp cultivation is
not a huge problem for 63.3% farmers, while the remainder felt that there is a
shortage of clean water in the summer. This is in accordance with Barbier, Cox
and WRM and Lebel et al., (2002), who asserted that mangrove availability due
to mangrove deforestation, can influence the condition of the environment, for
instance a shortage of clean water, erosion and fisheries problems. Furthermore,
it has been proved that the average number of mangroves planted by shrimp
farmers remains low, less than 10 mangroves. The reason why farmers plant
few mangroves is primarily because they do not comprehend the consequences
of shrimp farming on the environment and as the soil around the ponds is sandy
mangroves are unable to grow.
The abundance of water is not accompanied by water that is of good quality. It
is indicated that the quality of water is still constant for the last 5 years. To
maintain the ponds, shrimp farmers in NTB usually employ 1-5 labourers per
pond with the age from 17 to 50 years old. The workers are paid less than the
regional minimum wage, below 2 million IDR. However, each harvest day,
labourers gain incentives in the form of a bonus, which is commonly 10% of
the profit. Additionally, when selecting workers, shrimp farmers tend to look
for experienced people. The employee is required to work under 8 hours per day
in the form of shift work. Furthermore, it should be noted that shrimp farmers

PAGE 28
divide work according to an individual’s gender. For example, female workers
will be placed in the office and kitchen while male workers will be employed
as technical and manual labourers. Most shrimp farmers are satisfied with the
work of their labourers. When the farmers gain increased benefits, they share
their success by being charitable. Thus, there is little or no conflict between the
shrimp farmers and the community around the shrimp farms. This concurs with
what Hanafi and Ahmad (1999), stated, whereby conflict can arise between rice
field farmers and shrimp farmers due to environmental effect of shrimp
production.
Table 12. Frequency Table
No Question Option Percentage (%)
1. What is your family’s income after shrimp farming for the last three years?
Steady 13.3
Increase 63.3
Other (Fluctuate/decrease) 23.3
2 How much is your income per harvest?
0-20 million IDR 40.0
20-100 million IDR 20.0
More than 100 million IDR 40.0
3 Who buys your shrimp? End consumer 6.7
Trader (middlemen or exporter) 3.3
Combination of buyers 90.0
4 What sort of difficulties do you have with regards to selling your shrimp?
Lack of market information -
No difficulties 80.0
Other difficulties (less quality/limited demand/size/prize)
20.0
5 Have you ever experienced loss? If yes, how much?
0-20 million IDR 56.7
20-100 million IDR 16.7
More than 100 million IDR 26.7
6 How much capital did you need to build your shrimp farm?
Less than 100 million IDR 50.0
100-500 million IDR 13.3
More than 500 million IDR 36.7
7 What is the source of your capital?
Self-capital 63.3
Bank loans 26.7
Other (multiple sources) 10.0
8 What type of energy is used on your shrimp farm?
Renewable energy -
Non-renewable energy 100.0
Other -
9 How do you manage waste?
Discard 50.0
Recycle 16.7
PAGE 29
Other (fermentation/sedimentation/septic tank)
33.3
10 How much do you spend on managing your shrimp waste per month?
0-3 million IDR 100.0
3-6 million IDR -
More than 6 million IDR -
11 Total shrimp pond(s) area?
1-400 acres 70.0
400-800 acres 20.0
More than 800 acres 10.0
12 Where do you buy seed? Local hatchery 3.3
National hatchery 96.7
International hatchery -
13 What do you use to feed your shrimp?
Commercial feed 100.0
Fish meal -
Organic feed -
14 How do you treat shrimp diseases and manage your pond?
Using antibiotics 20.0
Water change routines 6.7
Combination of safe treatment 73.3
15 What were the results of your treatment?
Success 53.3
Fluctuate 40.0
Fail 6.7
16 What do you think about diseases in shrimp culture over the last 5 years?
Increase 33.3
Decrease 3.3
Average 63.3
17 Does it lack fresh water during the dry season?
Yes, it cannot be managed 6.7
Yes, it can be managed 30.0
No 63.3
18 What do you think about the quality of water over the last 5 years?
Increase 30.0
Decrease 23.3
Average 46.7
19 How many mangroves have you planted?
Never 70.0
Less than 10 -
More than 10 30.0
20 Do you understand the side-effects of shrimp farming on the environment?
Yes, but not much 16.7
Yes, quite a lot 26.7
No 56.7
21 How many labourers do you employ?
1-5 43.3
6-20 23.3
Other (no labourer/more than 20) 33.3
22 How old are they? Under 17 3.3
17-50 years old 73.3
Other (no labourer) 23.3
23 How much do you pay them?
Under 2 million IDR 60.0
2-4 million IDR 16.7
Other (no labourer) 23.3
PAGE 30
24 How do you choose your workers?
Based on the relationship 33.3
Based on the experience 40.0
Other (no labourer) 26.7
25 What types of incentives do you give your workers?
Bonus 63.3
Goods 6.7
Other (no labourer /no incentives) 30.0
26 How many hours do your labourers work each day?
Under 8 hours 66.7
8 hours 10.0
Other (no labourer) 23.3
27 Are you satisfied with their work?
Satisfied 73.3
Disappointed -
Other (less satisfied/no labourer) 26.7
28 What have you done for your community after benefitting from shrimp cultivation?
Education -
Charity 100.0
Health service -
29 What sort of conflict arises during shrimp production?
Social conflict 13.3
Economic conflict 3.3
Other (no conflict) 83.3
30 Do you treat male and female labourers the same way?
Yes -
No 56.7
Other (no labourer/no female labourer)
43.3
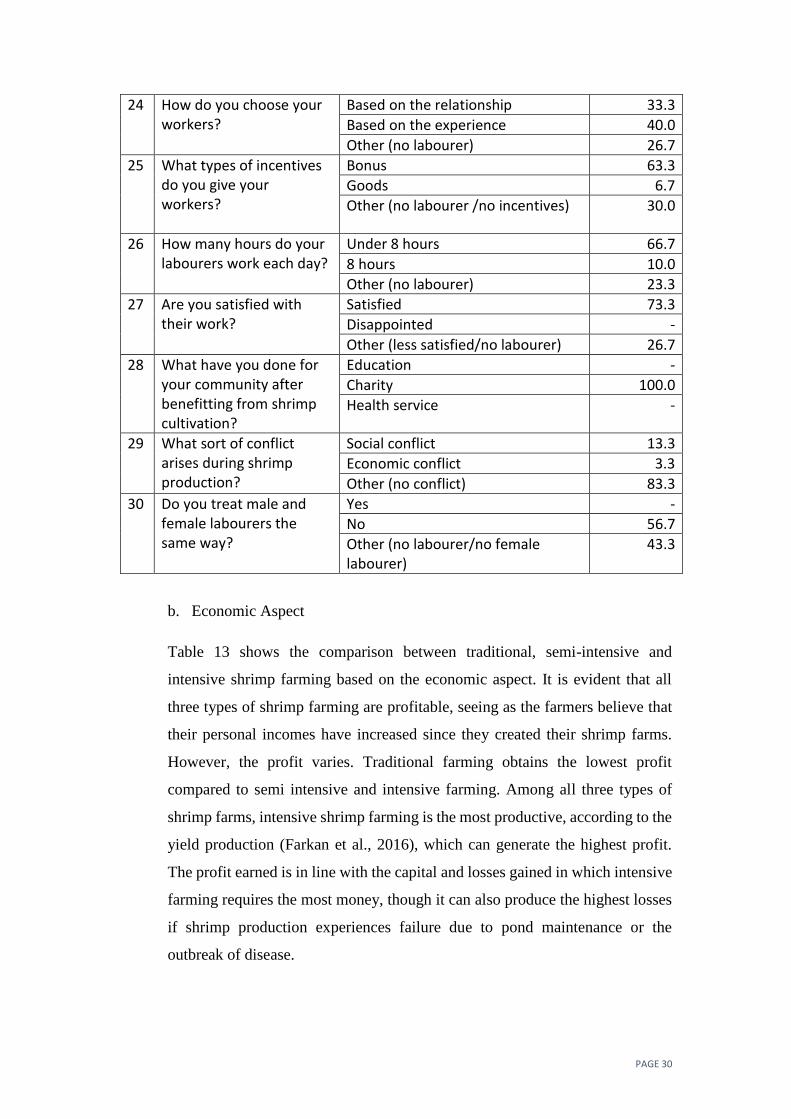
b. Economic Aspect
Table 13 shows the comparison between traditional, semi-intensive and
intensive shrimp farming based on the economic aspect. It is evident that all
three types of shrimp farming are profitable, seeing as the farmers believe that
their personal incomes have increased since they created their shrimp farms.
However, the profit varies. Traditional farming obtains the lowest profit
compared to semi intensive and intensive farming. Among all three types of
shrimp farms, intensive shrimp farming is the most productive, according to the
yield production (Farkan et al., 2016), which can generate the highest profit.
The profit earned is in line with the capital and losses gained in which intensive
farming requires the most money, though it can also produce the highest losses
if shrimp production experiences failure due to pond maintenance or the
outbreak of disease.

PAGE 31
It should be noted that to build a shrimp farm, farmers can self-finance for
traditional and intensive farms, although for semi-intensive, most farmers
secure bank loans which charge interest of 19% per year. To maximise profit,
most farmers sell their shrimp to multiple buyers without any difficulties.
Unfortunately, all shrimp farmers are still considering if non-renewable energy
is suitable for their farms, whilst most traditional shrimp farmers discard
effluent from their shrimp farming into the sea without any recycling treatment.
However, semi-intensive and intensive farmers have taken action to recycle the
waste produced by their shrimp farming from the fermentation process,
sedimentation and using septic tanks, which means they spend less than 3
million IDR per month to manage the waste.
Table 13. Economic data in shrimp farming
No Question Option Percentage (%)
Traditional Semi-intensive
Intensive
1. What is your family’s income after shrimp farming for the last three years?
Steady 10.0 20.0 10.0
Increase 60.0 70.0 60.0
Other (Fluctuate/decrease) 30.0 10.0 30.0
2 How much is your income per harvest?
0-20 million IDR 100.0 10.0 10.0
20-100 million IDR - 50.0 10.0
More than 100 million IDR - 40.0 80.0
3 Who buys your shrimp?
End consumer 20.0 - -
Trader (middlemen or exporter) 10.0 - -
Combination of buyers 70.0 100.0 100.0
4 What sort of difficulties do you have with regards to selling your shrimp?
Lack of market information - - -
No difficulties 70.0 80.0 90.0
Other difficulties (less quality/limited demand/size/prize)
30.0 20.0 10.0
5 0-20 million IDR 80.0 50.0 40.0

PAGE 32
Have you ever experienced loss? If yes, how much?
20-100 million IDR 20.0 20.0 10.0
More than 100 million IDR - 30.0 50.0
6 How much capital did you need to build your shrimp farm?
Less than 100 million IDR 100.0 50.0 -
100-500 million IDR - 20.0 20.0
More than 500 million IDR - 30.0 80.0
7 What is the source of your capital?
Self-capital 80.0 40.0 70.0
Bank loans 20.0 50.0 10.0
Other (multiple sources) - 10.0 20.0
8 What type of energy is used on your shrimp farm?
Renewable energy - - -
Non-renewable energy 100.0 100.0 100.0
Other - - -
9 How do you manage waste?
Discard 90.0 30.0 30.0
Recycle - 30.0 20.0
Other (fermentation/sedimentation/septic tank)
10.0 40.0 50.0
10 How much do you spend on managing your shrimp waste per month?
0-3 million IDR 100.0 100.0 100.0
3-6 million IDR - - -
More than 6 million IDR - - -
c. Environmental Aspect
Table 14 depicts the environmental aspect of shrimp farming with the type of
traditional, semi intensive and intensive farming. Intensive shrimp farming
covers the largest area in relation to shrimp ponds, which means the capacity of
the ponds is larger than traditional and semi-intensive farming. Practically all
the farmers buy seed from national hatcheries and feed from commercial feed
companies in the market. Commercial feed is usually composed of fishmeal in
different percentages, depending on the shrimp feed producers. To reduce
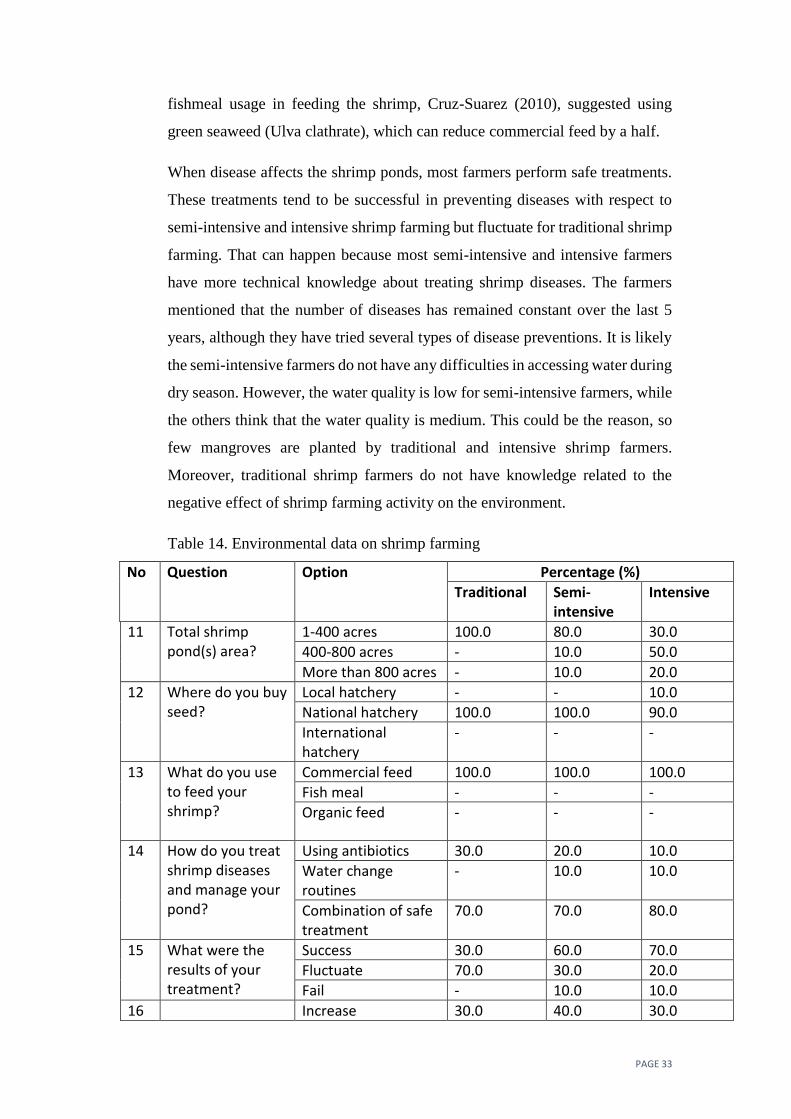
PAGE 33
fishmeal usage in feeding the shrimp, Cruz-Suarez (2010), suggested using
green seaweed (Ulva clathrate), which can reduce commercial feed by a half.
When disease affects the shrimp ponds, most farmers perform safe treatments.
These treatments tend to be successful in preventing diseases with respect to
semi-intensive and intensive shrimp farming but fluctuate for traditional shrimp
farming. That can happen because most semi-intensive and intensive farmers
have more technical knowledge about treating shrimp diseases. The farmers
mentioned that the number of diseases has remained constant over the last 5
years, although they have tried several types of disease preventions. It is likely
the semi-intensive farmers do not have any difficulties in accessing water during
dry season. However, the water quality is low for semi-intensive farmers, while
the others think that the water quality is medium. This could be the reason, so
few mangroves are planted by traditional and intensive shrimp farmers.
Moreover, traditional shrimp farmers do not have knowledge related to the
negative effect of shrimp farming activity on the environment.
Table 14. Environmental data on shrimp farming
No Question Option Percentage (%)
Traditional Semi-intensive
Intensive
11 Total shrimp pond(s) area?
1-400 acres 100.0 80.0 30.0
400-800 acres - 10.0 50.0
More than 800 acres - 10.0 20.0
12 Where do you buy seed?
Local hatchery - - 10.0
National hatchery 100.0 100.0 90.0
International hatchery
- - -
13 What do you use to feed your shrimp?
Commercial feed 100.0 100.0 100.0
Fish meal - - -
Organic feed - - -
14 How do you treat shrimp diseases and manage your pond?
Using antibiotics 30.0 20.0 10.0
Water change routines
- 10.0 10.0
Combination of safe treatment
70.0 70.0 80.0
15 What were the results of your treatment?
Success 30.0 60.0 70.0
Fluctuate 70.0 30.0 20.0
Fail - 10.0 10.0
16 Increase 30.0 40.0 30.0

PAGE 34
What do you think about diseases in shrimp culture over the last 5 years?
Decrease 10.0 - -
Average 60.0 60.0 70.0
17 Does it lack fresh water during the dry season?
Yes, it cannot be managed
20.0 - -
Yes, it can be managed
30.0 50.0 10.0
No 50.0 50.0 90.0
18 What do you think about the quality of water over the last 5 years?
Increase 30.0 30.0 30.0
Decrease 10.0 40.0 20.0
Average 60.0 30.0 50.0
19 How many mangroves have you planted?
Never 80.0 50.0 80.0
Less than 10 - - -
More than 10 20.0 50.0 20.0
20 Do you understand the side-effects of shrimp farming on the environment?
Yes, but not much 10.0 30.0 10.0
Yes, quite a lot - 20.0 60.0
No 90.0 50.0 30.0
d. Social Aspect
Table 15 describes the social aspect of traditional, semi-intensive and intensive
farming. Most traditional farmers do not employ workers to manage their
shrimp farms, whereas most semi-intensive and intensive farmers recruit 1-20
labourers aged 17 and 50. The farmers offer a salary that is less than 2 million
IDR per month, plus a bonus each harvest. This is different to the situation that
workers in Mexico face, where they are paid more than minimum wage (Dewalt
et al., 2002).
The labourers are usually selected based on experience and occasionally
according to their relationship with the farmers. Surprisingly, the working hours
of labourers in intensive farming, semi-intensive and traditional farming is less
than 8 hours per day. This might happen because of the cutting-edge technology
which can help workers to work efficiently and automatically, especially in
intensive farming (Dewalt et al., 2002). Traditional, semi-intensive and
intensive farmers are satisfied with the work of their labourers. Therefore, when
they obtain a good profit, they reward their workers and are charitable to their
local community. The charity is given in the form of money and shrimps. Due

PAGE 35
to social responsibility, it is not surprising that the farmers do not experience
any conflict with their community, the economy and the environment.
Regarding the female and male workers, the farmers admit they differentiate
between the tasks that the female and male labourers are given.
Table 15. Social data in shrimp farming
No Question Option Detail Percentage (%)
Traditional Semi-intensive
Intensive
21 How many labourers do you employ?
1-5 40.0 70.0 20.0
6-20 - 20.0 50.0
Other (no labourer/more than 20)
60.0 (no labourer)
10.0 (no labourer)
30.0 (more than 25 labourers)
22 How old are they? Under 17 - 10.0 -
17-50 years old 40.0 80.0 100.0
Other (no labourer) 60.0 (no labourer)
10.0 (no labourers)
-
23 How much do you pay them?
Under 2 million IDR 40.0 80.0 60.0
2-4 million IDR - 10.0 40.0
Other (no labourer) 60.0 (no labourer)
10.0 (no labourer)
-
24 How do you choose your workers?
Based on the relationship
40.0 50.0 10.0
Based on the experience
- 40.0 80.0
Other (no labourer) 60.0 (no labourer)
10.0 (no labourer)
10.0
25 What types of incentives do you give your workers?
Bonus 20.0 80.0 90.0
Goods 10.0 - 10.0
Other (no labourer /no incentives)
60.0 (no labourer) and 10.0 (no incentives)
10.0 (no labourer), 10.0 (no incentives)
-
26 How many hours do your labourers work each day?
Under 8 hours 40.0 70.0 90.0
8 hours - 20.0 10.0
Other (no labourer) 60.0 (no labourer)
10.0 (no labourer)
-
27 Are you satisfied with their work?
Satisfied 40.0 90.0 90.0
Disappointed - - -

PAGE 36
Other (less satisfied/no labourer)
60.0 (no labourer)
10.0 (no labourer)
10.0 (less satisfied)
28 What have you done for your community after benefitting from shrimp cultivation?
Education - - -
Charity 100.0 100.0 100.0
Health service - - -
29 What sort of conflict arises during shrimp production?
Social conflict 20.0 - 20.0
Economic conflict 10.0 - -
Other (no conflict) 70.0 (no conflict)
100.0 (no conflict)
80.0 (no conflict)
30 Do you treat male and female labourers the same way?
Yes - - -
No 20.0 60.0 90.0
Other (no labourer/no female labourer)
60.0 (no labourer), 10.0 (not sure), 10.0 (no female labourer
10.0 (no labourer), 30.0 (no female labourer)
10.0 (no female labourer)

e. Spearman significance test
Table 16. Result of the Spearman Significance Test
Income
trend Income per
harvest Types of
buyers Loss Capital Capital
source Waste
management Pond area
Source of seed
Shrimp diseases Treatment result
Income trend 1.000 -0.065 0.228 .444* 0.139 0.012 -0.258 0.113 0.038 0.089 0.101
Income per harvest -0.065 1.000 .372* .507** .700** 0.260 0.342 .505** -0.208 0.267 -0.238
Types of buyers 0.228 .372* 1.000 0.117 0.318 0.038 0.062 0.215 -0.062 0.049 -0.115
Loss .444* .507** 0.117 1.000 .456* 0.212 -0.074 .432* -0.265 0.142 0.077
Capital 0.139 .700** 0.318 .456* 1.000 0.257 .396* .719** -0.224 -0.033 -0.279
Capital source 0.012 0.260 0.038 0.212 0.257 1.000 0.174 0.182 0.138 0.182 -0.078
Waste management -0.258 0.342 0.062 -0.074 .396* 0.174 1.000 0.102 0.176 0.025 -.375*
Pond area 0.113 .505** 0.215 .432* .719** 0.182 0.102 1.000 -0.240 -0.039 -0.059
Source of seed 0.038 -0.208 -0.062 -0.265 -0.224 0.138 0.176 -0.240 1.000 -0.111 -0.339
Shrimp diseases 0.089 0.267 0.049 0.142 -0.033 0.182 0.025 -0.039 -0.111 1.000 -0.255
Treatment result 0.101 -0.238 -0.115 0.077 -0.279 -0.078 -.375* -0.059 -0.339 -0.255 1.000
Water supply -0.185 0.269 -0.249 0.179 0.286 0.046 -0.013 .484** -0.139 0.122 0.000
Knowledge of side-effects
0.048 #REF! -0.280 -0.120 -0.304 -.547** -0.351 -0.084 -0.156 -.406* 0.221
Labourers 0.224 -0.118 0.088 -0.057 0.077 0.039 -0.016 0.183 -0.035 -0.007 0.139
Age of labourers 0.163 -.422* -0.100 -0.276 -.429* -0.070 -0.175 -0.290 0.084 -0.078 0.251
Salary 0.031 -0.346 -0.001 -.370* -.366* -0.086 -0.147 -0.087 0.147 0.014 0.072
Choice of labourer 0.302 -0.078 0.113 -0.040 -0.044 0.066 -0.006 0.098 0.229 0.027 -0.007
Incentives 0.113 -.675** -.399* -0.212 -.612** -0.160 -0.237 -.391* 0.139 -0.128 0.199
Working hours 0.221 -.513** -0.032 -0.159 -.433* -0.141 -0.141 -0.208 0.129 -0.078 0.161
Satisfaction 0.143 -.421* -0.059 -0.293 -.484** -0.174 -0.143 -.389* 0.112 0.000 0.138
Conflict 0.241 0.086 0.138 0.167 0.027 0.332 0.219 -0.129 .431* -0.046 0.014

PAGE 38
Male/female equality -0.045 -.451* -.381* -0.144 -.462* -0.036 -.425* -0.261 -0.212 0.040 0.123
Water
supply
Knowledge of side-
effects
Labourers Age of
labourer
Salary Choice of
labourer
Incentives Working
hours
Satisfaction Conflict Male/female
equality
Income -0.185 0.048 0.224 0.163 0.031 0.302 0.113 0.221 0.143 0.241 -0.045
Income per harvest 0.269 -.514** -0.118 -.422* -0.346 -0.078 -.675** -.513** -.421* 0.086 -.451*
Buyers -0.249 -0.280 0.088 -0.100 -0.001 0.113 -.399* -0.032 -0.059 0.138 -.381*
Loss 0.179 -0.120 -0.057 -0.276 -.370* -0.040 -0.212 -0.159 -0.293 0.167 -0.144
Capital 0.286 -0.304 0.077 -.429* -.366* -0.044 -.612** -.433* -.484** 0.027 -.462*
Capital source 0.046 -.547** 0.039 -0.070 -0.086 0.066 -0.160 -0.141 -0.174 0.332 -0.036
Waste management -0.013 -0.351 -0.016 -0.175 -0.147 -0.006 -0.237 -0.141 -0.143 0.219 -.425*
Pond area .484** -0.084 0.183 -0.290 -0.087 0.098 -.391* -0.208 -.389* -0.129 -0.261
Seed -0.139 -0.156 -0.035 0.084 0.147 0.229 0.139 0.129 0.112 .431* -0.212
Shrimp diseases 0.122 -.406* -0.007 -0.078 0.014 0.027 -0.128 -0.078 0.000 -0.046 0.040
Treatment result 0.000 0.221 0.139 0.251 0.072 -0.007 0.199 0.161 0.138 0.014 0.123
Water supply 1.000 -0.112 -0.009 -0.270 -0.148 0.028 -0.186 -0.221 -0.180 -0.129 -0.037
Knowledge of side-effects -0.112 1.000 -0.198 0.022 0.042 -0.299 0.273 0.123 0.015 -0.226 0.187
Labourers -0.009 -0.198 1.000 .689** .695** .826** .436* .561** .574** -0.067 0.242
Age of labourers -0.270 0.022 .689** 1.000 .815** .758** .769** .851** .876** 0.000 .514**
Salary -0.148 0.042 .695** .815** 1.000 .692** .691** .766** .741** 0.000 .395*
Choice of labourers 0.028 -0.299 .826** .758** .692** 1.000 .457* .672** .724** 0.186 0.232
Incentives -0.186 0.273 .436* .769** .691** .457* 1.000 .838** .698** 0.001 .614**
Working hours -0.221 0.123 .561** .851** .766** .672** .838** 1.000 .791** 0.099 .580**
Satisfaction -0.180 0.015 .574** .876** .741** .724** .698** .791** 1.000 0.061 .537**
Conflict -0.129 -0.226 -0.067 0.000 0.000 0.186 0.001 0.099 0.061 1.000 -0.168
Male/female equality -0.037 0.187 0.242 .514** .395* 0.232 .614** .580** .537** -0.168 1.000
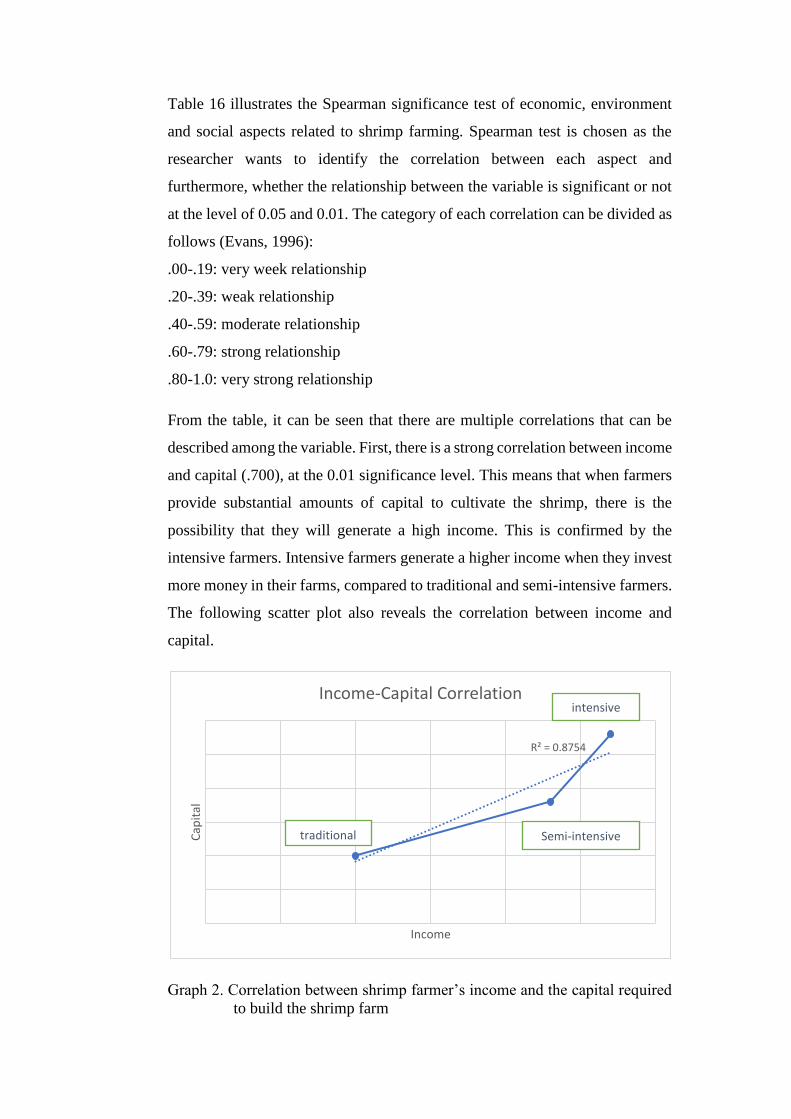
Table 16 illustrates the Spearman significance test of economic, environment
and social aspects related to shrimp farming. Spearman test is chosen as the
researcher wants to identify the correlation between each aspect and
furthermore, whether the relationship between the variable is significant or not
at the level of 0.05 and 0.01. The category of each correlation can be divided as
follows (Evans, 1996):
.00-.19: very week relationship
.20-.39: weak relationship
.40-.59: moderate relationship
.60-.79: strong relationship
.80-1.0: very strong relationship
From the table, it can be seen that there are multiple correlations that can be
described among the variable. First, there is a strong correlation between income
and capital (.700), at the 0.01 significance level. This means that when farmers
provide substantial amounts of capital to cultivate the shrimp, there is the
possibility that they will generate a high income. This is confirmed by the
intensive farmers. Intensive farmers generate a higher income when they invest
more money in their farms, compared to traditional and semi-intensive farmers.
The following scatter plot also reveals the correlation between income and
capital.
Graph 2. Correlation between shrimp farmer’s income and the capital required
to build the shrimp farm
R² = 0.8754
Cap
ital
Income
Income-Capital Correlation
traditional Semi-intensive
intensive

PAGE 40
Pond area and loss have a moderate connection (.432), which is significant at
0.05. It explains that there is a positive relationship between the shrimp pond
area and loss of production regarding shrimp cultivation. If the pond area is
large, it will accommodate more shrimps. However, if a shrimp is infected by
disease, all the ponds can be contaminated, which leads to a loss of production
relating to shrimp cultivation. The following scatter plot also depicts the
correlation between pond area and loss.
Graph 3. Correlation between the shrimp farm pond area and loss of production
on the shrimp farm
Furthermore, there is a moderate relationship (.456) between loss and capital. It
stands significantly at 0.05. This confirms that when the farmers provide
substantial sums of capital to cultivate the shrimp, there is the possibility that
they might experience considerable loss. In short, the higher the capital is the
greater the possibility that the farmers experience loss or take risks. The
subsequent scatter plot also presents the correlation between loss and capital.
R² = 0.8622
Loss
Pond Area
Pond Area-Loss Correlation
traditional
Semi-intensive
intensive
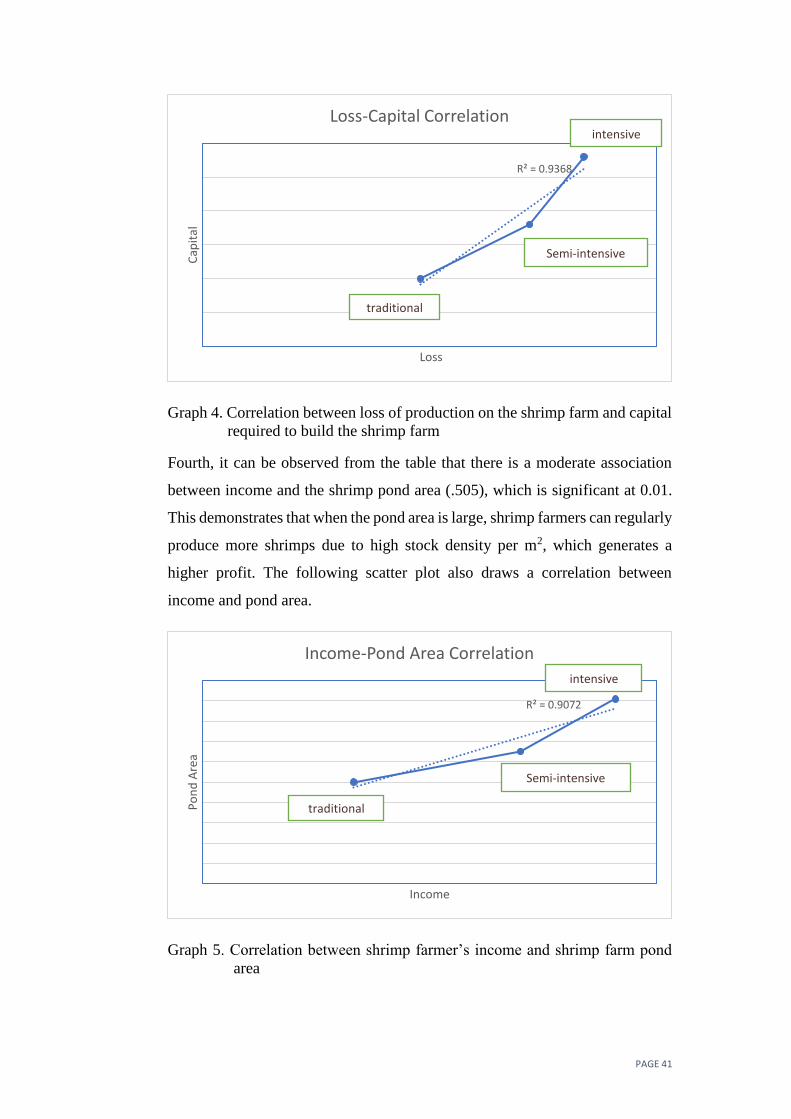
PAGE 41
Graph 4. Correlation between loss of production on the shrimp farm and capital
required to build the shrimp farm
Fourth, it can be observed from the table that there is a moderate association
between income and the shrimp pond area (.505), which is significant at 0.01.
This demonstrates that when the pond area is large, shrimp farmers can regularly
produce more shrimps due to high stock density per m2, which generates a
higher profit. The following scatter plot also draws a correlation between
income and pond area.
Graph 5. Correlation between shrimp farmer’s income and shrimp farm pond
area
R² = 0.9368
Cap
ital
Loss
Loss-Capital Correlation
traditional
Semi-intensive
intensive
R² = 0.9072
Po
nd
Are
a
Income
Income-Pond Area Correlation
traditional
Semi-intensive
intensive
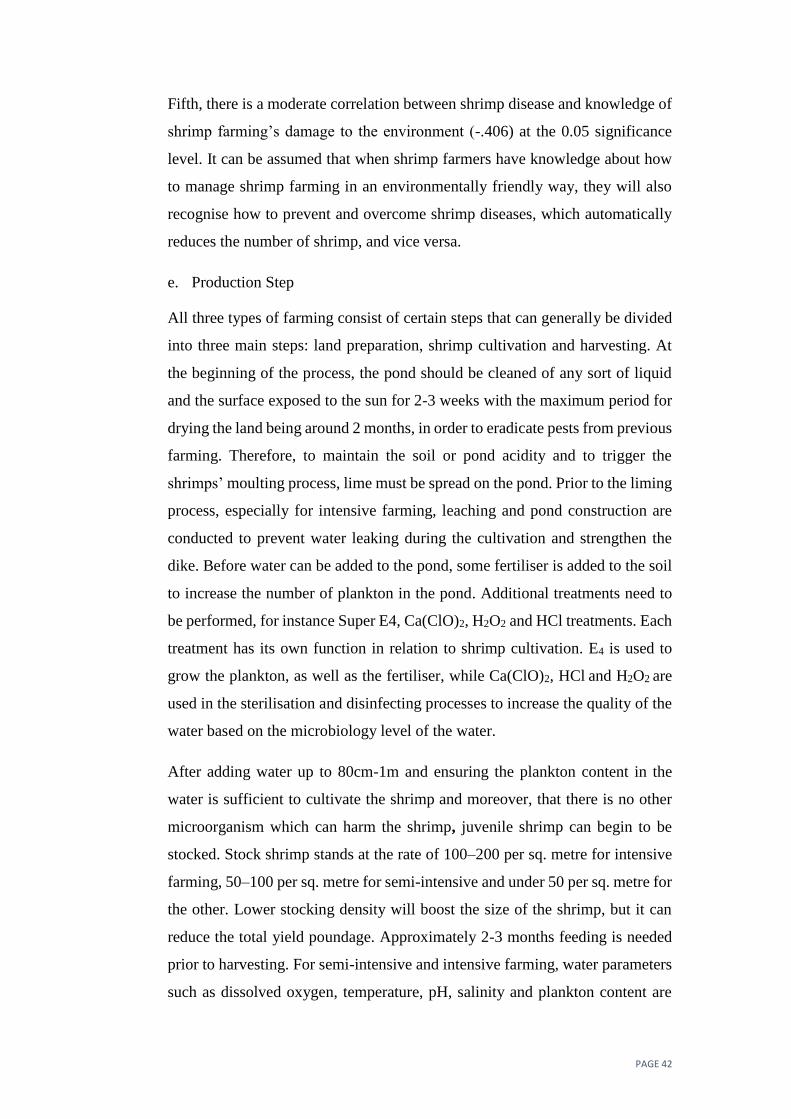
PAGE 42
Fifth, there is a moderate correlation between shrimp disease and knowledge of
shrimp farming’s damage to the environment (-.406) at the 0.05 significance
level. It can be assumed that when shrimp farmers have knowledge about how
to manage shrimp farming in an environmentally friendly way, they will also
recognise how to prevent and overcome shrimp diseases, which automatically
reduces the number of shrimp, and vice versa.
e. Production Step
All three types of farming consist of certain steps that can generally be divided
into three main steps: land preparation, shrimp cultivation and harvesting. At
the beginning of the process, the pond should be cleaned of any sort of liquid
and the surface exposed to the sun for 2-3 weeks with the maximum period for
drying the land being around 2 months, in order to eradicate pests from previous
farming. Therefore, to maintain the soil or pond acidity and to trigger the
shrimps’ moulting process, lime must be spread on the pond. Prior to the liming
process, especially for intensive farming, leaching and pond construction are
conducted to prevent water leaking during the cultivation and strengthen the
dike. Before water can be added to the pond, some fertiliser is added to the soil
to increase the number of plankton in the pond. Additional treatments need to
be performed, for instance Super E4, Ca(ClO)2, H2O2 and HCl treatments. Each
treatment has its own function in relation to shrimp cultivation. E4 is used to
grow the plankton, as well as the fertiliser, while Ca(ClO)2, HCl and H2O2 are
used in the sterilisation and disinfecting processes to increase the quality of the
water based on the microbiology level of the water.
After adding water up to 80cm-1m and ensuring the plankton content in the
water is sufficient to cultivate the shrimp and moreover, that there is no other
microorganism which can harm the shrimp, juvenile shrimp can begin to be
stocked. Stock shrimp stands at the rate of 100–200 per sq. metre for intensive
farming, 50–100 per sq. metre for semi-intensive and under 50 per sq. metre for
the other. Lower stocking density will boost the size of the shrimp, but it can
reduce the total yield poundage. Approximately 2-3 months feeding is needed
prior to harvesting. For semi-intensive and intensive farming, water parameters
such as dissolved oxygen, temperature, pH, salinity and plankton content are

PAGE 43
monitored regularly to maintain water quality and prevent diseases harming the
shrimp.
Most shrimp farmers usually do sampling each week prior to selling the shrimps
to the buyer or middleman, so as to determine the size and quality of the shrimp.
In brief, the harvesting is conducted twice to reduce the risk of shrimp mortality
and produce bigger shrimp in the second harvest. The first harvesting is called
partial harvesting, whereas the second harvesting is termed ‘complete
harvesting’.
(1)
(2)
(3)
Figure 2. (1) Traditional Farm, (2) Semi-Intensive Farm, (3) Intensive Farm
Harvesting
Feeding
Stocking of fry
Watering
Liming
Pond Drying
Feeding
Stocking of fry
Medicating
Watering
Liming
Pond Drying
Harvesting
Treatment
Stocking of fry
Watering, water sterilisation and medicating
Pond Sterilisation and Liming
Construction recovery
Leaching
Pond Drying
Pond Management
Feeding
Harvesting
Sampling

PAGE 44
f. The biggest challenges with regards to cultivating shrimp
Table 17 reveals the principal challenges for farmers relating to cultivating
shrimp. It can be observed that intensive farmers do not have any difficulties in
providing capital to build the shrimp farms, whereas 40% of traditional farmers
and 50% of semi intensive farmers still consider capital to be their biggest
challenge. This can occur because most intensive farmers are part of the
privileged class and have the finance to invest in the shrimp farming. Intensive
farming on average requires more than 500 million IDR in capital (intensive
farmers interview).
A further challenge that traditional and semi-intensive farmers face is with
regard to the water supply. The lack of advanced technology to pump the water
from the sea to the ponds for that type of shrimp means that the water supply is
occasionally limited. Regarding intensive farming, the water supply can be
managed easily thanks to the cutting-edge facilities that intensive farmers own.
In relation to traditional and semi-intensive farming, there is no issue pertaining
to labour management given that both types of farms have fewer labourers
compared to intensive farms, which can employ up to 100 employees. However,
three shrimp farmers stated shrimp diseases are the greatest challenge. Until
now, they have not yet found any treatment which can eradicate shrimp diseases
completely. It is indicated that inappropriate pond management is the main
reason for disease outbreaks (Hanafi & Ahmad, 1999). As such, what shrimp
farmers can do is combine safe treatments to attempt to eliminate the diseases.
The second biggest challenge for intensive farming is electricity since large
ponds require higher voltage to operate paddlewheel aerators, which is
expensive to generate. This means intensive farming is less sustainable, seeing
that the consumption of electricity is higher than traditional and semi-intensive
farming (Dewalt et al., 2002). Furthermore, if access to electricity is limited, the
shrimps cannot gain sufficient oxygen to survive in the ponds.
Table 17. The biggest challenges shrimp farmers face
Type of Farm The biggest Challenges
Traditional Capital, diseases, water supply, shrimp feed, weather,
technical problem

PAGE 45
Semi Intensive Capital, diseases, water supply, weather, technical skills
Intensive Diseases, labour management, electricity
g. Government expectation
Table 18 shows the government’s expectation of each type of farmer. Both
traditional and semi-intensive shrimp farmers require comprehensive support
from the government, such as facilities, feed and seed subsidies, whereas very
few intensive shrimp farmers need clear regulation related to the legalisation
and sustainability of shrimp farming. Those requirements are according to the
statement made by BPS (2016), in which legal production is important to
increase the performance and obtain trustworthy information related to the
sustainable shrimp supply chain. Therefore, the government needs to provide
understandable regulation for shrimp supply chain players, including shrimp
farmers (Sverdrup, 2017). It should be mentioned that the remaining intensive
shrimp farmers (60%) do not have any expectation of the government since they
have the ability to manage their shrimp farms independently. They are already
supported by large companies which offer a win-win solution for their shrimp
cultivation. For example, a company will offer free technical assistance about
how to cultivate shrimp properly. To compensate for the free service,
intensive farmers are required to buy the seed and shrimp feed which is
produced by the company.
Yet again, traditional and semi-intensive shrimp farmers state that to build
appropriate shrimp farms which are sustainable requires additional support,
given that they do not have the ability to acquire the best facilities. This is due
to a lack of capital as the facilities are expensive for traditional and semi-
intensive farmers to purchase. Moreover, to afford expensive shrimp seed and
feed, traditional and semi-intensive farmers obviously require loans from a bank
or friends/family. That is the reason why both farmers ask the government to
provide them with shrimp seed and feed subsidies. Furthermore, it is
particularly important for semi-intensive farmers to obtain loans that do not
have excessive interest, such as loans offered by Bank Indonesia, which is
approximately 19% per year. High interest rates have reduced the maximum
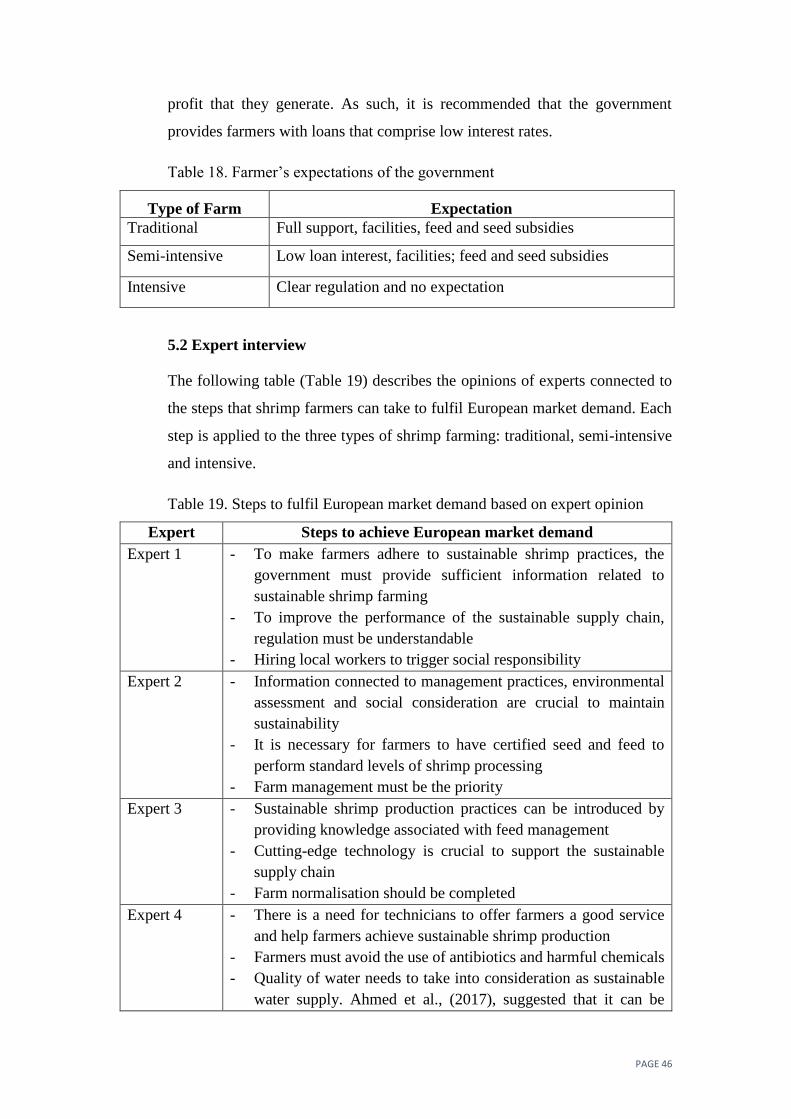
PAGE 46
profit that they generate. As such, it is recommended that the government
provides farmers with loans that comprise low interest rates.
Table 18. Farmer’s expectations of the government
Type of Farm Expectation
Traditional Full support, facilities, feed and seed subsidies
Semi-intensive Low loan interest, facilities; feed and seed subsidies
Intensive Clear regulation and no expectation
5.2 Expert interview
The following table (Table 19) describes the opinions of experts connected to
the steps that shrimp farmers can take to fulfil European market demand. Each
step is applied to the three types of shrimp farming: traditional, semi-intensive
and intensive.
Table 19. Steps to fulfil European market demand based on expert opinion
Expert Steps to achieve European market demand
Expert 1 - To make farmers adhere to sustainable shrimp practices, the
government must provide sufficient information related to
sustainable shrimp farming
- To improve the performance of the sustainable supply chain,
regulation must be understandable
- Hiring local workers to trigger social responsibility
Expert 2 - Information connected to management practices, environmental
assessment and social consideration are crucial to maintain
sustainability
- It is necessary for farmers to have certified seed and feed to
perform standard levels of shrimp processing
- Farm management must be the priority
Expert 3 - Sustainable shrimp production practices can be introduced by
providing knowledge associated with feed management
- Cutting-edge technology is crucial to support the sustainable
supply chain
- Farm normalisation should be completed
Expert 4 - There is a need for technicians to offer farmers a good service
and help farmers achieve sustainable shrimp production
- Farmers must avoid the use of antibiotics and harmful chemicals
- Quality of water needs to take into consideration as sustainable
water supply. Ahmed et al., (2017), suggested that it can be
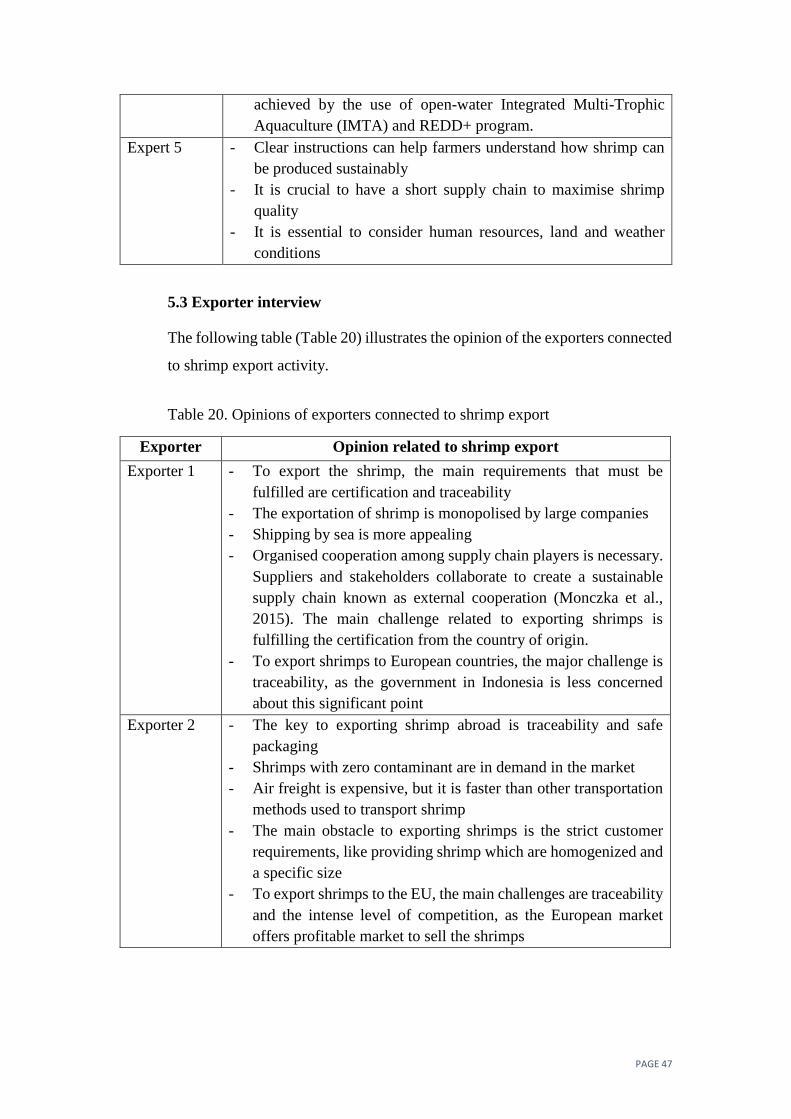
PAGE 47
achieved by the use of open-water Integrated Multi-Trophic
Aquaculture (IMTA) and REDD+ program.
Expert 5 - Clear instructions can help farmers understand how shrimp can
be produced sustainably
- It is crucial to have a short supply chain to maximise shrimp
quality
- It is essential to consider human resources, land and weather
conditions
5.3 Exporter interview
The following table (Table 20) illustrates the opinion of the exporters connected
to shrimp export activity.
Table 20. Opinions of exporters connected to shrimp export
Exporter Opinion related to shrimp export
Exporter 1 - To export the shrimp, the main requirements that must be
fulfilled are certification and traceability
- The exportation of shrimp is monopolised by large companies
- Shipping by sea is more appealing
- Organised cooperation among supply chain players is necessary.
Suppliers and stakeholders collaborate to create a sustainable
supply chain known as external cooperation (Monczka et al.,
2015). The main challenge related to exporting shrimps is
fulfilling the certification from the country of origin.
- To export shrimps to European countries, the major challenge is
traceability, as the government in Indonesia is less concerned
about this significant point
Exporter 2 - The key to exporting shrimp abroad is traceability and safe
packaging
- Shrimps with zero contaminant are in demand in the market
- Air freight is expensive, but it is faster than other transportation
methods used to transport shrimp
- The main obstacle to exporting shrimps is the strict customer
requirements, like providing shrimp which are homogenized and
a specific size
- To export shrimps to the EU, the main challenges are traceability
and the intense level of competition, as the European market
offers profitable market to sell the shrimps

PAGE 48
5.4 Stakeholder interview
Table 21 reveals the opinions of the stakeholders related to what the government
have accomplished to help shrimp farmers achieve sustainable shrimp farming.
Support in the form of facilities, training and assistance from the government is
commonly applied to traditional and semi-intensive shrimp farms, while
intensive farming receives support for shrimp pond legalisation and
certification. This is due to the complexity of the certification process which can
be triggered by poor shrimp culture management (Hanafi & Ahmad, 1999).
Table 21. Opinions of stakeholder on their role in helping shrimp farmers
Stakeholder Opinion related to government aid for shrimp farmers
Stakeholder 1 Sustainability is the way that the region can maintain its resources
so that the younger generation can use them. To achieve it, the
government have already given the farmers:
- Support (grant for small farmers, seed subsidy, shrimp farming
assurance)
- Facilities (excavators)
- Training (technical assistance)
- Programme (socialisation connected to legality and
certification, and land certification)
Stakeholder 2 Sustainability is the condition where there is no illegal exploitation
of the environment. To achieve sustainable shrimp farming, the
government have given:
- Facilities (excavators, seed, feed, roads)
- Programme (thermo king car to maintain the temperature of the
shrimp)
- Training (comparative study)
- Support (grant, seed subsidy)
Stakeholder 3 Sustainability ensures that shrimp production is environmentally
friendly. To attain sustainable shrimp farming, the government have
offered:
- Programme (Free product certification)
- Training (HACCP implementation)
- Support (disease inspection)

PAGE 49
5.5 Middlemen interview
The following table (Table 22) depicts the role of the middlemen as traders in
the shrimp supply chain.
Table 22. Abilities of the middlemen as traders in the shrimp supply chain
Middleman Opinions related to the middleman’s ability as a trader
Middleman 1 - The tools that I need to transport the shrimp from farmers to the
local market are a pickup truck, styrofoam and ice. By
preserving the shrimps in ice, directly after harvesting means the
quality is preserved (Lai & Ye, 2017).
- The maximum of shrimp bought is 1 ton/harvest
- Direct selling method
- The main challenge as the middleman is managing the inventory
when the market is sluggish
Middleman 2 - The tools that I need to transport the shrimp from farmers to the
market nationally are a pickup truck, styrofoam and ice
- The maximum capacity of shrimp bought is 0.5 ton/harvest
- Direct selling method
- The key challenge as a trader is market saturation
Middleman 3 - The tools that I need to transport the shrimp from farmers to the
local market are a pickup truck, styrofoam, freezer and ice
- The maximum capacity of shrimp bought is 4 ton/harvest
- The main obstacle as the middleman is managing the
availability of the shrimps when demand is high
Middleman 4 - The tools that I need to transport the shrimp from farmers to the
local market are a pickup truck, styrofoam and ice
- The maximum capacity of shrimp bought is 1 ton/harvest
- Direct selling method
- The principal challenge as the middleman is maintaining the
quantity of the shrimp when demand is high and low
Middleman 5 - The tools that I need to transport the shrimp from farmers to
markets locally and nationally are a pickup truck, styrofoam and
ice
- The maximum capacity of shrimp bought is 0.4 ton/harvest
- Direct selling method
- The main challenge is the restricted bidding opportunity since
the national company has set up a basic price for shrimp when I
- sell the shrimp outside the island

PAGE 50
6. Discussion
6.1 European market demands for sustainable shrimp
In general, to enable the shrimp to be sold in Europe, there are
requirements that should be completed (European Commission, 2018):
a. The exporting country should be on the list of authorised countries.
Additionally, 166 countries have been approved by the European Union
to export their aquaculture products. Indonesia is one of those countries.
The list is made according to evaluation undertaken by the European
Union Food and Veterinary Office to meet EU standards.
b. Shrimps are cultivated by registered farms or authorised vessels.
Therefore, the origin of the shrimp should be evident and traceable.
c. Shrimps are processed by appropriate and standard processing methods
which are authorised by central government like the Ministry of
Aquaculture, etc. This aims to provide shrimp which is free from
contaminants. Contaminants are defined as the existence of unwanted
substances composing cadmium, mercury, polychlorinated biphenyls
(PCBs) and polycyclic aromatic hydrocarbons (PAHs). The country of
origin must send an annual report to the European Union regarding the
residue management.
d. Shrimps are certified by way of genuine certification which is required
by the European Union, for instance ASC, HACCP, etc. Shrimp
certification also needs to be approved by the government to combat
illegal fishing and a catch certificate must be accompanied by fish
imported or trans-shipped to the European Union. Exporters must
request a catch certificate for catches destined for the European Union.
If a country fails to adhere to the European guidelines to prevent and
eliminate illegal, unreported and unregulated (IUU) fishing, it risks a
temporary ban from the seafood market in the European Union.
e. Shrimps must have food labelling which contains commercial
symbolisation and the scientific names of each species, information
related to the production method, catch area (sea, fresh water,
aquaculture, mixed), facilities employed to catch the fish product
(trawls, dredges, seines, etc), country of origin, net weight in kg, expiry

PAGE 51
date, exporter information, shrimp specification (size, freshness, etc)
and defrosting information. Certification label seafood products, such as
ASC which is the most important certification regarding aquaculture,
has rapidly gained market share in several European markets in recent
years. Countries in Europe, especially the Netherlands, are the leading
markets for sustainable seafood.
Figure 3. Sample label for an unprocessed and pre-packed fresh fish product (CBI)
f. Nutritional value information must be attached to the shrimp label.
Furthermore, energy value, fat content, saturates, carbohydrates, sugars,
protein and salt per 100g or per 100ml should be provided at least.
Specific regulation related to the traceability which is required to achieve
sustainable shrimp, can be found in Council Regulation (EC) No 1224/2009
of 20 November 2009 establishing a community control system for ensuring
compliance with the rules of the common fisheries policy, amending
Regulations (EC) No 847/96, (EC) No 2371/2002, (EC) No 811/2004,
(EC) No 768/2005, (EC) No 2115/2005, (EC) No 2166/2005, (EC)
No 388/2006, (EC) No 509/2007, (EC) No 676/2007, (EC) No 1098/2007,
(EC) No 1300/2008, (EC) No 1342/2008 and repealing Regulations (EEC)
No 2847/93, (EC) No 1627/94 and (EC) No 1966/2006.
6.2 The necessary changes in supply chain practices in Indonesia in order to
comply with the demand for sustainable shrimp in the European market

PAGE 52
Prior to describing important changes in shrimp supply chain practices, it is
important to recognise the current supply chain practices of shrimp in NTB,
Indonesia. The following figure illustrates current practices regarding the
shrimp supply chain in Indonesia.
Figure 4. Current supply chain of shrimp in NTB, Indonesia
The shrimp supply chain in Indonesia is divided into three parts. First,
before producing the shrimp, farmers should prepare the seed, feed and
facilities that are required to operate in shrimp farming. This is termed ‘pre-
cultivation’. Seed and feed are obtained from national hatcheries and
commercial feed companies. Similar to shrimp feed manufacturers in
Thailand (Ongsritrakul and Hubbard, 1996), shrimp feed companies in
Indonesia have numerous facilities, such as multiple types of laboratories:
chemistry laboratories, etc, for analysing the shrimps chemically and
microbiologically, besides the latest technology for each processing and
shrimp centre in many cities in Indonesia.
The second component is the cultivation of shrimp. Shrimp farmers in
Indonesia commonly use 3 types of shrimp farm; specifically, traditional,
semi-intensive and intensive (see Figure 4) (Diana, 2009). All the shrimp
farms have a period of cultivation that lasts for around 3-4 months.
Farmer
Intensive or
Semi-intensive
Traditional
Export
sized
shrimp
Under
sized
shrimp
Exporter
Middlemen
Local buyer
Pre-
Cultivation
Cultivation Post-Cultivation

PAGE 53
The third factor is post-cultivation. When the shrimp is harvested, there will
be under sized shrimp and export sized shrimp. Under sized shrimp has a
size which is more than 100 (size category), meaning that 1kg comprises
more than 100 shrimps. This type of shrimp is sold to middlemen at a low
price before the shrimp is distributed to the local market. Export sized
shrimp is around 20-70 in size, farmers sell the shrimp to the exporters via
national traders. National traders choose the shrimp from the ponds during
harvesting day. Subsequently, they select shrimp based on the size and
quality before the shrimp is stored in cold storage in the thermo-king cars.
It needs 20-25 hours approximately to distribute shrimp from NTB to the
export company in another province, East Java. NTB has not been able to
store and export their own shrimp because NTB does not have an export
port and local cold storage yet (Stakeholder 3). Moreover, a short supply
chain is necessary to maintain the quality of the shrimp (Expert 5).
To comply with the demands of the European market concerning sustainable
shrimp, several changes which are necessary. Sustainable shrimp can be
implemented when each of the actors collaborate cooperatively (Experts 1,
4 & 5, Exporter 1). Cooperation is necessary to ensure labelling and
certification is undertaken quickly. In Indonesia, the government has
established standard certification, namely CBIB, which stands for “Cara
Berbudidaya Ikan yang Baik”. In English, it is known as Good Aquaculture
Cultivation. CBIB was developed to encourage farmers to show more
concern on environmental, economic and social aspects. Since 2010, the
government has harmonised the concept of CBIB and FAO Guidelines for
Aquaculture Certification, ASEAN Guidelines for Food Fish and ASEAN
Shrimp Alliance (ASA) and Shrimp GAP to bolster product competitiveness
in the national and international market (Stakeholder 1). This is quite similar
to Thailand. In Thailand, the government created the Thai Code and
Conduct Standard (Nissapa et al., 2002) and GAP programme (NACA,
2017) to comply with the hygiene standards for aquaculture products and
prevent antibiotic application in aquaculture practices.
To maintain the quality of shrimp, it is necessary to have a short supply
chain and build cold storage places for shrimp on each island (Expert 5).

PAGE 54
Chkanikova et al. (2014), assumed that a short supply chain can be achieved
by introducing eco-labelling to the supply chain players, since in eco
labelling, products are bought from local farmers without interference from
the middleman. This will make traceability and direct communication with
farmers easier.
6.3 The challenges and solutions in relation to complying with the
sustainable shrimp demands of the European market
Shrimp farmers in NTB face difficulties in marketing their shrimps
nationally and internationally due to the geographical distance to Europe. In
this case, it is more about maintaining the quality of shrimp when it is
distributed from one island to another. A long supply chain can trigger
prohibitive costs regarding shrimp distribution and low-quality shrimp.
Moreover, the lack of accessibility to small villages due to limited transport
routes has made the distribution and quality of shrimp deteriorate (Expert
3).
Next, information related to sustainability and the European market remains
inadequate among shrimp farmers (Expert 1). Stakeholders said that they
have given information related to sustainability to the farmers, although the
farmers believe that the government has never given them any information
about sustainability. However, by looking at their responses, it was
discovered that farmers do not fully understand sustainability due to their
lack of knowledge about the side-effects of shrimp farming on the
environment. Mol (2014), said that accurate information related to
sustainability is quite difficult to obtain given that the source of information
is occasionally different. This can confuse the supply chain players
regarding defining what sustainable shrimp farming is. The survey revealed
that each stakeholder has different perceptions related to sustainable shrimp
farming. Consequently, shrimp farmers have less interest in performing
sustainable shrimp farming practices because they do not understand the
value of these specific practices.
To overcome the challenges related to fulfilling sustainable shrimp
practices, there are many solutions that supply chain players can take.
PAGE 55
Increasing the quantity of training, socialisation and programmes for
creating sustainable shrimp farming can encourage shrimp farmers to be
more aware of sustainable shrimp farming (Stakeholders 1 & 3). These
activities can have an impact on shrimp farmers understanding of
sustainability and good pond management (Ha, Bush et al., 2012).
Conversely, the government should treat shrimp farmers as partners to
achieve sustainable shrimp farms rather than easy targets to benefit from
certification or regulation. In this case, shrimp farmers and the government
should find a win-win solution to achieve the sustainable shrimp supply
chain. For instance, by giving seed and feed subsidies to shrimp farmers, the
production of sustainable shrimp can be enhanced. This can stimulate the
production of shrimps according to the government regulation. As such,
farmers can generate profit and the goal of the government to create a shrimp
supply chain that is sustainable can be achieved.
Collaboration among all supply chain players is ultimately important to
improve the quality and quantity of sustainable shrimp. It can start by
developing a multi-stakeholder federation and flexibility (continuity) of
shrimp production, which are arranged by global governance, besides
maintaining the intensity of inspections so standards are met so that there is
integration in all aspects of sustainability (Bostrom, 2015). Additionally,
continuous coordination with NGOs which organises the certification, like
ASC by OXFAM Novib, is also necessary because they can provide in-
depth information related to sustainable fishing, encourage shrimp farmers
to comply with sustainability and provide knowledge about the international
market when shrimp farmers meet the certification standard.
Furthermore, Heli and Babri (2014), suggest corporate codes of ethics for
the suppliers to support the sustainable supply chain. The codes should be
translated easily by the suppliers. In Sweden, the CEO of a company
regularly informs employees how to implement corporate codes of ethics
related to the sustainable supply chain. This is supposed to be adapted to the
shrimp supply chain in Indonesia. Furthermore, exporters as the bridge
between farmers and consumers in Europe, should be able to give
PAGE 56
information about the meaning of sustainability to the supply chain players.
As such, the sustainable supply chain can be established comprehensively.
Lengthy supply chains can be overcome by improvements in technology,
systems and networks (Jain & Benyoucef, 2008). Transportation technology
employed for logistical reasons to preserve shrimp quality is vital to keep
the sustainable supply chain. By doing so, the cost and energy can be more
efficient. Furthermore, the technology related to payments is also necessary
to maintain the relationship between farmers and suppliers, and even with
buyers. To create an effective system, the schedule of each activity in the
supply chain should be more integrated. For instance, the schedule for
harvesting shrimp should be integrated with the schedule for trader activity.
Additionally, to build the network and close relationships among
participants in the supply chain, information flows related to the sustainable
shrimp supply chain should be distributed optimally.
7. Problems and Limitations
- Since this research has used the case study method, the information
collected cannot be used to make a generalisation regarding the issues
shrimp farmers face in relation to complying with European demands.
Farmer’s issues related to sustainability in Indonesia cannot be generalised
to those in other countries. However, it can be generalised to other provinces
in Indonesia given that the environment, economy and social aspects are
similar.
- Research has been conducted in one province in Indonesia, West Nusa
Tenggara where white leg shrimp (Litopenaeus Vannamei) is farmed, since
this type is the most common commodity in the province. Therefore, the
data cannot represent the supply chain of shrimp in another location in
Indonesia.
- No exporters are available in West Tenggara Barat, which meant that the
researcher had no exporters to interview. To tackle this problem, the
researcher contacted exporters from another province (Java). As the
exporters come from large companies, only two were willing to be
interviewed.

PAGE 57
- The target of 70 respondents, consisting of 50 farmers, 5 experts, 5
exporters, 5 stakeholders and 5 middlemen had to be reduced to 45,
consisting of 30 farmers, 5 experts, 2 exporters, 3 stakeholders and 5
middlemen because there were restrictions related to obtaining information
from them, for instance, the researcher required more time to conduct the
research and contact the respondents.
8. Conclusion
1. Shrimp farms in Indonesia consist of three types of ponds, such as
traditional, semi-intensive and intensive. Semi-intensive farming is suitable
due to the sustainable aspects; specifically, environmental, economic and
social factors. This result is consistent with the statement of Kusumastanto
et al., (1998), which suggested that the most appropriate type of shrimp farm
for Indonesian shrimp farming is medium scale semi-intensive farming.
Shrimp farmers in Indonesia face many problems when they try to comply
with sustainable shrimp which is demanded by the European market, some
of which are high capital, less awareness and less support from the
government. If these obstacles can be removed, it is predicted that farmers
in Indonesia can export sustainable shrimp to European countries.
2. To achieve the sustainable supply chain of shrimp, farmers in Indonesia
need to do several activities, such as:
a. The regulation related to sustainable shrimp production must be clear
and understandable for farmers
b. A sustainable shrimp foundation needs to be created
c. It is recommended that farmers own certified seed and feed to set shrimp
processing standards
d. The latest technology in shrimp production is required given that this
can influence the quality of shrimp. For example, the type of
paddlewheel aerator can affect the quantity of oxygen in the pond
e. Shrimp feed must be prebiotic and not contain any antibiotics and
banned chemical compounds
f. The short supply chain can preserve the quality of shrimp because fresh
shrimp is more appealing to customers
PAGE 58
g. Cooperation between supply chain players is vital to maintain the
availability of high quality shrimp
h. As Indonesia is an archipelago, cold storage is beneficial for each island
to create the short supply chain.
3. The obstacles to complying with sustainable shrimp are:
a. The European market places certification as the most crucial aspect to
determine the quality of products, especially shrimp. In Indonesia,
shrimp certification among farmers remains rare. The reasons for this
are:
- Farmers are not interested in certification because it is expensive
for them. For instance, to manage shrimp waste, farmers have to
spend a great deal of money, which means that it is generally
unaffordable.
- Bureaucracy in Indonesia is extremely complicated which affects
farmers awareness about certifying their shrimp. This is supported
by Hanafi and Ahmad (1999), who claim that the complexity of
certification in shrimp farming can happen due to the lack of
knowledge regarding the certification process.
b. Farmers on the small islands receive less support from the government,
which is a huge challenge for them. For instance, the failure to provide
shrimp farmers with loans, as well as the lack of feed and seed subsidies.
Meanwhile, Yi et al. (2016), suggested that the government should
provide loans for small farmers, so that shrimp farmers can fulfil
European market demands.
4. The challenges that farmers face to comply with sustainable shrimp can be
solved by the following steps:
a. Increase farmers awareness in connection with shrimp certification by
regular socialisation, training and meetings with the government.
b. Cooperation with specialists, such as companies with an excellent
reputation in handling shrimp is a must, to improve the quantity and
quality of shrimp. Furthermore, cooperation with the government and
suppliers can be more advantageous (Monczka et al., 2015).

PAGE 59
9. Recommendations
The following recommendation are proposed:
a. The government is required to offer small shrimp farmers full support, by means of
low interest loans, feed and seed subsidies and suitable facilities.
b. Cooperation between supply chain shrimp payers is crucial to bolster sustainable
shrimp farms, seeing as the sustainability issues are not a simple case that can be
solved by an independent group or organisation. There should be partnerships
among all the shrimp supply chain players.
c. Design an efficient sustainable supply chain by optimising technology, systems and
networks throughout the supply chain.
d. Further research related to the sustainable supply chain which involves importers
or buyers from the European market is required, given that this research lacks
information from those supply chain participants.

PAGE 60
References
Ahmed, N., Cheung, W. W., Thompson, S., & Glaser, M. (2017). Solutions to blue
carbon emissions: Shrimp cultivation, mangrove deforestation and climate
change in coastal Bangladesh. Marine Policy, 82, 68-75.
Alam, S. N., & Pokrant, B. (2009). Re-organizing the shrimp supply chain: aftermath
of the 1997 European union import ban on the Bangladesh shrimp. Aquaculture
Economics & Management, 13(1), 53-69.
American Chamber of Commerce of Europe, 2004. European Union Environmental
Guide 2004. American Chamber of Commerce of Europe, Brussels, Belgium.
Barbier, E. B., & Cox, M. (2002). Economic and demographic factors affecting
mangrove loss in the coastal provinces of Thailand, 1979–1996. Ambio, 31,
351–357.
Bostick, K. (2008). NGO approaches to minimizing the impacts of aquaculture: A
review. In M. Holmer, K. Black, C. M. Duarte, N. Marba`, & I. Karakassis
(Eds.), Aquaculture in the ecosystem (pp. 227–250). Berlin: Springer.
Boström, M., Jönsson, A. M., Lockie, S., Mol, A. P., & Oosterveer, P. (2015).
Sustainable and responsible supply chain governance: challenges and
opportunities. Journal of Cleaner Production, 107, 1-7.
BPS-Statistics Indonesia. (2016). Statistics of Marine and Coastal Resources. BPS,
Jakarta.
Cao, L., Diana, J. S., Keoleian, G. A., & Lai, Q. (2011). Life cycle assessment of
Chinese shrimp farming systems targeted for export and domestic sales.
Environmental science & technology, 45(15), 6531-6538.
Cao, L. (2012). Farming shrimp for the future: a sustainability analysis of shrimp
farming in China (Doctoral dissertation, University of Michigan).
CBI (2015). CBI Product Fact Sheet: Frozen cultured Vannamei shrimp in Europe.
Retrieved from https://www.cbi.eu/market-information/fish-seafood/trade-
statistics/

PAGE 61
Chim, L., Brun, H. L., & Le Moullac, G. (2009). MARINE SHRIMP FARMING.
Fisheries and Aquaculture-Volume IV, 28.
Cooper, M. C., Lambert, D. M., & Pagh, J. D. (1997). Supply chain management: more
than a new name for logistics. The international journal of logistics
management, 8(1), 1-14.
Cruz-Suárez, L. E., León, A., Peña-Rodríguez, A., Rodríguez-Peña, G., Moll, B., &
Ricque-Marie, D. (2010). Shrimp/Ulva co-culture: a sustainable alternative to
diminish the need for artificial feed and improve shrimp quality. Aquaculture,
301(1), 64-68.
DEFRA 2002 The strategy for sustainable farming and food: facing the future, 51 pp.
London, UK: DEFRA Publications
DeWalt, B. R., Ramírez Zavala, J. R., Noriega, L., & González, R. E. (2002). Shrimp
aquaculture, the people and the environment in coastal Mexico. Report prepared
under World Bank, NACA, WWF y FAO Consortium program on shrimp
farming and the environment. Work in Progress for Public Discussion, 73.
Diana, J. S. (2009). Aquaculture production and biodiversity conservation. Bioscience,
59(1), 27-38.
Douma, M., & van Wijk, J. (2012). ASC certified shrimp: Can extensive shrimp farming
benefit? A case study of Indonesia (No. 2012/46).
Ekmaharaj, S. (2006). Aquaculture of marine shrimp in Southeast Asia and China:
major constrains for export. Secretariat, Southeast Asian Fisheries Development
Center.
EUMOFA (2016) The EU Fish Market 2016 Edition. Retrieved from www.eumofa.eu
European commission (2018). Shrimps. https://trade.ec.europa.eu/tradehelp/shrimps.
Retrieved on 23rd of March 2018
Evans, J. D. (1996). Straightforward statistics for the behavior sciences. Pacific Grove:
Brooks/Cole Publishing.

PAGE 62
FAO. (2004). Aquaculture production, capture production, commodities. Yearbooks of
fishery statistics summary tables. Rome: FAO.
FAO, 2006. Cultured Aquatic Species Information Programme. Penaeus vannamei.
Cultured Aquatic Species Information Programme. Text by Briggs, M. In: FAO
Fisheries and Aquaculture Department [online]. Rome. Updated 7 April 2006.
[Cited 18 October 2017].
http://www.fao.org/fishery/culturedspecies/Penaeus_vannamei/en
FOA (2016). Global farmed shrimp production in 2016 remains stagnant or lessens.
Retrieved from http://www.fao.org/in-action/globefish/market-
reports/resource-detail/en/c/880760/
Farkan, M., Djokosetiyanto D., Sjarief Widjaja R., Kholil & Widiatmaka. (2016).
Carrying capacity analysis of area of sustainable shrimp cultivation based on
land suitability and water availability in coastal bay of Banten Indonesia.
International Journal For Research In Biology & Pharmacy. ISSN: 2208-2093.
Vol 2, Issue-3
Farkan, M., Setiyanto, D. D., & Widjaja, R. S. (2017, January). Assessment area
development of sustainable shrimp culture ponds (case ctudy the gulf coast
Banten). In IOP Conference Series: Earth and Environmental Science (Vol. 54,
No. 1, p. 012077). IOP Publishing.
Fayet, L., & Vermeulen, W. J. (2014). Supporting smallholders to access sustainable
supply chains: lessons from the Indian cotton supply chain. Sustainable
Development, 22(5), 289-310.
Fink, A. (1998). Conducting research literature review: from paper to internet.
Thousand Oaks: SagePublications.
Gillett, R. (2008). Global study of shrimp fisheries (Vol. 475). Rome: Food and
Agriculture Organization of the United Nations.
Globefish, F. A. O. (2017). Monthly Trade Statistics.
PAGE 63
Ha, T. T. T., Bush, S. R., Mol, A. P., & van Dijk, H. (2012). Organic coasts? Regulatory
challenges of certifying integrated shrimp–mangrove production systems in
Vietnam. Journal of Rural Studies, 28(4), 631-639.
Hanafi, A., & Ahmad, T. (1999). Shrimp Culture in Indonesia: Key Sustainability and
Research Issues. In ACIAR PROCEEDINGS (pp. 69-74). ACIAR; 1998.
Harland, C. M., Lamming, R. C., Walker, H., Phillips, W. E., Caldwell, N. D., Johnsen,
T. E., ... & Zheng, J. (2006). Supply management: is it a discipline?.
International Journal of Operations & Production Management, 26(7), 730-753.
Helin, S., & Babri, M. (2015). Travelling with a code of ethics: a contextual study of a
Swedish MNC auditing a Chinese supplier. Journal of Cleaner Production, 107,
41-53.
Jain, V., & Benyoucef, L. (2008). Managing long supply chain networks: some
emerging issues and challenges. Journal of Manufacturing Technology
Management, 19(4), 469-496.
Joffre, O. M., Bosma, R. H., Bregt, A. K., van Zwieten, P. A., Bush, S. R., & Verreth,
J. A. (2015). What drives the adoption of integrated shrimp mangrove
aquaculture in Vietnam?. Ocean & Coastal Management, 114, 53-63.
Kievitsbosch, J. (2015). Building the Sustainable Supply Chain: Trust, Transparency,
and Contracts as Building Blocks-A theoretical, and empirical analysis of SMEs
in the Norwegian industry (Master's thesis, NTNU).
Knowler, D., Philcox, N., Nathan, S., Delamare, W., Haider, W., & Gupta, K. (2009).
Assessing prospects for shrimp culture in the Indian Sundarbans: a combined
simulation modelling and choice experiment approach. Marine Policy, 33(4),
613-623.
Kuhlman, T., & Farrington, J. (2010). What is sustainability?. Sustainability, 2(11),
3436-3448.
Kusumastanto, T., Jolly, C. M., & Bailey, C. (1998). A multiperiod programming
evaluation of brackishwater shrimp aquaculture development in Indonesia
1989/1990–1998/1999. Aquaculture, 159(3), 317-331.

PAGE 64
Kusumawati, R., & Bush, S. R. (2015). Co-producing Better Management Practice
standards for shrimp aquaculture in Indonesia. Maritime Studies, 14(1), 21.
Lai, X., & Ye, B. (2017). The intelligent control strategy of frozen cooked shrimp
production process and energy step utilisation. Energy Procedia, 123, 10-14.
Lebel, L., Nguyen, H. T., Amnuay, S., Suparb, P., Urasa, B., & Le, K. T. (2002).
Industrial transformation and shrimp aquaculture in Thailand and Vietnam:
Pathways to ecological, social, and economic sustainability? Ambio, 31, 311–
323.
Lord, M. J. (2010). Indonesia’s trade access to the European Union: Opportunities and
challenges.
Mol, A.P.J., 2014. The role of transparency in governing China's food quality: a review.
Food Control 43, 49e56.
Monczka, R. M., Handfield, R. B., Giunipero, L. C., & Patterson, J. L. (2015).
Purchasing and supply chain management. Cengage Learning.
NACA, Network of Aquaculture Centres in Asia-Pacific (2017). Government plicy and
enabling environment for aquaculture feed production in Thailand.
https://enaca.org/?id=910&title=government-policy-and-enabling-
environment-for-aquaculture-feed-production-in-thailand Retrieved on 26th of
March 2018.
Naylor, R. L., Goldburg, R. J., Primavera, J. H., Kautsky, N., Beveridge, M. C., Clay,
J., ... & Troell, M. (2000). Effect of aquaculture on world fish supplies. Nature,
405(6790), 1017-1024.
Nissapa, A., & Boromthanarat, S. (2002). A case study on institutional aspects of
shrimp aquaculture in Thailand. Report prepared under the World Bank, NACA,
WWF and FAO Consortium Program on Shrimp Farming and the Environment.
Work in Progress for Public Discussion. Published by the Consortium.
Novari, C. (2013) Aquaculture Certification in Indonesia [pdf slides]. Workshop on
Aquaculture Certification. Retrieved from www.daotao.vasep.com.vn

PAGE 65
Ongsritrakul, S., & Hubbard, L. (1996). The export market for Thai frozen shrimps in
the European Union. British Food Journal, 98(8), 24-28.
Oosterveer, P. (2006). Globalization and sustainable consumption of shrimp:
consumers and governance in the global space of flows. International Journal
of Consumer Studies, 30(5), 465-476.
Phillips, M. J., Rohana, P. S. (2006). FAO, NACA, UNEP/GPA, WB, and WWF
Consortium on Shrimp Farming and the Environment receives the Green Award
for its International Principles for Responsible Shrimp Farming. FAO
Aquaculture Newsletter No. 36, 46-47
Paul, B. G., & Vogl, C. R. (2011). Impacts of shrimp farming in Bangladesh: challenges
and alternatives. Ocean & Coastal Management, 54(3), 201-211.
Paul, B. G., & Vogl, C. R. (2013). Organic shrimp aquaculture for sustainable
household livelihoods in Bangladesh. Ocean & coastal management, 71, 1-12.
Smith, B. G. (2008). Developing sustainable food supply chains. Philosophical
Transactions of the Royal Society of London B: Biological Sciences, 363(1492),
849-861.
Sverdrup, H., Koca, D., & Ragnarsdottir, K. V. (2017). Defining a free market: drivers
of unsustainability as illustrated with an example of shrimp farming in the
mangrove forest in South East Asia. Journal of Cleaner Production, 140, 299-
311.
Tookwinas, S., Boonyarapalin, M., Choongam, C. & Poongern, J. (1999). On farm
quality assurance for shrimp production in Thailand, in papers Presented at the
Bangkok FAO Technical Consultation on Policies for Sustainable Shrimp
Culture. Bangkok, Thailand 8-11 December 1997, FAO Fisheries Report No.
572 (Rome: Food and Agricultural Organization of the United Nations {FAO}),
Suppl. Pp. 111-122.
Truong, H., Lyne, M., & Woodford, K. (2014). Managing water pollution to revitalise
the shrimp supply chain in tam giang cau hai lagoon, vietnam. UMK Procedia,
1, 50-56.

PAGE 66
United Nations. Department of Economic. (2007). Indicators of sustainable
development: Guidelines and methodologies. United Nations Publications.
Van Duijn, A. P., Beukers, R., & Van der Pijl, W. (2012). The Indonesian seafood
sector; a value chain analysis. CBI & LEI, part of Wageningen UR.
van Oorschot, M., Kok, M., van der Esch, S., Janse, J., Rood, T., Vixseboxse, E., ... &
Vermeulen, W. (2014). Sustainability of international Dutch supply chains-
Progress, effects and perspectives. PBL, (1289).
Van Schaik, M. (2010). Global-local linkages in shrimp aquaculture certification–The
approaches of NGO networks and the challenges in Indonesia.
Vural, C. A. (2015). Sustainable Demand Chain Management: An Alternative
Perspective for Sustainability in the Supply Chain. Procedia-Social and
Behavioral Sciences, 207, 262-273.
Wati, L. A., Chang, W. I., & Mustadjab, M. M. (2013). Competitiveness of Indonesian
shrimp compare with Thailand shrimp in export market. WACANA, Jurnal
Sosial dan Humaniora, 16(1), 24-31.
WRM (2002). Mangroves. Local livelihoods vs. corporate profits. In H. Fonseca (Ed.),
World rainforest movement. Uruguay:Montevideo.
Yi, D., Reardon, T., & Stringer, R. (2016). Shrimp aquaculture technology change in
Indonesia: Are small farmers included?. Aquaculture.

PAGE 67
Appendices 1: List of Questions for shrimp farmers interview
QUESTIONNAIRE
The aim of this activity is to help shrimp farmer embrace sustainability
PERSONAL IDENTITY
1. Name ___________________________________________________
2. Age ___________________________________________________
3. Sex
Jenis
Kelamin
___________________________________________________
4. Tribe ___________________________________________________
5. Address ___________________________________________________
6. Education
level
___________________________________________________
7. Number of
family
dependents
___________________________________________________
ECONOMIC ASPECTS
1 What is your family’s income after shrimp farming for the last three years?
a. steady
b. increase
c. other (fluctuate/decrease)
2 How much is your income per harvest?
a. 0-20 million IDR
b. 20-100 million IDR
c. more than 100 million IDR
3 Who buys your shrimp?
a. End consumer
b. Trader (Middlemen or Exporter)
c. Combination of buyers
4 What sort of difficulties do you have with regards to selling your shrimp?
a. Lack of market information
b. No difficulties
c. other difficulties, please mention:
5 Have you ever experienced loss? If yes, how much?
a. 0-20 million IDR
b. 20-100 million IDR
c. more than 100 million IDR
6 How much capital did you need to build your shrimp farm?
a. less than 100 million IDR
b. 100-500 million IDR
c. more than 500 million IDR
7 What is the source of your capital?
a. self-capital

PAGE 68
b. bank loans
c. other sources, please mention:
8 What type of energy is used on your shrimp farm?
a. renewable energy
b. non-renewable energy
c. other energy, please mention:
9 How do you manage your waste?
a. discard
b. recycle
c. others, please mention:
10 How much do you spend on managing your shrimp waste per month?
a. 0-3 million IDR
b. 3-6 million IDR
c. more than 6 million IDR
ENVIRONMENTAL ASPECTS
1 Total shrimp pond(s) area?
a. 1-400 acres
b. 400-800 acres
c. more than 800 acres
2 Where do you buy seed?
a. local hatchery
b. national hatchery
c. international hatchery
3 What do you use to feed your shrimp?
a. commercial feed
b. fish meal
c. organic feed
4 How do you treat shrimp diseases and manage your pond?
a. using antibiotics
b. water change routines
c. combination of safe treatment
5 How were the results of your treatment?
a. success
b. fluctuate
c. fail
6 What do you think about diseases in shrimp culture over the last 5 years?
a. increase
b. decrease
c. average
7 Does it lack fresh water during the dry season?
a. yes, it cannot be managed
b. yes, it can be managed
c. no
8 What do you think about the quality of water over the last 5 years?
a. increase
b. decrease
c. average
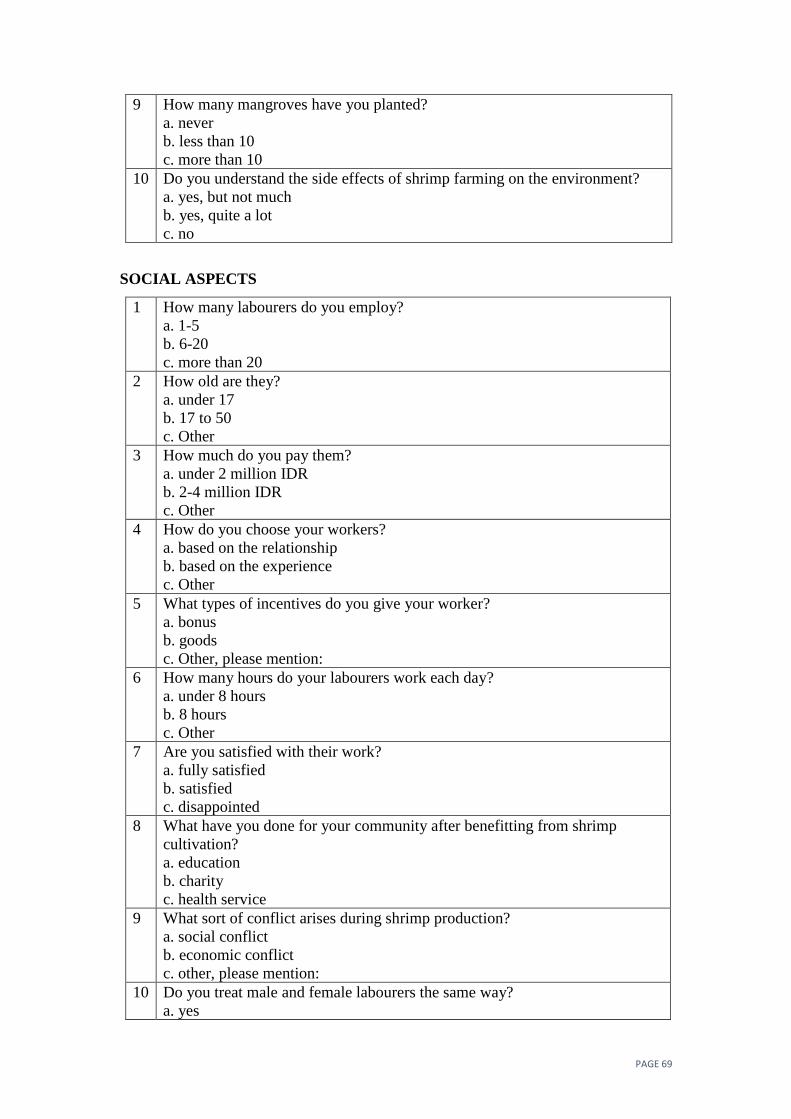
PAGE 69
9 How many mangroves have you planted?
a. never
b. less than 10
c. more than 10
10 Do you understand the side effects of shrimp farming on the environment?
a. yes, but not much
b. yes, quite a lot
c. no
SOCIAL ASPECTS
1 How many labourers do you employ?
a. 1-5
b. 6-20
c. more than 20
2 How old are they?
a. under 17
b. 17 to 50
c. Other
3 How much do you pay them?
a. under 2 million IDR
b. 2-4 million IDR
c. Other
4 How do you choose your workers?
a. based on the relationship
b. based on the experience
c. Other
5 What types of incentives do you give your worker?
a. bonus
b. goods
c. Other, please mention:
6 How many hours do your labourers work each day?
a. under 8 hours
b. 8 hours
c. Other
7 Are you satisfied with their work?
a. fully satisfied
b. satisfied
c. disappointed
8 What have you done for your community after benefitting from shrimp
cultivation?
a. education
b. charity
c. health service
9 What sort of conflict arises during shrimp production?
a. social conflict
b. economic conflict
c. other, please mention:
10 Do you treat male and female labourers the same way?
a. yes
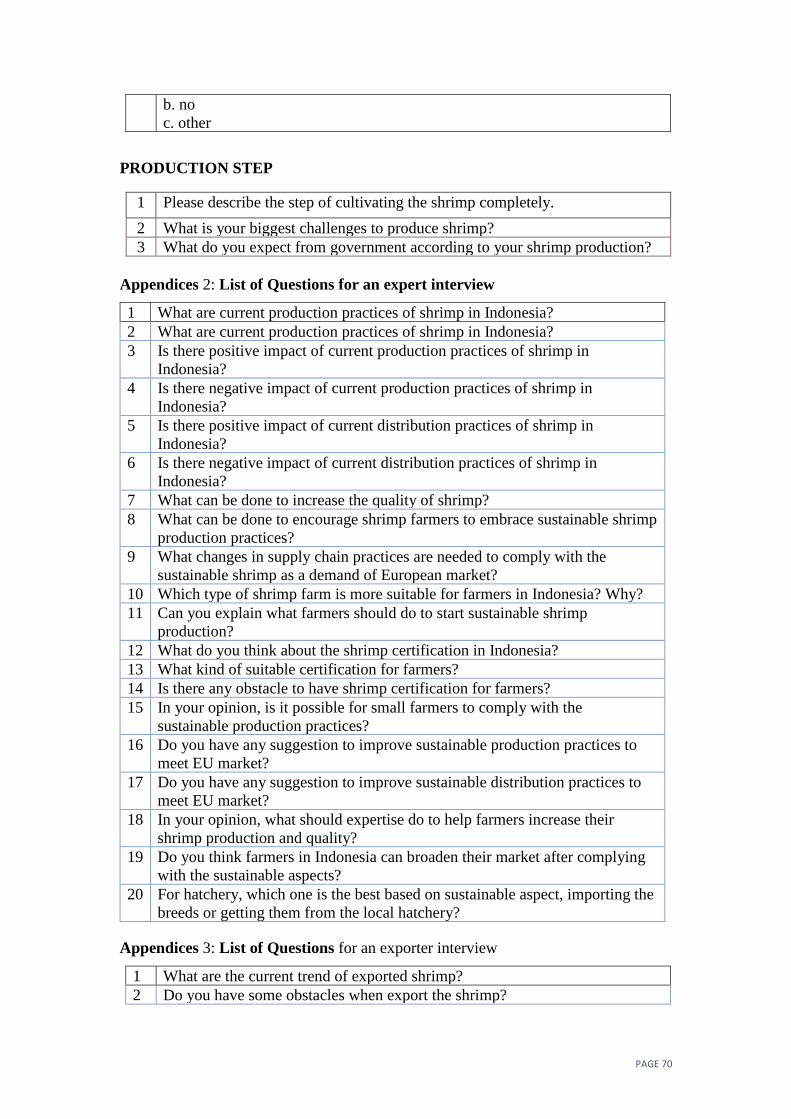
PAGE 70
b. no
c. other
PRODUCTION STEP
1 Please describe the step of cultivating the shrimp completely.
2 What is your biggest challenges to produce shrimp?
3 What do you expect from government according to your shrimp production?
Appendices 2: List of Questions for an expert interview
1 What are current production practices of shrimp in Indonesia?
2 What are current production practices of shrimp in Indonesia?
3 Is there positive impact of current production practices of shrimp in
Indonesia?
4 Is there negative impact of current production practices of shrimp in
Indonesia?
5 Is there positive impact of current distribution practices of shrimp in
Indonesia?
6 Is there negative impact of current distribution practices of shrimp in
Indonesia?
7 What can be done to increase the quality of shrimp?
8 What can be done to encourage shrimp farmers to embrace sustainable shrimp
production practices?
9 What changes in supply chain practices are needed to comply with the
sustainable shrimp as a demand of European market?
10 Which type of shrimp farm is more suitable for farmers in Indonesia? Why?
11 Can you explain what farmers should do to start sustainable shrimp
production?
12 What do you think about the shrimp certification in Indonesia?
13 What kind of suitable certification for farmers?
14 Is there any obstacle to have shrimp certification for farmers?
15 In your opinion, is it possible for small farmers to comply with the
sustainable production practices?
16 Do you have any suggestion to improve sustainable production practices to
meet EU market?
17 Do you have any suggestion to improve sustainable distribution practices to
meet EU market?
18 In your opinion, what should expertise do to help farmers increase their
shrimp production and quality?
19 Do you think farmers in Indonesia can broaden their market after complying
with the sustainable aspects?
20 For hatchery, which one is the best based on sustainable aspect, importing the
breeds or getting them from the local hatchery?
Appendices 3: List of Questions for an exporter interview
1 What are the current trend of exported shrimp?
2 Do you have some obstacles when export the shrimp?

PAGE 71
3 Which countries do you target for exporting the shrimp?
4 Have you ever exported shrimp to EU?
5 Do you find any obstacles to export shrimp to EU?
6 How do you maintain the quality shrimp from farmers?
7 How do you manage the stability supply for market demand?
8 Do you find being exporter is beneficial for you?
9 Do you need support from government?
10 Do you some suggestion for farmers to increase the quality of their shrimp?
11 How do you choose your client?
12 How do you build your relationship with shrimp farmers?
13 Do you think being exporter is profitable for you?
14 How do you deliver the shrimp to destination country?
15 What do you think of sustainability?
16 What are the hardest requirements of shrimp from imported country?
17 How do you solve those problem?
18 When you export the shrimp, how many farmers are involved as your client?
19 Do you think the export regulation in Indonesia is good enough for now?
20 If not, what do you expect from government to support the exporter?
Appendices 4: List of Questions for stakeholders’ interview
1 What government can do to help shrimp farmers widen their aquaculture?
2 Does government have program to improve supply chain of shrimp?
3 Is there special training for farmers to increase their skills?
4 If yes, what kind of training and how often?
5 What kind of loan ado government offer to help farmer?
6 How much the interest of each loan?
7 Is there any subsidy for shrimp farmers?
8 Is there regulation related to sustainability?
9 In your perspective, what is sustainability?
10 Do current shrimp production practices include in sustainable practices?
11 What kind of improvement do you expect from shrimp farmers?
12 What do you think the biggest challenges for comply with the sustainable
shrimp production practices?
13 What do you think of sustainability?
14 Is there any socialization from government related to sustainability?
15 What is the main requirement for farmers to export their shrimp?
16 Do you think sustainable supply chain is profitable for farmers?
17 Do you think sustainable supply chain is profitable for government?
18 Is there any improvement of shrimp production from past to present?
19 If farmers get any obstacle to comply with imported shrimp requirements,
what government can do next?
20 What government can do to help shrimp farmers widen their market?
Appendices 5: List of Questions for traders or middlemen interview
1 How you select the farmer to be your client?
2 How is the basic price of shrimp that you get from the farmers?
3 How much the profit do you get per kg shrimp?

PAGE 72
4 How you build your relationship with the farmers?
5 How do you transport the shrimp from farm to your storage place?
6 Where do you store the shrimp from farmers?
7 What kind of storage do you have?
8 What is the capacity of your storage?
9 Are you trading the shrimp locally or nationally or internationally?
10 How do you determine the price of shrimp?
11 Who are the actors in supply chain cooperated with you, beside the farmers?
12 What are the challenges becoming middlemen?
13 How do you overcome the problems?
14 Who is your target market?
15 How do you broaden your market?
16 How do you manage your inventory?
17 How do you find and select target market?
18 What do you expect form shrimp farmers in the future?
19 How many tons of shrimp do you buy from farmers for one harvest?
20 What are the materials do you need for shrimp preservation?
Appendices 6: Frequencies
Statistics
ID income Other income
Income per
harvest buyers difficulties
N Valid 30 30 30 30 30 30
Missing 0 0 0 0 0 0
Statistics
Other difficulties loss capital Capital source Other sources
N Valid 30 30 30 30 30
Missing 0 0 0 0 0
Statistics
Type of energy Other energy
Waste
management
Other waste
management Waste spending
N Valid 30 30 30 30 30
Missing 0 0 0 0 0
Statistics
Pond area seed feed Shrimp diseases Treatment result
N Valid 30 30 30 30 30
Missing 0 0 0 0 0
Statistics
Disease
development Water supply Water quality mangroves
Knowledge of side
effect
N Valid 30 30 30 30 30
Missing 0 0 0 0 0
Statistics
labors
Other quantity of
labor Age of labor Other age salary Other salary
N Valid 30 30 30 30 30 30
Missing 0 0 0 0 0 0

PAGE 73
Statistics
Labourer selection Other requirements incentives Other incentives Work hours
N Valid 30 30 30 30 30
Missing 0 0 0 0 0
Statistics
Other work hours satisfaction Other satisfaction CSR conflict
N Valid 30 30 30 30 30
Missing 0 0 0 0 0
Statistics
Other conflict Male female equality Other equality
N Valid 30 30 30
Missing 0 0 0
Appendices 7: Frequency Table
ID
Frequency Percent Valid Percent
Cumulative
Percent
Valid intensive 10 33.3 33.3 33.3
semi intensive 10 33.3 33.3 66.7
tradisional 10 33.3 33.3 100.0
Total 30 100.0 100.0
income
Frequency Percent Valid Percent
Cumulative
Percent
Valid steady 4 13.3 13.3 13.3
increase 19 63.3 63.3 76.7
other 7 23.3 23.3 100.0
Total 30 100.0 100.0
Other income
Frequency Percent Valid Percent
Cumulative
Percent
Valid 24 80.0 80.0 80.0
decrease 3 10.0 10.0 90.0
fluctuative 3 10.0 10.0 100.0
Total 30 100.0 100.0
Income per harvest
Frequency Percent Valid Percent
Cumulative
Percent
Valid 0-20 million (IDR) 12 40.0 40.0 40.0
20-100 million (IDR) 6 20.0 20.0 60.0
more than 100 million (IDR) 12 40.0 40.0 100.0
Total 30 100.0 100.0
buyers
Frequency Percent Valid Percent
Cumulative
Percent
Valid direct consumer 2 6.7 6.7 6.7
trader (middlemen or exporter) 1 3.3 3.3 10.0
combination of buyers 27 90.0 90.0 100.0
Total 30 100.0 100.0

PAGE 74
difficulties
Frequency Percent Valid Percent
Cumulative
Percent
Valid no difficulties 24 80.0 80.0 80.0
other difficulties 6 20.0 20.0 100.0
Total 30 100.0 100.0
Other difficulties
Frequency Percent Valid Percent
Cumulative
Percent
Valid 24 80.0 80.0 80.0
large quantity requirement 1 3.3 3.3 83.3
less quality of product 1 3.3 3.3 86.7
limited quantity 1 3.3 3.3 90.0
price 2 6.7 6.7 96.7
size 1 3.3 3.3 100.0
Total 30 100.0 100.0
Loss
Frequency Percent Valid Percent
Cumulative
Percent
Valid 0-20 million (IDR) 17 56.7 56.7 56.7
20-100 million (IDR) 5 16.7 16.7 73.3
more than 100 million (IDR) 8 26.7 26.7 100.0
Total 30 100.0 100.0
Capital
Frequency Percent Valid Percent
Cumulative
Percent
Valid less than 100 million (IDR) 15 50.0 50.0 50.0
100-500 million (IDR) 4 13.3 13.3 63.3
more than 500 million (IDR) 11 36.7 36.7 100.0
Total 30 100.0 100.0
Capital source
Frequency Percent Valid Percent
Cumulative
Percent
Valid self-capital 19 63.3 63.3 63.3
bank loans 8 26.7 26.7 90.0
other 3 10.0 10.0 100.0
Total 30 100.0 100.0
Another source
Frequency Percent Valid Percent
Cumulative
Percent
Valid 27 90.0 90.0 90.0
combination of loans 1 3.3 3.3 93.3
multiple source 2 6.7 6.7 100.0
Total 30 100.0 100.0
Type of energy
Frequency Percent Valid Percent
Cumulative
Percent
Valid non-renewable energy 30 100.0 100.0 100.0

PAGE 75
Other energy
Frequency Percent Valid Percent
Cumulative
Percent
Valid 30 100.0 100.0 100.0
Waste management
Frequency Percent Valid Percent
Cumulative
Percent
Valid throwing them away 15 50.0 50.0 50.0
recycling 5 16.7 16.7 66.7
other 10 33.3 33.3 100.0
Total 30 100.0 100.0
Other waste management
Frequency Percent Valid Percent
Cumulative
Percent
Valid 20 66.7 66.7 66.7
fermentation 1 3.3 3.3 70.0
sedimentation 7 23.3 23.3 93.3
septic tank 2 6.7 6.7 100.0
Total 30 100.0 100.0
Waste spending
Frequency Percent Valid Percent
Cumulative
Percent
Valid 0-3 million (IDR) 30 100.0 100.0 100.0
Pond area
Frequency Percent Valid Percent
Cumulative
Percent
Valid 1-400 acre 21 70.0 70.0 70.0
400-800 acre 6 20.0 20.0 90.0
more than 800 acre 3 10.0 10.0 100.0
Total 30 100.0 100.0
seed
Frequency Percent Valid Percent
Cumulative
Percent
Valid local hatchery 1 3.3 3.3 3.3
national hatchery 29 96.7 96.7 100.0
Total 30 100.0 100.0
feed
Frequency Percent Valid Percent
Cumulative
Percent
Valid commercial feed 30 100.0 100.0 100.0
Shrimp diseases
Frequency Percent Valid Percent
Cumulative
Percent
Valid using antibiotics 6 20.0 20.0 20.0
water change routines 2 6.7 6.7 26.7
combination of safe treatment 22 73.3 73.3 100.0
Total 30 100.0 100.0

PAGE 76
Treatment result
Frequency Percent Valid Percent
Cumulative
Percent
Valid success 16 53.3 53.3 53.3
sometimes fail and sometimes
success
12 40.0 40.0 93.3
fail 2 6.7 6.7 100.0
Total 30 100.0 100.0
Disease development
Frequency Percent Valid Percent
Cumulative
Percent
Valid increase 10 33.3 33.3 33.3
decrease 1 3.3 3.3 36.7
average 19 63.3 63.3 100.0
Total 30 100.0 100.0
Water supply
Frequency Percent Valid Percent
Cumulative
Percent
Valid yes, it cannot be handled 2 6.7 6.7 6.7
yes, it can be handled 9 30.0 30.0 36.7
no 19 63.3 63.3 100.0
Total 30 100.0 100.0
Water quality
Frequency Percent Valid Percent
Cumulative
Percent
Valid increase 9 30.0 30.0 30.0
decrease 7 23.3 23.3 53.3
average 14 46.7 46.7 100.0
Total 30 100.0 100.0
mangroves
Frequency Percent Valid Percent
Cumulative
Percent
Valid never 21 70.0 70.0 70.0
more than 10 9 30.0 30.0 100.0
Total 30 100.0 100.0
Knowledge of side effect
Frequency Percent Valid Percent
Cumulative
Percent
Valid yes, but not much 5 16.7 16.7 16.7
yes, quite much 8 26.7 26.7 43.3
no 17 56.7 56.7 100.0
Total 30 100.0 100.0
labors
Frequency Percent Valid Percent
Cumulative
Percent
Valid 1-5 13 43.3 43.3 43.3
5-20 7 23.3 23.3 66.7
other 10 33.3 33.3 100.0
Total 30 100.0 100.0

PAGE 77
Other quantity of labor
Frequency Percent Valid Percent
Cumulative
Percent
Valid 20 66.7 66.7 66.7
around 100 1 3.3 3.3 70.0
around 25 1 3.3 3.3 73.3
around 54 1 3.3 3.3 76.7
no labor 7 23.3 23.3 100.0
Total 30 100.0 100.0
Age of labor
Frequency Percent Valid Percent
Cumulative
Percent
Valid under 17 1 3.3 3.3 3.3
17-50 22 73.3 73.3 76.7
other 7 23.3 23.3 100.0
Total 30 100.0 100.0
Other age
Frequency Percent Valid Percent
Cumulative
Percent
Valid 23 76.7 76.7 76.7
no labor 7 23.3 23.3 100.0
Total 30 100.0 100.0
salary
Frequency Percent Valid Percent
Cumulative
Percent
Valid under 2 million (IDR) 18 60.0 60.0 60.0
2-4 million (IDR) 5 16.7 16.7 76.7
other 7 23.3 23.3 100.0
Total 30 100.0 100.0
Other salary
Frequency Percent Valid Percent
Cumulative
Percent
Valid 23 76.7 76.7 76.7
no labor 7 23.3 23.3 100.0
Total 30 100.0 100.0
Labor selection
Frequency Percent Valid Percent
Cumulative
Percent
Valid based on the relationship 10 33.3 33.3 33.3
based on the experience 12 40.0 40.0 73.3
other 8 26.7 26.7 100.0
Total 30 100.0 100.0
Other requirement
Frequency Percent Valid Percent
Cumulative
Percent
Valid 23 76.7 76.7 76.7
no labor 7 23.3 23.3 100.0
Total 30 100.0 100.0
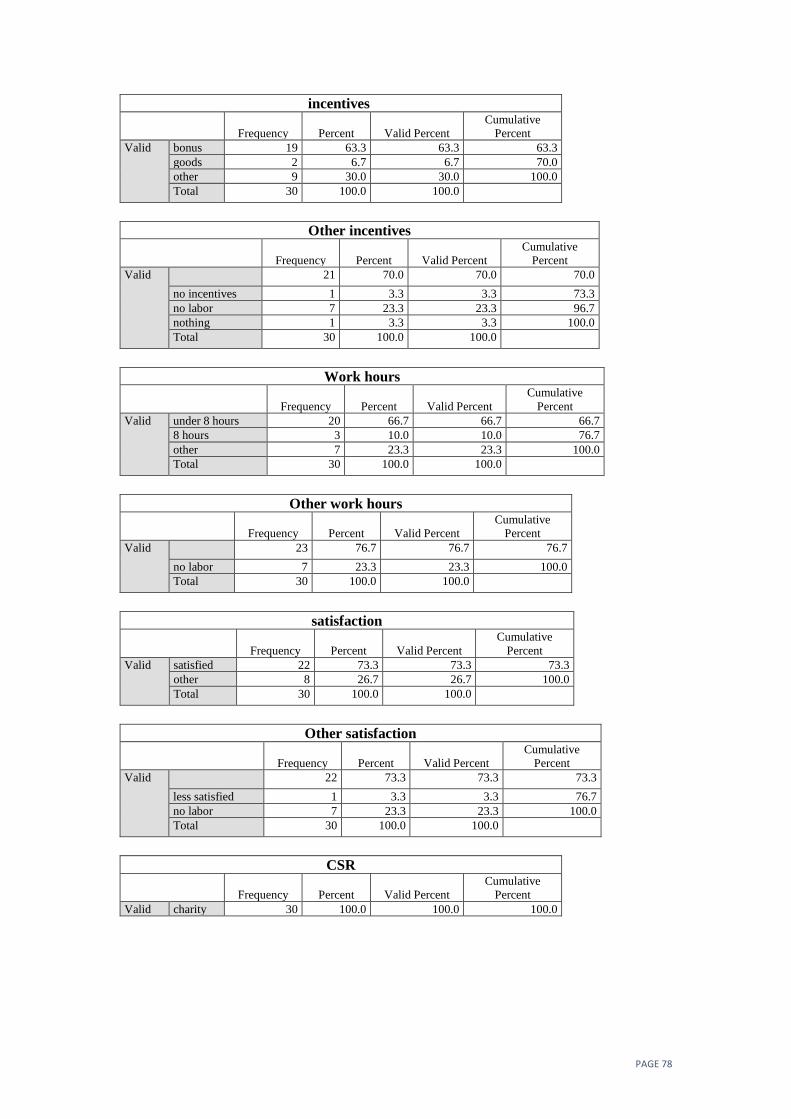
PAGE 78
incentives
Frequency Percent Valid Percent
Cumulative
Percent
Valid bonus 19 63.3 63.3 63.3
goods 2 6.7 6.7 70.0
other 9 30.0 30.0 100.0
Total 30 100.0 100.0
Other incentives
Frequency Percent Valid Percent
Cumulative
Percent
Valid 21 70.0 70.0 70.0
no incentives 1 3.3 3.3 73.3
no labor 7 23.3 23.3 96.7
nothing 1 3.3 3.3 100.0
Total 30 100.0 100.0
Work hours
Frequency Percent Valid Percent
Cumulative
Percent
Valid under 8 hours 20 66.7 66.7 66.7
8 hours 3 10.0 10.0 76.7
other 7 23.3 23.3 100.0
Total 30 100.0 100.0
Other work hours
Frequency Percent Valid Percent
Cumulative
Percent
Valid 23 76.7 76.7 76.7
no labor 7 23.3 23.3 100.0
Total 30 100.0 100.0
satisfaction
Frequency Percent Valid Percent
Cumulative
Percent
Valid satisfied 22 73.3 73.3 73.3
other 8 26.7 26.7 100.0
Total 30 100.0 100.0
Other satisfaction
Frequency Percent Valid Percent
Cumulative
Percent
Valid 22 73.3 73.3 73.3
less satisfied 1 3.3 3.3 76.7
no labor 7 23.3 23.3 100.0
Total 30 100.0 100.0
CSR
Frequency Percent Valid Percent
Cumulative
Percent
Valid charity 30 100.0 100.0 100.0
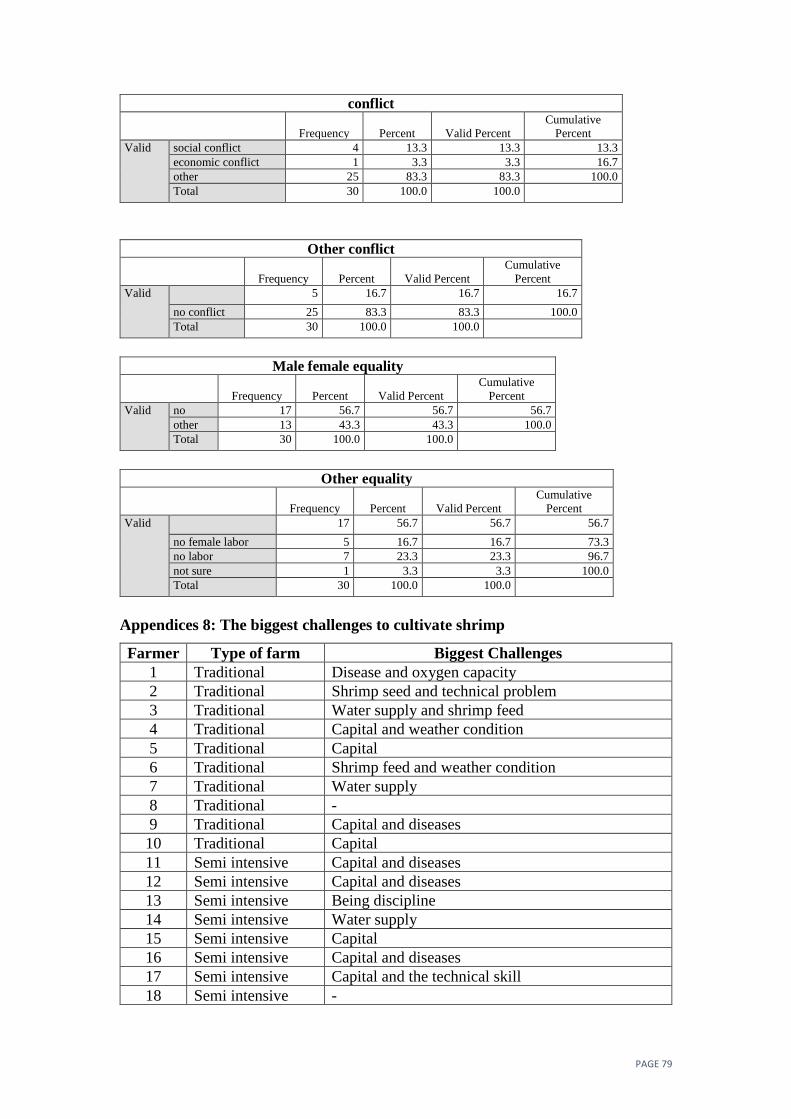
PAGE 79
conflict
Frequency Percent Valid Percent
Cumulative
Percent
Valid social conflict 4 13.3 13.3 13.3
economic conflict 1 3.3 3.3 16.7
other 25 83.3 83.3 100.0
Total 30 100.0 100.0
Other conflict
Frequency Percent Valid Percent
Cumulative
Percent
Valid 5 16.7 16.7 16.7
no conflict 25 83.3 83.3 100.0
Total 30 100.0 100.0
Male female equality
Frequency Percent Valid Percent
Cumulative
Percent
Valid no 17 56.7 56.7 56.7
other 13 43.3 43.3 100.0
Total 30 100.0 100.0
Other equality
Frequency Percent Valid Percent
Cumulative
Percent
Valid 17 56.7 56.7 56.7
no female labor 5 16.7 16.7 73.3
no labor 7 23.3 23.3 96.7
not sure 1 3.3 3.3 100.0
Total 30 100.0 100.0
Appendices 8: The biggest challenges to cultivate shrimp
Farmer Type of farm Biggest Challenges
1 Traditional Disease and oxygen capacity
2 Traditional Shrimp seed and technical problem
3 Traditional Water supply and shrimp feed
4 Traditional Capital and weather condition
5 Traditional Capital
6 Traditional Shrimp feed and weather condition
7 Traditional Water supply
8 Traditional -
9 Traditional Capital and diseases
10 Traditional Capital
11 Semi intensive Capital and diseases
12 Semi intensive Capital and diseases
13 Semi intensive Being discipline
14 Semi intensive Water supply
15 Semi intensive Capital
16 Semi intensive Capital and diseases
17 Semi intensive Capital and the technical skill
18 Semi intensive -

PAGE 80
19 Semi intensive Diseases and weather condition
20 Semi intensive Diseases
21 Intensive Diseases and weather condition
22 Intensive Diseases
23 Intensive Electricity problem
24 Intensive Seed and the regulation
25 Intensive Diseases
26 Intensive Labor management
27 Intensive Diseases
28 Intensive Diseases and electricity problem
29 Intensive Capital and technical skill
30 Intensive Shrimp and labor management
Appendices 9: The expectation from government
Farmer Type of farm The Expectation
1 Traditional Facilities (water pump) and Infrastructure
2 Traditional Seed subsidy and training for shrimp cultivation
3 Traditional Feed subsidy, and facilities (wheel aerator and
genset diesel)
4 Traditional Low loan interest and facilities
5 Traditional Facilities
6 Traditional Full support
7 Traditional Full support
8 Traditional -
9 Traditional Low loan interest and facilities
10 Traditional Facilities (wheel aerator) and training for shrimp
cultivation
11 Semi intensive Low loan interest and facilities
12 Semi intensive Full support
13 Semi intensive Support (low loan interest and facilities)
14 Semi intensive Low loan interest, feed and seed subsidy
15 Semi intensive Facilities
16 Semi intensive Feed subsidy
17 Semi intensive Support and training for shrimp cultivation
18 Semi intensive -
19 Semi intensive Facilities
20 Semi intensive -
21 Intensive -
22 Intensive -
23 Intensive -
24 Intensive Support by providing a clear regulation
25 Intensive -
26 Intensive -
27 Intensive -
28 Intensive Support by providing a clear regulation
29 Intensive Cooperation
30 Intensive Focus on their role

PAGE 81
Appendices 10: Interview with the Experts
Questions Expert 1 Expert 2 Expert 3 Expert 4 Expert 5
1 What are current
production practices
of shrimp in
Indonesia?
Farmers utilize
probiotic as a pond
treatment. Most
farmers have semi
intensive and intensive
shrimp ponds
It is influenced by
disease and
environment
It is dominated by
three type of shrimp
farming, and it
depends on the type
of shrimp feed,
whether natural feed
or not
Production practices
in suburb area is still
less contaminated
than in big city
Most of shrimp
production are
contaminated by
various diseases
2 What are current
distribution practices
of shrimp in
Indonesia
Shrimps are
distributed to another
island, especially Java
and they have a
contract for it.
It depends on a
demand from abroad,
especially America,
Europe and Asia
Shrimps are
distributed to another
island, especially
Java and Bali
There is a selection
for export shrimp
based on shrimp size
and quality before it
is distributed to other
country
Without any obstacle
to distribute shrimp
from farmers o
distributor
3 Is there positive
impact of current
production practices
of shrimp in
Indonesia?
The use of probiotic
can create feed
efficiency
Environment:
- Reduce the number of
illegal fishing in the
sea
- For intensive farming,
there is waste
recycling which make
the sea not pollute
Social
- Land efficiency
Economic
- The income of shrimp
farmer is increase
Land efficiency -Increase job
opportunity for local
people
-Trigger new shrimp
farmer as the
knowledge is given to
local people
-Increase job
opportunity for local
people
4 Is there negative
impact of current
production practices
However, the price of
feed is much higher
Environment:
- If there is no waste
management, there
Environment: Waste
is increased on the
land. The more
Most of shrimp farm
are lack of pond
deposition of waste
-without prebiotic
treatment,
environment around

PAGE 82
of shrimp in
Indonesia?
will be pollutant in the
sea which influence
chemical component
of sea, such as the
increasing of nitrite
intensive shrimp
farming is, the more
side effect it can give
to environment
shrimp ponds can be
contaminated
5 Is there positive
impact of current
distribution practices
of shrimp in
Indonesia?
Market certainty and
technical assistance
from the company
It can increase the
income of
entrepreneur and
shrimp farmers
High technology in
shrimp preservation
while it is distributed
can preserve the
quality of shrimp
well
Shrimp can be an
export product
-export orientation
6 Negative impact of
current distribution
practices of shrimp in
Indonesia
High quality shrimp is
marketed centrally
which triggers price
monopoly
Monopoly pricing
between supplier and
buyer
Distribution activity
is little bit costly
since Indonesia is
archipelago country,
distribution from one
island which doesn’t
have shrimp
preservation to other
island which has high
technology of shrimp
preservation. Besides,
the transportation
route is still limited
The price of
Indonesian shrimp
export depends on the
price of India and
Thailand shrimp,
high competition
-high amount of
investment
7 What can be done
to increase the quality
of shrimp?
Implementation of
good shrimp farming
practices, high quality
of shrimp feed and
ponds management
Supporting facilities,
pond location must be
far away from industry
area and make a
selection of high
quality seed and feed.
1. Seed selection
2. Maintain water
quality
3. Feed management
Seed selection,
probiotic, standard
shrimp production,
like seed certified
-no antibiotics
-prebiotics treatment
8 What can be done
to encourage shrimp
Provide them a
sufficient and
Give them information
related to good
Introduce the
sustainable shrimp
Technician need to
give the best service
-Give a guidance to
follow the instruction

PAGE 83
farmers to embrace
sustainable shrimp
production practices?
understandable
information related to
shrimp farming
management practices
in shrimp cultivation,
environmental impact
assessment and social
consideration to keep
sustainability.
production to
farmers, feed
management
to farmers and
support farmer to
generate high profit,
which later this can
trigger farmer to
achieve sustainable
production
to achieve sustainable
shrimp production
-support human
resources capability
9 What changes in
supply chain practices
are needed to comply
with the sustainable
shrimp as a demand
of European market?
Less complicated
regulation and
establishment of
sustainable shrimp
foundation
Certification of seed
and feed, Holding
processing standard
Increase the
technology in shrimp
production practices
Shrimp must be fed
without antibiotics
and another
dangerous chemical
(pesticide)
-Short supply chain
-provide a cold
storage for each
island
-marketing
-integration between
the supply chain
player
-post harvest
handling
10 Which type of
shrimp farm is more
suitable for farmers in
Indonesia? Why?
Semi intensive to keep
the environment
Farm which has
standard operational
procedure and it
depends on the
economic condition of
farmers. Traditional is
better for sustainable
shrimp farming
Semi intensive farm
to keep the
environment
Intensive to obtain
high value
Semi intensive to
obtain sustainable
aspects
11 Can you explain
what farmers should
do to start sustainable
shrimp production?
Employing local
workers, profitable,
and environmentally
friendly
Management ponds
should be a priority
There should be a
recovery for shrimp
farm/ farm
normalization,
Consider the quality
of water and the
availability of water
for the future and
land capability
-capital
-well prepared of
human resources,
land, weather
prediction,

PAGE 84
12 What do you think
about the shrimp
certification in
Indonesia?
Certification is only
occupied by big
company, not small
farmers.
Indonesia has
certification based on
the request of abroad
Certification is held
by farmers only
because the
customers in abroad
require it
Certification needs
high capital and the
certification is
something new in
Indonesia
Seed certification is
more dominant in
Indonesia
13 What kind of
suitable certification
for farmers?
Seed certification Environment
certification
HACCP CBIB because ISO is
harder to be achieved
Seed certification
14 Is there any
obstacle to have
shrimp certification
for farmers?
Farmers do not
concern on
certification because
they think certification
is costly
Incomplete data of
government and less
farmer awareness of
certifying the shrimp
High capital High capital High capital and
complicated
bureaucracy
15 In your opinion, is
it possible for small
farmers to comply
with the sustainable
production practices?
It is possible, but they
will require more
capital to fulfill the
standard of sustainable
shrimp production
It is still impossible It is possible as long
as the type of farm is
traditional to generate
organic shrimp
It is possible, as long
as there is integration
among the supply
chain player, start
from government,
supplier, farmers and
others.
Yes, it is possible
16 Do you have any
suggestion to improve
sustainable
production practices
to meet EU market?
Farmers should meet
the quantity and food
safety requirements by
giving them sufficient
information regarding
EU market
Decrease dense
stocking of shrimp
from 500 m2 to
100m2 for intensive
farm
Farmers need to
concern about
environmental,
economic and social
aspects
The facilities need to
be increased,
certification, water
quality is good by
sterilization, and
waste management
Shrimp cultivation
system in Indonesia
need a full support
from government, the
quality should be
increased,
surveillance of
shrimp farming
activity
17 Do you have any
suggestion to improve
sustainable
Farmers need to fulfill
standard operational
practice, like cold
Infrastructure safety Infrastructure,
transportation
Infrastructure Facilities

PAGE 85
distribution practices
to meet EU market?
storage, long term
contract.
18 In your opinion,
what should expertise
do to help farmers
increase their shrimp
production and
quality?
Increase the quantity
of research,
publication and forum
meeting with the
farmers
Decrease dense
stocking of shrimp to
decrease the potential
of disease spreading
There is a program to
do community
service, like training
and research yet it
has not been optimal
due to lack of land, it
is only theory.
Giving a suggestion
to use feed and seed
certified
-Giving an advice to
create community
with a purpose to
make integration
between shrimp
farmers
19 Do you think
farmers in Indonesia
can broaden their
market after
complying with the
sustainable aspects?
Yes, indeed.
Collaboration between
all players is a must
Yes, indeed. Specially
to market the shrimp
to Europe
Yes, sure. It can
happen by
maintaining the
quality of shrimp,
social responsibility
and environmental
consideration
Yes, indeed. Because
Indonesia has high
potential to export the
shrimp
Yes, sure
20 For hatchery,
which one is the best
based on sustainable
aspect, importing the
breeds or getting
them from the local
hatchery?
Getting the seed from
local hatchery. It can
support local potential.
Both of them are
good, it is valued
based on the shrimp
production and the
standard that company
use.
Local hatchery is
better, because:
1. it can recruit local
people which
have a potential,
2. potential
contamination is
less
3. it is much cheaper
Imported hatchery
because it has high
quality based on
company’s
recommendation
Local hatchery with
international standard
and quality

PAGE 86
Appendices 11: Interview with the Exporter
Questions Exporter 1 Exporter 2
1 What are the
current trend of
exported shrimp?
It is dominated by
intensive farming
Free from residue and
another dangerous
chemical
2 Do you have some
obstacles when export
the shrimp?
Shrimp certification is
complex to fulfill
The strict requirement
of customer
3 Which countries do
you target for
exporting the shrimp?
Malaysia, Taiwan,
Japan, Europe and Los
Angeles
Korea, America,
Japan, Hongkong,
Europe
4 Have you ever
exported shrimp to
EU?
Yes Yes
5 Do you find any
obstacles to export
shrimp to EU?
Yes, especially
traceability
High competition and
traceability
6 How do you
maintain the quality
shrimp from farmers?
Keep the shrimp fresh
by giving good
packaging
Intense control and
use safe packaging for
shrimp
7 How do you
manage the stability
supply for market
demand?
Keep contact with the
customers and
producers daily to
supply the shrimp
efficiently
Keep looking for the
shrimp to fulfill the
order and the contract
8 Do you find being
exporter is beneficial
for you?
Yes. As an exporter, I
do not need to undergo
fail harvest. My
responsibility is
making a link between
Sometimes I gain
profit, but sometimes I
suffered from a loss

PAGE 87
farmers and customers
worldwide.
9 Do you need
support from
government?
Yes, like secretary of
commerce to get legal
permit
No
10 Do you have some
suggestion for
farmers to increase
the quality of their
shrimp?
Farmers should have
sustainable shrimp
farming to fulfill bio
security aspects
Farmers need to have
shrimp certification to
determine the quality
of shrimp easily
11 How do you
choose your client?
Based on their bidding
and their standard
Based on their
requirements
12 How do you build
your relationship with
shrimp farmers?
Upholding symbiotic
mutualism
Keep in touch
13 Do you think
being exporter is
profitable for you?
Yes, since being
exporter, I can make
business network
Not really
14 How do you
deliver the shrimp to
destination country?
Deliver it by sea
shipping, equipped
with cold storage and
container
Shipping by plane is
faster although it is
little bit expensive
15 What do you think
of sustainability?
Building an integrated
system to preserve the
quality
Continues profit
16 What are the
hardest requirements
of shrimp from
imported country?
Uniform shrimp color Specific size of
shrimp, especially size
40
17 How do you solve
those problem?
Reject the order Looking for it until I
get it

PAGE 88
18 When you export
the shrimp, how
many farmers are
involved as your
client?
More than 10 farmers Around 5 farmers
19 Do you think the
export regulation in
Indonesia is good
enough for now?
Not really good
because it is
complicated
It is good enough
because the regulation
is clear
20 If not, what do you
expect from
government to
support the exporter?
Build an integrated
system of shrimp
cultivation
No
Appendices 12: Interview with the Stakeholders
Questions Stakeholder 1 Stakeholder 2 Stakeholder 3
1 What government
can do to help shrimp
farmers widen their
aquaculture?
Give a support,
facilities, like
excavator to design
the pond
Many kinds of
facilities, like
excavator, seed, feed,
road construction
around the shrimp
ponds.
Help to inspect the
disease of shrimp
cultivation
2 Does government
have program to
improve supply chain
of shrimp?
Shrimp farming
program, Land
certification
Procurement of
thermo king cars for
storage
Product certification
3 Is there special
training for farmers to
increase their skills?
Yes Yes Yes
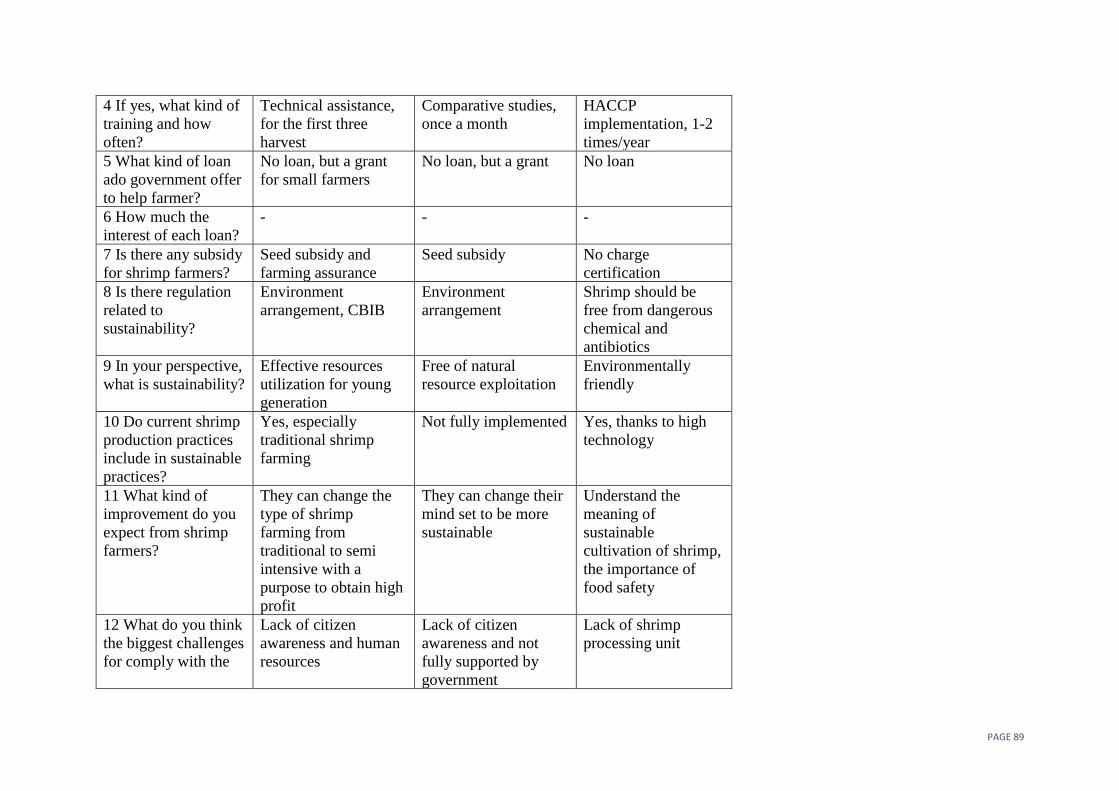
PAGE 89
4 If yes, what kind of
training and how
often?
Technical assistance,
for the first three
harvest
Comparative studies,
once a month
HACCP
implementation, 1-2
times/year
5 What kind of loan
ado government offer
to help farmer?
No loan, but a grant
for small farmers
No loan, but a grant No loan
6 How much the
interest of each loan?
- - -
7 Is there any subsidy
for shrimp farmers?
Seed subsidy and
farming assurance
Seed subsidy No charge
certification
8 Is there regulation
related to
sustainability?
Environment
arrangement, CBIB
Environment
arrangement
Shrimp should be
free from dangerous
chemical and
antibiotics
9 In your perspective,
what is sustainability?
Effective resources
utilization for young
generation
Free of natural
resource exploitation
Environmentally
friendly
10 Do current shrimp
production practices
include in sustainable
practices?
Yes, especially
traditional shrimp
farming
Not fully implemented Yes, thanks to high
technology
11 What kind of
improvement do you
expect from shrimp
farmers?
They can change the
type of shrimp
farming from
traditional to semi
intensive with a
purpose to obtain high
profit
They can change their
mind set to be more
sustainable
Understand the
meaning of
sustainable
cultivation of shrimp,
the importance of
food safety
12 What do you think
the biggest challenges
for comply with the
Lack of citizen
awareness and human
resources
Lack of citizen
awareness and not
fully supported by
government
Lack of shrimp
processing unit

PAGE 90
sustainable shrimp
production practices?
13 How to solve
those challenges?
Increase the
socialization about
sustainability and give
the training. If they do
not follow the
regulation related to
sustainability, they get
fine.
Increase the quantity
of meeting between
the farmers and
government
Build Export port and
local cold storage
14 Is there any
socialization from
government related to
sustainability?
Yes, it is more about
legality and
certification
Yes, it is related to
CBIB certification
Yes, it is related to
food safety
15 What is the main
requirement for
farmers to export
their shrimp?
CBIB certification CBIB HACCP, CBIB
16 Do you think
sustainable supply
chain is profitable for
farmers?
Yes, sure. Farmers can
export their shrimp
abroad, especially to
Europe.
Sure. But for now,
farmers only have
ability to market their
shrimp locally and
nationally.
Yes, indeed. They
can export their
shrimp worldwide
17 Do you think
sustainable supply
chain is profitable for
government?
Yes. Government can
get income from the
export activity through
certification.
Yes. Tax can be
imposed by
government when they
are able to export their
shrimp
Yes. Government can
set their own tariff for
export product.
18 Is there any
improvement of
shrimp production
from past to present?
Technology and the
type of farming are
evolved.
Yes. They have been
able to increase
shrimp quantity and
quality.
A larger quantity of
shrimp

PAGE 91
19 If farmers get any
obstacle to comply
with exported shrimp
requirements, what
government can do
next?
Increase the
socialization and
training
Cooperate with good
reputation private
company regarding
shrimp to induce the
high quantity and
quality of shrimp
Increase the facilities,
the support and
training.
20 What government
can do to help shrimp
farmers widen their
market?
Provide better
facilities
Make a link between
buyer and farmers
Train them to comply
with the customers’
requirement.
Appendices 13: Interview with the Middlemen
Questions Middlemen 1 Middlemen 2 Middlemen 3 Middlemen 4 Middlemen 5
1 How you select the
farmer to be your
client?
All farmers who want
to sell their shrimp can
be our client
Based on the system
of shrimp farmers,
whether they give me
the contract to buy
their shrimp or not.
Based on their
capacity
Based on the contract All farmers who want
to sell their shrimp
can be our client
2 How is the basic
price of shrimp that
you get from the
farmers?
50.000 IDR 35.000-45.000 IDR 46.000 IDR 40.000-47000 IDR 50.000 IDR
3 How much the
profit do you get per
kg shrimp?
3.000 IDR/kg 5.000-15.000 IDR/kg 4.000-6.000 IDR/kg 3.000-10.000 IDR/kg Min. 2.000 IDR/kg
4 How you build your
relationship with the
farmers?
Communication
intensely
Being loyal
middlemen
Give a loan to
farmers who need
capital
Keep the trust Give a loan to
farmers who need
capital
5 How do you
transport the shrimp
A pickup truck A pickup truck A pickup truck A pickup truck A pickup truck

PAGE 92
from farm to your
storage place?
6 Where do you store
the shrimp from
farmers?
In the box made of
Styrofoam
In the box made of
Styrofoam
In the box made of
Styrofoam
In the box made of
Styrofoam
In the box made of
Styrofoam
7 What kind of
storage do you have?
Only the Styrofoam Only the Styrofoam Styrofoam and
freezer
Styrofoam Styrofoam
8 What is the capacity
of your storage?
In total, 1 ton, each
styrofoam consists of
30 kg shrimp
In total, 500 kg, each
styrofoam consists of
30 kg shrimp
Minimum 1 ton,
maximum 4 ton
0.7-1 ton, each
styrofoam consists of
35 kg shrimp
300-400kg
9 Are you trading the
shrimp locally or
nationally or
internationally?
Locally Locally and nationally Locally Locally Locally and
nationally
10 How do you
determine the price of
shrimp?
Based on the size and
the quality
Based on the size and
the quality
Based on the size and
the quality
Based on the size, the
quality and freshness
Based on the size and
the quality
11 Who are the actors
in supply chain
cooperated with you,
beside the farmers?
Farmers and consumer Farmers, consumers
and exporters
Farmers and
consumers
Farmers and
consumers
Farmers and
consumers
12 What are the
challenges becoming
middlemen?
Over quantity of
shrimp in specific
month
In the high demand,
shrimp quantity is low,
and vice versa
In the high demand,
shrimp quantity is
low, and vice versa
In the high demand,
shrimp quantity is
low, and vice versa
When I sell the
shrimp nationally, I
cannot make a
bidding, bcz there is a
standard of price.
13 How do you
overcome the
problems?
Give a discount to
customers
Lowering the price Set the price lower Lowering the price Not only sell shrimps
nationally, but also
locally
14 Who is your target
market?
Customers, small
retailer and hotel
Customers, small
retailer, exporters
Customers and small
retailer
Customers and small
retailers
Customers and
retailers

PAGE 93
15 How do you
broaden your market?
Visiting the market
and build relationship
with the customers
there
Survey the local
market and contact the
supplier in other
province
Visiting the market,
make a survey and
build relationship
with the retailer and
customers
Visiting the market
and build relationship
with the customers
there
Survey the market
16 How do you
manage your
inventory?
Direct selling Direct selling Direct selling and
store in Freezer
Direct selling Direct selling and
store in styrofoam
with ice
17 How do you find
and select target
market?
No selection Trustworthy Choose the market
which needs high
demand of shrimp
Trustworthy Based on the area of
customer live
18 What do you
expect form shrimp
farmers in the future?
Increase the quality of
shrimp
Increase the quantity
in the season where
high demand is
demanded and quality
of shrimp
Produce high quality
of shrimp
Increase the quantity
in the season where
high demand is
demanded
Increase the quality
of shrimp
19 How many tons of
shrimp do you buy
from farmers for one
harvest?
1 ton/harvest 500 kg/harvest 1-4 tons/harvest 0.7-1 ton/harvest 300-400kg/harvest
20 What are the
materials do you need
for shrimp
preservation?
Ice and Styrofoam Ice and Styrofoam Ice, Styrofoam and
freezer
Ice and Styrofoam Ice and styrofoam