sustainable industrial production - tuiasiomicron.ch.tuiasi.ro/~mgav/pdf/sip/c3.pdf · sustainable...
TRANSCRIPT

SUSTAINABLE SUSTAINABLE INDUSTRIAL PRODUCTIONINDUSTRIAL PRODUCTION
Master program:
Environmental Management and Sustainable Energy
Professor Maria GavrilescuDepartment of Environmental Engineering
and Management

B) Framework developed by the Organization for Economic Co-operation and Development (OECD) for national, regional and international level analyses.
The first version of this framework is called the Pressure-State-Response (PSR) framework, but has since been developed in three different directions:
• the first variation replaces the pressure indicator category with a category of driving force indicators (creating a DSR framework),
• the second variation adds a category of impact indicators, transforming it into a Pressure-State-Impact-Response (PSIR) framework,
• the third version includes all five indicator categories creating a DPSIR framework.

C) Framework based on environmental (or sustainable development) themes.

Structures (frameworks) applied to selecting SD indicators
• the standard pressure–state–response (PSR)
• pressure– state–impact–response (PSIR)
And others….
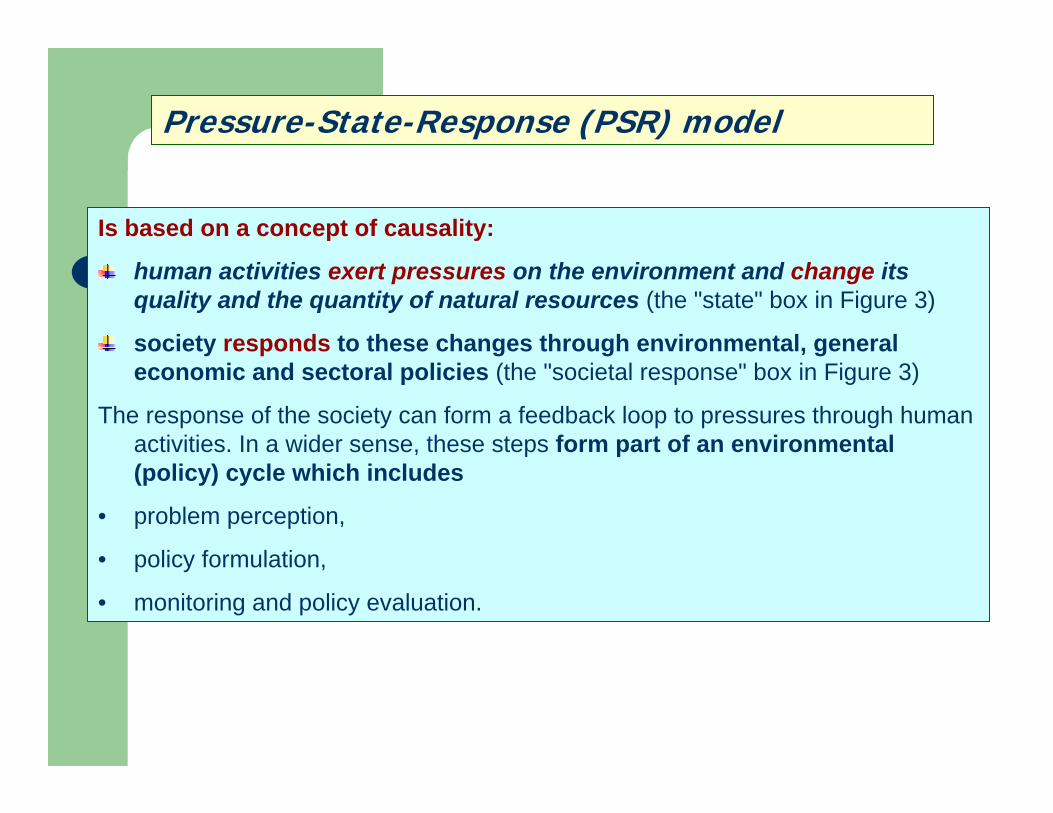
Pressure-State-Response (PSR) model
Is based on a concept of causality:
human activities exert pressures on the environment and change its quality and the quantity of natural resources (the "state" box in Figure 3)
society responds to these changes through environmental, general economic and sectoral policies (the "societal response" box in Figure 3)
The response of the society can form a feedback loop to pressures through human activities. In a wider sense, these steps form part of an environmental (policy) cycle which includes
• problem perception,
• policy formulation,
• monitoring and policy evaluation.

Figure 3. Pressure - State - Response Framework

Various forms of the basic PSR model have been suggested. The most relevant types are classified as:
linear
cyclic
The two types are presented in Figures 4 and 5.

Figure 4. Linear pressure–state–response (PSR) model
The traditional ‘linear’ PSR model assumes a target (the desired, new state) which one reaches by altering management.
In this case, indicators could measure:• application rate of pesticide (active ingredient applied per area of watershed)• concentration of pesticide in river water• price of pesticide, taxes• number of laws/measures to limit pesticide use• number (e.g. meetings, media messages) and success rate (e.g. attendance at meetings, surveys of awareness) of campaigns designed to heighten farmer awareness of the issue and discourage pesticide use.

Figure 5. Cyclic pressure–state–response (PSR) model
The cyclical PSR model includes a notion of ‘benefit’ (aesthetic or otherwise) which in turn could drive strategy and activity so as to arrive at the condition one requires (solid arrows in Figure).
It is also possible to see the relationship in the reverse (dashed arrows): a desired benefit will allow a prediction as to the environmental condition required and change in activities necessary to arrive at this.
With the cyclical version of the PSR model, it is implied that change will always be present in a society. For example, the initiation of new technologies and strategies will open up new threats and possibilities, and desirable benefits may alter as societal values and structure change.


The pressure– state–impact–response (PSIR) model
provides a systematic categorization of socio-economic, environmental and natural resource information under four headings:
• Pressure (stresses or agents of environmental change),
• State (resources assets, environmental quality),
• Impact
• Societal Response.
Human activities exert pressure on the environment causing the state (condition) of the environment to change.
Society, at different levels, will then respond to this change with policies that affect human activities and directly affect the state of the environment as well.

The “Driving forces-Pressure-State-Impact-Response” model
Is an updated form of PSIR
Driving forces are essential factors influencing a variety of relevant variables. Examples: the number of cars per inhabitant; total industrial production; Gross Domestic Product (GDP).
Pressure indicators describe the variables which directly cause environmental problems. Examples: toxic emissions, CO2 emissions, noise etc. caused by road traffic; the parking space required by cars; the amount of waste produced by scrap cars.
State indicators show the current condition of the environment. Examples: the concentration of lead in urban areas; the noise levels near main roads; the global mean temperature.
Impact indicators describe the ultimate effects of changes of state. Example: the percentage of children suffering from lead-induced health problems; the mortality due to noise-induced heart attacks; the number of people starving due to climate-change induced crop losses.
Response indicators demonstrate the efforts of society (i.e. politicians, decision-makers) to solve the problems. Examples: the percentage of cars with catalytic converters; maximum allowed noise levels for cars; the price level of gasoline; the revenue coming from pollution levies; the budget spent for solar energy research.

Figure 6. Driving forces-Pressure–State–Impact–Response (DPSIR) model for indicators of sustainable development
Core lists of environmental issues - and of relevant indicators -have been and are being developed by several organizations, building on the Organization for Economic Co-operation and Development (OECD's) initial work.
Such indicators can be organized within the pressure-state-response framework into a matrix of indicators.
Table 2.2 is adapted from such a matrix under consideration by United Nations Environment Program (UNEP).
Table 2.3 shows a similar matrix adapted from one being considered by the World Bank.

Table 2.2. Matrix of Environmental Indicators under consideration by United Nation Environmental Program (UNEP)

Table 2.3. Matrix of Environmental Indicators under consideration by The World Bank

Integration of sustainable development indicators
Indicator integration is basically a means by which individual and quite different indicators in a framework can somehow be viewed together to provide a global view of SD.
The need for integration addresses two issues:
1. Complexity: Many indicators may be relevant from a technical standpoint, but its overall significance may be lost if they aretreated separately, in detail .
2. Compromise: Some indicators, treated separately, don’t allow for immediate connections and compromise that expands the analysis on their meaning.
Aggregating them into a single index can help address both points.

Data Availability and Quality
The lack of data in general, and reliable data specifically, is a common problem in the indicator world. This is true for most indicator initiatives at most analytical levels. Due to their relative infancy, environmental data are difficult to come by compared to data for economic and social indicators.
The theory behind the development of indicators and indices looks likeFigure 7A, with a broad base of good quality primary data on which the indicators and indices can rest on. To show a simplified picture of reality, this information pyramid is commonlyturned upside down (Figure 7B) with many indices developed using the same, limited data sets that currently exist.
Fig. 7. The information pyramid

Aggregation is particularly seen as important in terms of presenting the information to the public and decision makers, who it is assumed, do not need to be aware of the detail, but only the broad message as to what is happening.
There are two main approaches here:
one could keep the indicators entirely separate, but listed or presented together within a single table or diagram (visual integration),
one could combine the indicators to yield a single index of SD (numerical integration):
the use of money as a common unit to integrate indicators of SD sustainability calculated on the basis of national savings,
national income and depreciation to man-made capital, natural resources and the environment
Integrative approaches are based on the use of diagrams.

AMOEBA (RADAR) diagram
It essentially comprises a bar graph of indicator values turned into a circular presentation. Indicators are arrayed as arms.
Figure 8 is an example of a RADAR diagram for ‘company sustainability’ (in this case, eco-efficiency indicators for the pharmaceutical industry).
The arms of the RADAR represent actual performance by the industry in terms of eco-efficiency.

Figure 8. Example of a RADAR diagram for company sustainability
Although in such AMOEBA-type diagrams the visual ‘whole’ provides some basis for integration, the individual indicators are still presented separately.
This can be an advantage, as it allows the reader to disaggregate the whole.

ORIENTOR STAR diagram
The primary starting point of the orientors is based on the ratio of therate of response to the rate of threat, with the former having to be greater than the latter in order to ensure sustainability.
The circle in the centre of the diagram represents the minimum value for SD (i.e. a ratio of 1; rate of response to threat = rate of threat), with each arm having to at least match this for SD (Figure 9).
This diagram is derivate from AMOEBA type.

Figure 9. The orientorstar of sustainable
development
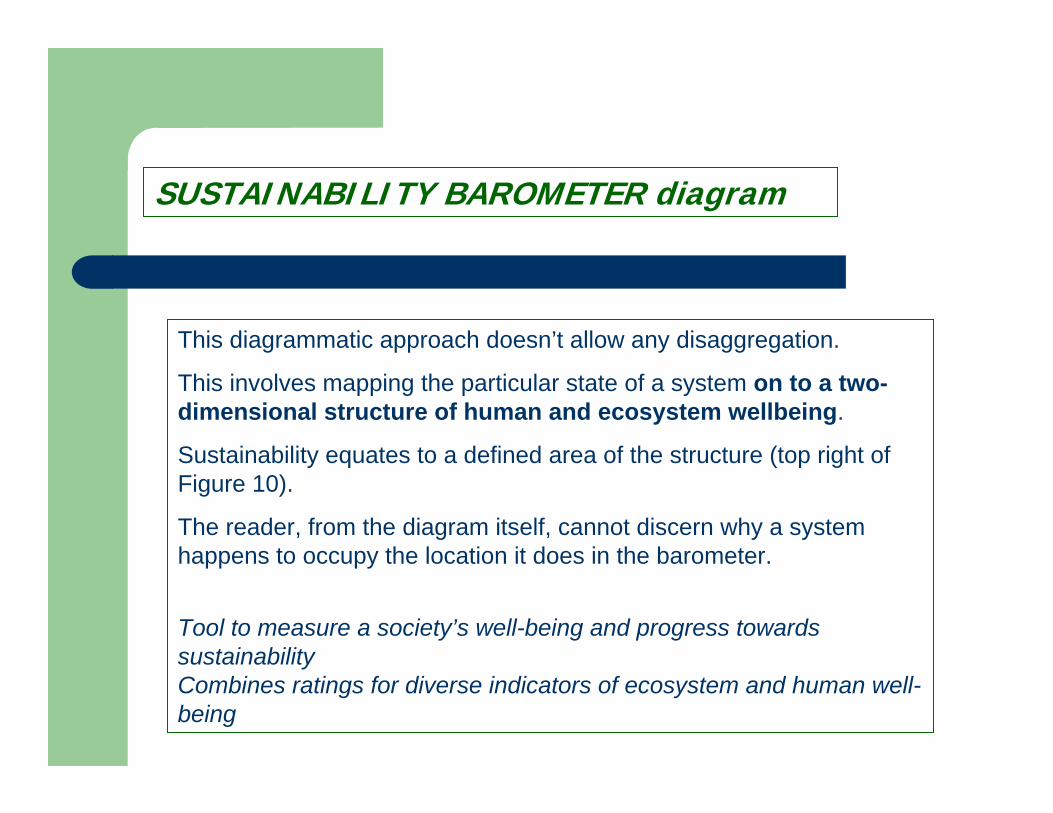
SUSTAINABILITY BAROMETER diagram
This diagrammatic approach doesn’t allow any disaggregation.
This involves mapping the particular state of a system on to a two-dimensional structure of human and ecosystem wellbeing.
Sustainability equates to a defined area of the structure (top right of Figure 10).
The reader, from the diagram itself, cannot discern why a systemhappens to occupy the location it does in the barometer.
Tool to measure a society’s well-being and progress towards sustainabilityCombines ratings for diverse indicators of ecosystem and human well-being

Figure 10. The International Union for Conservation of Nature and Natural Resources(IUCN) barometer of sustainability


The basis upon which these devices are founded – clarity for users – is bound up with the uses to which they will be put.
Scientists and technicians are interested primarily in data presented as tables, graphs etc., and possibly even raw uncondensed data.
Decision-makers and managers typically require some condensation of the data, particularly in terms of how it relates to goals and targets. With this group, visual devices such as those described above may be useful, but should also be capable of being unwrapped to reveal underlying data.
On the other hand, individual users (the public) prefer highly aggregated data (perhaps as an index) and visual devices.