sustainable energy in australia energy in australia ... school of chemical & biomolecular...
TRANSCRIPT
Sustainable Energy in Australia
Tony VassalloDelta Electricity Chair in Sustainable Energy Development
School of Chemical & Biomolecular Engineering
Griffith Hack SeminarThursday 13 August 2009

# 2
"Sustainable energy" ?
“Energy produced and used in ways that support human development over the long term in all its social, economic and environmental dimensions.”
Source: Energy and the challenge of sustainability, UNDP and World Energy Council 2000

# 3
Why Sustainable Energy? - the big challenges
• energy poverty - 1.6 B people without electricity• cost - rapid cost escalation for many reasons• energy security - peak oil?• climate change - worse than we thought?• ?

# 4
Sustainable energy – exploring pathways
'Centralised' Options
'Decentralised' Options
Coal with CCSNuclearSolar thermal
WindSolar photovoltaic (PV)Cogeneration
The need for deep cuts in emissions & what this might mean for Australia

# 5
Global warming - what is an acceptable risk?
Source: Malte Meinshausen Swiss Federal Institute of Technology, ETH Zurich 2005
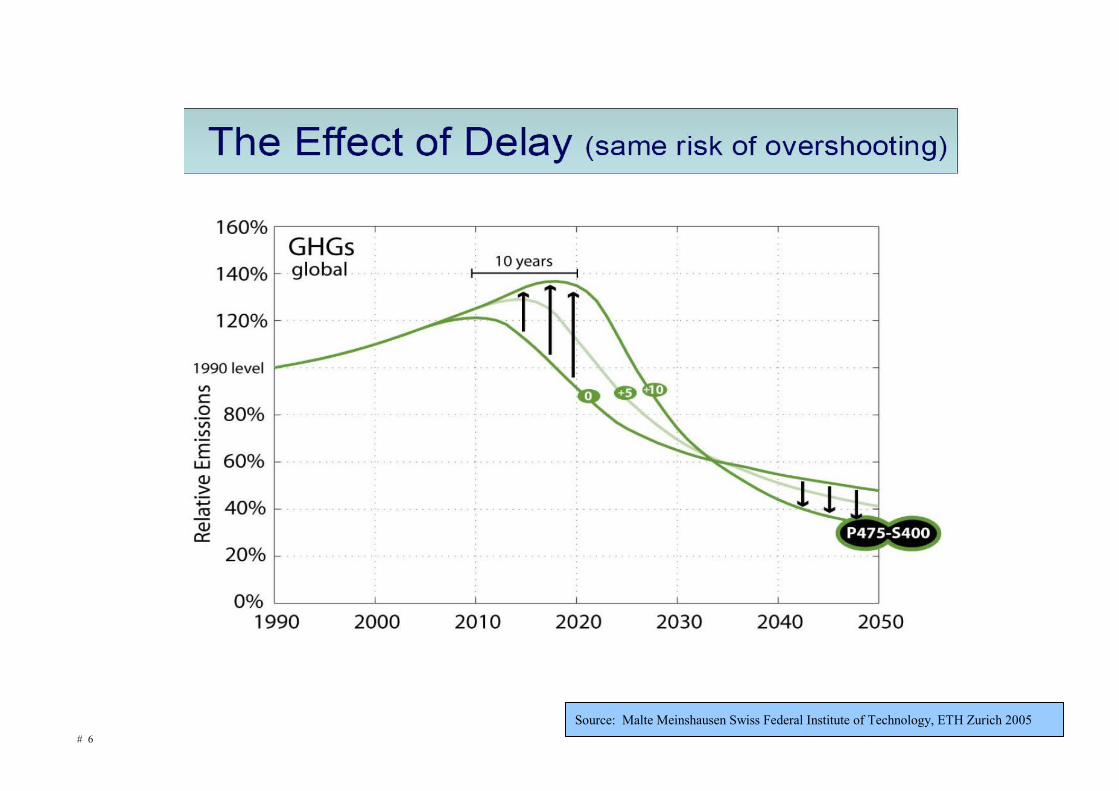
# 6
Source: Malte Meinshausen Swiss Federal Institute of Technology, ETH Zurich 2005
# 7
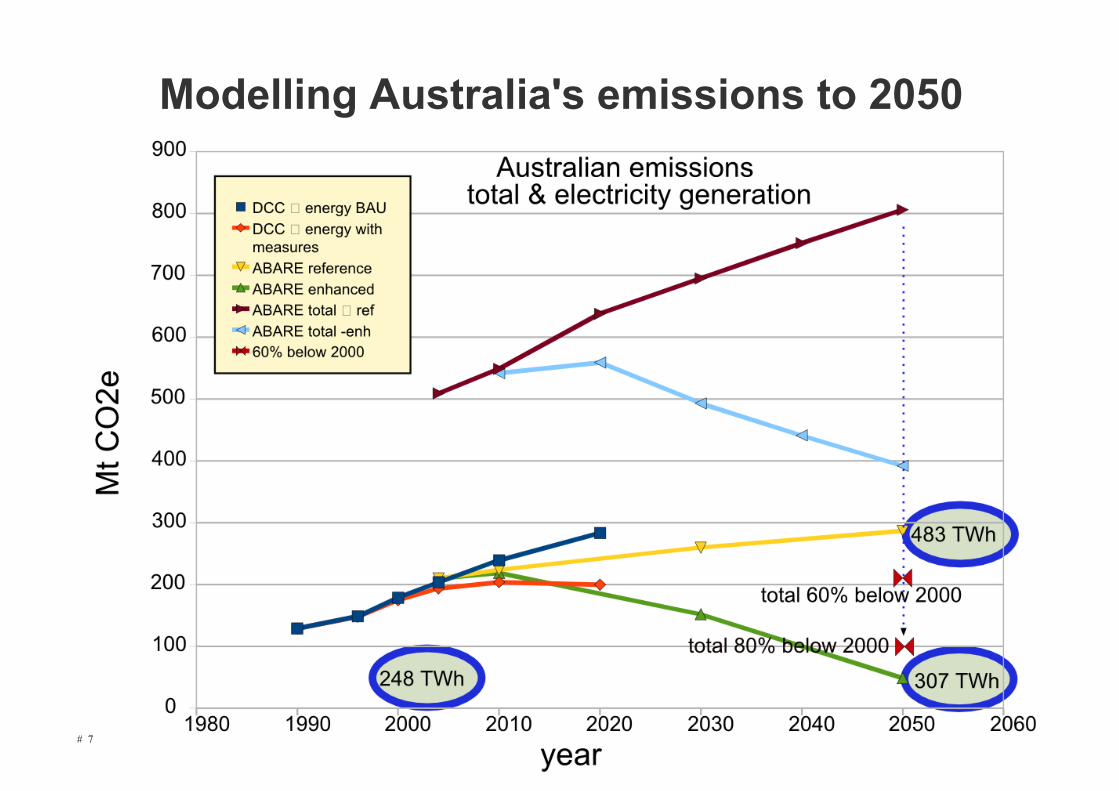
Modelling Australia's emissions to 2050

# 8
The 2020 CPRS Challenge
Source: Dept Climate Change, 2009, Tracking to Kyoto and 2020
# 9
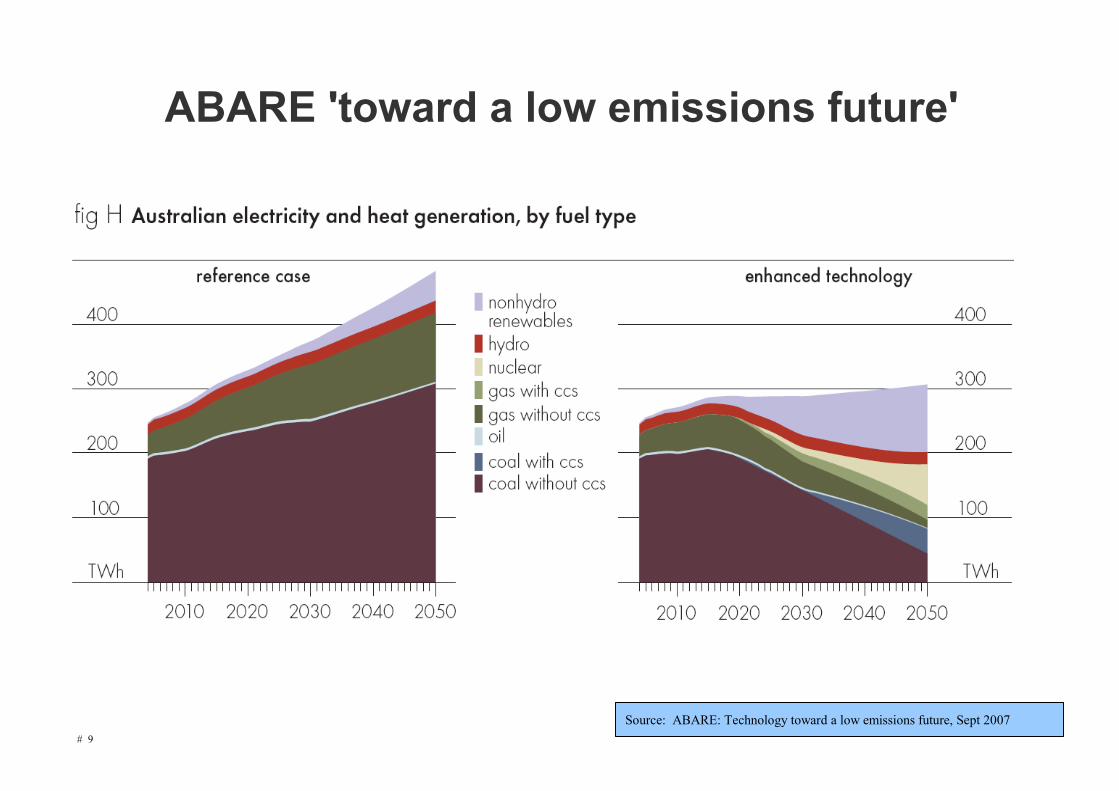
ABARE 'toward a low emissions future'
Source: ABARE: Technology toward a low emissions future, Sept 2007
# 10
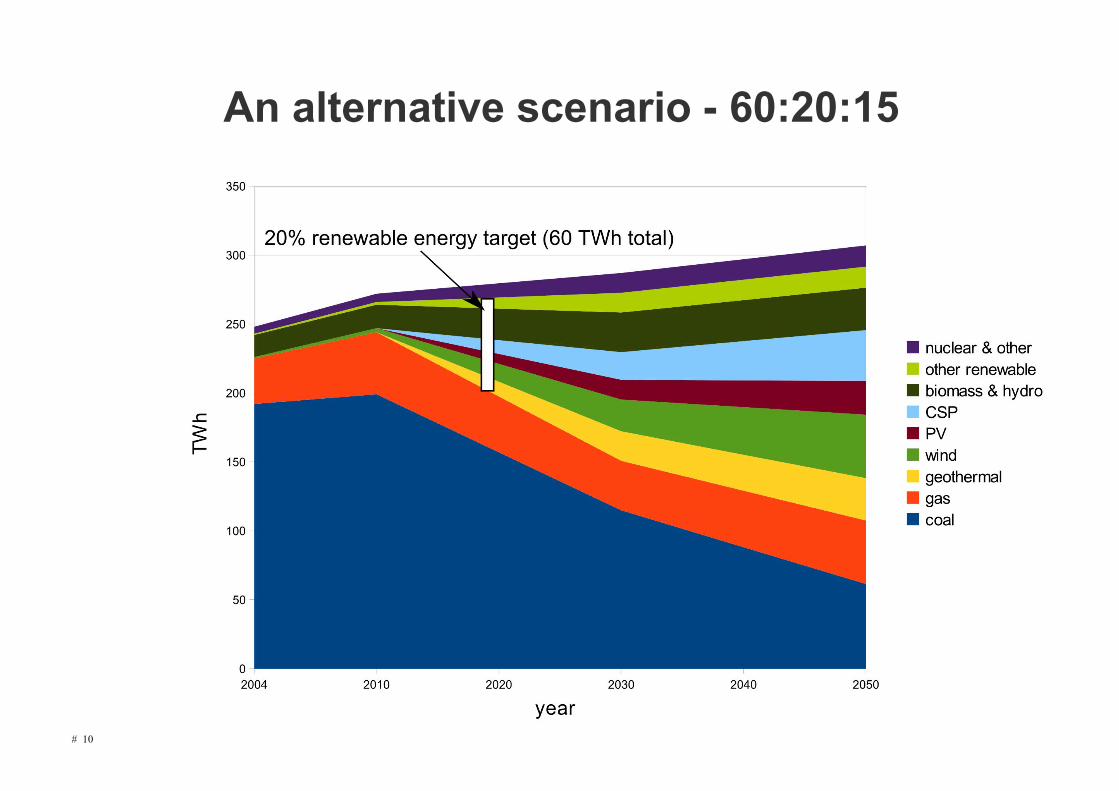
An alternative scenario - 60:20:15
# 11
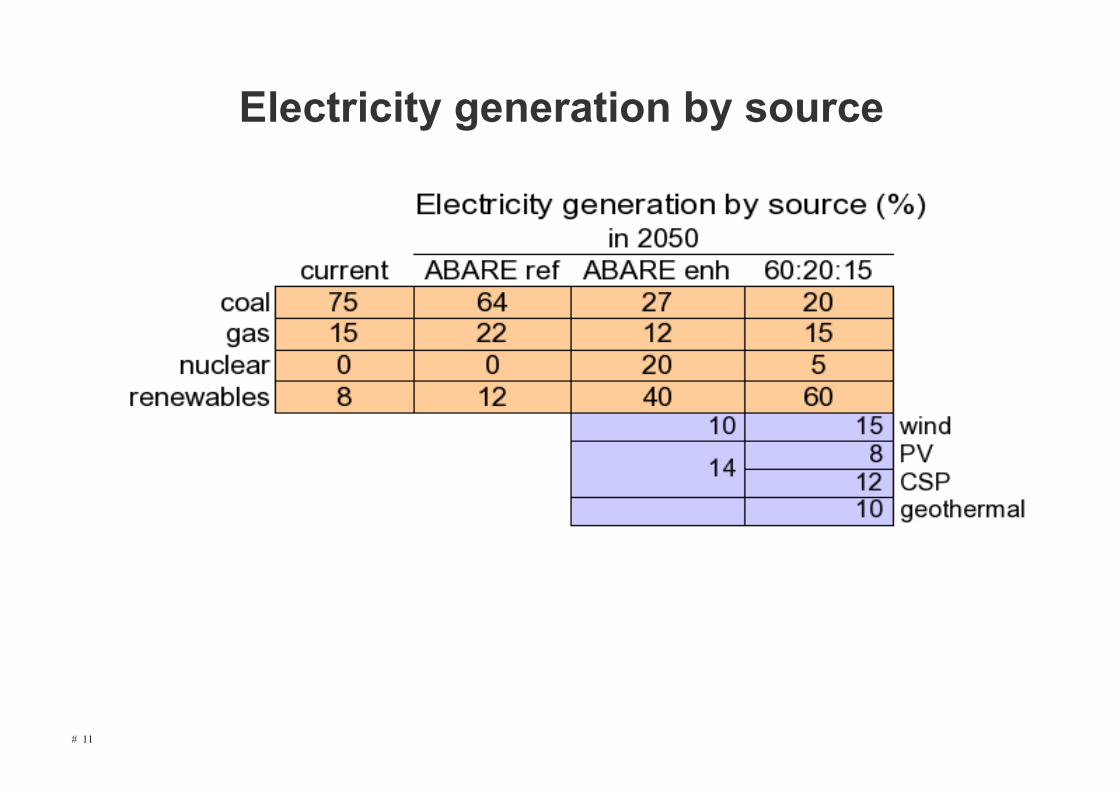
Electricity generation by source

Capacity of renewable electricity generation in Australia, 2007
Source: ABARE
total Australian generation capacity ~50,000 MW, but only 6.5% of electricity

Renewable energy sources
Source: European Renewable Energy Council
Solar energy is the ultimate source of (almost) all renewable energy supply - PV, solar thermal, wind, biomass …
# 14
Centralised electricity supply options
Nuclear– Well established– Low emissions– Australia has much of the world's
uranium– 'Safe'– 'Baseload'
# 15
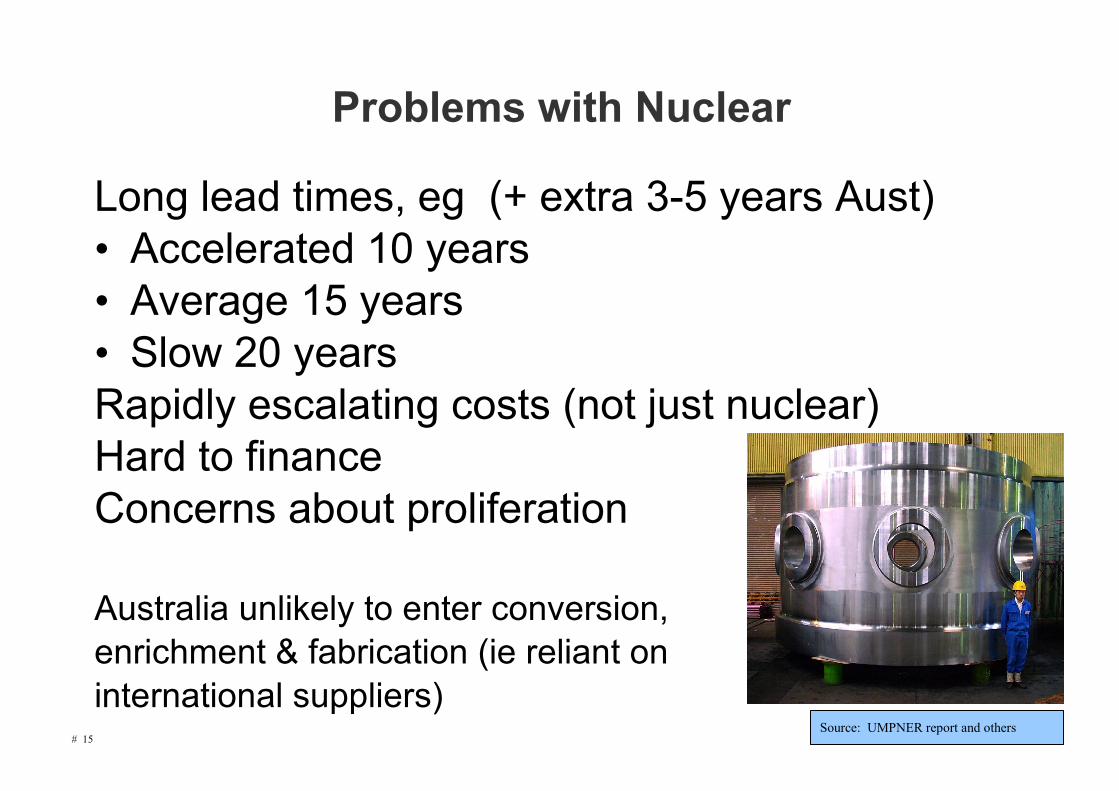
Problems with Nuclear
Long lead times, eg (+ extra 3-5 years Aust)• Accelerated 10 years• Average 15 years• Slow 20 yearsRapidly escalating costs (not just nuclear)Hard to financeConcerns about proliferation
Australia unlikely to enter conversion, enrichment & fabrication (ie reliant oninternational suppliers)
Source: UMPNER report and others

# 16
Nuclear - hard to finance?
“Financing of large and complex projects is a regular occurrence. What makes nuclear projects so hard to finance conventionally is not expense and complexity but risk -
risk of cost overruns, risk that the owners will not be able to meet schedules, risk that the plant will operate poorly, risk that demand will be overestimated, risk that other technologies will be available at lower costs.”
Peter A. Bradford, former Commissioner, United States Nuclear Regulatory Commission, Washington, D.C. In testimony to Florida Public Service Commission April 2008.
“No new projects have been financed by private risk capital” – rmi 2008

# 17
Nuclear power – current cost estimates
Source: Progress Energy Submission to Florida Public Service March 2008
$US14 B for 2 x 1050 MW plants~$7000/kW excluding transmission lines

# 18
Coal with Carbon Capture & Storage
Australia has huge coal reservesNo fuel supply riskLow emissions if CCSPotential to modify existing plant – extend lifeFuel infrastructure in place'Safe'
Image: CO2CRC
# 19
Problems with Carbon Capture & Storage
Fuel efficiency drops significantlyUneconomic to capture all CO2Rapidly escalating engineering & plant costs
(as with nuclear)CO2 storage may be 100's – 1000's km away -
extra pipelines, energy, riskStorage sites may not be ideal in AustraliaNot many depleted oil/gas wellsLiability for long term monitoring/riskStill wasting 65-70% of fuel energy
# 20
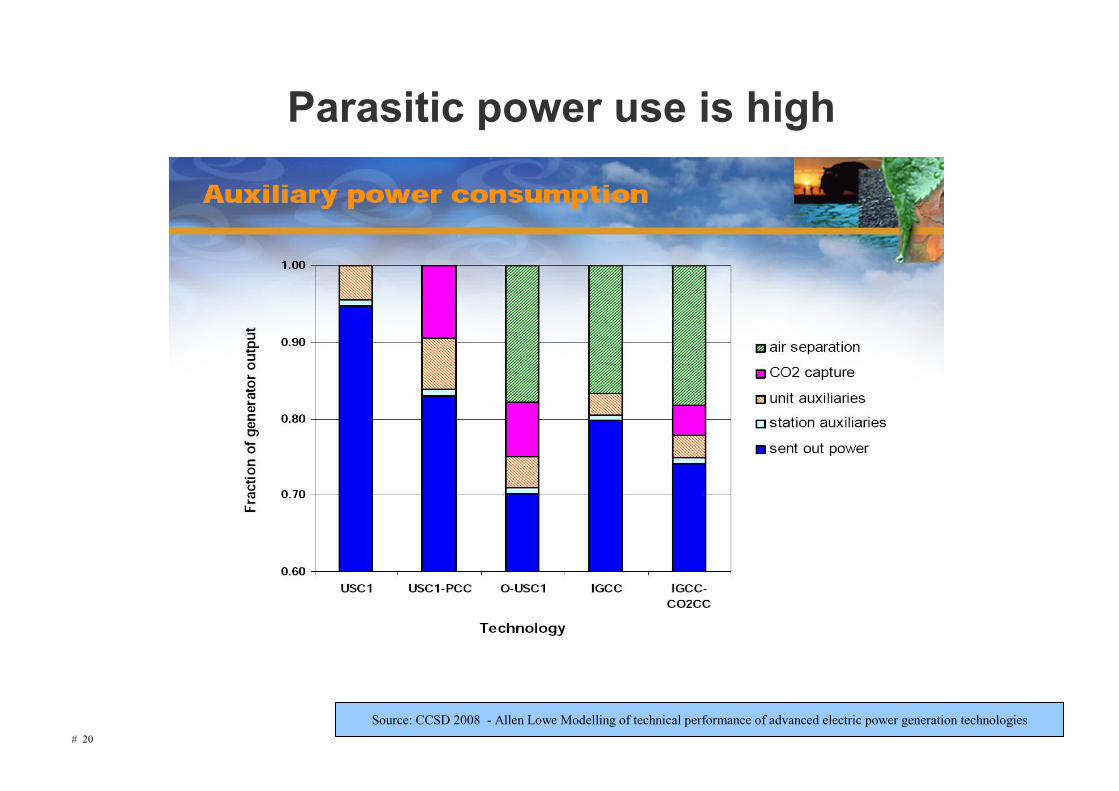
Source: CCSD 2008 - Allen Lowe Modelling of technical performance of advanced electric power generation technologies
Parasitic power use is high

# 21
Source: CCSD 2008 - Allen Lowe Modelling of technical performance of advanced electric power generation technologies
Sent out efficiency suffers

# 22
Source: CCSD 2008 - Allen Lowe Modelling of technical performance of advanced electric power generation technologies
Significant emissions reductions...

# 23
Source: Wuppertal Institute 2007
But other studies show less reduction
300 TWh * 0.25 tCO2/MWh = 75 Mt
# 24
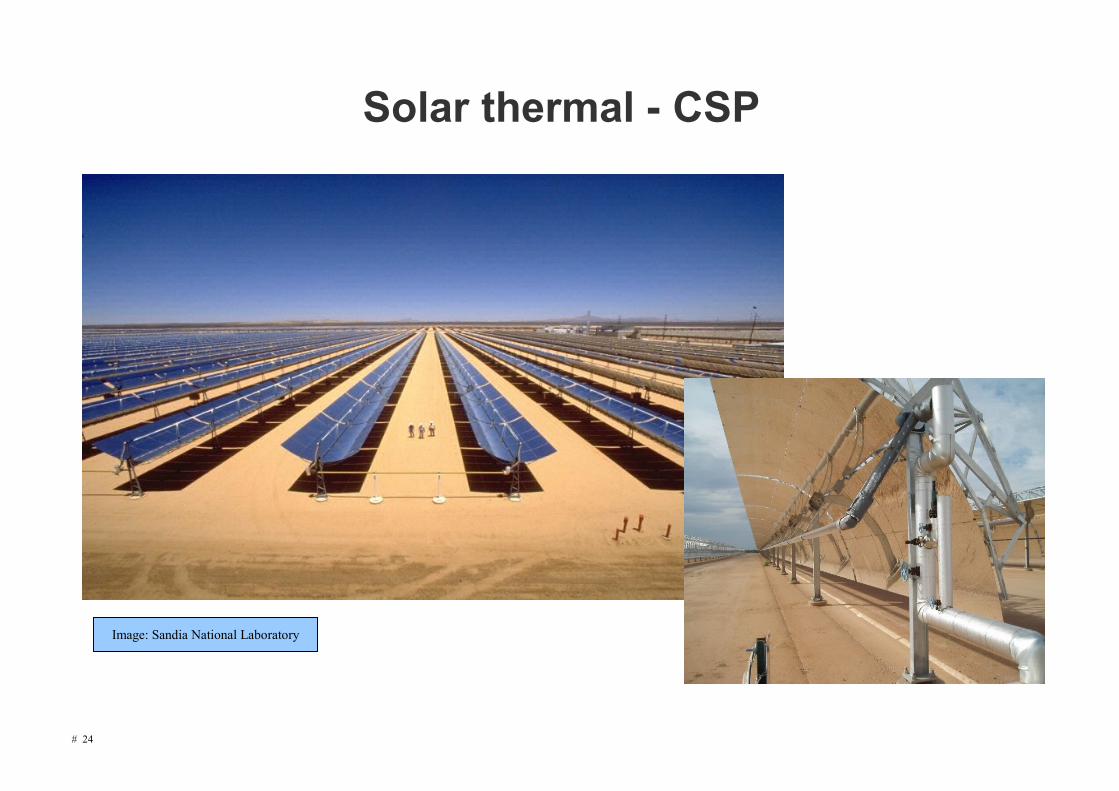
Solar thermal - CSP
Image: Sandia National Laboratory

# 25
Solar thermal - CSP
Compact linear FresnelCentral tower
# 26
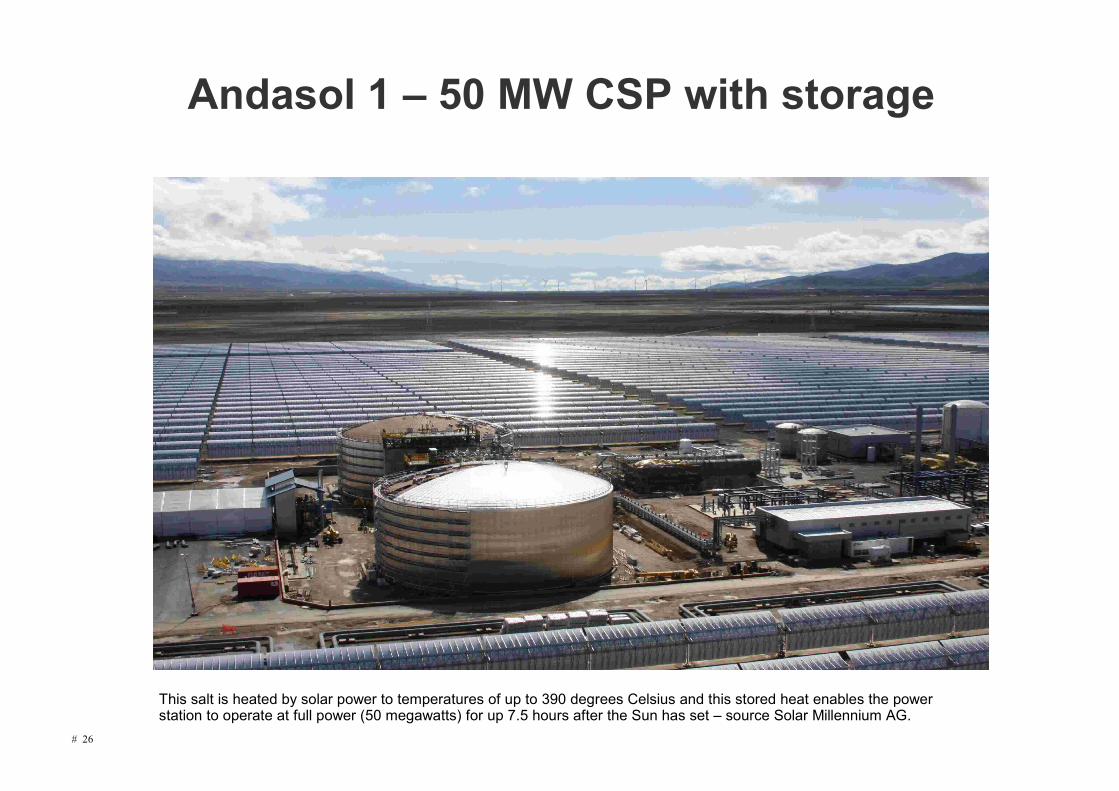
Andasol 1 – 50 MW CSP with storage
This salt is heated by solar power to temperatures of up to 390 degrees Celsius and this stored heat enables the power station to operate at full power (50 megawatts) for up 7.5 hours after the Sun has set – source Solar Millennium AG.
# 27
Solar thermal
Trough technology demonstrated & commercial Amenable to storage, so 'baseload' possible (but
storage really to extend operation into evening market prices)
No fuel risk – large resource in AustraliaIntegrates with existing power block technologyCan be hybridised with gas

# 28
Problems with solar thermal
High cost – estimated current LCOE ~$220 MWh for local plant using European/US trough technology (e.g. $1.6 B – 250 MW with 7h storage)
Remote from load, high transmission costsYet to be demonstrated at any scale in
Australia – trough? CLF? central tower?Significant materials and engineering issues,
depending on technologyMay still require water for cooling and cleaning

# 29
Decentralised electricity supply
WindSolar PVCogeneration
“The proportion of survey respondents anticipating that distributed generation will have the greatest impact has doubled – from 24% just two years ago to 49% in this year’s survey. Even more striking, the proportion expecting solar power plants to have the greatest impact has risen from 20% to 54% in the same period.” PricewaterhouseCoopers Utilities global survey 2008.
59%
62%X
X

# 30
Wind
Established, commercial, 'booming'2008 saw greater investment in wind than
nuclear or hydroSince 2000, 30% of all installed electricity
generating capacity in the EU has been wind power, 36% in 2008 – 8,484 MW bringing total to 65 GW
US installed 8,500 MW in 2008, bringing total US to 25 GW - “Wind power could provide 20% of U.S. electricity needs by 2030” – US DOE
Source: European Wind Energy Association and US DOE 20% Wind Energy by 2030
# 31
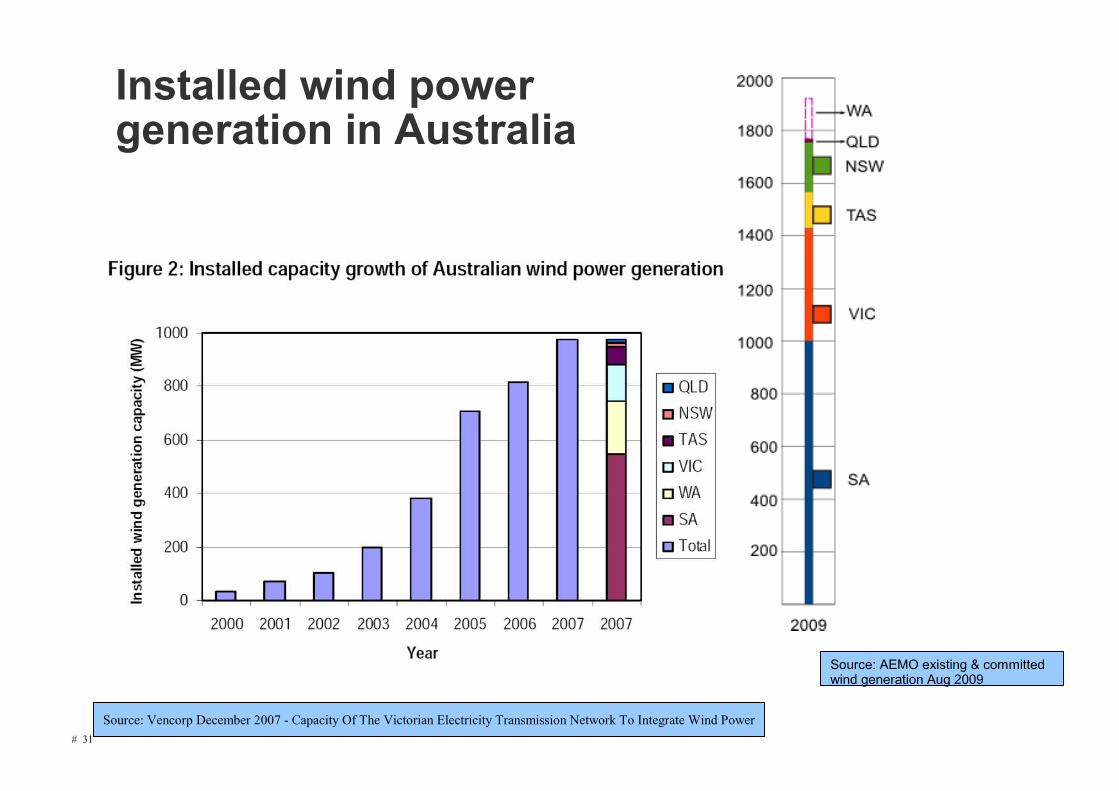
Installed wind power generation in Australia
Source: Vencorp December 2007 - Capacity Of The Victorian Electricity Transmission Network To Integrate Wind Power
Source: AEMO existing & committed wind generation Aug 2009

# 32
Problems with wind
Intermittency may cause grid instabilityProbably OK up to 20-25%“With the appropriate technical solutions, wind power generation of
approximately 3,000 MW installed capacity (and possibly up to 4,000 MW, depending on where generation is located) can be accommodated by the Victorian transmission network” [in 2016]. - Vencorp 2007
Resource may be remote from load – high transmission costs, losses
Land amenity, community acceptanceNot considered “firm”

# 33
Wind power output in South Australia
Source: Electricity Supply Industry Planning Council of South Australia 2009 Annual Planning Report

# 34
Source: Electricity Supply Industry Planning Council of South Australia 2009 Annual Planning Report
But ESIPC (and others) rank wind according to likely output at peak demand

# 35
(Poor) Correlation between NSW & Vic wind power
Source: Roam Consulting - Market impacts of CPRS and RET Dec 2008

# 36
Photovoltaic - PVNo fuel costs, huge resource in AustraliaSilent, no moving parts, no NOx, particulatesWidespread community acceptanceCan utilise otherwise unused roofs, landPotentially very low materials cost at scaleScalable from W to MW
# 37
Problems with PV
Very high costs – currentlyDiffuse resourceScale-up to make a difference – eg 30 TWh in
2050 (say 15 GW at 20% capacity)Seasonal, diurnal and hourly variability

# 38
Typical radiation resource in Sydney
# 39
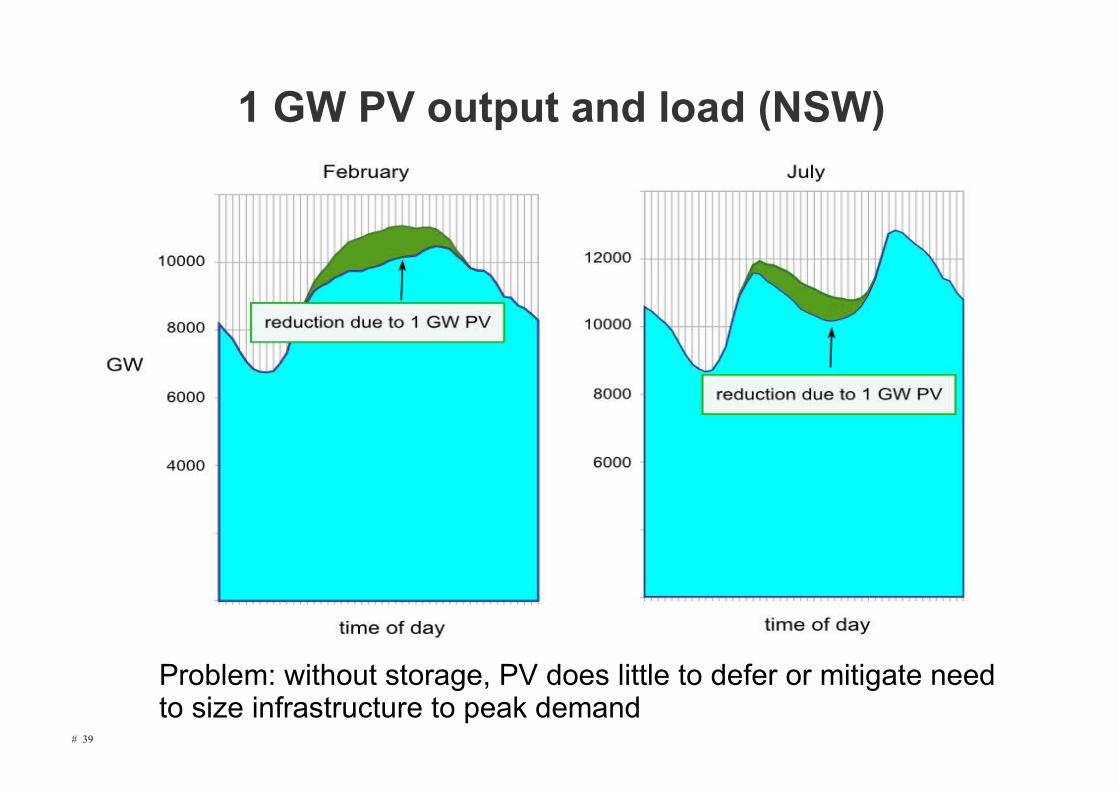
1 GW PV output and load (NSW)
Problem: without storage, PV does little to defer or mitigate need to size infrastructure to peak demand

# 40
PV – can it be done?

# 41
# 42
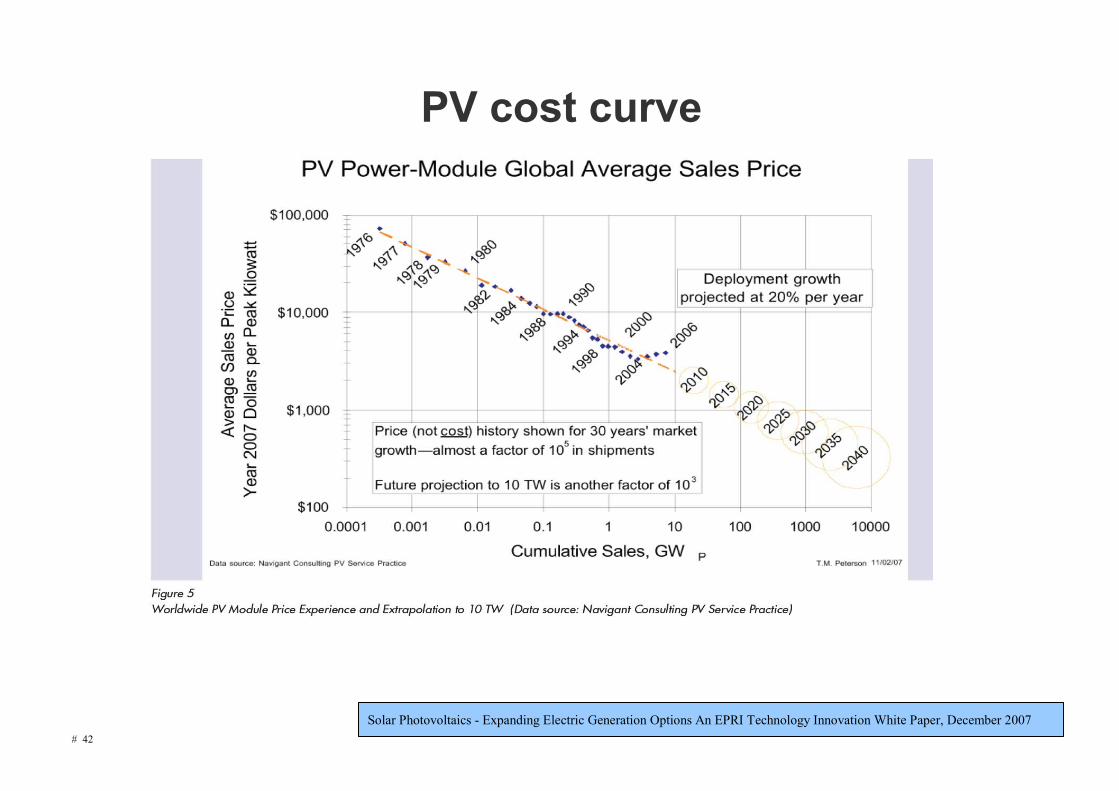
PV cost curve
Solar Photovoltaics - Expanding Electric Generation Options An EPRI Technology Innovation White Paper, December 2007

# 43
PV cost curve – grid parity?
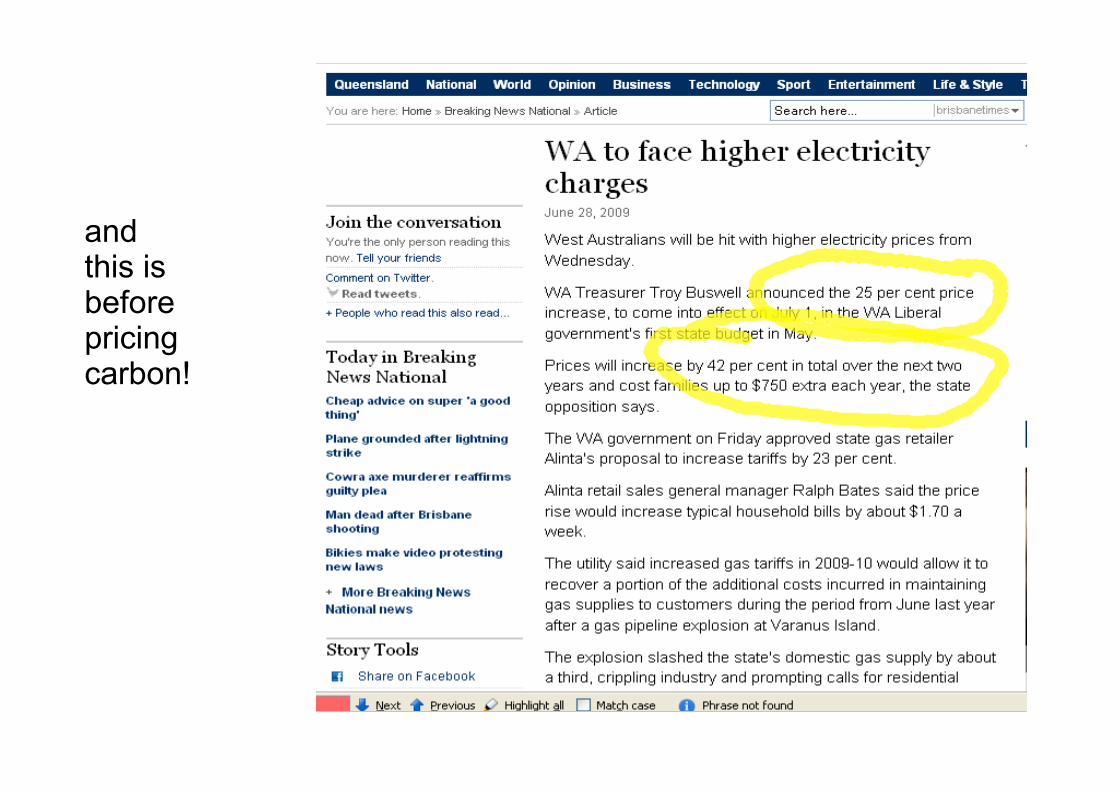
and this is before pricing carbon!

# 45
ROSEMEAD, Calif., March 27, 2008 – “Southern California Edison (SCE) today launched the nation’s largest solar cell installation, a project that will place 250 megawatts of advanced photovoltaic generating technology on 65 million square feet of roofs of Southern California commercial buildings” [Southern California Edison is the largest electric utility in California].
3 km2 - assume 10% coverage = 30 MW in Wetherill Park

# 46
Efficiency penalty of large fossil fuel power generation
in NSW 1 MWh electricity produces 1.06 tonnes CO2
to heat 1L water to 100°C with electric jug produces ~100 g CO2
Conventional Power System Efficiency
# 47
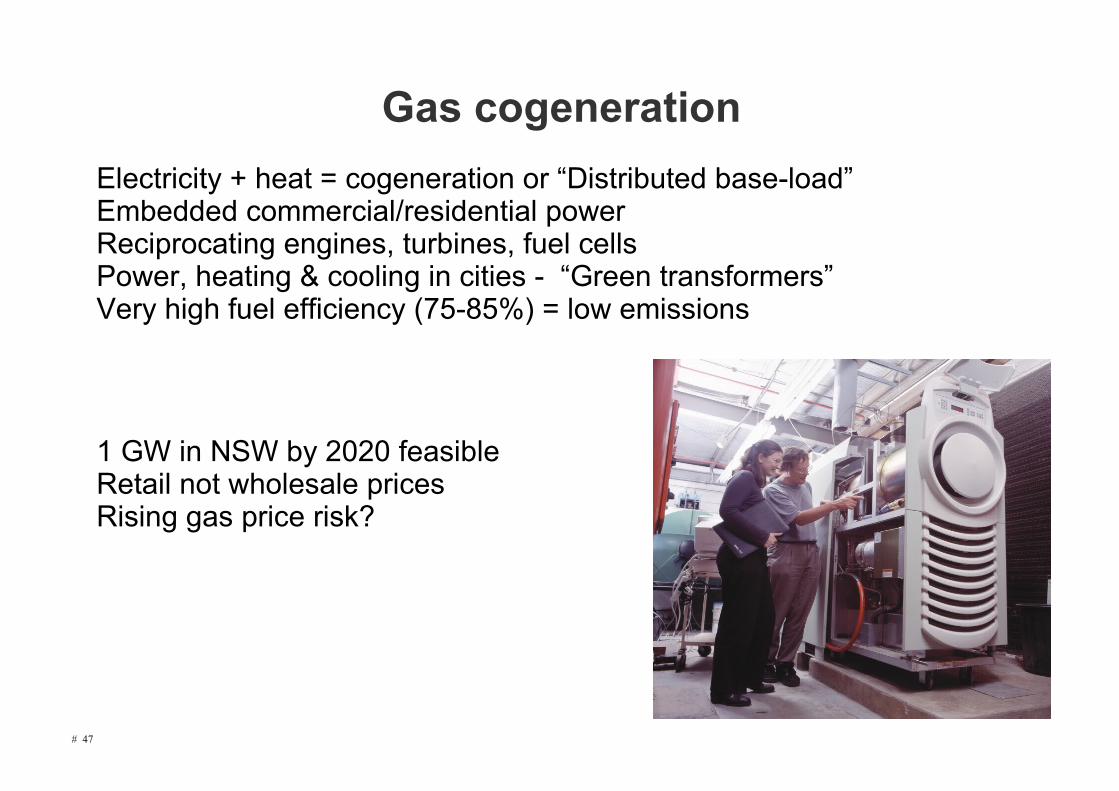
Gas cogenerationElectricity + heat = cogeneration or “Distributed base-load”Embedded commercial/residential powerReciprocating engines, turbines, fuel cellsPower, heating & cooling in cities - “Green transformers”Very high fuel efficiency (75-85%) = low emissions
1 GW in NSW by 2020 feasibleRetail not wholesale pricesRising gas price risk?

# 48
City of Sydney Decentralised Energy Master Plan
330+ MWco-trigen
for 70% of supply
Source: City of Sydney 2030 Vision

# 49
GridX cogeneration NSW
Local generation of electricity from natural gas, with hot and chilled water supplied to homes

# 50
Energy storage – the missing technology?
• electricity is the only major commodity that cannot easily be stored in large quantities
• lack of storage drives price volatility – from -$20 to $10,000 /MWh
• electricity supply system must be sized to cope with maximum demand, which may only represent a few hours/year

Energy storage required for some recognisable applications
storage requirement possible storage technologyJ
nickel-metal-hydride battery
20 kWh lead acid battery2500 kWh lead-acid or flow battery
6 MWh as above
660 MWh
approximate energy storage required
Whlaptop computer for 2 hr 30 Wh 108 kJ li-ion batteryhybrid electric vehicle (Toyota Prius) 1700 Wh 6 MJaverage Australian suburban house electrical use for 24 hr 72 MJcommercial building 24 hr 9 GJsubstation 1 hr 21.6 GJone 660 MW power station generator for 1 hr 2376 GJ
hydroelectric or large scale flow battery, compressed air

# 52
World's largest battery - Fairbanks Alaska 40 MW for 7 mins or 27 MW for 15 minutes.

# 53
Large scale – hybrid with gasunderground compressed air storage
e.g. 300 MW for 3 hr output using 200 MW from stored air pressure

# 54
Smaller, distributed storage systems such as flow batteries
25 kW for 2 hours
250 kW for 2 hours

# 55
How much does (electrical) storage cost?
Assumptions: zero cost of energy (ie only the additional cost due to storage)75% round trip storage efficiency,1 full (100%) charge/discharge cycle per day15 year life, no ongoing O&M costs

# 56
Where to site storage?
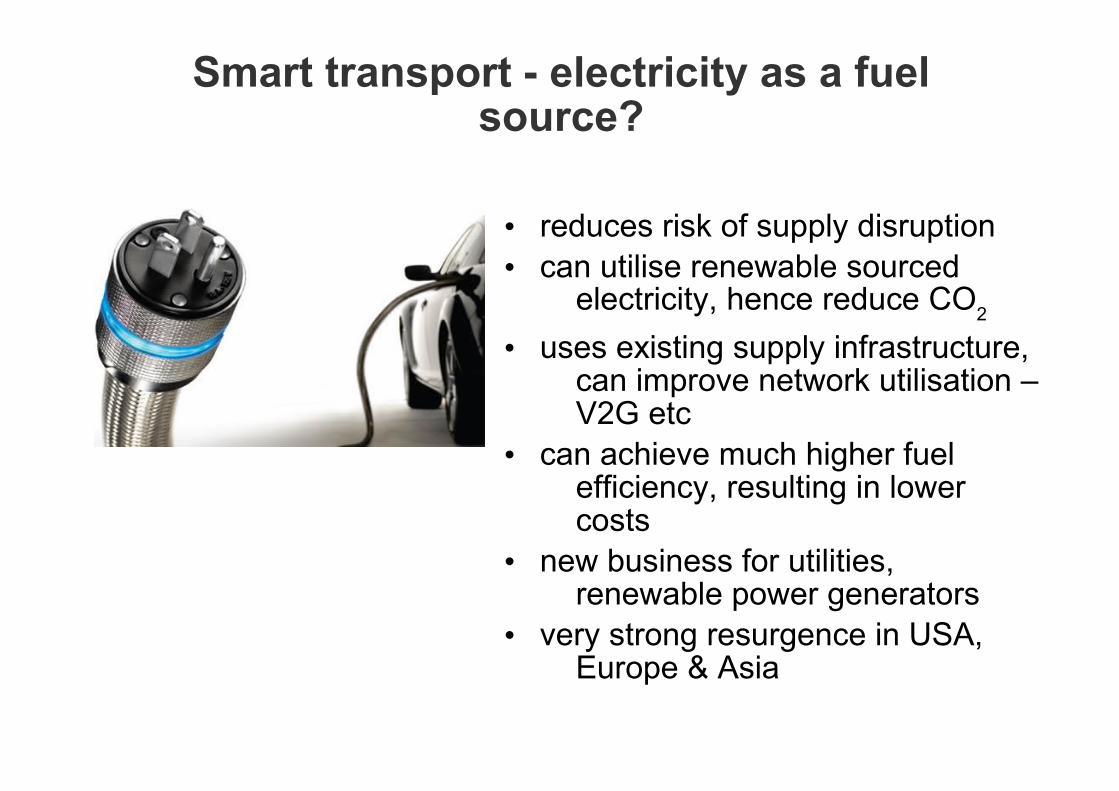
Smart transport - electricity as a fuel source?
• reduces risk of supply disruption• can utilise renewable sourced
electricity, hence reduce CO2
• uses existing supply infrastructure, can improve network utilisation – V2G etc
• can achieve much higher fuel efficiency, resulting in lower costs
• new business for utilities, renewable power generators
• very strong resurgence in USA, Europe & Asia

How much vehicle storage would be available?
10 kWh battery (small)30% 'storage for rent”3 MWh/1000 vehiclesto equal a 300 MW gas peaking plant 100,000 vehicles
25 kWh battery (med)30% 'storage for rent'7.5 MWh/1000 vehiclesto equal a 300 MW gas peaking plant 40,000 vehicles (~Ryde LGA)

# 59
Electricity supply & market evolution
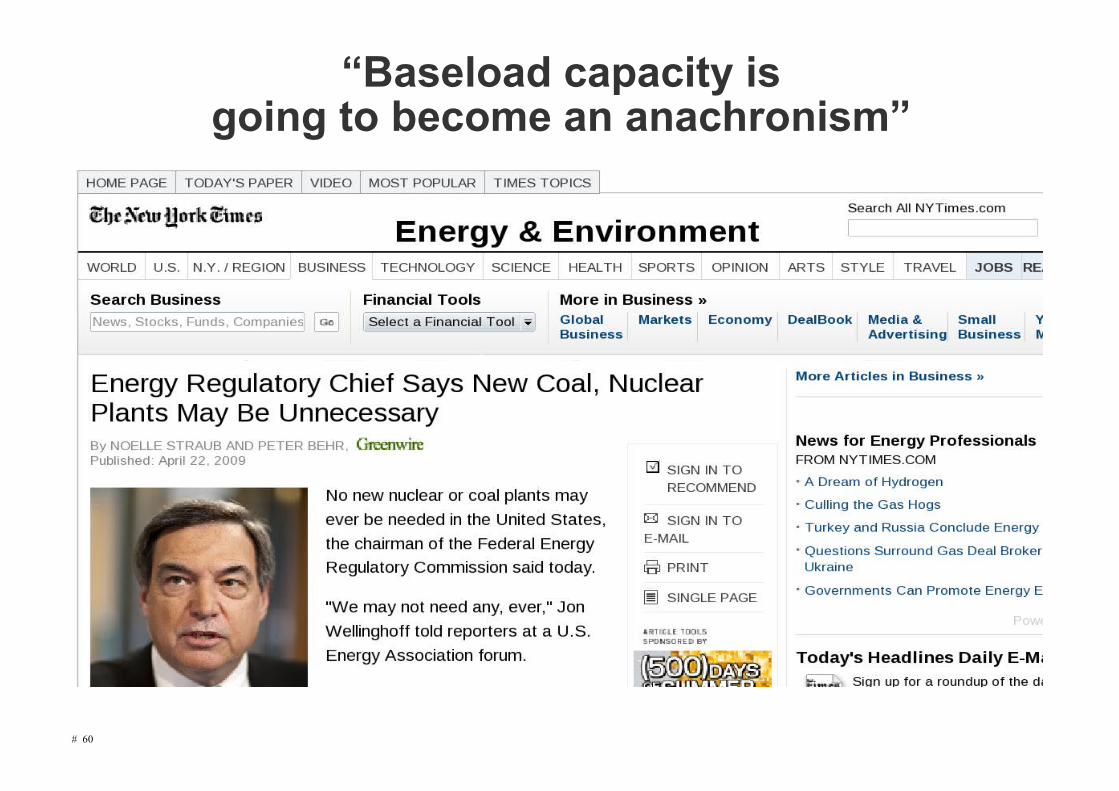
# 60
“Baseload capacity isgoing to become an anachronism”

# 61
What effect on pool price?
# 62
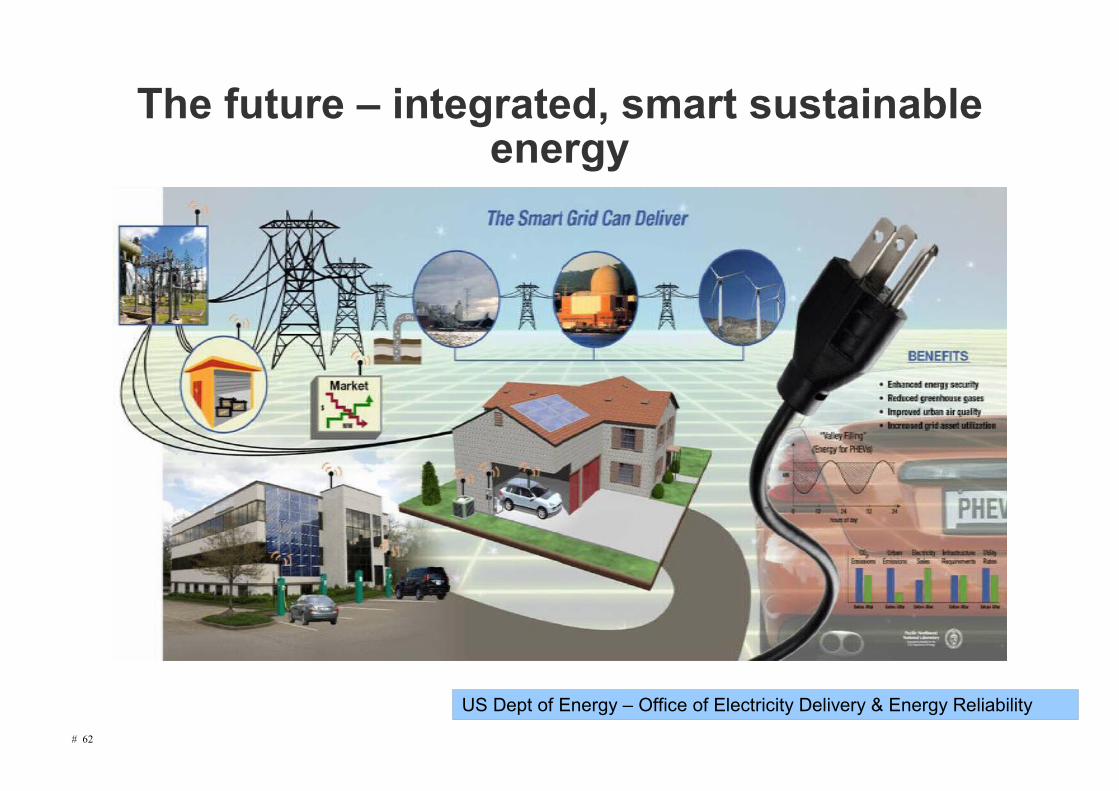
US Dept of Energy – Office of Electricity Delivery & Energy Reliability
The future – integrated, smart sustainable energy
# 63
Questions?
Source: Tandberg – Fairfax media