south australia energy systems assessment … · south australia energy systems assessment south...
TRANSCRIPT
highway
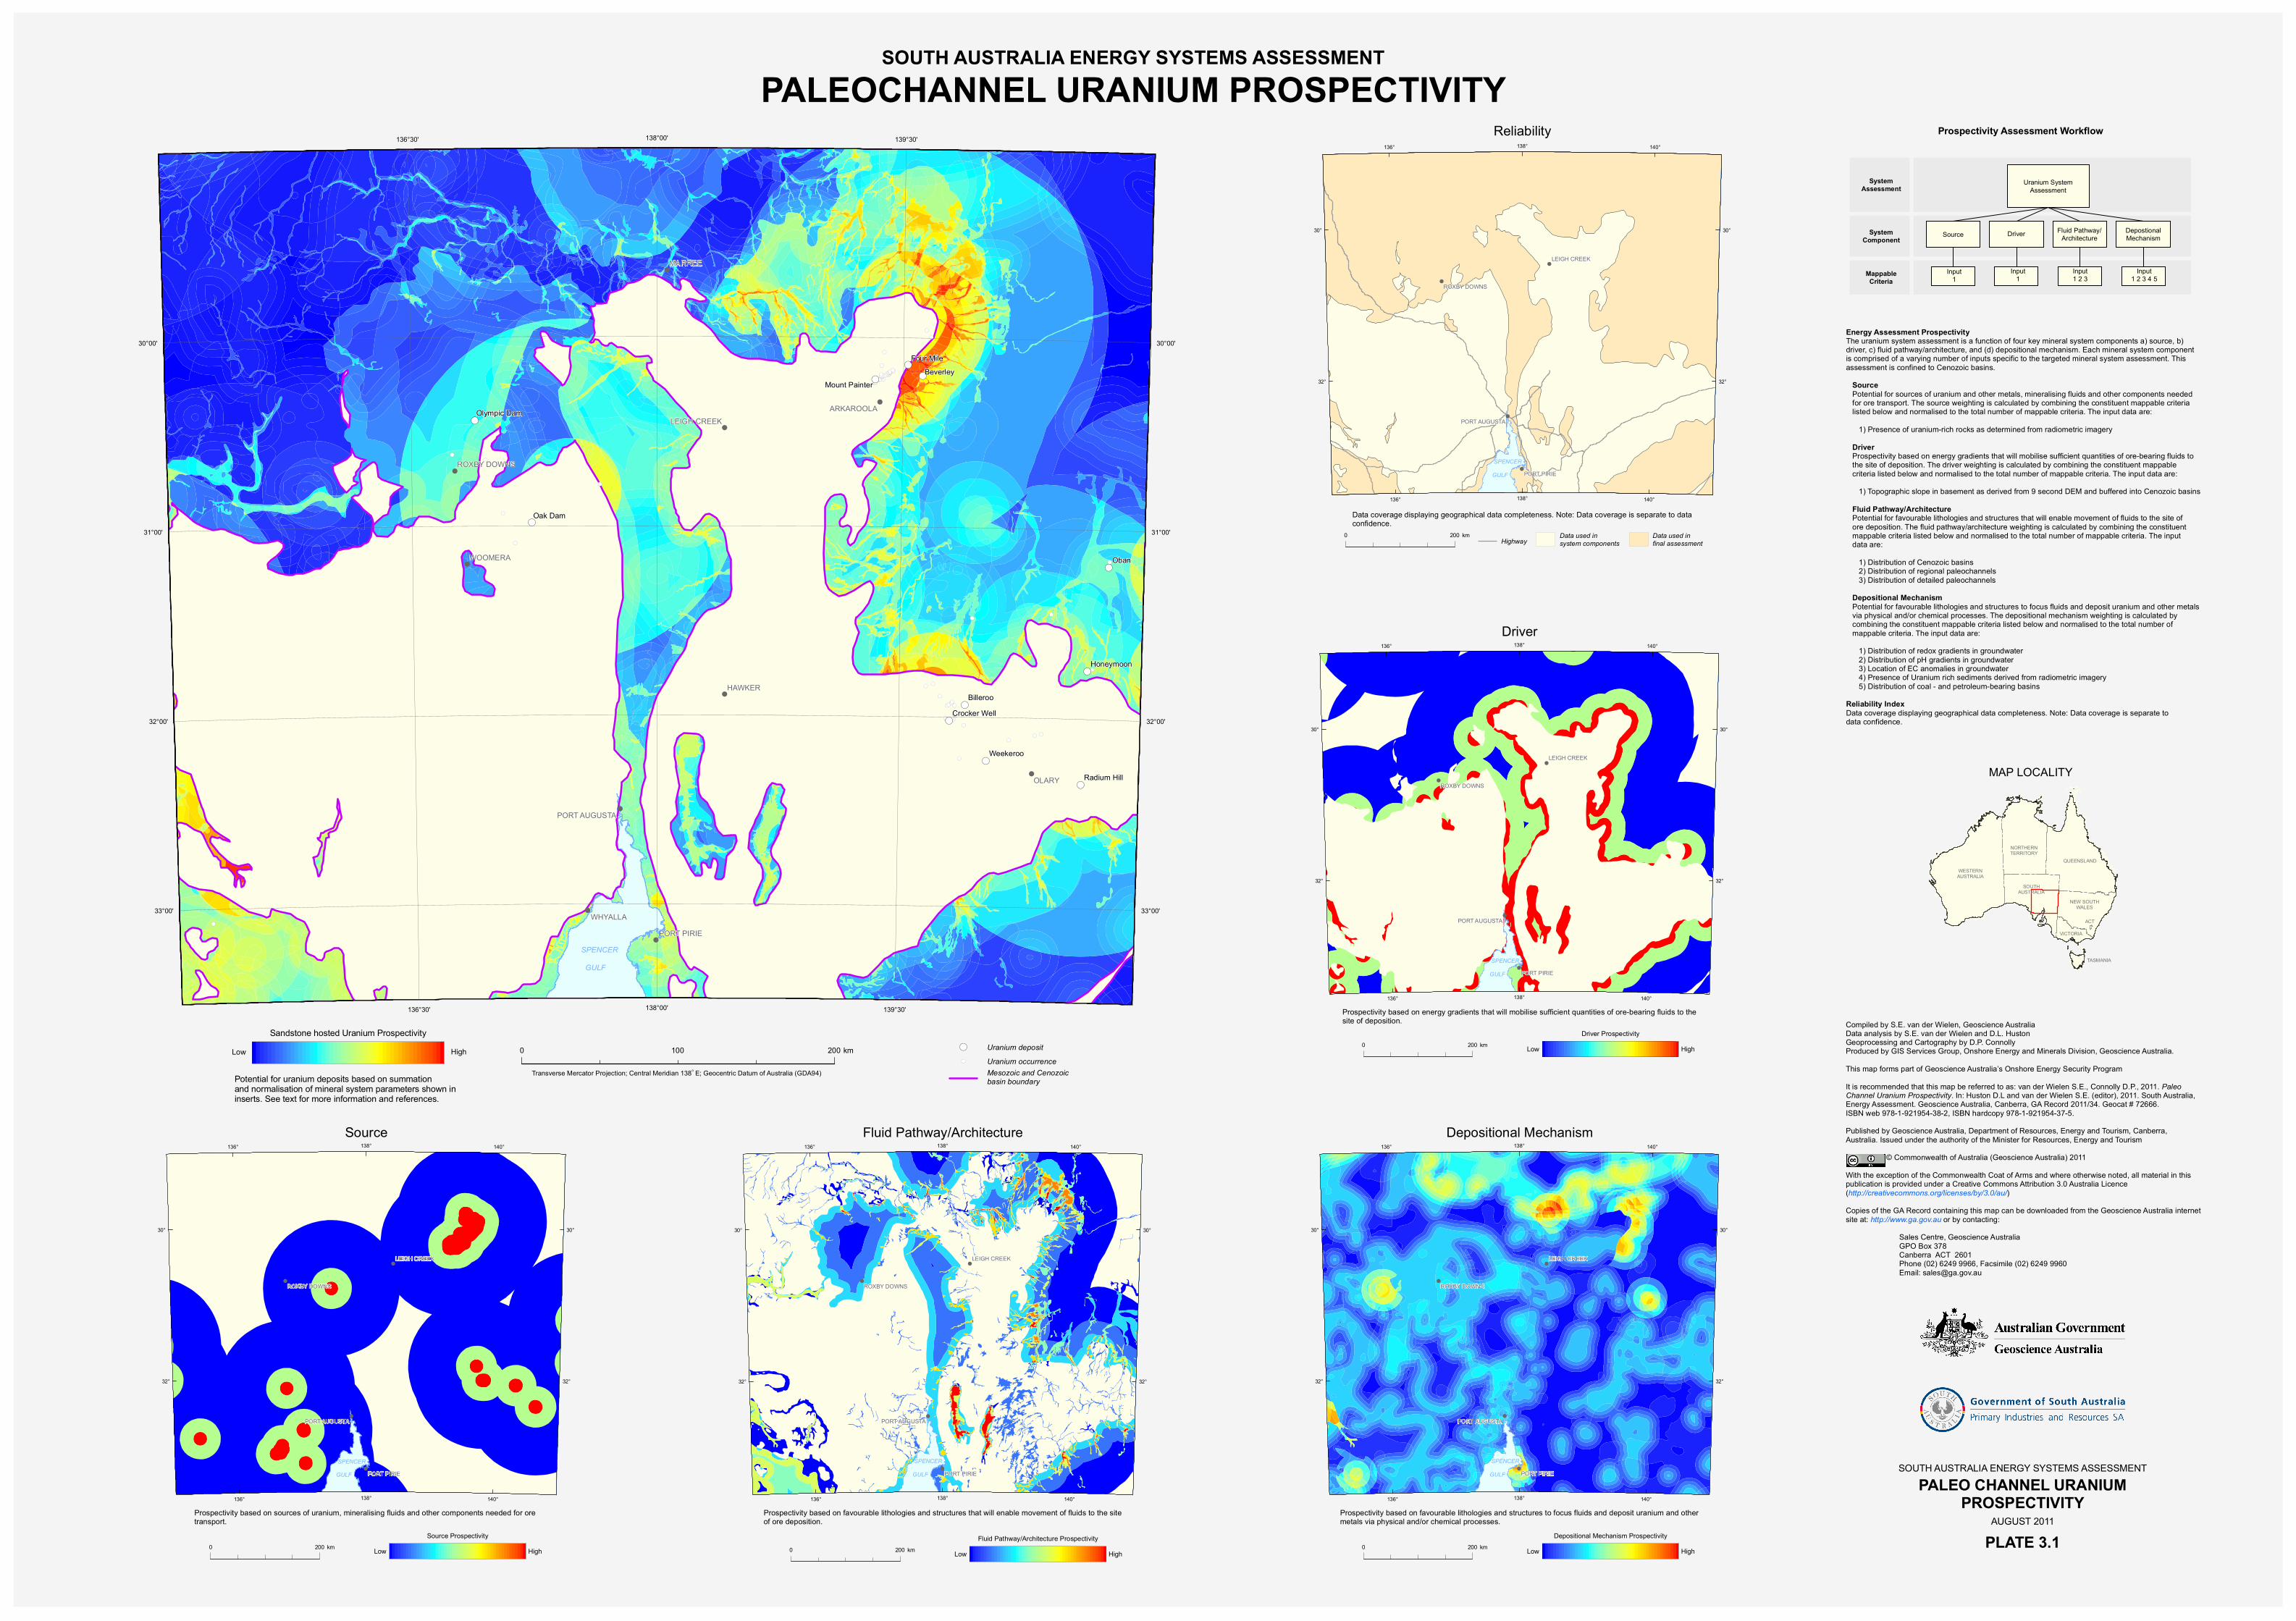
PALEOCHANNEL URANIUM PROSPECTIVITY
PALEO CHANNEL URANIUMPROSPECTIVITY
AUGUST 2011
SOUTH AUSTRALIA ENERGY SYSTEMS ASSESSMENT
SOUTH AUSTRALIA ENERGY SYSTEMS ASSESSMENT
PLATE 3.1
!(
!(!(
!(
!(!( !(
!(!(!(!( !(!(!(!(
!(!(!(!(
!( !(!(!(!(
!(
!(!(
!(
!(
!(!(
!(
!(
!(
!(!(
!(!(
!(!(!(!(!(!(!( !(!(!(!(!(!(!(!( !(!(!(!(!(
!(!(!(!(
!(
!(
!(
!(
!(
!(
!(
!(
!(
!( !(
!(
!(
!(
!
!
!
!
!
!
!
!
!
!
OLARY
MARREE
HAWKER
WHYALLA
ARKAROOLA
PORT PIRIE
LEIGH CREEK
ROXBY DOWNS
PORT AUGUSTA
WOOMERA Oban
Oak Dam
Beverley
Billeroo
Weekeroo
Four Mile
Honeymoon
Olympic Dam
Radium Hill
Crocker Well
Mount Painter
Low High
!
!
!
!
PORT PIRIE
LEIGH CREEK
ROXBY DOWNS
PORT AUGUSTA
138°
138°
136°
136°
140°
140°
30° 30°
32° 32°
Reliability
km0 200
SPENCER GULF
!
!
!
!
PORT PIRIE
LEIGH CREEK
ROXBY DOWNS
PORT AUGUSTA
138°
138°
136°
136°
140°
140°
30° 30°
32° 32°
Driver
km0 200
SPENCER GULF
Low HighDriver Prospectivity
!
!
!
!
PORT PIRIE
LEIGH CREEK
ROXBY DOWNS
PORT AUGUSTA
138°
138°
136°
136°
140°
140°
30° 30°
32° 32°
Depositional Mechanism
km0 200
SPENCER GULF
Low HighDepositional Mechanism Prospectivity
!
!
!
!
PORT PIRIE
LEIGH CREEK
ROXBY DOWNS
PORT AUGUSTA
138°
138°
136°
136°
140°
140°
30° 30°
32° 32°
km0 200
SPENCER GULF
Low HighFluid Pathway/Architecture Prospectivity
!
!
!
!
PORT PIRIE
LEIGH CREEK
ROXBY DOWNS
PORT AUGUSTA
SPENCER GULF
138°
138°
136°
136°
140°
140°
30° 30°
32° 32°
Source
km0 200 Low HighSource Prospectivity
Prospectivity based on sources of uranium, mineralising fluids and other components needed for oretransport.
Prospectivity based on favourable lithologies and structures that will enable movement of fluids to the siteof ore deposition.
Prospectivity based on favourable lithologies and structures to focus fluids and deposit uranium and othermetals via physical and/or chemical processes.
Prospectivity based on energy gradients that will mobilise sufficient quantities of ore-bearing fluids to thesite of deposition.
Data coverage displaying geographical data completeness. Note: Data coverage is separate to dataconfidence.
Potential for uranium deposits based on summationand normalisation of mineral system parameters shown ininserts. See text for more information and references.
Sandstone hosted Uranium Prospectivity
SPENCER GULF
Transverse Mercator Projection; Central Meridian 138o E; Geocentric Datum of Australia (GDA94)
km0 200100
Energy Assessment ProspectivityThe uranium system assessment is a function of four key mineral system components a) source, b)driver, c) fluid pathway/architecture, and (d) depositional mechanism. Each mineral system componentis comprised of a varying number of inputs specific to the targeted mineral system assessment. Thisassessment is confined to Cenozoic basins. Source Potential for sources of uranium and other metals, mineralising fluids and other components needed for ore transport. The source weighting is calculated by combining the constituent mappable criteria listed below and normalised to the total number of mappable criteria. The input data are: 1) Presence of uranium-rich rocks as determined from radiometric imagery Driver Prospectivity based on energy gradients that will mobilise sufficient quantities of ore-bearing fluids to the site of deposition. The driver weighting is calculated by combining the constituent mappable criteria listed below and normalised to the total number of mappable criteria. The input data are: 1) Topographic slope in basement as derived from 9 second DEM and buffered into Cenozoic basins Fluid Pathway/Architecture Potential for favourable lithologies and structures that will enable movement of fluids to the site of ore deposition. The fluid pathway/architecture weighting is calculated by combining the constituent mappable criteria listed below and normalised to the total number of mappable criteria. The input data are: 1) Distribution of Cenozoic basins 2) Distribution of regional paleochannels 3) Distribution of detailed paleochannels Depositional Mechanism Potential for favourable lithologies and structures to focus fluids and deposit uranium and other metals via physical and/or chemical processes. The depositional mechanism weighting is calculated by combining the constituent mappable criteria listed below and normalised to the total number of mappable criteria. The input data are: 1) Distribution of redox gradients in groundwater 2) Distribution of pH gradients in groundwater 3) Location of EC anomalies in groundwater 4) Presence of Uranium rich sediments derived from radiometric imagery 5) Distribution of coal - and petroleum-bearing basinsReliability IndexData coverage displaying geographical data completeness. Note: Data coverage is separate todata confidence.
138°00'
138°00'
136°30'
136°30'
139°30'
139°30'
30°00' 30°00'
31°00' 31°00'
32°00' 32°00'
33°00' 33°00'
SOUTHAUSTRALIA
WESTERNAUSTRALIA
NORTHERNTERRITORY
QUEENSLAND
NEW SOUTHWALES
VICTORIA
TASMANIA
ACT
MAP LOCALITY
Fluid Pathway/Architecture
Prospectivity Assessment Workflow
MappableCriteria
SystemAssessment
SystemComponent
Uranium SystemAssessment
Source Fluid Pathway/Architecture
DepositionalMechanism Driver
Input1
Input1
Input1 2 3
Input1 2 3 4 5
Driver Fluid Pathway/Architecture
DepostionalMechanism
Compiled by S.E. van der Wielen, Geoscience AustraliaData analysis by S.E. van der Wielen and D.L. HustonGeoprocessing and Cartography by D.P. ConnollyProduced by GIS Services Group, Onshore Energy and Minerals Division, Geoscience Australia.This map forms part of Geoscience Australia’s Onshore Energy Security ProgramIt is recommended that this map be referred to as: van der Wielen S.E., Connolly D.P., 2011. PaleoChannel Uranium Prospectivity. In: Huston D.L and van der Wielen S.E. (editor), 2011. South Australia,Energy Assessment. Geoscience Australia, Canberra, GA Record 2011/34. Geocat # 72666.ISBN web 978-1-921954-38-2, ISBN hardcopy 978-1-921954-37-5.Published by Geoscience Australia, Department of Resources, Energy and Tourism, Canberra,Australia. Issued under the authority of the Minister for Resources, Energy and Tourism © Commonwealth of Australia (Geoscience Australia) 2011With the exception of the Commonwealth Coat of Arms and where otherwise noted, all material in thispublication is provided under a Creative Commons Attribution 3.0 Australia Licence(http://creativecommons.org/licenses/by/3.0/au/)Copies of the GA Record containing this map can be downloaded from the Geoscience Australia internetsite at: http://www.ga.gov.au or by contacting: Sales Centre, Geoscience Australia GPO Box 378 Canberra ACT 2601 Phone (02) 6249 9966, Facsimile (02) 6249 9960 Email: [email protected]
Data used insystem componentsHighway Data used in
final assessment
Uranium depositUranium occurrence!(
!(
Mesozoic and Cenozoicbasin boundary