sustainable development part1
TRANSCRIPT
8/7/2019 Sustainable Development Part1
http://slidepdf.com/reader/full/sustainable-development-part1 1/28
v2
PLANET EARTH
8/7/2019 Sustainable Development Part1
http://slidepdf.com/reader/full/sustainable-development-part1 2/28
v2
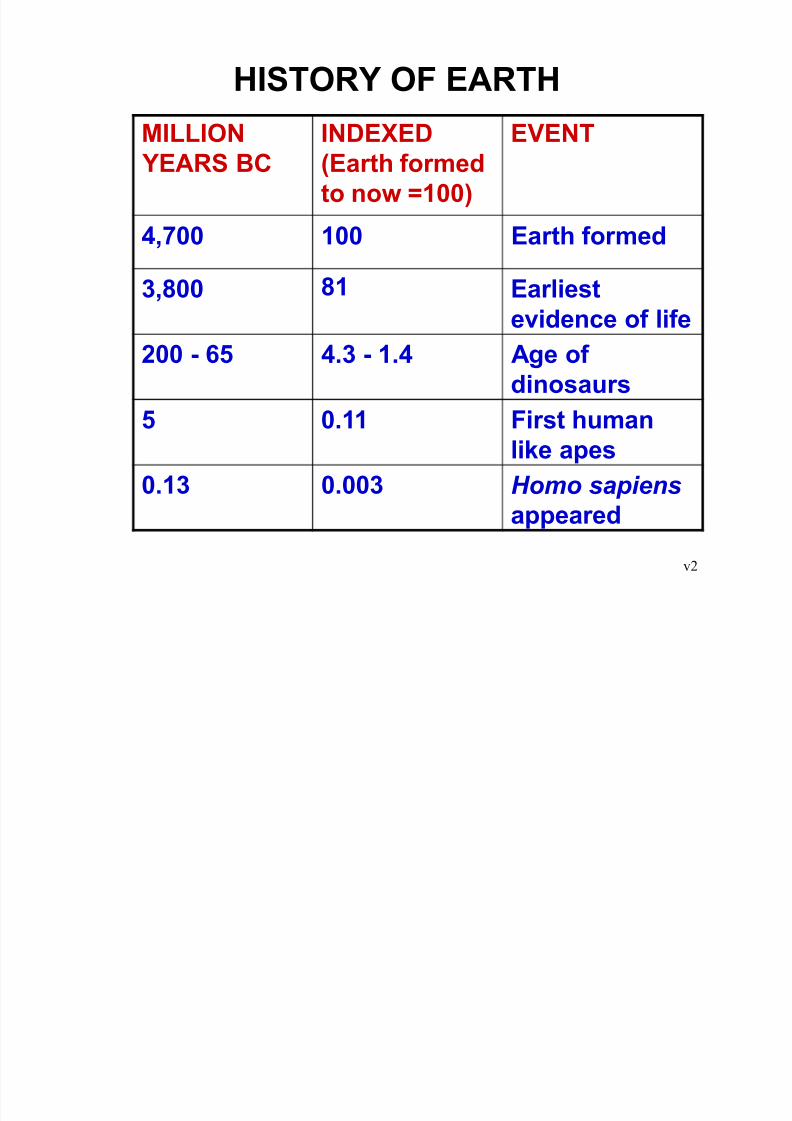
HISTORY OF EARTH
MILLION YEARS BC
INDEXED(Earth formedto now =100)
EVENT
4,700 100 Earth formed
3,800 81 Earliestevidence of life
200 - 65 4.3 - 1.4 Age of dinosaurs
5 0.11 First humanlike apes
0.13 0.003 Homo sapiens
appeared

8/7/2019 Sustainable Development Part1
http://slidepdf.com/reader/full/sustainable-development-part1 3/28
v2
8/7/2019 Sustainable Development Part1
http://slidepdf.com/reader/full/sustainable-development-part1 4/28
v2
8/7/2019 Sustainable Development Part1
http://slidepdf.com/reader/full/sustainable-development-part1 5/28
v2
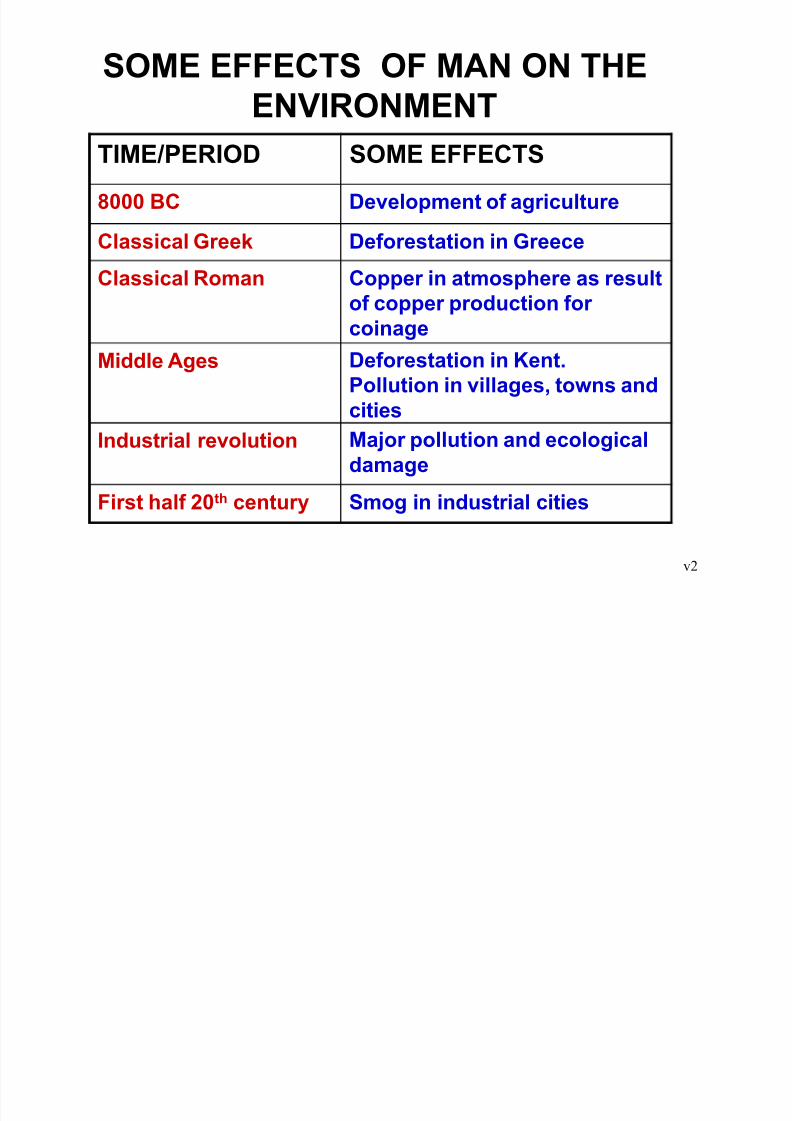
SOME EFFECTS OF MAN ON THEENVIRONMENT
TIME/PERIOD SOME EFFECTS
8000 BC Development of agriculture
Classical Greek Deforestation in Greece
Classical Roman Copper in atmosphere as resultof copper production for coinage
Middle Ages Deforestation in Kent.Pollution in villages, towns and
citiesIndustrial revolution Major pollution and ecological
damage
First half 20th century Smog in industrial cities
8/7/2019 Sustainable Development Part1
http://slidepdf.com/reader/full/sustainable-development-part1 6/28
v2
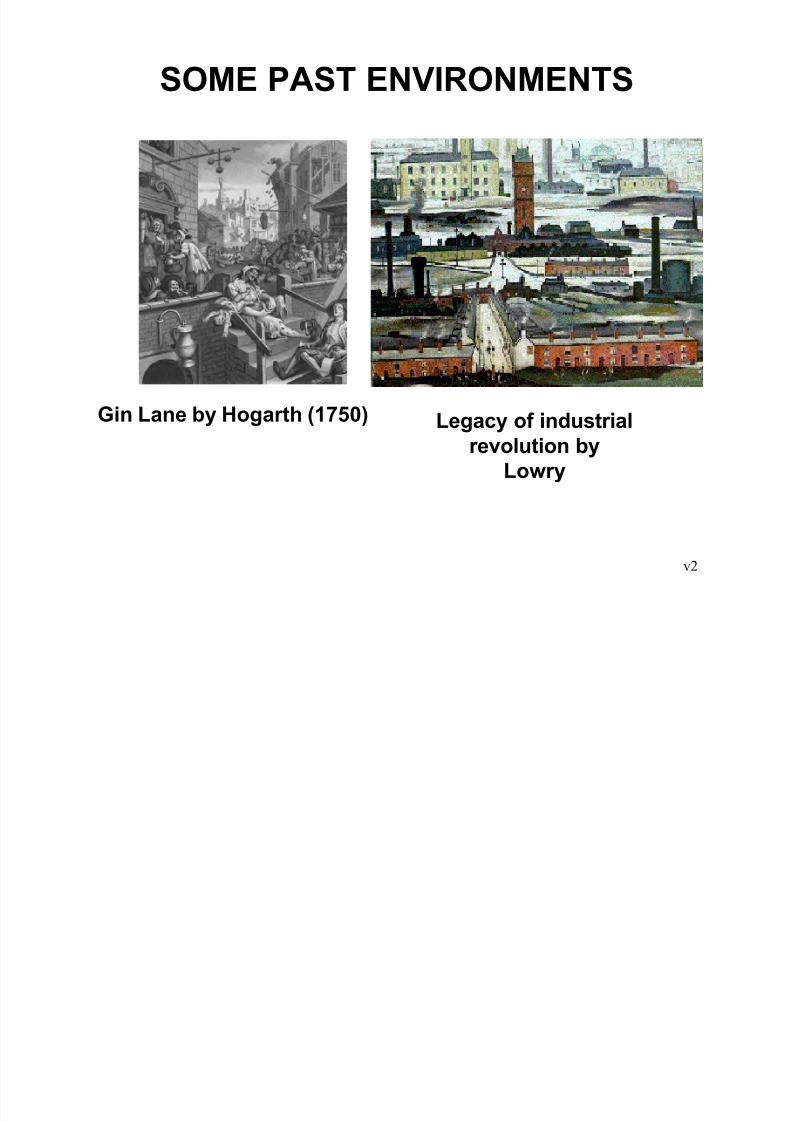
SOME PAST ENVIRONMENTS
Gin Lane by Hogarth (1750) Legacy of industrialrevolution by
Lowry

8/7/2019 Sustainable Development Part1
http://slidepdf.com/reader/full/sustainable-development-part1 7/28
v2
LONDON SMOG OF 1952
8/7/2019 Sustainable Development Part1
http://slidepdf.com/reader/full/sustainable-development-part1 8/28
v2
THE 20th CENTURY
� Environmental change is as oldas the planet
� Man has continually altered theenvironment, but there has never
been anything like the 20th century

8/7/2019 Sustainable Development Part1
http://slidepdf.com/reader/full/sustainable-development-part1 9/28
v2
SOME MEASURES OF 20TH CENTURY
ITEM INCREASE 1890-1990
World population 4
World urban population 13
Average life expectancy Increased
Industrial output 40Energy use 16
Carbon dioxideemissions
17
Water use 9Marine fish catch 35
Cars Astronomical increase

8/7/2019 Sustainable Development Part1
http://slidepdf.com/reader/full/sustainable-development-part1 10/28
v2
LATTER HALF OF 20th CENTURY
1950 1997
� Population (bln) 2.5 5.8
� Life expectancy at birth 47 67
� Megacities (> 8 mln) 2 25
� Food (avg cal/capita) 1980 2770
� Fish catch (mln tons) 19 91
� Water use (bln cu m) 1300 4200
� Rain forest cover index 100 70
� CO2 emissions (bln t C) 1.6 7.0
� CFC in atmosphere (ppb) <1 3.0
Source:World Resources Institute, 1996
8/7/2019 Sustainable Development Part1
http://slidepdf.com/reader/full/sustainable-development-part1 11/28
v2
IMPROVED LOT OF MANKIND
By many indicators the lot of mankindhas vastly improved. For example:
� Prosperity
� Life expectancy
� Education
However this does not mean that things
are good enough Lomborg, 2001
Also there are threats and unknowns
8/7/2019 Sustainable Development Part1
http://slidepdf.com/reader/full/sustainable-development-part1 12/28
v2
ECONOMIC DEVELOPMENT
� The good news is good: never beforehave so many experienced so rapid animprovement in their standards of living
� The bad news is appalling: a largenumber of desperately poor countries arefalling further behind
Wolf, Financial Times, 2003
Question: are there environmentalimplications of the good news?
8/7/2019 Sustainable Development Part1
http://slidepdf.com/reader/full/sustainable-development-part1 13/28
v2
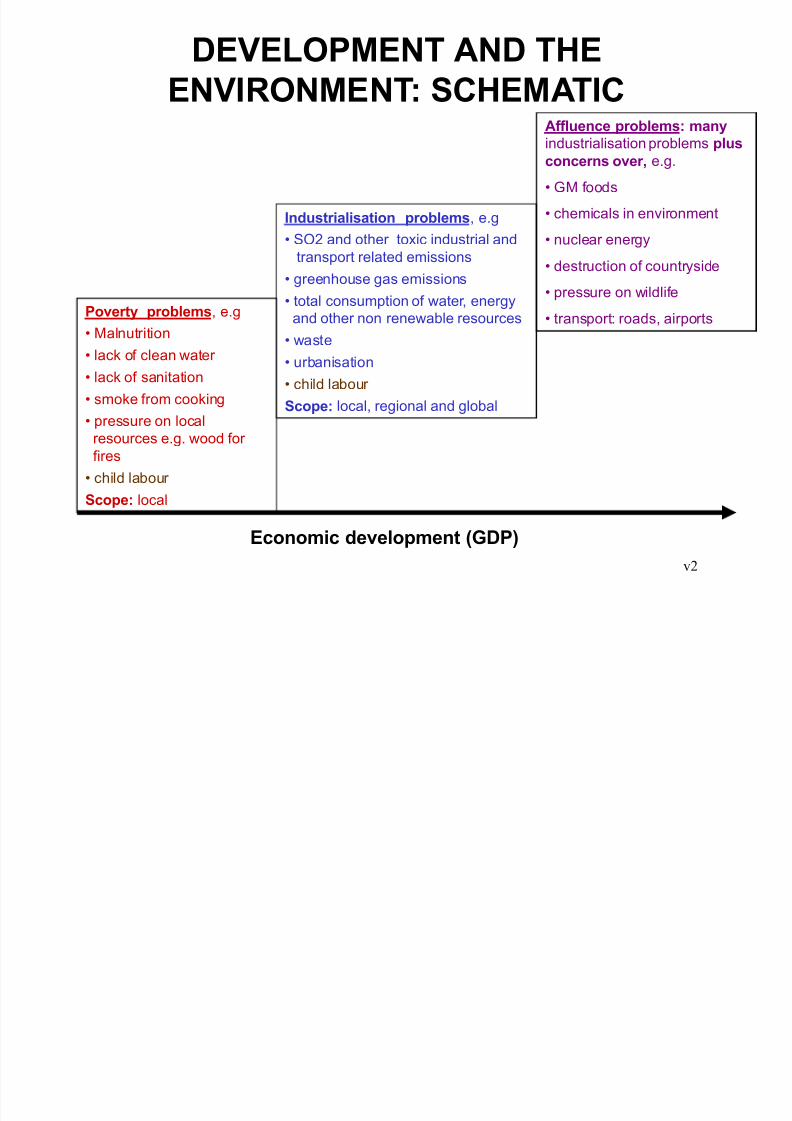
DEVELOPMENT AND THEENVIRONMENT: SCHEMATIC
Industrialisation problems, e.g
� SO2 and other toxic industrial and
transport related emissions
� greenhouse gas emissions
� total consumption of water, energy
and other non renewable resources
� waste
� urbanisation
� child labour
Scope: local, regional and global
Poverty problems, e.g
� Malnutrition
� lack of clean water
� lack of sanitation
� smoke from cooking
� pressure on localresources e.g. wood for
fires
� child labour
Scope: local
Affluence problems: many
industrialisation problems plusconcerns over, e.g.
� GM foods
� chemicals in environment
� nuclear energy
� destruction of countryside
� pressure on wildlife
� transport: roads, airports
Economic development (GDP)
8/7/2019 Sustainable Development Part1
http://slidepdf.com/reader/full/sustainable-development-part1 14/28
v2
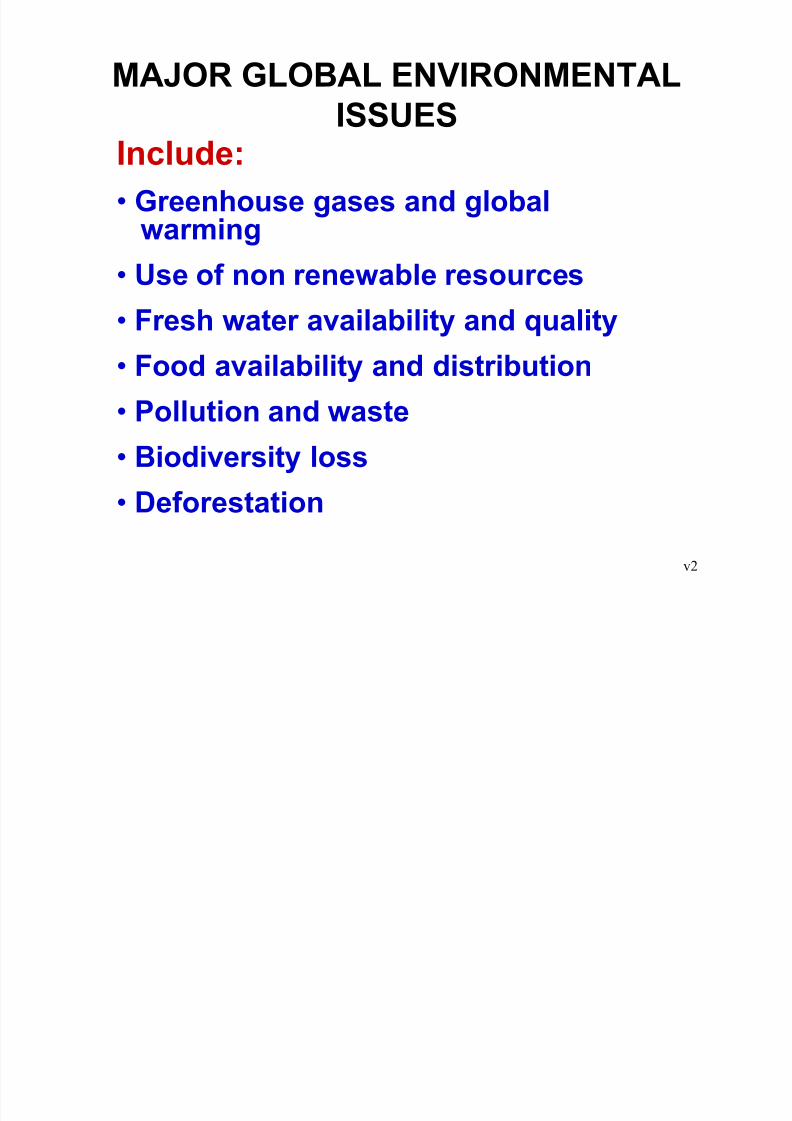
MAJOR GLOBAL ENVIRONMENTALISSUES
Include:
� Greenhouse gases and globalwarming
� Use of non renewable resources� Fresh water availability and quality
� Food availability and distribution
� Pollution and waste� Biodiversity loss
� Deforestation
8/7/2019 Sustainable Development Part1
http://slidepdf.com/reader/full/sustainable-development-part1 15/28
v2
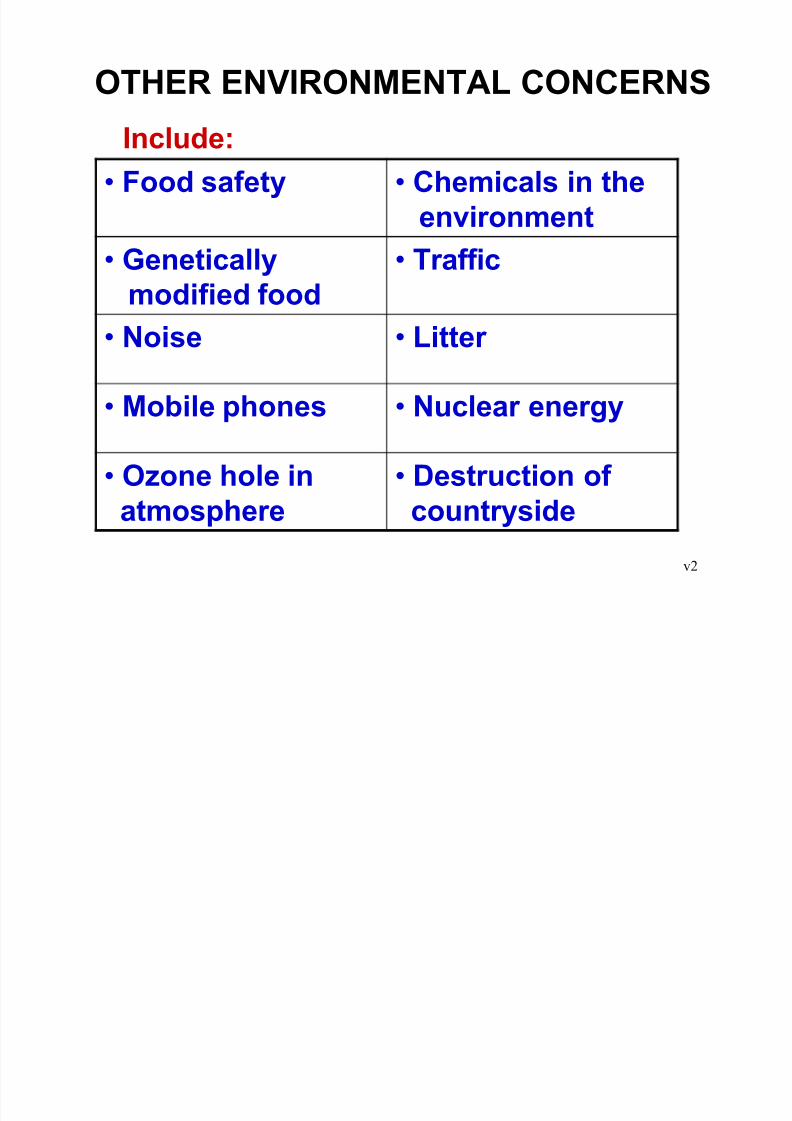
� Food safety � Chemicals in theenvironment
� Geneticallymodified food
� Traffic
� Noise � Litter
� Mobile phones � Nuclear energy
� Ozone hole inatmosphere
� Destruction of countryside
Include:
OTHER ENVIRONMENTAL CONCERNS
8/7/2019 Sustainable Development Part1
http://slidepdf.com/reader/full/sustainable-development-part1 16/28
v2
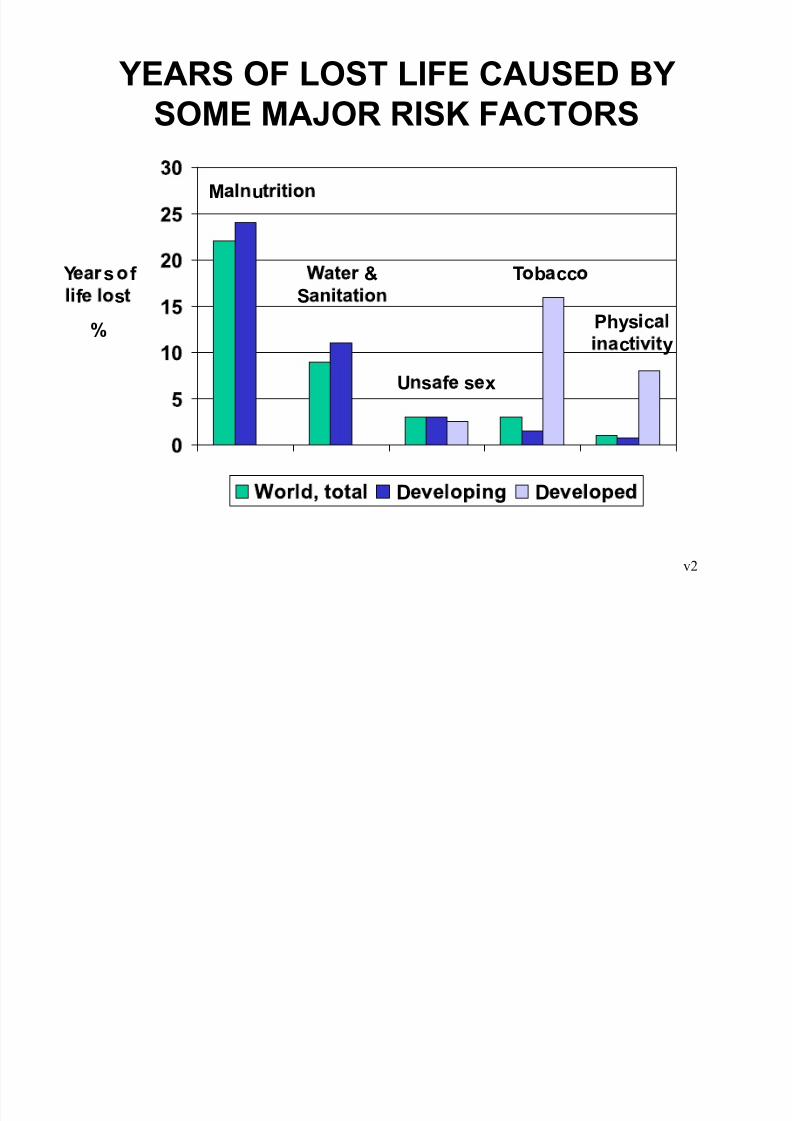
YEARS OF LOST LIFE CAUSED BYSOME MAJOR RISK FACTORS
D D
Y s f f s
%
M u
&S
U s f s x
T b cc
Phys cc y

8/7/2019 Sustainable Development Part1
http://slidepdf.com/reader/full/sustainable-development-part1 17/28
v2
MAGNITUDE OF SOME ISSUES ANDCOST TO ALLEVIATE
Issue Effects Approx costto provide
Clean drinking
water for 1.1billion people
2 milliondeaths plus 0.5
billion seriouslyill per year
$165 billion
Sanitation for 2.5billion people
$30 billion
Cleaner air indoorsfor 2.4 billionpeople who usetraditional cookingstoves
1.6 milliondeaths per
annum fromeffects of smoke
$30 billion
8/7/2019 Sustainable Development Part1
http://slidepdf.com/reader/full/sustainable-development-part1 18/28
v2
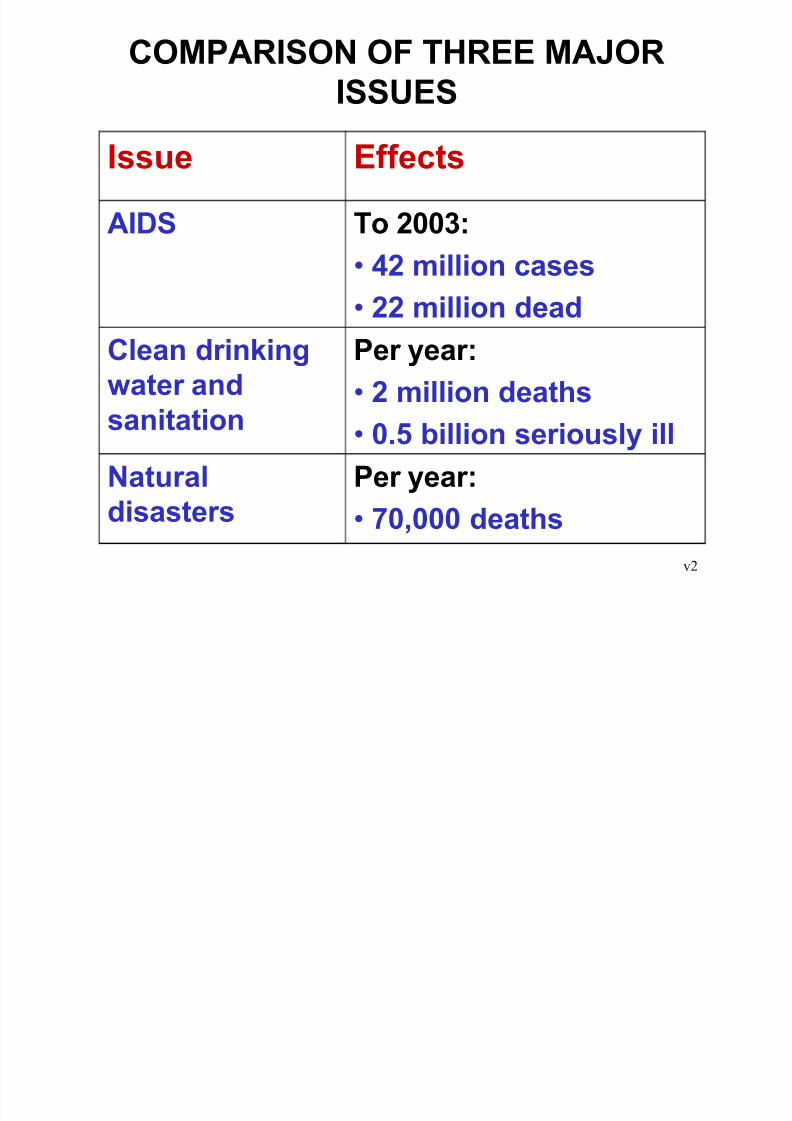
COMPARISON OF THREE MAJORISSUES
Issue Effects
AIDS To 2003:
� 42 million cases� 22 million dead
Clean drinkingwater and
sanitation
Per year:
� 2 million deaths
� 0.5 billion seriously ill
Naturaldisasters
Per year:
� 70,000 deaths
8/7/2019 Sustainable Development Part1
http://slidepdf.com/reader/full/sustainable-development-part1 19/28
v2
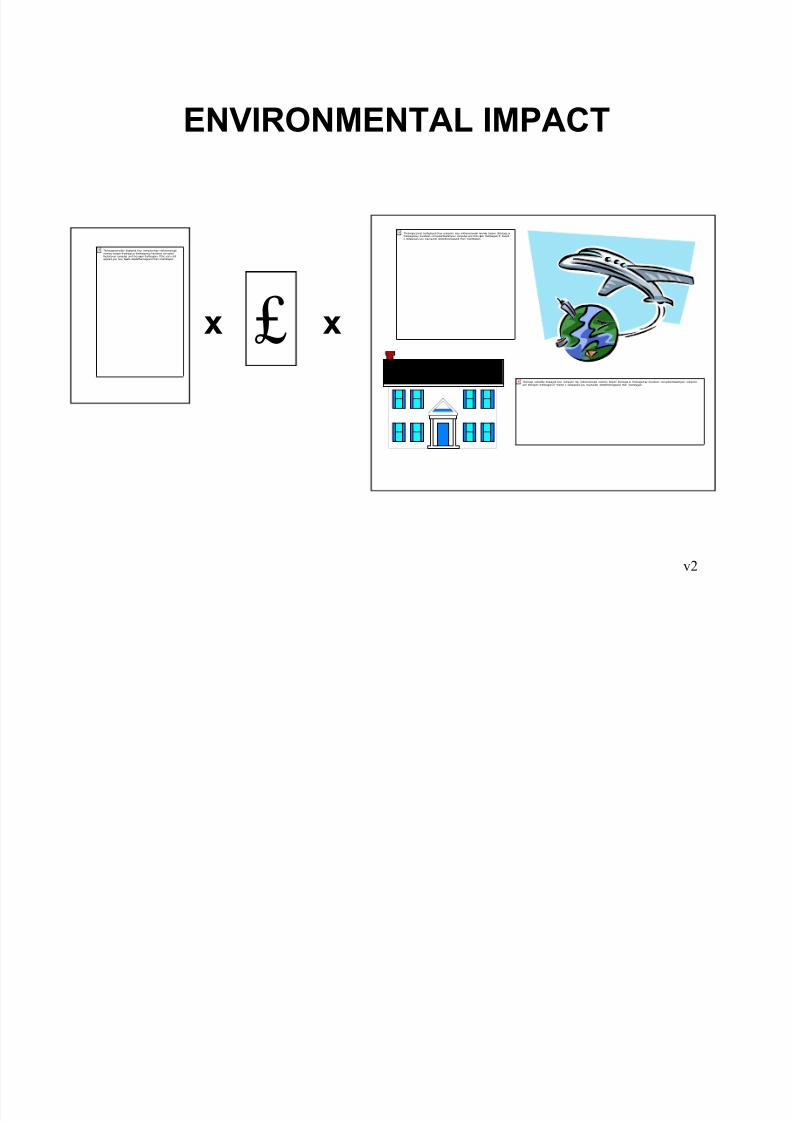
ENVIRONMENTAL IMPACT
£
Theimagecannot bedisplayed.Your computer may nothaveenough memory toopen theimage,ortheimagemay havebeen corrupted.Restartyour computer,and then open thefileagain.If theredx stillappears,you may haveto deletetheimageand then insertitagain.
Theimage cannotbe displayed.Your computer may nothaveenough memory toopen theimage,or theimagemay havebeen corrupted.Restartyour computer,and then open thefileagain.If thered x stillappears,you may haveto deletetheimageand then insertitagain.
xx
Theimagecannotbe displayed.Your computer may nothaveenoughmemory toopen theimage,or theimagemay havebeen corrupted.Restartyour computer, and then open thefileagain. Ifthe red x stillappears,you may haveto deletetheimageand then insertitagain.

8/7/2019 Sustainable Development Part1
http://slidepdf.com/reader/full/sustainable-development-part1 20/28
v2
FACTOR FOUR
If the world population and averagewealth doubles, then for there to be
no increase in environmental impact
the third term will have to improve bydramatic factor of 4
This is merely to maintain the µstatus
quo¶. To reduce environmental impact,higher values are required. For exampleto halve greenhouse gas emissions animprovement factor of 8 would be needed
8/7/2019 Sustainable Development Part1
http://slidepdf.com/reader/full/sustainable-development-part1 21/28
v2
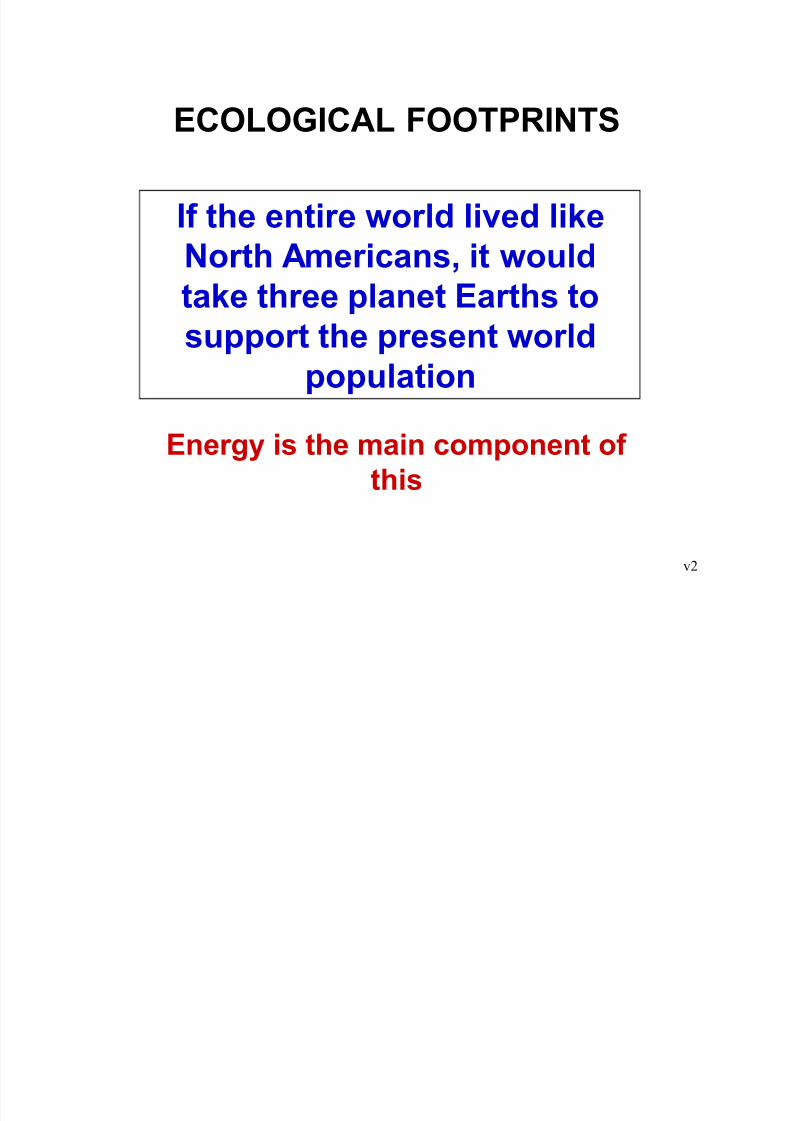
ECOLOGICAL FOOTPRINTS
If the entire world lived likeNorth Americans, it wouldtake three planet Earths tosupport the present world
population
Energy is the main component of this
8/7/2019 Sustainable Development Part1
http://slidepdf.com/reader/full/sustainable-development-part1 22/28
v2
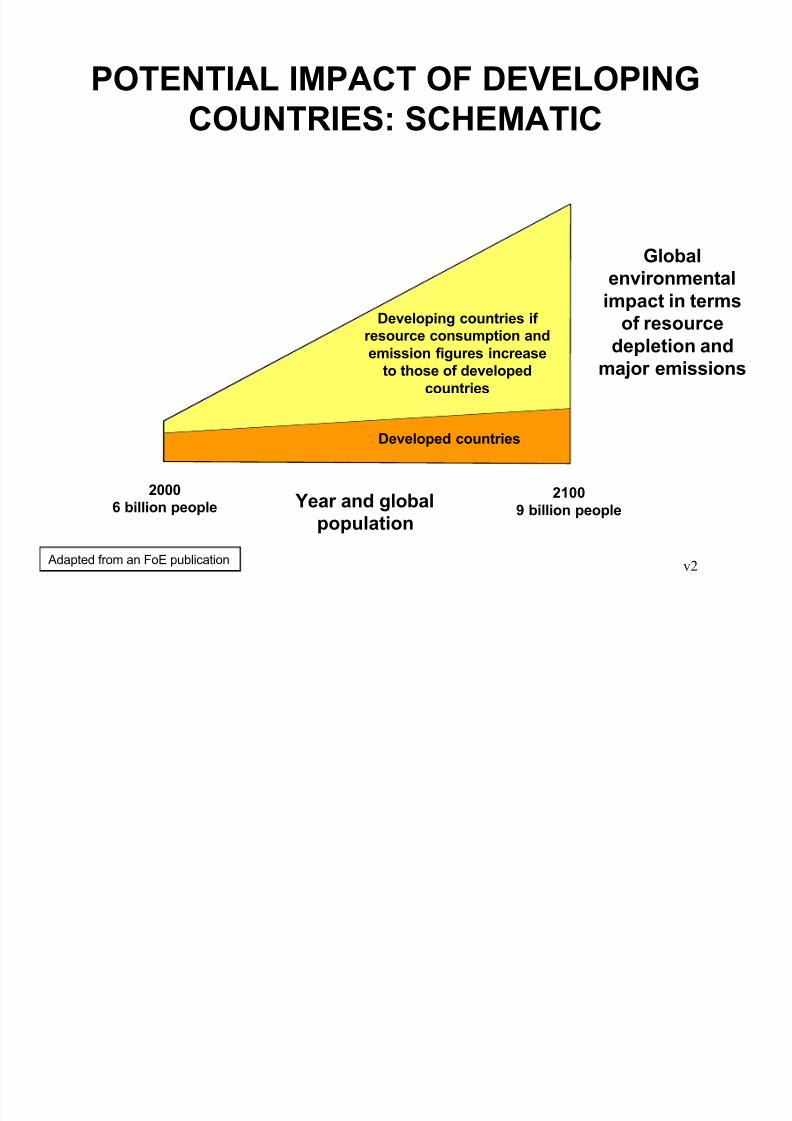
POTENTIAL IMPACT OF DEVELOPINGCOUNTRIES: SCHEMATIC
Adapted from an FoE publication
21009 billion people
20006 billion people
Developing countries if resource consumption andemission figures increase
to those of developedcountries
Developed countries
Global
environmentalimpact in terms
of resourcedepletion and
major emissions
Year and globalpopulation
8/7/2019 Sustainable Development Part1
http://slidepdf.com/reader/full/sustainable-development-part1 23/28
v2
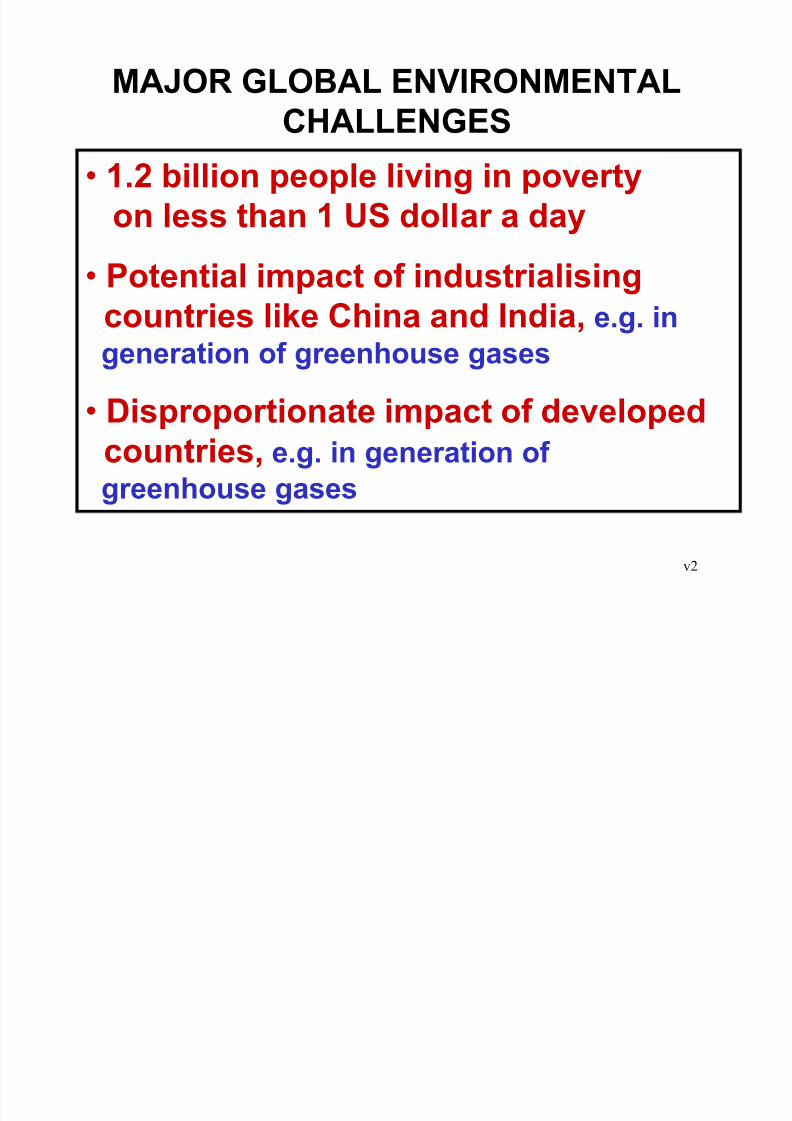
MAJOR GLOBAL ENVIRONMENTALCHALLENGES
� 1.2 billion people living in povertyon less than 1 US dollar a day
� Potential impact of industrialisingcountries like China and India, e.g. ingeneration of greenhouse gases
� Disproportionate impact of developedcountries, e.g. in generation of greenhouse gases
8/7/2019 Sustainable Development Part1
http://slidepdf.com/reader/full/sustainable-development-part1 24/28
v2
ECONOMIC GROWTH AND HUMAN
HAPPINESS
In economically developedcountries the link between
economic growth and humanhappiness is breaking
Something is missing!

8/7/2019 Sustainable Development Part1
http://slidepdf.com/reader/full/sustainable-development-part1 25/28
v2
MASLOW¶S HIERARCHY OF HUMANNEEDS
PHYSIOLOGICALfood, water, shelter, warmth
SAFETYsecurity, stability, freedom from fear
BELONGING, LOVEfriends, family, spouse
SELF-ESTEEMachievement, mastery,recognition, respect
SELF-ACTUALISATIONpursue inner talent,
creativity, fulfilment
8/7/2019 Sustainable Development Part1
http://slidepdf.com/reader/full/sustainable-development-part1 26/28
v2
GEOGRAPHICAL IMPACT OF OUR
ACTIONS
� Some things we do impactlocally, e.g. waste generation
� Some things we do impactlocally and globally, e.g.
greenhouse gas emissions
8/7/2019 Sustainable Development Part1
http://slidepdf.com/reader/full/sustainable-development-part1 27/28
v2
SOME ISSUES TO CONSIDER
Consider:
� What effect our actions have on
our local environment
� What effect our actions have onthe global environment
� What example are we setting toless developed countries
8/7/2019 Sustainable Development Part1
http://slidepdf.com/reader/full/sustainable-development-part1 28/28
v2
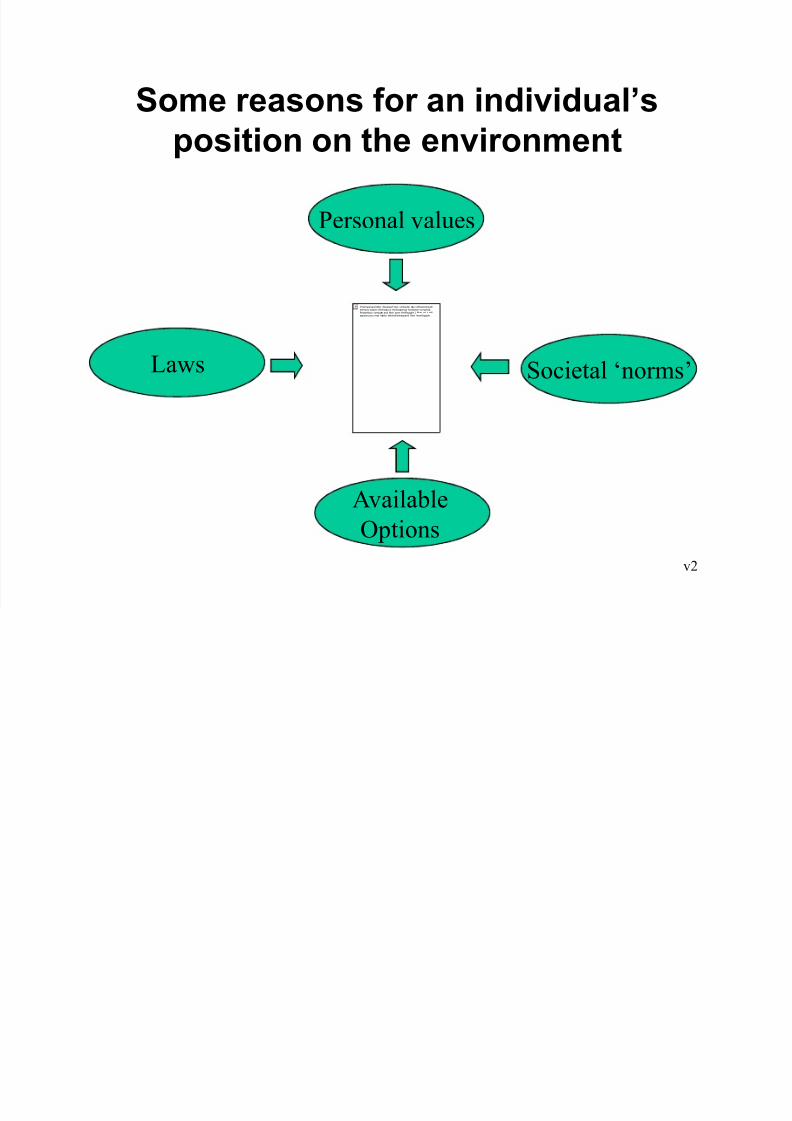
Some reasons for an individual¶s
position on the environment
Theimagecannotbe displayed.Your computer may nothaveenoughmemory toopen theimage,or theimagemay havebeen corrupted.Restartyour computer,and then open thefileagain.I fther ed x stillappears,you may haveto deletetheimageand then insertitagain.
Personal values
Societal µnorms¶Laws
Available
Options