sustainable agriculture in a changing climate - amazon s3 · sustainable agriculture in a changing...
TRANSCRIPT

1
Sustainable Agriculture in a Changing
Climate
Project Design Document (PDD) for Validation Using the
Climate, Community and Biodiversity (CCB) Project Design
Standards Second Edition (December 2011)
Presesnted to: CARE
Lead author: William Garrett (Verco, under sub-contract to Camco)
Other contributors: Amy Pickard, Emmanuel Ekakoro and Laurie Roberts
Date: 19th December 2012
Reference number: 3288
Version: 13
2
Document type: Climate, Community and Biodiversity Project Design Document (PDD)
Client: CARE
Client contact: Phil Franks
File name: SACC CCB PDD final draft for CARE (11).doc
Lead author: William Garrett
Signature:
Other contributors: Amy Pickard, Emmanuel Ekakoro and Laurie Roberts
Date: 19th December 2012
PHOTOS by William Garrett (2011)
Disclaimer: This report has been prepared for the above named client for the purpose agreed in Camco's terms of engagement. Whilst every effort has been made to ensure the accuracy and suitability of the information contained in this report, the results and recommendations presented should not be used as the basis of design, management or implementation of decisions unless the client has first discussed with Camco their suitability for these purposes and Camco has confirmed their suitability in writing to the client. Camco does not warrant, in any way whatsoever, the use of information contained in this report by parties other than the above named client. © Camco 2010. All rights reserved.

3
I. EXECUTIVE SUMMARY ......................................................................................................... 1
II. GENERAL SECTION ............................................................................................................... 3 G1. Original Conditions at the Project Site .................................................................................... 3 G1.1 Project Area Location and Physical Parameters .................................................................... 3 G1.2 Types and Condition of the Vegetation in the Project Area .................................................. 7 G1.3 Boundaries of the Project Area .............................................................................................. 2
G1.4 Current Carbon Stocks within the Project Area ..................................................................... 2 Community Information ............................................................................................................... 12 G1.5 Community Description ....................................................................................................... 12 G1.6 Current Land Use ................................................................................................................. 17
Biodiversity Information ............................................................................................................... 21 G1.7 Current Biodiversity ............................................................................................................. 21 G1.8 High Conservation Values Evaluation ................................................................................. 29
G2. Baseline Projections ............................................................................................................... 35 G2.1 Most Likely Land Use.......................................................................................................... 35
G2.2 Additionality ........................................................................................................................ 36 G2.3 Carbon Stock Changes ......................................................................................................... 44 G2.4 Effect of Baseline on Communities ..................................................................................... 75
G2.5 Effect of Baseline on Biodiversity ....................................................................................... 78 G3. Project Design and Goals ....................................................................................................... 79 G3.1 Major Climate, Community and Biodiversity Goals ........................................................... 79 G3.2 Description of Major Project Activities ............................................................................... 81 G3.3 Location of Project Activities .............................................................................................. 84
G3.4 Time Frame and Project Accounting ................................................................................... 85 G3.5 Project Risks and Mitigation Measures ............................................................................... 86
G3.6 Maintenance of High Conservation Values ....................................................................... 102 G3.7 Measures to Enhance CCB Benefits beyond Project Lifetime .......................................... 103
G3.8 Stakeholder Involvement ................................................................................................... 104 G3.9 Publicisation of CCBA Public Comment Period ............................................................... 107 G3.10 Conflict Resolution Process ............................................................................................. 107
G3.11 Project Financial Support ................................................................................................. 109 G4. Management Capacity and Best Practices ........................................................................... 111 G4.1 Project Proponent Identification ........................................................................................ 111 G4.2 Technical and Management Expertise ............................................................................... 118 G4.3 Capacity Building .............................................................................................................. 122
G4.4 Community Employment Opportunities ............................................................................ 122 G4.5 Relevant Employment Laws .............................................................................................. 124 G4.6 Employee Safety Assessment ............................................................................................ 125 G4.7 Financial Health of Implementing Organisations .............................................................. 125
G5. Legal Status and Property Rights ......................................................................................... 126 G5.1 Relevant Laws and Project Compliance ............................................................................ 126 G5.2 Documentation of Legal Approval .................................................................................... 130 G5.3 Project Encroachment and Free, Prior and Informed Consent........................................... 130
CONTENTS

4
G5.4 Involuntary Relocation ....................................................................................................... 131
G5.5 Identification and Reduction of Illegal Activities in the Project Zone .............................. 131 G5.6 Carbon Rights .................................................................................................................... 132 III.CLIMATE SECTION ............................................................................................................ 134
CL1. Net Positive Climate Impacts ............................................................................................ 134 CL1.1 Net Change in Carbon Stocks .......................................................................................... 134 CL1.2 Net Change in Non-CO2 Emissions ................................................................................. 134 CL1.3 Other Non-CO2 GHG Emissions from Project Activities ............................................... 134 CL1.4 Net Climate Impact .......................................................................................................... 134
CL1.5 Avoiding Double Counting .............................................................................................. 136 CL2. Offsite Climate Impacts (‘Leakage’) ................................................................................. 136 CL2.1 Types of Leakage and Offsite GHG Increases ................................................................ 136 CL2.2 Leakage Mitigation .......................................................................................................... 139
CL2.3 Unmitigated Negative Offsite Climate Impacts ............................................................... 139 CL2.4 Unmitigated Negative Offsite Non-CO2 Climate Impacts .............................................. 140
CL3. Climate Impact Monitoring ............................................................................................... 140 CL3.1 Plan for Selecting and Monitoring Carbon Pools and Non-CO2 GHGs .......................... 140
CL3.2 Commitment to Monitoring Plan ..................................................................................... 144 IV. COMMUNITY SECTION ................................................................................................... 145 CM1. Net Positive Community Impacts ..................................................................................... 145
CM1.1 Impacts on Communities ................................................................................................ 145 CM1.2 Negative Impacts on High Conservation Values ............................................................ 149
CM2. Offsite Stakeholder Impacts ............................................................................................. 152 CM2.1 Negative Offsite Stakeholder Impacts ............................................................................ 152 CM2.2 Mitigating Negative Offsite Social and Economic Impacts ........................................... 152
CM2.3 Net Impacts on Stakeholder Groups ............................................................................... 152
CM3. Community Impact Monitoring ........................................................................................ 153 CM3.1 Develop Community Monitoring Plan ........................................................................... 153 CM3.2 Develop High Conservation Value Monitoring Plan...................................................... 153
CM3.3 Commit to Monitoring Plan ............................................................................................ 155 V. BIODIVERSITY SECTION .................................................................................................. 157
B1. Net Biodiversity Impacts ...................................................................................................... 157 B1.1 Project Impacts on Biodiversity ......................................................................................... 157
B1.2 Demonstrate No HCVs Negatively Impacted .................................................................... 159 B1.3 Identification of Species Used by the Project .................................................................... 160 B1.4 Effect of Non-native Species Use ...................................................................................... 161 B1.5 No GMO Guarantee ........................................................................................................... 161 B2. Offsite Biodiversity Impacts ................................................................................................ 162
B2.1 Potential Negative Offsite Biodiversity Impacts ................................................................ 162 B2.2 Mitigation of Potential Negative Offsite Biodiversity Impacts ......................................... 163
B2.3 Evaluate Potential Negative Offsite Impacts on Biodiversity ............................................ 163 B3. Biodiversity Impact Monitoring ........................................................................................... 165 B3.1 Develop Biodiversity Monitoring Plan .............................................................................. 165 B3.2 Develop HCV Monitoring Plan.......................................................................................... 166 B3.3 Commit to Monitoring Plan ............................................................................................... 167 VI. GOLD LEVEL SECTION .................................................................................................... 169

5
GL2. Exceptional Community Benefits ...................................................................................... 169
GL2.1 Demonstrate the Project Zone is in a Low Human Development Country ..................... 169 GL2.2 Benefits to Poorest Households ....................................................................................... 169 GL2.3 Identifying and Addressing Barriers to Benefits Reaching Poorer Households ............. 170
GL2.4 Project Impacts on Poor and Vulnerable Individuals and Households ........................... 171 GL2.5 A Differentiated Approach to Community Impact Modelling ........................................ 172 List of Acronyms ........................................................................................................................ 175 References ................................................................................................................................... 176 Annexes....................................................................................................................................... 181
Annex 1. Technical specifications .............................................................................................. 181 Annex 2. Historical analysis of land use /land covers changes & definition of eligibility of lands
for afforestation and reforestation activities of the Western Kenya CARE/AFOLU Project ..... 181 Annex 3. Making Carbon Finance for Sustainable Agriculture Work for the Poor ................... 181
Annex 4. Social carbon indicators for forest projects ................................................................. 181 Annex 5 - Indicator Scores and Evidence - Social Carbon ......................................................... 181 List of Tables and Figures
Table 1: Preliminary Stratification ............................................................................................................... 5 Table 2: Land Use Stratification ................................................................................................................... 6 Table 3: Total biomass carbon stock in SACC project area ....................................................................... 11 Table 4: Population Density projections in the Nyando basin by Division .............................................. 14 Table 5: A comparison of basic household parameters across different data sets to evaluate the similarity of sample used for analysis 26 .................................................................................................... 15 Table 6: Plant biodiversity in the project area .......................................................................................... 26 Table 7: Summary Checklist for Identifying HCVs within a Forest Management Unit ............................ 29 Table 8: Barriers in relation to different land use scenarios .................................................................... 42 Table 9: Project planting plan stratification .............................................................................................. 47 Table 10: Tree species and minimum number of trees to be measured in Lowland areas ..................... 53 Table 11: Tree species and miminum number of trees to be measured in upland areas ....................... 53 Table 12: Tree stem AGB in lowland stratum............................................................................................ 57 Table 13: Tree stem AGB in highland stratum .......................................................................................... 58 Table 14: Number of trees to plant ........................................................................................................... 59 Table 15: DIP thinning regime (number of trees remianing per hectare) ................................................ 59 Table 16: WDL thinning regime (number of trees remaining per hectare) .............................................. 60 Table 17: BND thinning regime (number of trees remaining per 400 m / 0.125 hectare planted) ......... 61 Table 18: Carbon stocks in biomass at time t under the project scenario (t C/ha) – lowland stratum .. 63 Table 19: Carbon stocks in biomass at time t under the project scenario (t C/ha) – highland stratum . 64 Table 20: Net GHG removals by sinks (t CO2-e/ ha)– lowland stratum .................................................... 65 Table 21: Net GHG removals by sinks (t CO2-e/ ha)– highland stratum ................................................... 66 Table 22: Long term average GHG benefit (t CO2 / ha) ............................................................................. 67 Table 23. Tree species in the study area (Source: Camco field data) ....................................................... 68 Table 24. Duration of obtaining firewood from source (Source: Camco field data) ................................ 69 Table 25. Livestock population currently and in the last 5-10 years (Source: Camco field data) ........... 70 Table 26: SACC project planting in 2011 (actual to date) ......................................................................... 71 Table 27: GHG emission reductions and removals forecast as a result of 2011 planting (VCS validated) .................................................................................................................................................................... 71 Table 28: SACC project enrolment schedule ............................................................................................. 72

6
Table 29: Forecast of DIP implementation in SACC project ...................................................................... 73 Table 30: Forecast of WDL implementation in SACC project .................................................................... 73 Table 31: Forecast of BND implementation in SACC project .................................................................... 73 Table 32: GHG emission reductions and removals forecast as a result of 2012 - 2022 planting............. 74 Table 33: Baseline effects on local communities ...................................................................................... 76 Table 34: AFOLU interventions ................................................................................................................... 82 Table 35: Project scale to achieve by Year 15 ............................................................................................. 85 Table 36: Management structures, status and responsibilities.............................................................. 117 Table 37: Summary of Job Creation ......................................................................................................... 123 Table 38 Summary of baseline, project emissions, leakage and ex-ante forecast of removals (tCO2 / ha / year) ....................................................................................................................................................... 135 Table 39: Tree species in the study area (Source: Camco field data) ..................................................... 137 Table 40: Duration of obtaining firewood from source (Source: Camco field data) .............................. 138 Table 41: Livestock population currently and in the last 5-10 years (Source: Camco field data) ......... 138 Table 42: Data Available at Validation .................................................................................................... 140 Table 43: Data to be monitored ............................................................................................................... 142 Table 44: Scoring the Social Carbon Indicators ....................................................................................... 146 Table 45: Average Score Across Indicators .............................................................................................. 147 Table 46: SACC Community impact monitoring plan .............................................................................. 154 Table 47: Potential negative impacts of project ..................................................................................... 162 Table 48: Potential Biodiversity Impacts in Project Zone of Reforestation Projects ............................. 163 Table 49: Biodiversity monitoring variables ............................................................................................ 165 Table 50: Plan for assessing HCV values .................................................................................................. 166 Table 51: Nyando wealth distribution ..................................................................................................... 170 Figure 1: The Nyando catchment in relation to Kenya and the surrounding Nyanza District (adapted from Onyango et al, 2005) ..................................................................................................................................... 4 Figure 2: Soil erosion documented during field visits in the Lower Nyando ................................................ 6 Figure 3: Landsat imagery used to show large scale vegetation and land use changes in the Nyando basin between 1973 -2000 (Source: Olaka) ........................................................................................................... 8 Figure 4: SACC Project Area .......................................................................................................................... 2 Figure 5: Current ineligible and eligible lands for AR project activities, 2010 .............................................. 1 Figure 6: Conversion of forested areas to other land uses from 2000 -2010 ............................................... 5 Figure 7: Stratification process ..................................................................................................................... 9 Figure 8: Population change in the Nyando basin between 1979 -1999 (Source: Olaka16) ...................... 14 Figure 9: Illustration of Land Use Covers. Photos by William Garrett ........................................................ 20 Figure 10: Process for determining the point of measurement for trees .................................................. 50 Figure 11: Crown position index (CPI; trees are classified on a scale from 1 to 5 depending on light received by the crown of the tree. ............................................................................................................. 52 Figure 12: Crown form index (CFI); trees are classified on a scale from 1 to 5 depending on the condition of the crown ................................................................................................................................................ 53 Figure 14: SACC management/governance structure .............................................................................. 116 Figure 15: Social indicator scores radar diagram ...................................................................................... 148

1
Project Highlights
Project Proponent CARE International
Contributions from CARE International, Camco, ICRAF
Host Country Kenya
District Nyanza
Land Type Degraded agricultural land
Total Project Area 50,000 households across lower and mid Nyando
Project Start Date September 1st 2010
Total Carbon Stocks in Project Area 8,941,598
35-year Carbon Credits (VCUs) issued 2,205,910
Primary Degradation Drivers Human drivers: Over-grazing and intensive agriculture
Natural drivers: Soil erosion and climate change
Project standards CCB v2
Verified Carbon Standard (VCS) Version 3
Selected Methodology
AR-AMS0001 v06 - Simplified baseline and monitoring
methodologies for small-scale A/R CDM project activities
implemented on grasslands or croplands with limited
displacement of pre-project activities
PROJECT HIGHLIGHTS
2
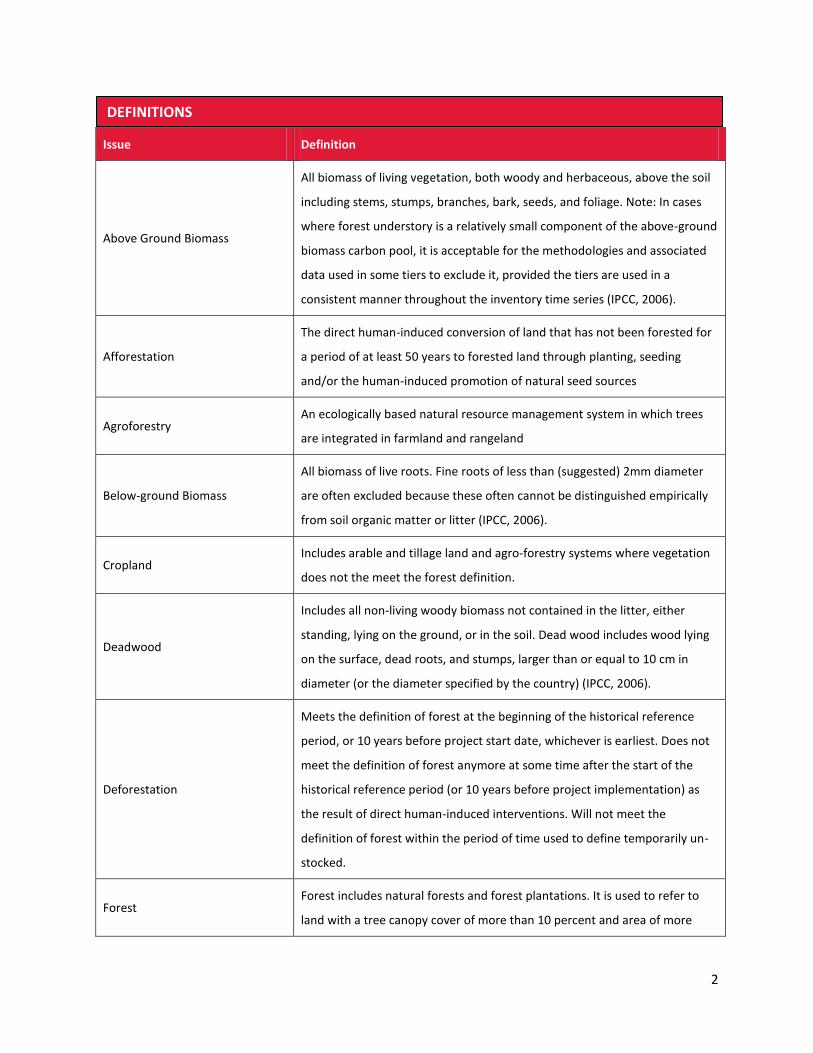
Issue Definition
Above Ground Biomass
All biomass of living vegetation, both woody and herbaceous, above the soil
including stems, stumps, branches, bark, seeds, and foliage. Note: In cases
where forest understory is a relatively small component of the above-ground
biomass carbon pool, it is acceptable for the methodologies and associated
data used in some tiers to exclude it, provided the tiers are used in a
consistent manner throughout the inventory time series (IPCC, 2006).
Afforestation
The direct human-induced conversion of land that has not been forested for
a period of at least 50 years to forested land through planting, seeding
and/or the human-induced promotion of natural seed sources
Agroforestry An ecologically based natural resource management system in which trees
are integrated in farmland and rangeland
Below-ground Biomass
All biomass of live roots. Fine roots of less than (suggested) 2mm diameter
are often excluded because these often cannot be distinguished empirically
from soil organic matter or litter (IPCC, 2006).
Cropland Includes arable and tillage land and agro-forestry systems where vegetation
does not the meet the forest definition.
Deadwood
Includes all non-living woody biomass not contained in the litter, either
standing, lying on the ground, or in the soil. Dead wood includes wood lying
on the surface, dead roots, and stumps, larger than or equal to 10 cm in
diameter (or the diameter specified by the country) (IPCC, 2006).
Deforestation
Meets the definition of forest at the beginning of the historical reference
period, or 10 years before project start date, whichever is earliest. Does not
meet the definition of forest anymore at some time after the start of the
historical reference period (or 10 years before project implementation) as
the result of direct human-induced interventions. Will not meet the
definition of forest within the period of time used to define temporarily un-
stocked.
Forest Forest includes natural forests and forest plantations. It is used to refer to
land with a tree canopy cover of more than 10 percent and area of more
DEFINITIONS

3
than 0.5 ha. Forests are determined both by the presence of trees and the
absence of other predominant land uses. The trees should be able to reach a
minimum height of 5 m (FAO, 2001).
Forest Degradation
The gradual loss of carbon on forest land as a consequence of direct human
intervention (e.g., logging, fuel-wood collection, or human-induced fire) but
still remains forest land.
Grassland
Includes managed and unmanaged rangeland, pasture land, wild land,
recreational areas, and silvo-pastoral systems that do not meet the forest
definition.
Grouped Project
A project to which additional instances of the project activity, which meet
pre-established eligibility criteria, may be added subsequent to project
validation
Reforestation
The human-induced conversion of non-forest land back to forest land (e.g.,
from cropland to forest, or grassland to forest). Reforestation is excluded
from this methodology as a project activity for generating carbon credits.
Settlements
Includes all developed land, including transportation infrastructure and
human settlements of any size, unless they are already included under other
categories.
Soil Organic Matter
Includes organic carbon in mineral soils to a specified depth chosen by the
country and applied consistently through the time series2. Live and dead fine
roots within the soil (of less than the suggested diameter limit for below-
ground biomass) are included with soil organic matter where they cannot be
distinguished from it empirically (IPCC, 2006).

1
This Climate, Community and Biodiversity (CCB) Project Design Document (PDD) is being submitted on
behalf of the project proponent CARE International, with contributions from Camco and ICRAF.
The Sustainable Agriculture in a Changing Climate (SACC) project has been designed to deliver positive
climate change impacts by promoting afforestation and reforestation (AR) activities in the project area.
These activities will contribute to carbon storage and hence less carbon will be released to the
atmosphere in the form of carbon dioxide. In addition to this climate benefit, the project delivers
livelihood benefits to the communities both within and bordering the lower and mid Nyando.
The project area covers 208,185 hectares of mixed use land, much of which is in a degraded state. Of
this, AR activities, which constitutes the main project intervention, is eligible in up to 132,629 hectares
of the total land area. The net planted (AR) area of woodlots, boundary and dispersed inter-planting is
forecast to be 8,038 hectares on smallholders land implemented over an eleven year period between
2011 and 2022.
This PDD demonstrates that through effective and appropriate agroforestry techniques and local
sustainable development activities, the SACC project will sequester (capped) 2,622,596 tCO₂e over the
35 year project crediting period of which 2,205,910 tCO2e will be released (i.e. tradable VCUs),
equivalent to annual emission reductions of 63,026 tCO₂ after allowing for the non-permanence risk
buffer (30.5% and 15% release).
This PDD also demonstrates the reliance of local communities (with a population of more than half a
million), on woody products for both domestic uses and their livelihoods. The provision of community
benefits that arise from project activities, such as enhanced agricultural production, forest product
production and income from selling these products, is demonstrated through compliance with the
optional ‘Exceptional Community Benefits’ Gold Level section.
Additionality of the project activities is demonstrated through barrier analysis using the tool provided in
Appendix B of CDM methodology AR-AMS0001.
I. EXECUTIVE SUMMARY

2
In addition to CCB registration, the project has also been submitted for registration under the approved
Verified Carbon Standard (VCS) methodology AR-AMS0001 v06.

3
The SACC project will be implemented in the lower and mid Nyando River basin, a land area that
encompasses more than 115,000 households. The Nyando River basin is located in western Kenya in the
Nyanza District, confined within latitudes 0°25’ S and 0°10’N and longitudes 34°50’ E and 35°50’ E (Figure
1). In recent years this area has been subject to increasing environmental degradation and is affected by
droughts and floods that are a function of both the physical characteristics of the area and human
influence on the land, both of which are outlined in the following section.
Topography and Catchment Description
The project area falls within the Lake Victoria Lowlands and Floodplains Region and is surrounded by
Lake Victoria to the west, the Tinderet Hills to the east, the Nandi Escarpment to the north and Kisii Hills
to the south. The lowlands are found at an approximate elevation of 1,100 masl and have a relatively
flat topography, which gradually grades to steep slopes with an elevation of ~3,000 m in the north-
eastern and southern areas that constitute the upper reaches of the Nyando catchment (Sang, 2005).
The Nyando River basin encompasses the Kisumu, Nyando, Nandi and Kericho Districts, and drains into
Winam Gulf of Lake Victoria. The basin has a total area of 3,550km2 and a main river course of 153km4.
Even though it is an important source of water for the people in the region, the Nyando River frequently
floods during periods of heavy seasonal rainfall, causing damage to homesteads and farmlands. The
Sondu Miriu River is the second largest in the area and a hydroelectric power plant has been
constructed on the lower reaches of the river (World Agroforestry Centre, n.d.). Aside from the two
II. GENERAL SECTION
G1. Original Conditions at the Project Site
General Information
G1.1 Project Area Location and Physical Parameters

4
major arterial rivers, several streams including Awach Kano, Asawo, Nyaidho and Ombeyi also drain
from the project area into Lake Victoria.
Figure 1: The Nyando catchment in relation to Kenya and the surrounding Nyanza District (adapted from Onyango et al, 2005)
Climate and Hydrology
The project area has a tropical climate with a bi-modal pattern of rainfall occurring mainly between
March – April and October – November. Two dry seasons occur in the intervening periods and hence
rainfall is distributed unevenly on an annual scale. Average annual precipitation in the Nyando basin
ranges between 900 – 1,600 mm and annual temperatures typically range from 20 - 35°C (Ramsar,
2005). Rainfall data (mm/annum) for Kisumu and Bosta collected between 1990 – 2009 is available at:

5
http://sdwebx.worldbank.org/climateportal/index.cfm?page=country_historical_climate&ThisRegion=Af
rica&ThisCCode=KEN ). A summary is presented in the following Table:
Month Kisumu Bosta
Jan 44.66 49.00
Feb 45.75 37.99
Mar 111.20 118.14
Apr 159.68 159.80
May 141.34 120.16
Jun 129.44 79.27
Jul 147.93 90.05
Aug 144.45 83.58
Sep 96.03 81.75
Oct 89.88 72.16
Nov 86.89 98.08
Dec 53.90 86.56
Annual total 1251.15 1076.54
1990 - 2009
Climate change related modifications to the regional climatic regime have far reaching effects on
agricultural production within the project area. Frequent long dry spells that are characteristic of
tropical climates may hinder AR activities and drought conditions are becoming increasingly common
(Alonso et al., 2011).
High rates of human population growth in the region mean that the implications of erratic water flow
regimes will be felt by more people. A recent flooding event in 2002 affected 175,000 people and
disturbed thousands of hectares of cultivated land in the Nyando basin and surrounding catchments
(Verchot et al., 2007). The effects of flooding and drought events are exacerbated by improper land use
and deforestation, both of which are contributing to the most severe problems of agricultural stagnation
and environmental degradation found anywhere in Kenya (Ongwenyi et al., 1993).
Soils
The project area supports a wide range of soil types, from soils with a high content of silt and clay such as
Ferrasols, Nitisols, Cambisols and Acricsols, predominant in the upland areas to Luvisol, Vertisol,
Planosol, Cambisol and Solonetz soil profiles from Holocene sedimentary deposits in the lower basin
(Mbaria, 2006). The soils are typically well drained and moderately fertile, which is essential for the
sustentation of agricultural practices in the area. Soils in the upper reaches of the project area are

6
relatively shallow and are prone to sheet and rill erosion (Ongwenyi et al., 1993; Swallow, B., Onyango,
L. and Meinzen-Dick, R., n.d.). In the lower reaches of the Nyando basin pedological profiles are
comprised of deep, sodic soils which are prone to gully formation (Ongwenyi et al., 1993). Changes to
climate and land use have resulted in increased rates of soil erosion across the project area, with
greatest losses recorded in the lower Nyando (Figure 2).
Figure 2: Soil erosion documented during field visits in the Lower Nyando
Soil erosion has severe implications for agricultural productivity in the area and the Nyando River Basin
is considered to be a soil erosion hotspot, with some of the most severe erosion on the African
continent contributing to the widespread degradation of previously productive agricultural land. Loss of
land to soil erosion at rates of >40 Mg/ha/yr (Andriesse and van der Pouw, 1985) may hinder the
implementation of AR activities, particularly in the more susceptible gully-forming soils of the lower
Nyando.
The process of soil erosion has led to the influx of sediment laden water with nutrients such as
phosphorus and nitrogen from the project area into Lake Victoria (Daas, 2002). Nutrient leaching from
cultivated soils has led to depletion of soil fertility in the Nyando catchment and subsequent
eutrophication in Lake Victoria. Eutrophication has a negative impact on fish stocks for local fisherman
as it promotes plant growth in the lake, which in turn removes large volumes of oxygen from the water.

7
This demonstrates the downstream environmental and economic implications of increasing rates of soil
erosion in the lower and mid Nyando basin.
Historical Vegetation Distribution
Historically the entire mid Nyando block was covered in equatorial forest (Yanda et al., 2001). The native
forest vegetation consisted of evergreen broadleaf forest, where the most ubiquitous tree species were
Croton megalocarpus, Diospyrus abyssinica, Funtumia latifolia, Olea welwitschii, Dombeya spp and
Dovyalis abyssinica. At lower altitudes in the lower block (<1400m), forest vegetation graded into
perennial grasslands comprised of species such as Themeda triandra, Hypairhenia hirta, Panicum spp
andEragrostis spp. Grasslands were typically interspersed with evergreen and semi-deciduous bushlands
including Dodonea angustifolia, Carissa edulis, Rhus natalensis, Rhus vulgaris and Euclea divinorum. In
the inland valleys of the Nyando basin and at the river mouth, Cyperus spp. wetlands and riparian
vegetation constituted the main native vegetation communities (Ntiba et al., 2001).
The vegetation distribution described above is representative of conditions in the Nyando basin prior to
1960. Since 1960 large scale land use changes have significantly disturbed the native vegetation
communities (Olang and Furst, 2010) (Figure 3) and the resultant distribution is a function of several key
factors.
1. Post-independence (1963) severe flooding around Lake Victoria created a large resettlement
scheme into Tinderet Forest, which now forms part of the project area in mid Nyando (Yanda et al.,
2001). This resulted in the clearance of large forest areas for settlement, after which time the
population more or less stabilised.
2. Following the post-election clashes in 1992 squatters arrived in to the area, many of whom resorted
to charcoal making which resulted in massive deforestation (Tobella, 2009).
Levels of deforestation in the project area have been investigated using increasingly available remotely
sensed data, which provides high resolution imagery with extensive spatial and temporal coverage. A
G1.2 Types and Condition of the Vegetation in the Project Area

8
study by Ogutu et al (2005) has shown that encroachment on forest reserves and wetlands and
transformation of farm lands from perennial to annual cropping systems characterize the major changes
in vegetation in the Nyando basin.
Figure 3: Landsat imagery used to show large scale vegetation and land use changes in the Nyando basin
between 1973 -2000 (Source: Olaka)
Current Vegetation Distribution
In order to support a larger population, the mid Nyando basin now comprises significant areas of
cultivated arable land used for agricultural production: both crop cultivation and raising of livestock.
Within the cultivated areas a mixed cropping system is used, where cereals (Zea mais,Sorghum bicolor,
and Panicum milaiceum), pulses (Vigna radiata) and root vegetables (Manihot esculenta,Maranta
arundinacea,and Ipomoea batatas) are typically grown (Mungai ed., 2002). Dominant agricultural land-
uses in lowland areas are maize (Zea mais), sorghum (Sorghum bicolor), sugarcane (Saccharum
officinarum), irrigated rice (Oryza sativa) and communal pasture (Ogutu et al., 2005). The lower basin is
flood-prone and annual flooding near the delta leaves rich alluvial deposits that are cultivated and yield
good harvests (Verchot et al., 2007).

9
There are two remaining forest areas, Tinderet and Mau forests, that are currently being heavily
deforested due to charcoal burning and illegal farming (Tobella, 2009). Unsustainable agricultural
practices have resulted in widespread areas of fallow and bush land, comprised of sparsely distributed
species such as Dodonea angustifolia, Carissa edulis, Rhus natalensis, Rhus vulgaris and Euclea
divinorum (Ntiba et al., 2001). An increasing area of land in the project area is unable to support
vegetation communities as the previously fertile soil is degraded by erosive forces.
The influx of eroded soil into Lake Victoria has led to the widespread colonisation of Eichhornia
crassipes: a non-native species of water hyacinth. Eichhornia crassipeswas introduced to Africa as
recently as the 1980s, yet now covers a total lake area of 5,000 ha (ICRAF, 2003). This invasive water
based plant dominates the lower Nyando River, at its point of entry into Lake Victoria in the Winam Gulf.
Abundant nutrients derived from agricultural soils and warm water temperatures mean that the plant
continues to spread prolifically across the lake, resulting in decreased lacustrine productivity and
significantly reduced fish stocks (ICRAF, 2003).This is compromising the Lake Victoria fishery and eroding
a keystone in local livelihoods, as fishing is one of the few sources of income that is not directly linked to
agriculture.
Decreasing land productivity has resulted in the adoption of agroforestry by some land owners in the
project area. The trees planted in agroforestry initiatives are for multiple purposes including (Onyango
et al., 2005):
1. Fuel wood production
2. Wind breaks
3. Timber production
4. Fruit production
5. Food production
6. Soil fertility
7. Medicinal product production
8. Fodder production
9. Aesthetics
10. Soil conservation
In the Nyando project area farmers retain a small number of naturally occurring species such as
Terminalia brownii and Acacia spp for agroforestry purposes. However the practice has led to the
introduction of exotic species, in favour of native species outlined previously. The most commonly used
exotic species are Grevillea robusta and Eucalyptus camaldulensis (Onyango et al., 2005). Indigenous
species across the designated project area are increasingly being replaced by exotic species on the
homestead scale.

2
The AR activities supported by the SACC project will extend to ~50,000 households over a total project
area of 208,185ha within the lower and mid Nyando River basin (Figure 4). Agroforestry initiatives will
be implemented on the homestead scale, on land which is privately owned. Land adjudication has been
completed in the communities and allotment numbers have been issued to individuals. Allotment
numbers give tenants the right to a title deed; however farmers do not typically have title deeds
because of the high cost of survey of 10,000KSH per farm (approx. USD 100) associated with the
process.
Figure 4: SACC Project Area
G1.3 Boundaries of the Project Area

3
Remote sensing (Landsat at 30m resolution) has been used to produce maps that provide clear
differentiation between the eligible and ineligible areas within the project zone. Ineligible areas
encompass the following land uses:
Forest (at any point in time series 2000, 2003, 2006 or 2011)
Sugar cane production area – referred to as the sugar belt
Irrigated rice production area – referred to as the rice belt
Other wetland
Settlement
Water
Other land uses which includes roads, quarries and airstrips
Within the remaining eligible areas AR project activity instances will be made up of many discrete areas
of land, each of which will be mapped using GPS and assigned a unique geographical identification. The
project intends to build upon existing AR activities in the lower and mid Nyando basin by using carbon
finance to extend these activities to other eligible areas within the River basin.
The project has been classified as large scale because it will result in the sequestration of >16,000
tonnes of CO2 / year over the project duration. However, the project activities will be implemented on
multiple small farm holdings. To date 1,344 of the target >50,000 households have implemented the
SACC project activities of which 594 instances have been validated for conformance with the Verified
Carbon Standard. The SACC project has been designed to allow for the expansion and crediting of
project activities to a wider area of the lower and mid Nyando River basin, subsequent to validation of
the initial 594 project instances. Hence the project can be categorized as a grouped project, whereby the
inclusion of new project activities and expansion of the area targeted by the project will follow after
initial validation which will relate to the initial 594 participating farmers.
New instances of project activity will be validated at the time of verification (against the eligibility
criteria). Each new instance of project activity will use the existing technical specifications for AR
activities developed during the initial project activity phase; however it is expected that the process of
project roll out may be streamlined with increasing levels of awareness, support, institutional and
technical capacity. The SACC project will follow the requirements set out for grouped projects in the VCS

4
standard. No further geographical sub-division within the project area was required to determine the
baseline, for the demonstration of additionality, the non-permanence risk analysis or for the assessment
of activity shifting and market leakage. The eligibility criteria for all new instances of project activity are:
New project activity instances must be located within the project boundaries delineated
No forest cover between 2000 – present (forest as defined by DNA with more than 30%
canopy cover and larger area than 0.25 ha)
No sugar cane areas are eligible
No rice growing areas are eligible
No wetland areas are eligible
Need to apply same technology i.e. the technical specifications in Annex 1.
A map which delineates the project area and all eligible land areas within the area is displayed below.

1
Figure 5: Current ineligible and eligible lands for AR project activities, 2010

Eligible areas account for 132,629 ha of the project area and ineligible account for 75,556 ha. Of the
eligible lands, 58,902 ha are in the upland areas (>1,300m a.s.l) and 73,727 ha are in the lowland areas
(<1,300m a.s.l).
In addition to the area that is covered by this project document, there may be potential for the
establishment of a similar project funded by CARE in the Homa Bay area. The area suffers from many of
the same issues of environmental degradation and decreasing land productivity as the lower and mid
Nyando basin and hence would benefit from similar AR activities. The implementation of this secondary
project is subject to the success of the SACC project in the lower and mid Nyando basin.
Project Area Leakage Belt
Project activities can contribute to measurable and attributable increases in GHG emissions outside the
project area which is known as leakage. There are two different types of leakage, primary leakage
(which includes activity shifting), and secondary leakage also known as market leakage. The SACC
project may specifically affect market leakage. Market leakage occurs when projects significantly reduce
the production of a commodity causing a change in the supply and market demand equilibrium that
results in a shift of production elsewhere to make up for the lost supply.
Market leakage will be determined indirectly, as leakage from the project area will be difficult to
monitor directly. However scientific knowledge will be used to provide credible estimates of the likely
impacts, which in this instance will result from the shifting of grazing animals from the project area. No
leakage belt will be delineated because the leakage area (if leakage does occur) will be in unidentifiable
grazing land areas that are not under the control of the animal owners.
The applicable VCS methodology for this project is AR-AMS0001 v06 ‘Simplified baseline and monitoring
methodologies for small-scale A/R CDM project activities implemented on grasslands or croplands with
limited displacement of pre-project activities”
G1.4 Current Carbon Stocks within the Project Area

3
This methodology has been selected for the following reasons:
Project activities are implemented on grasslands or croplands;
Project activities are implemented on lands where the area of the cropland within the
project boundary displaced due to the project activity is less than 50 per cent of the total
project area;
Project activities are implemented on lands where the number of displaced grazing
animals is less than 50 per cent of the average grazing capacity1 of the project area;
Project activities are implemented on lands where 10% of the total surface project area
is disturbed as result of soil preparation for planting.
The estimation of carbon stocks and projection of future changes in carbon stocks are based on the VCS
methodology AR-AMS0001 v06. Following this method, estimation of carbon stocks include detailed and
statistically determined field sampling and Remote Sensing/GIS-based systems of land-use and
management activity data, which will also be integrated for future reporting, monitoring and
verification. The basic elements involved can be summarised as:
Identifying significant land use and/or management activities
Identifying significant land use categories
Identifying significant carbon pools
Identifying significant CO2 emissions or removals by sinks from various carbon pools
Identifying significant non-CO2 (if any) gases and from what categories.
Stratification
Sub-step 1: Assess the Key Factors
1 See Appendix D.

4
The key factors that influence carbon stocks in the above- and below-ground biomass pools within the
project zone have been identified as soil features, local climate, landform, forest type, dominant tree
species and project actions.
Sub-step 2: Collect Maps of Key Factors
The general soil types in the region are a complex of moderately drained very deep, dark reddish –
brown, dark grey to black, firm to very firm, sandy clay to clay, sodic and/or cracking soils (Planosols,
gleysols, solonetz, vertisols and fluvisols) (Jaetzold & Schmidt, 1982 ). The predominant soils in Kano and
Nyakach plains are black cotton soil, sandy red soil and laterite soil. The soils are well drained, deep and
dark reddish brown in colour of volcanic footridges and lacustrine plains which have developed from
igneous basalt and phenolites. Almost all soils distributed in Kano Plains are fine-textured except for
some soils in the piedmont plain that are coarse to moderately coarse textured. Soils in the Nyakach
plain also show a broad variation. Soils at the fan base and lacustrine are finer while that at the
piedmont plain are coarse- textured. The pH of the soils in this region ranges from 4.5 to 10.4. In the
cuspate delta, a high pH of 9 or more is observed, while humic gleysols near swamps indicates low pH
values of 4.5. Most of the soils are non saline.
The soils in the lower reaches in Nyakach plains are dominated by sodic soils which are prone to gully
formation. Climate and vegetation information for the catchment are detailed in G1.1 – 1.3. The map
below demonstrates how indigenous forest resources are subject to degradation, in a continual shift of
land use to low yielding agricultural land (Figure 6).

5
Figure 6: Conversion of forested areas to other land uses from 2000 -2010
Sub-step 3: Preliminary Stratification
Table 1: Preliminary Stratification
Land use classification and description Eligible / ineligible
Forest ( at any point in time series 2000, 2003, 2006 or
2010) Ineligible
Sugar cane production area Ineligible
Irrigated rice production area Ineligible
Other wetland Ineligible
Lowland matrix of cultivated trees combined with other
sporadic on farm vegetation Eligible
Upland matrix of cultivated trees combined with other Eligible

6
sporadic on farm vegetation
Bush Eligible
Grassland Eligible
Barren Eligible
Settlement Ineligible
Water Ineligible
Settlements Ineligible
Other land uses including roads, quarries, airstrips Ineligible
Stratification is important to ensure accuracy and precision of data collected. Stratification involves
dividing the project area into sub-populations (strata) that form relatively homogeneous units.
Stratification is based on satellite imagery, aerial photographs and maps of vegetation, soils and/or
topography. The results of remote sensing were validated through ground truthing by field survey. The
initial unsupervised land cover classification, which was based upon field observation, identified the
strata as shown in Table 1.
Sub-step 4: Field Survey
The field survey was undertaken in two phases. During the first phase upland and lowland agricultural
strata were further divided for greater accuracy in estimation of baseline carbon stocks (see table 2)
Table 2: Land Use Stratification
Preliminary land use classification
and description (1)
Preliminary land use classification
and description (2) Eligibility
Forest ( at any point in time series
2000, 2003, 2006 or 2010) Unchanged Ineligible
Sugar cane production area Unchanged Ineligible

7
Irrigated rice production area Unchanged Ineligible
Other wetland Unchanged Ineligible
Lowland matrix of cultivated trees
combined with other sporadic on
farm vegetation
Ag10 Eligible
Ag20 Eligible
Ag60 Eligible
Upland matrix of cultivated trees
combined with other sporadic on
farm vegetation
Ag10 Eligible
Ag20 Eligible
Ag60 Eligible
Bush Unchanged Eligible
Grassland Unchanged Eligible
Barren Unchanged Eligible
Settlement Unchanged Ineligible
Water Unchanged Ineligible
Settlements Unchanged Ineligible
Other land uses including roads,
quarries, airstrips Unchanged Ineligible
Biomass data from a minimum of six randomly located 0.1 hectare sample plots in each of the eligible
land use strata was collected. After analysis of the data from the preliminary sampling, it was
established that the baseline carbon stocks for all of the 44 plots sampled was less than four tons of
carbon dioxide per hectare with a standard deviation of 2.64 tCO₂e. Baseline carbon stocks in the
different strata sampled were shown to be low (<4tCO₂/ha) with relatively low variation between
samples. It therefore made sense to merge all the initial strata into one single matrix to cover all of the
upland and lowland all of the eligible project area. The Winrock sample calculation tool (2007) was used
to calculate that 225 additional 0.1 hectare sample plots were required located based on a matrix across
all the eligible project areas in order to achieve a precision level of 10% and a confidence level of 95% of

8
baseline carbon stocks within the eligible project areas. A single baseline carbon value will therefore
apply to all new project activity instances within the project area delineated within this document.
Sub-step 5: Final Stratification
The final stratification merged all the agricultural strata (excluding rice and sugarcane) together with the
grassland, barren and bush strata to form a single baseline stratum which is eligible for new project
activity instances within the project area in both lowland and upland areas. This baseline stratification is
in line with the methodology applicability conditions, namely that project activities are implemented on
grasslands or croplands. According to AR-AMS00072 the following definitions apply to cropland and
grassland:
Cropland. Arable and tillage land that contains annual and/or perennial crops and/or woody
vegetation that does not impair its eligibility for AR CDM project activities.
Grassland. Rangeland/pasture-land subjected to any kind of anthropogenic exploitation that
may include systems with woody vegetation that does not impair eligibility of the land for A/R
CDM project activities.
These definitions of cropland and grassland are assumed to be the same for the SACC project.
Further details of the stratification methods used are available in Annex 2.
A copy of the Winrock sample calculation tool will also be sent to the validator.
2 http://cdm.unfccc.int/methodologies/DB/1GB973D5DQ1XKYBG8V2R357T9RMVUI

IPCC LULC Classes Refinement (i) Refinement (ii) Refinement (iii)
Grassland
Wetlands
Settlements
Bush
Barren
Matrix of bush, grassland, barren land and
cultivated land
Crop land
Matrix of bush, grassland, barren land and cultivated land (i.e.
GRASSLAND AND CROPLAND in accordance with the applicability
conditions for AR-AMS001)
Sugar cane production area Sugar cane production Sugar cane production
Preliminary Forest Strata (i) Preliminary Forest Strata (ii) Final Stratification
Irrigated rice production area Irrigated rice production Irrigated rice production
Forest landForest (at any point in time series 2000, 2003,
2006 or 2010)Forest Forest Land
Grassland Grassland Grassland
Wetlands Wetlands Wetlands
Settlements Settlements Settlements
Other LandsOther Lands Other Lands
Water Water
None
None
None
None
None
None
None
None
None
None
None
None
None
Lowland matrix of cultivated land combined with other sporadic on farm trees and
vegetation
Upland matrix of cultivated land combined with other sporadic on farm trees and
vegetation
Other Lands
Water
Lowland Ag 10
Lowland Ag 20
Lowland Ag 60
Upland Ag 10
Upland Ag 20
Upland Ag 60
Bush
Barren
Figure 7: Stratification process

Method of Calculation - Baseline Carbon Stocks
Baseline carbon stocks were determined using equations 1, 2, and 6 of AR-AMS001 / V.6. (See attached
spreadsheet Final Carbon Baseline for SACC.xls).
Sampling Methodology
To determine the carbon stock in the area prior to project, 225 sample plots were analysed. Vegetation
in these plots was measured for the following parameters:
Diameter of tree at breast height (cm)
Height (m)
These data were used in a number of equations, using carbon content variables and conversion factors,
to determine the following outputs:
Woody above ground biomass (t.d.m. stem)
Woody below ground biomass (t.d.m. stem)
Woody above ground biomass (t.d.m. ha)
Woody below ground biomass (t.d.m. ha)
Grass above ground biomass (t.d.m. ha)
Grass below ground biomass (t.d.m. ha)
Total dry biomass (tdm ha)
Carbon density (tC/ha)
These outputs are necessary to determine the total baseline carbon stock and this was measured for
each land type identified in the stratification process.
Results of Carbon Stock Calculation

11
The results of the carbon stock calculation demonstrate that for a matrix of cultivated trees combined
with other sporadic on farm vegetation, bush and bare land, the average carbon stock was 15.91
tCO₂/ha. It was found that the difference between carbon stocks for this land use type in upland and
lowland areas was negligible (<5%). Average baseline biomass (above and below ground for woody
perennials and below ground for grasses) based on the 127 samples taken from within the project area
is 3.19 tonnes with standard deviation of 6.58 tonnes of biomass per hectare. A conservative estimate of
baseline carbon per hectare with a confidence level of 95% is 4.33 tonnes of carbon per hectare
(equivalent to 15.91 tonnes of CO2 / hectare).
Values for biomass carbon stocks in other land use stratum within the project area are presented in
Table 3. The calculations for carbon storage in sugarcane, rice paddies and forests are all based on IPCC
values. These areas are not eligible to participate in project AR activities and no changes are expected to
carbon stocks within these strata as a direct or indirect result of any project activities.
Carbon stocks for land use types identified in the stratification process are detailed below (Table 3).
Table 3: Total biomass carbon stock in SACC project area
Land use stratum Area (ha) within project
area tCO2/ha
Carbon stock
(tCO₂)
Matrix of bush, grassland, barren land and
cultivated land 154,989 15.91 2,465,995
Sugarcane production 11,578 110.003 1,273,580
Irrigated rice production and wetland area 25,108 18.334 460,313
Forest land 8,830 537.005 4,741,710
3 Sugar cane source '2006 IPCC Guidelines for National Greenhouse Gas Inventories' Volume 4 Agriculture, Forestry
and Other Land Uses. Ref to chapter 5, Table 5.9, Default Biomass Carbon Stocks Present on Land Converted Cropland in the year Following Conversion. For perennial crops in tropical moist areas carbon stock after one year is 10 tC. Sugar cane is a perennial crop typically managed aver a 6 year cycle with 4 harvesting rotations within that cycle. We have conservatively assumed additional 10 tC sequestered per year over each 6 year period with long term average carbon storage of 30tC. 4 Irrigated rice source '2006 IPCC Guidelines for National Greenhouse Gas Inventories' Volume 4 Agriculture,
Forestry and Other Land Uses. Ref to chapter 5, Table 5.9, Default Biomass Carbon Stocks Present on Land Converted Cropland in the year Following Conversion. For annual crops carbon stock after one year is 5 tC.

12
Settlements 333 0.00 0
Other lands (including water bodies) 7,347 0.00 0
TOTAL 208,185 8,941,598
Total biomass carbon stock (tCO2) in the SACC project area is estimated to be 8,941,598.
There are two significant tribal groups in the SACC project area; Luo and Kalenjin.
The Luo tribe is the third largest community in Kenya and makes up close to 13% of the entire
population. History suggests that the Luo travelled along the river Nile from Sudan. They made entry
into Kenya around 500 years ago and established settlements in the lands surrounding Lake Victoria -
Africa’s biggest fresh water lake. For Luos living in rural areas, freshwater fishing in Lake Victoria is the
most important economic activity. The fish are consumed locally while some, especially the Nile perch,
are exported to Europe and other countries. Fish and bread are the staple foods of the Luo tribe.
Agriculture, especially sugarcane, rice and cotton farming, is also practiced in other areas where Luos
live. The Luos as a community also keep livestock and have a culture where all boys of the age of 12
years and above are expected to build their own houses called “Simba”. This is where the boys will sleep
because at that age they are not expected to sleep with parents in the same house.
Kalenjins are also Nilotes who are believed to have migrated from South Sudan. They are 4th largest
tribe in Kenya. Traditionally, Kalenjin houses were round. Walls were constructed of bent saplings
anchored to larger posts and covered with a mixture of mud and cow dung; roofs were thatched with
local grasses. While these kinds of houses are still common, there is a growing trend toward the
construction of square or rectangular houses built with timber walls and roofs of corrugated sheet
5 Forest Land source '2006 IPCC Guidelines for National Greenhouse Gas Inventories' Volume 4 Agriculture,
Forestry and Other Land Uses. Ref to chapter 4, Table 4.7, Above ground biomass in tropical moist deciduous forest is 260 tonnes dry matter per hectare and ratio of below ground to above ground biomass is 0.2 (Table 4.4). The carbon fraction [tonne C (tonne d.m.)-1] is 0.47.
Community Information
G1.5 Community Description

13
metal. Most Kalenjin are rural dwellers who do not have electricity or indoor plumbing. Radio/cassette
players; kerosene lamps and stoves; charcoal stoves; aluminum cooking pots; plastic dishes, plates, and
cups; and bicycles are the most common consumer items. Those few people who do have televisions
(but no electricity) use car batteries for power. The staple Kalenjin food is ugali. This is a cake-like,
starchy food that is made from white cornmeal mixed with boiling water and stirred vigorously while
cooking. It is eaten with the hands and is often served with cooked green vegetables such as kale. Less
frequently it is served with roasted goat meat, beef, or chicken. Before the introduction and widespread
diffusion of corn in recent times, millet and sorghum (native African grains) were staple cereals. All of
these grains were, and still are, used to make a very thick beer that has a relatively low alcohol content.
Another popular beverage is mursik. This consists of fermented whole milk that has been stored in a
special gourd, cleaned by using a burning stick. The result is that the milk is infused with tiny bits of
charcoal. Most Kalenjin make a living by cultivating grains such as sorghum and millet (and more
recently corn), and raising cattle, goats, and sheep. Farming (crops) and raising animals tend to be
separate activities since grazing land is usually located a distance from the fields and homesteads. In
traditional Kalenjin society much of the work is divided along gender lines. Men are expected to do the
heavy work of initially clearing the fields that are to be used for planting, as well as turning over the soil.
Women take over the bulk of the farming work, including planting, weeding, harvesting (although men
tend to pitch in), and processing crops. Women are also expected to perform nearly all of the domestic
work involved in running a household. Men are supposedly more involved with herding livestock than
with other pursuits. However, when men are engaged in wage labor away from home, women, children
(especially boys), and the elderly care for animals just as often as men.
Basic Parameters
The entire project area is densely populated due to numerous resettlement schemes dating back to the
1960’s and a growing population.

14
Figure 8: Population change in the Nyando basin between 1979 -1999 (Source: Olaka16)
The project area contains three constituencies in their entirety; Muhuroni, Nyando and Nyakach with
93,204 households according to the 2009 census (see Table 4). Parts of the Kisumu East, Tinderet and
Kipkelion constituencies are also located inside the project area though it is not clear what proportion of
the population live inside the boundaries of the project area. It is estimated that there are up to 115,000
households living inside the project area that may benefit from the SACC project with a total estimated
population of more than 500,000 people. This figure includes population from parts of Kisumu East,
Tinderet and Kipkelion, although these constituencies are not included in their entirety within the
project area.
The population of the Nyando basin is mostly young, with 42.7% of the population between the ages of
0-15 years (KIHBS - Basic Report). The population is comprised of 51.3% females and 48.7% males (KIHBS
– Basic Report), although high rates of population increase may invalidate these figures, which were
collected in 2006.
Table 4: Population Density projections in the Nyando basin by Division
Constituency 2009
Popn No. of HH
Muhoroni 145,764 33,551
Nyando 141,037 30,439
Nyakach 133,041 29,214

15
Kisumu East 264,227 67,291
Tinderet 199,514 42,860
Kipkelion 206,590 42,310
Total area 1,090,173 245,665
Source: Nyando District Development Plan 2008-2012
The population in the Nyando Basin is among the poorest in Kenya. 65% of the homes are poor in
comparison to 52% for Kenya on average. Poverty is less prevalent in the rural areas at 61% compared to
urban areas, where it stands at 72%. Poverty is rife in the project area due to a combination of social,
economic and environmental factors, some of which are identified below:
Degradation of land used for crop cultivation
Frequency of drought and flood events
Gender disparity
Lack of title deeds
Low literacy rates
Land conflicts
In addition to the above, Western Kenya is also characterized by high levels of disease and destitution.
Recent studies in the area indicate a high prevalence of malaria, HIV/AIDS (29.4% infection rate),
tuberculosis and water associated diseases (Njuguna, n.d.), and limited access to healthcare serves to
increase the poverty in the area.
Basic household parameters used to indicate poverty consistently show that the lower and mid Nyando
basin is poor relative to the provincial average (Table 5). The ‘pro-poor’ nature of the SACC AR project
could play an important part in alleviating poverty across the area.
Table 5: A comparison of basic household parameters across different data sets to evaluate the
similarity of sample used for analysis 26
Basic Indicator Lower Nyando Mid Nyando Nyanza province
Male-headed household (male=1.0) 0.68 0.92 0.60

16
Hold title to land (yes=1.0) 0.93 0.61 -
Farm size (acres) 2.32 3 -
Household education - None 0.32 0.16 0.18
Household education – primary 0.5 0.59 0.60
Household education – secondary 0.13 0.15 0.19
Household education – post secondary 0.3 0 0.3
The project area is predominantly occupied by the Luo community in the lower parts and the Kalenjin
community on the higher areas. The Kalenjin who were originally agro- pastoralists are engaged in
farming at a larger scale than Luos who were considered to be fishermen practicing farming and
livestock keeping at a smaller scale. Resettlement of the large farms in the upper catchment has led to
the co-existence of distinct clusters of Kalenjin and people from other ethnic groups. This was one of the
factors that contributed to politically motivated “tribal clashes” in 1992, 1994 and 1997 (Ayaga, 2007).
Both the Luo and the Kalenjin rely on agriculture as a primary source of income. About 60% of the
population are employed in agricultural activities, which contribute to 52% of household earnings
(Mailu, 2000). Despite heavy reliance on agriculture, less than 20% of Kenyan land is suitable for
cultivation and of this only 20% is classified as being of high or medium potential. The lack of alternative
sources of income has forced communities into poverty and output from the agricultural sector is low
due to the poor use of modern agricultural technology, lack of proper storage, erratic and unreliable
rainfall, lack of credit facilities, high costs of seed and other inputs, and poor road networks. In the
2009/2010 drought year farm productivity, measured in terms of Kenyan shillings, decreased by an
average of 50% across the lower and mid Nyando basin and agricultural productivity is likely to worsen
in light of high levels of land degradation and increasing frequency of floods and droughts across the
project area.
Gender Roles
Agricultural and agroforestry activities are typically male-dominated, although women are generally the
primary users of timber products in the project area. Households with female heads have lower food

17
security, as they tend to own smaller and less productive farms, and gender roles in communities across
the project area are such that females do not generally have control over income-generating activities.
Previous studies have confirmed strong gender differentiation in household roles across the Nyando
basin, with women bearing most responsibility for household water supply (Thorlakston, 2011).
Preliminary studies in the area have determined that gender control over resources varies between
different communities and hence when implementing the AR activities, these heterogeneities need to
be taken into consideration (FAO, 2005). Generally women cannot claim ownership of trees and this will
affect who is responsible for the maintenance of vegetation introduced by the SACC project. However
women can plant trees like Calliandra and Gliricidia (hence the eponym “women’s trees”) for
fodder/wood fuel and there is opportunity for female involvement in the project through the
introduction of different types of vegetation.
Non-native species will not have been assigned gender controls amongst communities in the Nyando
basin and hence women can take responsibility for new species planted for AR purposes. During initial
consultation with the community, it was determined that women have preferred fodder tree species on
farms such as Gliricidia spp. and Leucaena spp. Efforts will be made by CARE to include these species in
planting interventions, as women will mostly be responsible for the maintenance of trees planted on the
homestead scale as part of the SACC project. It is hoped that placing emphasis on gender issues in the
project area prior to the project will result in a project that is equally beneficial to both genders.
The main land uses observed within the project area are:
Subsistence farming. Most farmers practice subsistence farming. There are numerous
limitations to commercial agriculture, including lack of resources for investment and small land
sizes especially in lower Nyando where the population is fairly dense and the average land
holding per household is less than 1 hectare.
Settlement. The lower Nyando project intervention area has attracted a lot of settlers especially
from the flood prone areas, thereby increasing its population considerably.
G1.6 Current Land Use

18
Grazing. Livestock is a major asset to the community living in these areas. The number of
livestock has continued to grow resulting in overgrazing in most parts of the project area. The
typical practice in Lower Nyando is free grazing.
Sugarcane. This is a perennial plant that is harvested up to four times over a 6 year period
(Crow, 2009) and is used in the lower and mid Nyando basin as a cash crop. Sugar cane
production is associated with burning of land prior to harvesting which contributes to land
degradation in the area.
Rice. Farming of rice has become increasingly common in the lower Nyando catchment, where
both the Nyando River and Lake Victoria provide sufficient irrigation for crop cultivation.
Land use change
Remote sensing analyses of the project area indicate that a large proportion of the land is degraded or
degrading agricultural land, which historically would have been forested. The result of the large
increases in fallow land and grassland combined with the decline in tree cover is increasing competition
between land use types; a problem which is further exacerbated by soil infertility that prevents over-
cultivation of cropland. The predominant land use changes occurring are:
1. Community bush land is under increasing pressure from grazing by livestock and
encroachment for agricultural cultivation, the majority of which appears to be relatively
recent. In the past, exploitation of the bush land was intense for firewood, charcoal,
construction timber, clearance for settlement and agriculture. This has decreased recently
because community bush has become increasingly scarce.
2. Farming. The community has been practising farming without proper technical knowledge.
Poor farming practises have resulted in erosion and exhaustion of soils necessitating shifting
agriculture. A lot of land has been left fallow and bushland has been cleared to give room for
more agricultural land.
3. Settlement. There has been an increase in the number of homes although some extensive bare
areas of land still remain and tree cover throughout the region is negligible with the exception
of sporadic trees located around homesteads.

19
History of tree planting
Tree planting activities to date in the proposed project areas have been limited, with a survey conducted
in the project area identifying approximately 2,000 farmers to have participated in AR activities (Lindell,
2011). There is however increasing awareness of the need for tree planting after exhausting the trees
which were previously naturally available. Consultation with local communities has revealed that people
want to plant trees but have limited knowledge of the appropriate species to use in planting schemes,
and generally have insufficient financial capacity to make such an investment. There is a need for
extension services and farmer support to develop tree planting programmes. This project presents an
opportunity for financial barriers to be surmounted and carbon finance schemes are likely to result in
the widespread adoption of AR activities in the lower and mid Nyando basin.
Eligible land use covers for tree planting (AR) activities

20
Figure 9: Illustration of Land Use Covers. Photos by William Garrett
Land ownership
Most of Middle Nyando was a Settlement scheme in the 1960’s hence most of these settlers have tittle
deeds. There has been some increase in those missing title deeds due to further land subdivision and

21
the significant cost of transacting formal land tenure. In Lower Nyando Land adjudication is complete
and there are clear parcel numbers, however many people still don’t have title deeds to their property
(again because of the high cost associated with this transaction). Land ownership in the project area is
predominantly through inheritance from family. This ownership category is accepted by the community
and property boundaries are clearly known and/or demarcated. Land use rights are largely controlled by
men. However there’s limited control in female-headed household (widows) especially when she has a
male child.
Women have no cultural rights over land in both the Luo and Kalenjin culture. However in Kalenjin,
unmarried mothers can be apportioned land especially if they have a male child or children. There’s also
a rising number of people who purchase land due to its increasing scarcity. Land is seen as an
investment both for food production and also as an asset in itself. There’s been an increase in land lease
especially in the Middle Nyando where farmers lease land to plant commercial crops like sugarcane. A
percentage of squatters are present in Middle Nyando. They provide labour to the big farmers and also
do farming in unused farms (absentee landlords) whose owners are not present or using the farms. They
are not engaged in tree planting due to its long term nature. Most land disputes are therefore based on
common boundaries disputes which are resolved by village elders or chiefs.
Kenya is widely known for its abundant and diverse wildlife, especially large mammals such as
elephants, zebra and buffalo. However, a long history of human habitation and agriculture in the
Nyando basin has resulted in the replacement of native wildlife primarily with species used for
agriculture.
The SACC project will be implemented in the lower and mid Nyando River basin, located in Western
Kenya in the Nyanza District, an area that has been subject to increasing environmental degradation and
is affected by droughts and floods that are a function of both the physical characteristics of the area and
human influence on the land.
Biodiversity Information
G1.7 Current Biodiversity

22
The Nyando River basin covers an area of 3,517 square kilometers of Western Kenya (Kung’u and
Namirembe, 2012). The Nyando River is one of 15 major rivers that flow into Lake Victoria (Lake Victoria
Basin Commission, 2011). It is considered an important river for providing spawning grounds for some
types of fish, and by replenishing the lake with water and nutrients (Odada et al, 2006).
The river rises from the western Mau hills and traverses a distance of approximately 160 km. Its
drainage basin consists of five main sub-catchment areas namely; Nyando-Nandi, Nyando-Kericho,
Awach-Kano, Nyaidho-Kano and Nyando-Kano. The river has a steep gradient in the upper reaches, but
the gradient reduces as it approaches and flows through the Kano plains (Kung’u and Namirembe, 2012,
p.13).
A significant amount of research has been conducted on the river Nyando and Nyando wetlands and its
associated aquatic biodiversity. A recent study by Obiero, et al., (2012) investigated the impacts of the
water level decline on land use changes, wetland resource utilization, household food production,
income generation, fish catches, water supply, quality and quantity and biodiversity changes within the
Nyando wetlands in Western Kenya. The study identified common fish species found in the Nyando
wetlands:
Common fish species found in the Nyando wetlands
Scientific name Common (English) name Local (Luo) name
Lates Niloticus Nile perch Mbuta
Oreochromis niloticus Nile tilapia Nyamami
Protopterus aethiopicus Lung fish Kamongo
Schilbe mystus - Sire
Rastineobola argentea Sardines Omena
Haplochromis spp. Haplochromines Fulu
Clarias gariepinus Catfish Mumi
Clarias mossambicus Mud fish Duru
Barbus altianalis - Fuani

23
Barbus cercops - Adel
Alestes sadleri / jacksonii - Osoga
Labeo victorianus - Ningu
Mastacembelus fretanus - Okunga
Synodontis afrofischeri - Okoko rateng’
Synodontis victoriae - Okoko rachar
Bagrus docmac - Seu
Xenoclarias spp. - Ndhira
Source: Obiero, et al., 2012, p.1635
An earlier study by Mugo and Tweddle (1997) sampled the River Nyando in order to assess fish
abundance and distribution in the Lake Victoria river systems. The following list of species recorded in
the September 1997 survey of the River Nyando and adjacent streams supports the data collected by
Obiero, et al., (2012) above:
Species recorded in the September 1997 survey of the River Nyando and adjacent streams
Barbus altianalis
Barbus apleurogramma
Barbus cercops
Barbus jacksonii
Barbus kerstenii
Barbus neumayeri
Barbus nyanzae
Barbus paludinosus
Barbus yongei
Labeo victorianus
Aethiomastacembelusfrenatus
Schilbe intermedius

24
Clarias gariepinus
Clarias sp. 1
Glanas sp. 2
Oreochromis niloticus
Oreochromis leucostictus
Ctenopoma murei
Pseudocrenilabrus multicolor
Haplochromis sp.
Marcusenius victoriae
Protopterus aethiopicus
A locheilichth s bukobanus
Source: Mugo and Tweddle, 1997, p.123
The Nyando River Basin is considered to be a soil erosion hotspot, with some of the most severe erosion
on the African continent contributing to the widespread degradation of previously productive
agricultural land. The process of soil erosion has led to the influx of sediment laden water with nutrients
such as phosphorus and nitrogen from the project area into Lake Victoria (Daas, 2002). Nutrient leaching
from cultivated soils has led to depletion of soil fertility in the Nyando catchment and subsequent
eutrophication in Lake Victoria. Eutrophication has a negative impact on fish stocks for local fisherman
as it promotes plant growth in the lake, which in turn removes large volumes of oxygen from the water.
Further, analysis and simulations of stream flows in the Nyando river indicate that stream flow has also
become much more variable in the last 20 years than it had been in the 1950s and 1960s (Mungai et al.,
2002). Likewise, turbidity levels in the Nyando indicate that the river is carrying such heavy loads of
pollutants that aquatic plant and animal life is severely impacted. This confirms a statement by William
Oneya, cited in Mungai et al. (2002, p.4), that “In my youth … the River had all types of fish and in large
numbers. This is what most of the farmers fed on. Now there is very little fish in the River.”
According to the Lake Victoria Basin Commission (LVBC) (2011), further factors contributing to the loss
of biodiversity aquatic ecosystems of the basin include:
25
Interference with inflowing rivers and water extraction for agriculture and sugarcane production
Excessive fishing pressure
Water level changes
Pollution and industrial waste
Invasive and introduced species
Climate change
The open access policy to harvesting most of the natural resources
Inadequate policies, regulation and weak corrupt enforcement systems
Historical deforestation in the project area has left a mosaic of degraded bush and scrub in which only a
few highly fragmented native forest areas remain (land uses that dominate the lower and mid Nyando
basin are identified in the images above - it is evident that land types look degraded and have relatively
low species diversity Figure 9). This landscape does not support significant levels of biodiversity - there
are no globally, regionally or nationally significant concentrations of biodiversity values or significant
threatened or rare ecosystems in the project area. This situation was established following discussion
with appropriate regulatory groups and consulting national databases for lists of threatened species
(IUCN Red List).
In order to determine current biodiversity in the project area, a rapid assessment approach was taken.
This is defined by Ramsar6 (2005) as “a synoptic assessment, which is often undertaken as a matter of
urgency, in the shortest timeframe possible to produce reliable and applicable results for its defined
purpose.” The steps involved in planning and organising a rapid biodiversity survey are presented below:
• Identify need and objective for the survey
• Choose survey area
• Obtain all available biodiversity information for the area/region
• Determine number and location of sampling sites
• Set survey dates based on climate and season
• Determine appropriate taxonomic groups
6 Ramsar (2005) Guidelines for the Rapid Assessment of Inland, Coastal and Marine Wetland Biodiversity, Wetlands
and Water: Supporting Life, Sustaining Livelihoods, Kampala, Uganda, 8-15 November 2005

26
• Determine appropriate survey team members
• Logistical planning (transport, camps, equipment, contracts, food, etc.)
• Organize and purchase equipment and supplies (Alonso7 et al., 2011)
The following table presents a summary of the plant biodiversity in the project area:
Table 6: Plant biodiversity in the project area
Acacia abyssinica Not threatened Native
Acacia nilotica Not threatened Native
Acacia polyacantha Not threatened Native
Acacia tortillis Not assessed
Acacia xanthophloea Not threatened Native
Acacia drepanolobium Not threatened Native
Albizia coriara Not assessed
Balanites aegyptiaca Not assessed Native
Bauhiniat tomentosa Not assessed
Calodendrum capense Not assessed
Casuarina cunninghamiana Not assessed Introduced 1908
Combretum molle Not assessed
Croton megalocarpus Not assessed Native
Delonix Regia Vulnerable Native
Dichrostachys cinerea Not threatened Native
Eucalyptus grandis Not assessed Exotic
Eucalyptus reticulata Not assessed Exotic
7 Alonso, L., Deichmann, J., McKenna, S., Naskrecki, P. and Richards, J. (Eds.) (2011) Still Counting...: Biodiversity
Exploration for Conservation - The First 20 Years of the Rapid Assessment Program. Conservation International, USA

27
Eucalyptus saligna Not assessed Exotic
Euphorbia candelabrum Not assessed Exotic
Euphorbia tirucalli Least Concern Exotic
Ficus lutea Not assessed
Grevillea robusta Not assessed
Jacaranda mimosifolia Vulnerable Exotic
Ziziphus mucronata Not assessed
Leucaena oliefera Not assessed
Leucena leococephala Not assessed
Mangifera indica Data Deficient Exotic
Markhamia lutea Not assessed
Mellia azedirach Not assessed
Milicia excelsa Lower risk/near threatened
Moringa oleifera Not assessed
Combretum molle Not assessed
Cordia ovalis Not assessed
Carica papaya Not assessed
Persea americana Not assessed
Grewia trichocarpa Not assessed
Psidium guajava Not assessed
Rhus natalensis Not assessed
Clerodendrum myricoides Not assessed
Senna siamea Not threatened
Syzigium guajava Not assessed

28
Syzygium cuminii Not assessed
Terminalia brownii Not assessed
Thevetia peruviana Not assessed
Two species found in the project area are considered ‘vulnerable’ under the IUCN Red List, Jacaranda
mimosifolia and Delonix regia. Since these are present in only 1 of the 127 sample plots respectively,
they are not considered to be HCVs.
The SACC project presents an opportunity for the replenishment of biodiversity in the lower and mid
Nyando basin, as tree planting schemes are likely to encourage insect and bird life. Previous studies
have shown that areas subject to AR activities can support species that are assemblages that are as
abundant and diverse as native forests; however the species composition of these assemblages is highly
modified from natural conditions.
AR activities planned in the project area will introduce indigenous tree species including, Markhamia
lutea and Terminalia brownii and carefully selected exotic / naturalized species including Eucalyptus spp,
Casuarina spp, Grevillea robusta and Leucaena Leucocephala. Exotic tree species selection has been
done with the objective of meeting the needs of project participants for forest products. The project
activity instances will serve to enhance biodiversity on the homestead scale in addition to the crop
species that have largely replaced indigenous trees in the lower and mid Nyando basin. However, the
controlled nature of the replanting scheme means that increases in botanical biodiversity that can be
attributed to the project are limited.
Botanical Biodiversity
The lower and mid Nyando basin has suffered a loss of plant biodiversity in light of climate change and
resettlement. The land uses that dominate the lower and mid Nyando basin are identified in the images
G1.6 above, where it is evident that land types look degraded and have relatively low species diversity.
The continued transition of forested areas to agricultural land for economic purposes will decrease the
biodiversity of the project area.

29
High Conservation Value Resource Network (2003) High Conservation Value Forest Toolkit: Part 3 -
Identifying and Managing High Conservation Value Forests, High Conservation Value Resource Network
Qualification of high conservation values (HCVs) follows the High Conservation Value Resource
Network’s (HCV Network) toolkit, Part 3, Identifying and Managing High Conservation Value Forests: A
Guide for Forest Managers (HCV Network, 2003). The table below presents a summary checklist for
identifying HCVs within a forest management unit (FMU):
Table 7: Summary Checklist for Identifying HCVs within a Forest Management Unit
HCV (or HCV element) CCB Present /
Absent Source
HCV1. Globally, Regionally or Nationally Significant
Concentrations of Biodiversity Values
G1.8.1 Absent WDPA, 2012
HCV1.1 Protected Areas G1.8.1a Absent WDPA, 2012
HCV1.2 Threatened and Endangered Species G1.8.1b Absent WDPA, 2012
HCV1.3 Endemic Species G1.8.1c Absent WDPA, 2012
HCV1.4 Critical Temporal Use G1.8.1d Absent WDPA, 2012
HCV2. Globally, Regionally or Nationally Significant Large
Landscape Level Forests
G1.8.2 Absent Forest scale
HCV3. Forest Areas that are in or Contain Rare, Threatened
or Endangered Ecosystems
G1.8.3 Absent WDPA, 2012
HCV4. Forest Areas that Provide Basic Services of Nature in
Critical Situations
G1.8.4 Absent Forest scale
HCV4.1 Forests Critical to Water Catchments Absent
HCV4.2 Forests Critical to Erosion Control Absent
G1.8 High Conservation Values Evaluation

30
HCV4.3 Forests Providing Barriers to Destructive Fire Absent
HCV5. Forest Areas Fundamental to Meeting Basic Needs of
Local Communities
G1.8.5 Absent
Land use
activities
HCV6. Forest Areas Critical to Local Communities’
Traditional Cultural Identity
G1.8.6 Absent WDPA, 2012
In parallel to the WDPA, the World Database on Protected Areas (WDPA) - the most complete dataset
on the world's terrestrial protected areas - was used to determine whether the project area was
designated as a protected area. The UN-supported database is produced by UNEP-WCMC in
collaboration with the IUCN World Commission on Protected Areas (WCPA).
In order to feature in the World Database on Protected Areas (WDPA), protected areas must conform to
the IUCN definition of protected area, i.e. “a clearly defined geographical space, recognised, dedicated
and managed, through legal or other effective means, to achieve the long term conservation of nature
with associated ecosystem services and cultural values.”
A complete list of protected areas in Kenya was downloaded (available as a separate Excel file) and
analysed to determine whether the Nyando River Basin in the western Kenya region was indeed a
protected area. Since the Nyando River Basin does not feature in the WDPA, we can be certain that it
does not contain threatened and endangered species, critical ecosystem services and cultural values, as
per the IUCN definition.
As such, the following HCVs or HCV elements from the Checklist for Identifying HCVs within a Forest
Management Unit (High Conservation Value Resource Network, 2003) are not applicable:
HCV1. Globally, Regionally or Nationally Significant Concentrations of Biodiversity Values
HCV3. Forest Areas that are in or Contain Rare, Threatened or Endangered Ecosystems
HCV4. Forest Areas that Provide Basic Services of Nature in Critical Situations
HCV6. Forest Areas Critical to Local Communities’ Traditional Cultural Identity

31
This judgment is consistent with expert opinion (Gary McGurk of Care, Henry Neufeldt and lini
Wollenberg of ICRAF and local communities).
HCV1. Globally, Regionally or Nationally Significant Concentrations of Biodiversity Values
Not applicable
HCV2. Globally, Regionally or Nationally Significant Large Landscape Level Forests
The project area does not:
• Form part of an ‘intact forest landscape’
• Form part of a forest area that has been gazetted to maintain a natural landscape
• Connect two or more protected areas
The project area borders with Tinderet Forest Reserve, a 282 km2 (28,200 hectares) protected area
created to maintain a natural forest landscape (WDPA, 2012). Whilst the project area covers 208,184
hectares, only 8,849 hectares is under forest cover (4% of landscape) and a significant proportion of this
is made up of non-native forest types. The project area is therefore not considered a critical part of the
forested landscape and this HCV is not present.
HCV3. Forest Areas that are in or Contain Rare, Threatened or Endangered Ecosystems
Not applicable
HCV4. Forest Areas that Provide Basic Services of Nature in Critical Situations
Forests cover only 4% of the 208,184 hectare project area. We can therefore state with a high degree of
certainty that there are no forest areas in the project area that provide basic services of nature in critical
situations. Further, since the project area is not a protected area under the WDPA, it is not considered
to contain ecosystems or associated ecosystem services worthy of protection.
HCV5. Forest Areas Fundamental to Meeting Basic Needs of Local Communities
Historically the entire mid Nyando block was covered in equatorial forest. Since 1960, large scale land
use changes have significantly disturbed the native vegetation (a full account of which is presented in

32
G1.2 Types and Condition of the Vegetation in the Project Area). The project area is now almost entirely
deforested (4% forest cover remains in the project area), with farmers retaining only a small number of
naturally occurring tree species such as Terminalia brownii and Acacia spp on their lands. In the place of
forest, the mid Nyando basin now comprises a mosaic of cultivated arable land used for agricultural
production and degraded bush areas.
Whilst local communities rely on wood fuel for cooking and heating, this fuel is extracted from on-farm
trees and other isolated trees as opposed to forest areas. A very small proportion of the project
population encroach into the Tinderet Forest Reserve to harvest forest products but not to the extent
that it could be considered a forest area fundamental to meeting the basic needs of local communities.,
Project forest areas are therefore not considered fundamental to meeting the basic needs of local
communities, a judgement supported by household surveys and expert opinion.
HCV6. Forest Areas Critical to Local Communities’ Traditional Cultural Identity
Not applicable.
G1.8.1 Globally, Regionally or Nationally Significant Concentrations of Biodiversity Values
There are no (a) protected areas8 (c) endemic species (d) areas that support significant concentrations of
a species in the project area.
(b) threatened species - two species found in the project area are considered ‘vulnerable’ under the
IUCN Red List, Jacaranda mimosifolia and Delonix regia. Both Jacaranda mimosifolia and Delonix regia
are present in only 1 of the 127 sample plots respectively (0.8%). Such a low population in the project
area means they are not considered to be HCVs.
G1.8.2 Large Landscape-level Areas with Significant Naturally Occurring Species
8 With regard to protected areas, the reference listed in the CCB Standard, page 13, section G8.1a, states that
protected areas should be equivalent to IUCN Protected Area Management Categories I-VI, or as areas that have
been proposed for protected area status by the relevant statutory body but have not yet been officially declared, and
including areas protected under international conventions (e.g., Ramsar sites, World Heritage Sites, UNESCO Man-
and-Biosphere Reserves, etc.).
In order to determine whether any part of the project area was designated as a protected area, the World Database on
Protected Areas (WDPA) - the most complete dataset on the world's terrestrial protected areas - was used. The UN-
supported database is produced by UNEP-WCMC in collaboration with the IUCN World Commission on Protected
Areas (WCPA), and is considered to be equivalent to the IUCN Protected Area Management Categories.

33
Significant naturally occurring animal species have largely been replaced with species used for
agricultural activities in the project area. Across the entire lower and mid Nyando naturally occurring
plant species such as Terminalia have been diminished due to high levels of deforestation, which was
initiated with resettlement schemes within the project area in the 1960s. The remaining pockets of
Terminalia are the principal areas with significant naturally occurring species.
The project area does not:
Form part of an ‘intact forest landscape’
Form part of a forest area that has been gazetted to maintain a natural landscape
Connect two or more protected areas
The project area borders with Tinderet Forest Reserve, a 282 km2 (28,200 hectares) protected area
created to maintain a natural forest landscape (WDPA, 2012). Whilst the project area covers 208,184
hectares, only 8,849 hectares is under forest cover (4% of landscape) and a significant proportion of this
is made up of non-native forest types. The project area is therefore not considered a critical part of the
forested landscape and this HCV is not present.
G1.8.3 Threatened or Rare Ecosystems
The eastern boundary of the project area is adjacent to the Tinderet Forest, which is a threatened area
where timber reserves are under high pressure from local communities for use as firewood and
charcoal. Within the project area itself, several pockets of indigenous Terminalia forest remain. The
SACC project aims to decrease reliance on threatened forested areas, by providing finance for tree
planting on the homestead scale. A database of all protected areas in Kenya (WDPA) was downloaded
and analysed to determine whether the Nyando River Basin was considered protected under the IUCN
definition. Since it does not feature as a protected area under the WDPA, it is not considered a HCV
G1.8.4 Areas that Provide Critical Ecosystem Services
Forests cover only 4% of the 208,184 hectare project area. These forest areas do not provide basic
services of nature in critical situations, such as hydrological services fire control or erosion control. On
the contrary, the Nyando River Basin is considered to be a soil erosion hotspot, with some of the most
severe erosion on the African continent. Further, since the project area is not a protected area under

34
the WDPA, it is not considered to contain ecosystems or associated ecosystem services worthy of
protected status.
The project presents an opportunity for erosion control. Soil is a precious resource in the lower and mid
Nyando basin, as it is essential for the sustentation of agricultural practices that have previously been
identified as a primary source of income for ~60% of the population. Conservation of soil resources is
essential for food, fodder, medicines or building materials and therefore the project can be identified as
meeting the requirements of local communities.
Project activities will also contribute to the restoration of the River Nyando, which provides many fish
species with breeding grounds. This riverine ecosystem is threatened as excess plant material derived
from soil erosion and the resultant process of eutrophication congest the water ways. Soil stabilization,
interception and the reduction of overland flow associated with afforestation activities are expected to
reduce these negative environmental impacts.
G1.8.5 Areas Fundamental for Meeting the Basic Needs of Local Communities
The majority of land in the lower and mid Nyando basin is used for agricultural purposes, which provides
local people with their basic food requirements and income. Agricultural practices will be protected,
supported and bettered by the introduction of the SACC project and this forms the founding principle of
the proposed AR activities.
Livestock and subsistence farming are the principle economic activity of the communities in the Nyando
basin. By tradition, the community hold livestock as a form of banking system. Livestock may be sold
when cash is required. This will normally happen during times of stress. Most of the families have
livestock which will affect tree planting since animals are bound to disturb the young trees. These are
factors to consider during the implementation of the SACC project.
Historically the entire mid Nyando block was covered in equatorial forest. Since 1960, large scale land
use changes have significantly disturbed the native vegetation (a full account of which is presented in
G1.2 Types and Condition of the Vegetation in the Project Area). The project area is now almost entirely
deforested (4% forest cover remains in the project area), with farmers retaining only a small number of
naturally occurring tree species such as Terminalia brownii and Acacia spp on their lands. In the place of
35
forest, the mid Nyando basin now comprises a mosaic of cultivated arable land used for agricultural
production and degraded bush areas.
Whilst local communities rely on wood fuel for cooking and heating, this fuel is largely extracted from
on-farm trees and other isolated trees as opposed to forest areas. A very small proportion of the project
population encroach into the Tinderet Forest Reserve to harvest forest products but not to the extent
that it could be considered a forest area fundamental to meeting basic needs of local communities.
Project forest areas are therefore not considered fundamental to meeting basic needs of local
communities, a judgment supported by household surveys and expert opinion.
G1.8.6 Areas Critical for the Cultural Identity of Communities
Culturally property and land rights are still skewed in favour of men and less for women and youths,
occasionally resulting in conflicts in the Nyando basin. There are also a number of productive socio-
cultural taboos such as the timing of sowing as led by the eldest person in the community or household
(Golo kodhi) prior to which no one else is allowed to plant amongst the Luo. For Kalenjins it is believed
that the strength of a man is determined by the acreage of land under maize leading to delays in
planting or cultivation of large areas that are unmanageable for the respective communities.
Education is an important agent for attitude and culture change. Poor people typically have least access
to education and therefore the poor tend to take longer to change their ways of doing things and
adopting to new production technologies. Their views towards gender roles are traditional and this
element of the culture has not changed, even with the encroachment of westernized views into urban
areas in Kenya.
The most likely land use scenario was assessed as part of the demonstration of additionality (see Section
G.2 Additionality) and follows Approved VCS Tool VT0001, Tool for the Demonstration and Assessment
of Additionality in VCS Agriculture, Forestry and Other Land Use (AFOLU) Project Activities, Version 1.0.
G2. Baseline Projections
G2.1 Most Likely Land Use

36
The potential alternative land use scenarios include AR or the development of alternative livelihood
activities. Such scenarios are considered unlikely to occur in the absence of the project activity as
evidenced by the ongoing deforestation and absence of significant AR combined with high rates of
unemployment within the project area.
The most likely land use in the lower and mid Nyando basin is a continuation of pre-project activities,
involving overgrazing and unsustainable harvesting of timber products primarily for use as wood fuel,
which will result in on-going deforestation and widespread land degradation. Continuation of pre-
project activities will exacerbate environmental issues of soil erosion and eutrophication of aquatic
ecosystems that have been outlined previously (Section G1.1). Population increases combined with a
lack of alternative livelihood opportunities, decreasing timber resources in the project zone and
insufficient capacity to protect the remaining vegetation resources clearly provide evidence that the pre-
project condition, characterized by escalating use and resource extraction, is the most likely future land
use.
Figure 6 demonstrates that although most of the deforestation in the SACC project area took place prior
to the 1980s, there is still pressure on timber resources in the area. Deforestation and degradation are
still taking place and this is supporting evidence of the unsustainable nature of the pre-project activities.
The drivers of GHG emissions, namely overgrazing, burning of crop land, inefficient and unsustainable
use of fuelwood (firewood and charcoal), are discussed in detail in G2.3.
The extent of any previous (historical) afforestation in the SACC project area is minimal. The majority of
the afforestation has been implemented by rich immigrants from towns and other communities
although a small proportion is attributable to the Care Agrilife programme. This was used as a pilot
before the onset of this SACC programme. There are very few immigrants in this area. The afforestation
implemented by the immigrants will not cause any significant impact on the ecosystem if not attended
to.
G2.2 Additionality

37
To establish a preliminary justification for the SACC project, it is important to adopt a process that
considers whether the agroforestry activities proposed by CARE would have occurred if, holding all
conditions in the project area constant, they were not implemented as part of a carbon offset project.
This process, applied to demonstrate additionality for the project, is comprised of four steps dictated by
the VCS Tool VT0001, Version 1.0, ‘Tool for Demonstration and Assessment of Additionality in VCS
Agriculture, Forestry and Other Land Use (AFOLU) Project Activities’. The project proposed for
implementation by CARE in the lower and mid Nyando basin meets the two applicability conditions set
out in VT0001.
Additionality Procedure:
STEP 0. Preliminary screening based on the starting date of the AR project activity;
STEP 1. Identification of alternative land use scenarios to the AR project activity;
STEP 2. Investment analysis to determine that the proposed project activity is not the most
economically or financially attractive of the identified land use scenarios; or
STEP 3. Barriers analysis; and
STEP 4. Common practice analysis.
Step 0. Preliminary screening based on the starting date of the AR project activity
Evidence that the afforestation or reforestation project activity has a starting date after 31 December
1999 but before the date of its registration is provided in Annex 3, in the original proposal for the SACC
project.
Step 1.
This step serves to identify alternative land use scenarios to the proposed VCS AR project activity(s) that
could be the baseline scenario, through the following sub-steps:
Sub-step 1a.
The identified credible land use scenarios for the land within the project boundaries in the absence of
the SACC project are:

38
1. Continuation and escalation (given population increase) of deforestation and degradation of the land
as a result of unsustainable harvesting of timber products and overgrazing in line with historical trends.
2. Afforestation / reforestation of the land within the project boundary performed without registration
as a VCS project activity.
3. Development of alternative livelihood activities and new employment opportunities.
Sub-step 1a contains more than one land use scenario and therefore the project cannot be considered
additional at this stage.
Sub-step 1b.
The list of plausible alternative land use scenarios to the project activity is in full compliance with
mandatory legislation and regulations, taking into account their enforcement across the country. The
scenarios are developed as a function of behavioral changes that might take place within the project
area that would be in line with Kenyan law.
Sub-step 1c.
The historical trends regarding land use and land use change in the lower and mid Nyando basin indicate
that deforestation and land degradation is the most likely scenario for the land within the project’s
boundary. There have been small scale AR projects implemented in the project area previously, yet
these are limited due to insufficient financial and technological capacity of the local population.
Diversification of employment opportunities is not expected in a rural area where agriculture is the
primary income source and fishing operations in the lower Nyando are threatened due to depleted fish
stocks in Lake Victoria. Statistics show that livestock numbers are decreasing across the project area
(Lindell, 2002), due to the need to sell animals during drought and flood events and shifting cultural
habits. Finally it is unlikely that pressure will be taken away from existing timber sources, as the local
population requires them for wood fuel and charcoal making activities on the homestead scale.
Step 3. Barrier analysis
Sub-step 3a.

39
A barrier analysis has been performed in place of the investment analysis (Step 2). The following barriers
have been identified (barriers are not specific to the project or the project proponents):
Institutional barriers
There is limited guidance available at the grass-root scale in Kenya as to sustainable farming practices.
Past government policy has included implementation of higher commodity prices in order to increase
incentives to adopt soil conservation measures in agricultural activities (Ministry of Livestock and
Fisheries Development, 2005). However studies have shown that there is no simple relationship
between price distortions created by government policies and farmers' incentives to adopt conservation
measures (Ministry of Livestock and Fisheries Development, 2005). Policy-induced price changes could
lead to either more or less conservation, depending on site-specific conditions. In the Nyando basin,
land degradation continues despite preventative governmental policy, as there is lack of knowledge
about sustainable agricultural practices amongst some local communities.
Lack of extension services at sub-location and village level is also an important barrier to the SACC
project. Carbon finance will enable the project to fund non-governmental these extension services.
The Aglife project demonstrates the significance of this barrier, as tree planting occurred once extension
agents were in place and farmers were supported without any other incentives.
The main institutional barrier is poor leadership and lack of accountability in the management of land
which leads to lack of trust (FAO, 2005). The strategies for dealing with these barriers includes training
and providing workshops on group formation, leadership, group dynamics and financial management.
The project will also provide clearer guidelines and rules relating to harvesting of timber products for
wood fuel and all other activities that impact upon vegetation resources (e.g. grazing and burning) prior
to project implementation. These guidelines will be important in ensuring the sustainability of
agroforestry practices after initial planting has been completed.
Technological barriers
There is currently a lack of access to planting materials and a shortage of modern equipment for
agricultural activities in the lower and mid Nyando basin. During initial consultation with local

40
communities these factors were outlined by many farmers as placing restrictions on the development of
agroforestry practices in the project area. The issue of purchasing seeds was a particular area of
concern, as high seed prices have forced some farmers into selling livestock to sustain their agricultural
inputs (Harvey and Gonzalez Vilalabos, 2007). The barrier associated with the purchase of planting
materials and tools for agricultural activities can be overcome with carbon finance revenues.
Revenue from carbon finance can also be used for other domestic investment. For example the
community of the lower and mid Nyando basin lacks access to household technologies, such as fuel
efficient stoves. Carbon finance revenue can help the community access these efficient stoves, which in
turn will place less reliance on existing forest resources to provide wood fuel. This is an example of
positive feedback that might result from the project activities to improve agricultural practices and
yields, whilst alleviating poverty amongst local communities.
Barriers related to local tradition
The traditional Luo way of life is based around agriculture and pastoral herding. Typically communities in
the lower and mid Nyando basin have not had opportunities to develop the skills required to establish
sustainable planting and maintain trees over an extended period of time. Furthermore there are also a
number of socio-cultural barriers and taboos, such as timing sowing as led by the eldest person in the
community or household (Golo kodhi) prior to which no one else is allowed to plant amongst the Luo.
For Kalenjins it is believed that the strength of a man is determined by the acreage of land under maize
leading to delays in planting or cultivation of large areas that are unmanageable for the respective
communities (FAO, 2005).These significant barriers can be overcome through the sale of carbon offsets
and education of the local population as to the benefits of AR activities. The carbon finance resulting
from AR activities will be used to develop awareness in sustainable planting techniques.
Local traditions dictate that livestock herds are kept for use as payment when debts need to be settled,
as demonstrated by the use of livestock to purchase seeds. The presence of large herds means that land
in the lower and mid Nyando basin is under high pressure from grazing. The project will decrease grazing
pressure, as famers will be able to access money through carbon finance and therefore will not be
required to keep such large herds for use as emergency payment.
Barriers due to prevailing practice

41
The SACC project will be the second project developed under the AR-AMS0001 VCS methodology in the
host country. Previous projects have been implemented in the host country under VCS methodologies,
including the TIST Kenya programme and the Kasigau Corridor REDD Project, registered in central and
southern Kenya, respectively. The latter project follows a methodology developed for avoided
deforestation activities, whilst the former focuses on reforestation activities, similar to the proposed
project in the lower and mid Nyando basin. The TIST programme was implemented on a small scale and
used the same methodology: AR-AMS0001. Hence there is a history of successful implementation of this
method of AR intervention in the Kenya and there should be no barrier due to prevailing practice.
Barriers due to local environmental conditions
Unfavourable climate conditions such as droughts and flooding are becoming more frequent and
damaging in the lower and mid Nyando basin. 2009 saw both natural disasters decrease farm
productivity levels across the project area by ~50%, from an average of 45,250 Ksh to 20,600 Ksh. Losses
are typically greatest amongst smaller, poorer herders in the lower basin, who have fewer resources to
take water to their livestock and crops during extreme dry periods. The lower basin tends to be affected
by floods and droughts on a cyclical basis and hence the issues of land degradation and soil erosion are
exacerbated relative to the mid Nyando basin. This project is intended to deliver substantial climate
adaptation benefits to farmers affected by adverse climate conditions across the project area, through
the development of sustainable resource management plans and reduction in over-reliance on
exploitation of natural resources.
The issue of food security will also be addressed by the SACC project by placing focus on sustainable
farming practices across the project area and development of agroforestry systems to improve soil
conservation. Over an extended period of time this could contribute to increased crop yields and hence
improved food security for land owners in the lower and mid Nyando basin.
Barriers due to social conditions and land-use practices
The underlying causes of deforestation and land degradation are poverty amongst local land owners and
an increasing population. The average annual income for people in Kenya is 720 USD (Ayaga, 2007) and
hence many Kenyans, particularly those who make a living from agriculture, live in a state of poverty.
The agents of deforestation and land degradation are primarily poor and are engaged in activities that

42
result in land degradation to meet either subsistence or very low earning commercial agricultural
activities.
Previous research has demonstrated that there is understanding amongst local farmers that crop
diversification can be used to improve land condition. Furthermore it is understood that trees help to
maintain soil stability and fertility, yet it is not always feasible for farmers to diversify crops or plant
trees due to financial barriers, which include the high costs of seedlings and promotion of the cultivation
of crops which can be sold for the greatest profits.
Sub-step 3b.
The identified barriers would not prevent the implementation of at least one of the alternative land use
scenarios. Table 8 below demonstrates this.
Table 8: Barriers in relation to different land use scenarios
Scenario
Barrier Continuation and escalation
of land degradation
Afforestation /
reforestation of the land
Development of
alternative livelihood
activities
Institutional
There is limited enforcement
of environmental protection
laws
Afforestation is promoted
rather than prevented
There are no laws
restricting people to
certain jobs
Local tradition This is the traditional norm
in the Nyando catchment
2000 farmers have
already taken part in
afforestation
There is diversification of
employment, as 27% of
people are not employed
in agriculture full time
Prevailing
practice
This has been prevailing
practice since the 1960s
Afforestation is not
prevailing practice, but
farmers are taking part in
schemes
Diversification of
employment
opportunities means that
alternative livelihoods
could becoming
prevailing practice

43
Environmental
conditions
Environmental conditions
will promote further
degradation
Trees can be supported
by the soils, even with
poor environmental
conditions
Environmental conditions
may force people from
agriculture into other
livelihoods
Social
conditions and
land-use
practices
Social conditions mean that
some people are unaware of
their impact on the land and
hence will not change their
practices to preserve it
Intervention from bodies
such as ICRAF will lead to
increased awareness that
afforestation is a valuable
land use practice
Agricultural land use
practices do not provide
high wages and people
may want to increase
their income through
alternative livelihoods
Step 4. Common practice analysis
Kenya has a long history of land degradation. National annual rates of deforestation between 1990 and
2010 are estimated to be 0.34% and soil erosion losses are increasing across the lower and mid Nyando
basin. The prevention of land degradation is not considered to be common practice despite the long
term benefits that would be observed in terms of increased agricultural yields and soil fertility. Most
communities are unable to realize the economic value of timber resources in ways that do not involve
deforestation and degradation and therefore, they have not adopted sustainable land use practices on a
large scale across the project area.
There are agroforestry activities similar to the proposed project activity previously implemented or
currently underway in the lower and mid Nyando basin. However these are sparsely distributed across
the project area and are limited to famers with sufficient investment power or third party funding to
initiate such activities. Approximately 2,000 farmers in the project area are already involved in
agroforestry activities, often initiated in association with the World Agroforestry Centre (ICRAF) and
under the guidance of their staff. This however does not represent a significant proportion of the
population, which has generally been shown to suffer from increasing poverty as a function of land
degradation and population increases (Section G1.5). Higher incidences of poverty leave the local
population unable to engage in AR activities, as they have insufficient financial and technological
capacity to do so.

44
Additionality summary
Similar activities to the SACC project cannot be observed on a large scale across the project area. Very
few farmers in the project area have planted more than a small number of trees (>50) prior to the SACC
project. Tree planting activities prior to the SACC project have not been implemented in a systematic
manner in accordance with technical specifications for tree spacing, rotation length etc. This is clearly
evidenced by the Camco leakage survey (2011), remote sensing (Kiama, 2011), expert opinion and PRA
(individual farmer meetings and group discussions). The proposed VCS AFOLU project activity therefore
represents a significant excursion from the baseline scenario for the lower and mid Nyando basin and
hence the project is considered to be highly additional.
The approval and implementation of the project will overcome institutional barriers, technological
barriers, barriers related to local tradition, barriers due to prevailing practice, barriers due to local
ecological conditions and barriers due to social conditions and land-use practices. Hence the project will
provide numerous benefits including:
1. Prevention of carbon emissions to the atmosphere, that would occur as a result of the land use
activities prevalent in the alternative scenarios.
2. Influence other regional, national, and international stakeholders who can see this as a testing
ground for future carbon finance activities related to AR activities and are expected to be
motivated to participate in a “learning by doing” exercise regarding carbon monitoring,
verification, certification, trading, and carbon project development in general.
3. Close interaction between individuals, communities, government, and carbon markets to
intensify the institutional capacity to link networks for environmental products and services.
4. Improvement of land productivity across the project area and increased sustainability of soil
resources for future agricultural activities.
5. Empowerment of poor members of society and women through their inclusion in AR activities.
6. Increased financial capacity of the targeted poor section of society from the benefits of carbon
finance.
G2.3 Carbon Stock Changes

45
Project Emissions Project emissions are considered insignificant and therefore neglected.
Ex ante actual net GHG removal by sinks
Ex ante actual net GHG removal by sinks was estimated in accordance with the methods presented in
CDM AR-AMS0001 / V.6 using equations 11, 12, 13, 16, 17 & 21.
The carbon stocks for the project scenario at the starting date of the project activity9 (t=0) shall be the
same as the baseline stocks of carbon at the starting date of the project (t=0). Therefore:
Equation 11
N(t=0) = B(t=0)
For all other years, the carbon stocks within the project boundary (N(t)) at time t shall be calculated as
follows:
Equation 12
N(t) = ∑(NA(t) i + NB(t) i) * Ai
i=1
where:
N(t) Total carbon stocks in biomass at time t under the project scenario (t C)
NA(t) i Carbon stocks in above-ground biomass at time t of stratum i under the project scenario
(t C/ha)
NB(t) i Carbon stocks in below-ground biomass at time t of stratum i under the project scenario
(t C/ha)
Ai Project activity area of stratum i (ha)
i Stratum i (I = total number of strata)
9 The starting date of the project activity should be the time when the land is prepared for the initiation of the
afforestation or reforestation project activity under the CDM. In accordance with paragraph 23 of the modalities and procedures for afforestation and reforestation project activities under the CDM, the crediting period shall begin at the start of the afforestation and reforestation project activity under the CDM (see UNFCCC website at <http://unfccc.int/resource/docs/cop9/06a02.pdf#page=21>).

46
Above-ground biomass
For above-ground biomass NA(t) i is calculated per stratum i as follows:
Equation 13
NA(t) i =T(t)i * 0.5
where:
NA(t) i Carbon stocks in above-ground biomass at time t under the project scenario (t C/ha)
T(t)i Above-ground biomass at time t under the project scenario (t d.m./ha)
0.5 Carbon fraction of dry matter (t C/t d.m.)
1. If biomass tables or equations are available then these shall be used to estimate T(t)i per
stratum i. If volume table or equations are used then:
Equation 16
Below ground biomass calculated using allometric equation developed by Cairns et al (1997):
NB(t) = exp(–1.085 + 0.9256 * ln T(t)) * 0.5
Equation17
The removal component of actual net GHG removals by sinks can be calculated by:
CPROJ,t = (Nt - Nt-1)*(44/12)/Dt
where:
CPROJ,t Removal component of actual net GHG removals by sinks per annum (t CO2-e/year)
N(t) Total carbon stocks in biomass at time t under the project scenario (t C)
Dt Time increment = 1 (year)
2. Project emissions are considered insignificant and therefore:
tPROJGHG , = 0
where:
GHGPROJ, t Project emissions (t CO2-e/year)
Equation21

47
The net anthropogenic GHG removals by sinks for each year during the first crediting period are
calculated as,
ERAR CDM, t = ΔCPROJ, t – ΔCBSL, t - GHGPROJ, t – Lt
where:
ERAR CDM, t Net anthropogenic GHG removals by sinks (t CO2-e/year)
ΔCPROJ, t Project GHG removals by sinks at time t (t CO2-e/year)
CBSL,t Baseline net GHG removals by sinks (t CO2-e/year)
GHGPROJ, t Project emissions (t CO2-e/year)
Lt Leakage attributable to the project activity at time t (t CO2-e / year)
To improve the accuracy of the estimation of carbon sinks, the project area was stratified into Upland
(between 1300 and 1800m above sea level) and Lowland (between 1120 m and 1300 m above sea level)
zones, and carbon models developed for each technical specification (i.e. planting plan) based on the
tree species proposed for each specification. The results of GHG removals by sinks are therefore
presented for each of the six strata. The strata are listed in Table 9.
Table 9: Project planting plan stratification
1
Lowland
Dispersed interplanting
2 Woodlot
3 Boundary planting
4
Upland
Dispersed interplanting
5 Woodlot
6 Boundary planting
The equations were applied in the following order:
Equation 13- Above ground carbon
Equation 16 – Below ground carbon
Equation 11 – Carbon stocks at starting date of project activity
Equation 17 – Annual removals

48
Equation 12 – Total project carbon
ABOVE GROUND BIOMASS
There is no information concerning the growth characteristics of the trees to be planted
through the SACC project. The SACC project therefore collected data on tree growth rates from
within the project area in order to determine the project potential to achieve carbon removals.
The following methods were used to determine the AGB of the tree species recommended in
the 3 different project planting systems at different points in time:
a. Field data collection
1.1.1. Tree selection
Trees of different ages and sizes throughout the range of interest (1-50 years old) were selected from
the locality of the project area. Selected trees must be of a known age. Tree age is usually established
through conversation with the farmer. Ideally, a minimum of 10 trees in each age class (i.e. 1 – 10years,
11 – 20 years, etc.) should be measured for each species. If there is a lot of variation among individual
trees, larger sample sizes may be necessary.
1.1.2. Measurement
A separate data sheet was used for each farm visited. For each farm visited the following records were
made:
Location of measurement;
Geographical coordinates of the site
Elevation in m.a.s.l.;
Soil type.
For each tree measured the following was recorded:
the species;
the diameter of the stem 1.3 m above ground level (a stick marked at 1.3 m can be useful
for determining the correct height to make the measurements). Be aware of the correct way
to measure trees with non-standard stems (see Figure 9). Record the value in cm to one
decimal place (i.e. 10.2 cm);

49
the height of the tree, measured directly for smaller trees, or with a clinometer for larger
trees. Record the value in m to one decimal place (i.e. 3.4 m);
crown position (1-5; see Figure 11);
crown form (1-5; see Figure 12);
whether the tree is planted or grew naturally;
age of the tree; and
any signs or details of management (e.g. coppicing or pruning).

50
Figure 10: Process for determining the point of measurement for trees
The following guidelines are provided to determine the point of measurement for trees:
a) Whenever possible record d.b.h. at 1.3 m height
b) if the tree is forked at or below 1.3 m, measure just below the fork point;
c) if the tree is leaning, make sure the tape measure is wrapped around the tree according the tree’s
natural angle (instead of parallel to the ground);
d) if the tree is on a slope measure record measure 1.3 m on the uphill side;

51
e) if it is not possible to measure below the fork point, measure as two trees;
f) if the tree has stilt roots, measure 50 cm above the highest stilt root;
g) if the tree is buttressed at 1.3 m, measure 50 cm above the top of the buttress;
h) if the tree is deformed at 1.3 m, measure 2 cm below the deformity;
i) if the tree is fluted for its entire height, measure at 1.3 m If the tree has fallen but is still alive (if there
are green leaves present) measure the d.b.h. as if it was standing).
j) pass the tape under any vines or roots on the stem.

52
Figure 11: Crown position index (CPI; trees are classified on a scale from 1 to 5 depending on light received by
the crown of the tree.

53
Figure 12: Crown form index (CFI); trees are classified on a scale from 1 to 5 depending on the condition of the
crown
The actual number of tree measured within each age class is shown in Tables 10 and 11. Where the
minimum target of 10 trees has not been achieved this is due to the non-availability of suitable trees to
measure within the project area.
Table 10: Tree species and minimum number of trees to be measured in Lowland areas
Tree species 1 – 10 years 10 – 20 years 20 – 30 years >30 years
Markhamia lutea 10 8 4 3
Casuarina equisetifolia 24 7 10
Grevillea robusta 23 18 4 12
Eucalyptus camaldulensis 21 11 1
Terminalia brownii 11 16 10 10
Leucaena leucocephala 20 11 4
Table 11: Tree species and miminum number of trees to be measured in upland areas
Tree species 1 – 10 years 10 – 20 years 20 – 30 years >30 years
Markhamia lutea 20 13 1

54
Casuarina equisetifolia 24 10 10 12
Grevillea robusta 26 19 8 4
Eucalyptus camaldulensis 10 5 7 7
Terminalia brownii 11 2 6 11
Leucaena leucocephala 13 4 2
1.2 Data analysis
The tree measurement data (height and dbh) was used to determine the relationship between tree
species, age, height and dbh:
1. Estimate dbh:height relationship (plotted dbh vs height and calculated best fit line)
2. Estimate dbh:age relationship (plotted age vs dbh and calculated best fit line)
3. Estimate height:age relationship (plotted height vs age and calculated best fit line)
4. Calculate individual tree AGB (t.d.m) using the predicted dbh from trees of age 1, 2, 3, ...5…20,
etc. based on the allometric equation (Brown, 1997):
AGB = exp{-1.996 + 2.32 * ln(DBH)}
This equation is considered to be suitable as evidenced by the rainfall data for Kisumu and Bosta
between 1990 – 2009 (see section on Climate and Hydrology). The location of both of these weather
stations is close to the project area and rainfall is within the range of 900 – 1,500 mm per year.
The AGB equation is applicable for trees with a DBH between 5 - 40cm. The forecast DBH for each of the
tree species is shown in the Table below. The DBH measurements which are outside of these limits (5 –
40 cm) are highlighted in the Table below. The maximum forecast DBH within the crediting period is 46
cm (i.e. 15% more than the upper limit) for Eucalyptus grown in upland areas 25 years after planting.
There is no alternative allometric equation in Appendix C (AR-AMS0001) for trees with a DBH greater

55
than 40 cm in the 900 – 1,500 annual rainfall range so the equation has been applied to calculate
aboveground biomass for trees with DBH outside of the specified limits.
Tree DBH
Year
Casuarina
equestifolia
Eucalyptus
camaldulensis
Grevillea
robusta
Leucaena
leucophela
Markhamia
lutea
Terminalia
brownii
Low Up Low Up Low Up Low Up Low Up Low Up
1 4 3 3 5 3 6 4 6 4 7 3 3
2 5 5 10 6 9 9 8 11 5 10 10 4
3 7 6 14 8 13 12 11 13 7 12 13 6
4 9 11 17 13 15 14 13 15 10 14 16 8
5 14 15 19 17 17 16 15 16 12 16 18 12
6 17 18 21 21 19 18 16 18 15 18 20 15
7 20 21 22 23 21 20 17 18 17 19 21 18
8 23 23 23 26 22 22 18 19 18 21 23 20
9 25 25 25 28 23 24 19 20 20 22 24 23
10 27 27 26 30 24 25 20 21 21 23 25 24
11 29 28 27 32 25 27 20 21 23 24 26 26
12 30 30 27 33 25 28 21 22 24 26 26 28
13 32 31 28 35 26 30 22 22 25 27 27 29
14 33 33 29 36 27 31 22 23 26 28 28 31
15 35 34 30 37 28 32 23 23 26 29 28 32
16 36 35 30 38 28 34 23 24 27 30 29 33
17 37 36 31 39 29 35 24 24 28 31 30 34
18 38 37 31 40 29 36 24 24 29 32 30 35
19 39 38 32 41 30 37 24 25 29 33 31 36
20 40 39 32 42 30 39 25 25 30 34 31 37
21 41 39 33 43 31 40 25 25 31 35 32 38
22 42 40 33 44 31 41 25 26 31 36 32 39
23 43 41 34 45 31 42 26 26 32 36 32 40
24 44 42 34 45 32 43 26 26 32 37 33 40
25 44 42 35 46 32 44 26 26 33 38 33 41

56
A forecast of individual tree AGB for the species growing in lowland and upland conditions (stratum) is
presented in Tables 12 and 13.
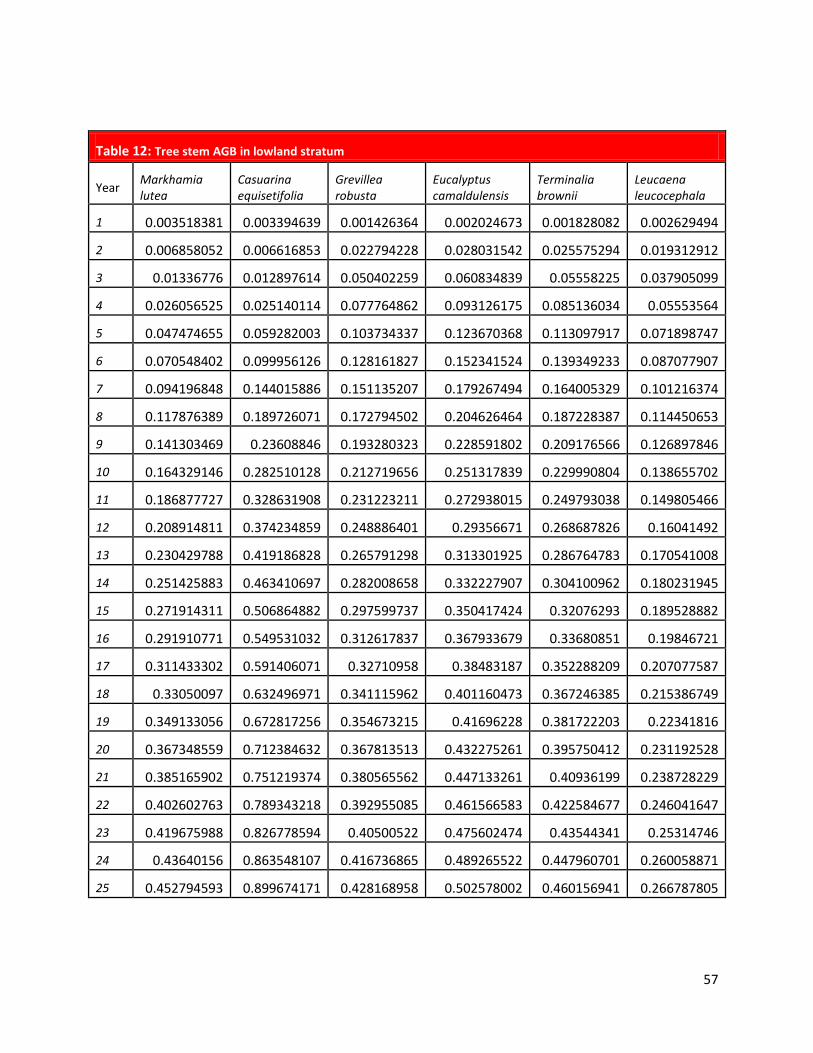
57
Table 12: Tree stem AGB in lowland stratum
Year Markhamia lutea
Casuarina equisetifolia
Grevillea robusta
Eucalyptus camaldulensis
Terminalia brownii
Leucaena leucocephala
1 0.003518381 0.003394639 0.001426364 0.002024673 0.001828082 0.002629494
2 0.006858052 0.006616853 0.022794228 0.028031542 0.025575294 0.019312912
3 0.01336776 0.012897614 0.050402259 0.060834839 0.05558225 0.037905099
4 0.026056525 0.025140114 0.077764862 0.093126175 0.085136034 0.05553564
5 0.047474655 0.059282003 0.103734337 0.123670368 0.113097917 0.071898747
6 0.070548402 0.099956126 0.128161827 0.152341524 0.139349233 0.087077907
7 0.094196848 0.144015886 0.151135207 0.179267494 0.164005329 0.101216374
8 0.117876389 0.189726071 0.172794502 0.204626464 0.187228387 0.114450653
9 0.141303469 0.23608846 0.193280323 0.228591802 0.209176566 0.126897846
10 0.164329146 0.282510128 0.212719656 0.251317839 0.229990804 0.138655702
11 0.186877727 0.328631908 0.231223211 0.272938015 0.249793038 0.149805466
12 0.208914811 0.374234859 0.248886401 0.29356671 0.268687826 0.16041492
13 0.230429788 0.419186828 0.265791298 0.313301925 0.286764783 0.170541008
14 0.251425883 0.463410697 0.282008658 0.332227907 0.304100962 0.180231945
15 0.271914311 0.506864882 0.297599737 0.350417424 0.32076293 0.189528882
16 0.291910771 0.549531032 0.312617837 0.367933679 0.33680851 0.19846721
17 0.311433302 0.591406071 0.32710958 0.38483187 0.352288209 0.207077587
18 0.33050097 0.632496971 0.341115962 0.401160473 0.367246385 0.215386749
19 0.349133056 0.672817256 0.354673215 0.41696228 0.381722203 0.22341816
20 0.367348559 0.712384632 0.367813513 0.432275261 0.395750412 0.231192528
21 0.385165902 0.751219374 0.380565562 0.447133261 0.40936199 0.238728229
22 0.402602763 0.789343218 0.392955085 0.461566583 0.422584677 0.246041647
23 0.419675988 0.826778594 0.40500522 0.475602474 0.43544341 0.25314746
24 0.43640156 0.863548107 0.416736865 0.489265522 0.447960701 0.260058871
25 0.452794593 0.899674171 0.428168958 0.502578002 0.460156941 0.266787805

58
Table 13: Tree stem AGB in highland stratum
Year Markhamia
lutea
Casuarina
equisetifolia
Grevillea
robusta
Eucalyptus
camaldulensis
Terminalia
brownii
Leucaena
leucocephala
1 0.011006645 0.002357497 0.009000927 0.004878269 0.002188384 0.009996738
2 0.026317943 0.004595248 0.024237912 0.009508755 0.004265612 0.033160062
3 0.043824502 0.008957088 0.043266399 0.018534527 0.008314559 0.054221743
4 0.062928726 0.035555011 0.065268434 0.056555411 0.016206794 0.072815154
5 0.083316295 0.071025581 0.089784059 0.103228478 0.042495383 0.089417755
6 0.104788587 0.110680043 0.116508802 0.153546361 0.075046451 0.104439701
7 0.127207023 0.15219022 0.145222441 0.205139621 0.111005398 0.11818537
8 0.15046862 0.194333595 0.175756414 0.256815395 0.14876169 0.1308798
9 0.174493411 0.236439838 0.207976505 0.307950651 0.187370851 0.142692539
10 0.199217253 0.278132409 0.241772678 0.358217514 0.226260562 0.153754158
11 0.22458739 0.319199201 0.277052667 0.407448839 0.265075958 0.164167306
12 0.250559563 0.359523761 0.313737711 0.455568154 0.303594227 0.174014187
13 0.277096035 0.399046877 0.351759589 0.502551286 0.341675316 0.183361702
14 0.304164193 0.437744255 0.391058491 0.548404517 0.379232363 0.192265078
15 0.331735533 0.475613106 0.431581442 0.593151748 0.416213387 0.200770476
16 0.359784901 0.512663891 0.47328111 0.636826796 0.452589612 0.208916905
17 0.388289908 0.548915122 0.516114884 0.679468688 0.488347866 0.216737658
18 0.417230481 0.584390044 0.560044148 0.721118762 0.523485515 0.224261395
19 0.446588511 0.619114492 0.605033703 0.761818881 0.558007046 0.231512983
20 0.476347559 0.653115499 0.651051297 0.801610337 0.591921723 0.23851415
21 0.506492632 0.686420397 0.698067244 0.840533199 0.625241963 0.245284006
22 0.53700999 0.719056227 0.746054102 0.878625933 0.6579822 0.251839451
23 0.567886988 0.751049381 0.794986413 0.915925216 0.690158093 0.258195516
24 0.599111947 0.782425364 0.844840473 0.952465849 0.721785959 0.264365633
25 0.630674038 0.813208676 0.895594146 0.988280757 0.752882379 0.270361857

59
The choice of trees species, tree numbers planted and thinning regime is the same in lowland and
highland locations. The tree species that will be planted according to each one of the planting plans
(technical specifications) is presented in Table 14.
Table 14: Number of trees to plant
Planting plan Markhamia
lutea
Casuarina
equisetifolia
Grevillea
robusta
Eucalyptus
camaldulensis
Terminalia
brownii
Leucaena
leucocephala Total
Dispersed
interplanting
(per hectare)
100 100 100 100 400
Woodlot (per
hectare) 320 320 320 320 320 1600
Boundary
planting(per 400
metres which is
equivalent to
0.125 hectares)
40 40 40 40 40 200
The proposed thinning regime for each one of the planting plans (technical specifications) is shown in
Tables 15, 16 and 17:
Table 15: DIP thinning regime (number of trees remaining per hectare)
Year Markhamia
lutea
Casuarina
equisetifolia
Grevillea
robusta
Eucalyptus
camaldulensis
Terminalia
brownii
Leucaena
leucocephala Total
1 100 0 100 0 100 100 400
2 100 0 100 0 100 100 400
3 100 0 100 0 100 100 400
4 100 0 100 0 100 100 400
5 100 0 100 0 100 100 400

60
6 100 0 100 0 100 50 350
7 100 0 100 0 100 50 350
8 100 0 100 0 100 50 350
9 100 0 50 0 100 50 300
10 100 0 50 0 100 50 300
11 50 0 50 0 50 50 200
12 50 0 50 0 50 50 200
13 50 0 50 0 50 50 200
14 50 0 50 0 50 50 200
15 50 0 50 0 50 50 200
16 50 0 50 0 50 50 200
17 50 0 50 0 50 50 200
18 50 0 50 0 50 50 200
19 50 0 50 0 50 50 200
20 50 0 50 0 50 50 200
21 50 0 50 0 50 50 200
22 50 0 50 0 50 50 200
23 50 0 50 0 50 50 200
24 50 0 50 0 50 50 200
25 50 0 50 0 50 50 200
Table 16: WDL thinning regime (number of trees remaining per hectare)
Year Markhamia
lutea
Casuarina
equisetifolia
Grevillea
robusta
Eucalyptus
camaldulensis
Terminalia
brownii
Leucaena
leucocephala Total
1 320 320 320 320 320 0 1600
2 320 320 320 320 320 0 1600
3 320 320 320 320 320 0 1600
4 320 320 320 320 320 0 1600
5 320 320 320 320 320 0 1600
6 320 320 160 160 320 0 1280

61
7 320 320 160 160 320 0 1280
8 320 320 160 160 320 0 1280
9 320 160 160 160 160 0 960
10 320 160 160 160 160 0 960
11 160 160 160 160 160 0 800
12 160 160 160 160 160 0 800
13 160 80 80 80 160 0 560
14 160 80 80 80 160 0 560
15 160 80 80 80 80 0 480
16 160 80 80 80 80 0 480
17 80 80 80 80 80 0 400
18 80 80 80 80 80 0 400
19 80 80 80 80 80 0 400
20 80 80 80 80 80 0 400
21 80 80 80 80 80 0 400
22 80 80 80 80 80 0 400
23 80 80 80 80 80 0 400
24 80 80 80 80 80 0 400
25 80 80 80 80 80 0 400
Table 17: BND thinning regime (number of trees remaining per 400 m / 0.125 hectare planted)
Year Markhamia
lutea
Casuarina
equisetifolia
Grevillea
robusta
Eucalyptus
camaldulensis
Terminalia
brownii
Leucaena
leucocephala Total
1 40 40 40 0 40 40 200
2 40 40 40 0 40 40 200
3 40 40 40 0 40 40 200
4 40 40 40 0 40 40 200
5 40 40 40 0 40 40 200
6 40 40 40 0 40 20 180
7 40 40 40 0 40 20 180

62
8 40 40 40 0 40 20 180
9 40 20 20 0 40 20 140
10 40 20 20 0 40 20 140
11 20 20 20 0 20 20 100
12 20 20 20 0 20 20 100
13 20 20 20 0 20 20 100
14 20 20 20 0 20 20 100
15 20 20 20 0 20 20 100
16 20 20 20 0 20 20 100
17 20 20 20 0 20 20 100
18 20 20 20 0 20 20 100
19 20 20 20 0 20 20 100
20 20 20 20 0 20 20 100
21 20 20 20 0 20 20 100
22 20 20 20 0 20 20 100
23 20 20 20 0 20 20 100
24 20 20 20 0 20 20 100
25 20 20 20 0 20 20 100
Carbon stocks in above-ground biomass under the project scenario (at time t) are calculated based on
Equation 13.
The value for carbon fraction of dry matter (t C/t.d.m.) is 0.5.
Carbon stocks in below-ground biomass at time t under the project scenario (tC / ha) are calculated
using equation 16.
The value for carbon fraction of dry matter (t C/t.d.m.) is 0.5.

63
Carbon stocks in biomass at time t under the project scenario (t C/ha) are the sum of carbon stocks in
above-ground biomass and below-ground biomass (see equation 12).
Table 18: Carbon stocks in biomass at time t under the project scenario (t C/ha) – lowland stratum
Year DIP (tC/ha) WDL (tC/ha) BND (tC/0.125 ha)
0 0 0 0
1 0.6 2.5 0.3
2 4.8 18.2 2.1
3 10.0 38.6 4.4
4 15.5 61.0 6.9
5 21.2 88.3 10.1
6 24.0 88.8 12.2
7 28.8 111.6 15.3
8 33.5 134.1 18.3
9 32.0 113.1 15.9
10 35.6 128.1 18.0
11 25.7 124.7 14.5
12 27.8 136.7 16.0
13 29.9 100.1 17.4
14 31.9 107.7 18.7
15 33.8 99.5 20.0
16 35.6 105.8 21.3
17 37.4 96.9 22.5
18 39.1 102.1 23.7
19 40.8 107.0 24.9
20 42.5 111.9 26.1
21 44.0 116.7 27.2
22 45.6 121.3 28.3
23 47.1 125.8 29.3
24 48.6 130.2 30.4
25 50.0 134.6 31.4

64
Table 19: Carbon stocks in biomass at time t under the project scenario (t C/ha) – highland stratum
Year DIP (tC/ha) WDL (tC/ha) BND (tC/0.125 ha)
0 0 0 0
1 2.1 6.1 0.9
2 5.7 14.0 2.4
3 9.5 24.7 4.1
4 13.8 47.1 6.5
5 19.2 77.1 9.6
6 21.9 84.0 11.7
7 27.8 111.3 15.1
8 33.8 139.2 18.6
9 33.6 126.5 16.6
10 38.9 147.2 19.2
11 29.2 146.3 15.8
12 32.6 164.6 17.7
13 36.1 122.3 19.6
14 39.5 134.6 21.5
15 43.0 126.7 23.4
16 46.5 137.1 25.2
17 50.0 128.6 27.1
18 53.6 137.6 29.0
19 57.1 146.5 30.8
20 60.7 155.4 32.7
21 64.3 164.2 34.5
22 67.9 173.0 36.4
23 71.5 181.7 38.2
24 75.1 190.4 40.1
25 78.8 199.1 41.9
Baseline carbon stocks are forecast to remain constant at the current (year 0) level throughout the
project crediting period. The carbon stocks for the project scenario at the starting date of the project

65
activity are the same as the baseline stocks (see equation 11). The project removals have been
calculated as the difference between the baseline carbon stocks and the project carbon stocks over the
entire project period.
The results of this calculation (i.e. additional carbon sequestration above baseline) for the three planting
scenarios in both lowland and highland strata (t C/ha) are presented in Tables 21 and 22.
Table 20: Net GHG removals by sinks (t CO2-e/ ha)– lowland stratum
Year DIP (tC02/ha) WDL (tCO2/ha) BND (tCO2/0.125 ha)
0 -15.9 -15.9 -2.0
1 -13.6 -6.6 -0.7
2 1.7 50.7 5.8
3 20.9 125.5 14.1
4 40.9 207.6 23.4
5 61.8 307.8 35.0
6 72.1 309.8 42.9
7 89.8 393.4 54.1
8 106.8 475.9 65.1
9 101.3 398.7 56.4
10 114.7 453.9 63.9
11 78.3 441.2 51.3
12 86.1 485.5 56.5
13 93.7 351.2 61.6
14 100.9 379.0 66.6
15 107.9 348.8 71.4
16 114.7 372.2 76.1
17 121.3 339.5 80.6
18 127.6 358.3 85.0
19 133.8 376.6 89.3
20 139.8 394.4 93.6
21 145.6 411.8 97.7
22 151.3 428.8 101.7
23 156.8 445.4 105.6

66
24 162.2 461.6 109.4
25 167.4 477.5 113.2
Table 21: Net GHG removals by sinks (t CO2-e/ ha)– highland stratum
Year DIP (tC02/ha) WDL (tCO2/ha) BND (tCO2/0.125 ha)
0 -15.9 -15.9 -2.0
1 -8.2 6.3 1.4
2 4.9 35.4 6.9
3 19.1 74.7 13.1
4 34.6 156.8 21.8
5 54.7 266.8 33.2
6 64.6 292.3 40.9
7 85.9 392.1 53.3
8 108.0 494.5 66.1
9 107.3 448.0 58.8
10 126.7 524.0 68.6
11 91.1 520.6 56.0
12 103.6 587.8 62.9
13 116.3 432.7 69.9
14 129.0 477.6 76.7
15 141.8 448.5 83.6
16 154.7 486.6 90.5
17 167.6 455.8 97.4
18 180.6 488.6 104.2
19 193.6 521.3 111.0
20 206.7 553.8 117.8
21 219.8 586.1 124.7
22 233.0 618.3 131.4
23 246.2 650.4 138.2
24 259.5 682.3 145.0
25 272.9 714.1 151.8

67
Capping
The crediting period for each instance of project activity is 25 years although the project longevity is
expected to extend indefinitely beyond the end of the crediting period. All three systems involve
thinning (see Tables 29 - 31) whereas the woodlot and boundary planting systems are also expected to
include harvesting at some point (unspecified) beyond the end of the crediting period. The long term
average GHG benefit is calculated in line with 4.5.3 AFOLU Requirements: VCS Version 3. According to
the AFOLU requirements, section 4.5.3, where harvesting is included the maximum number of GHG
credits available shall not exceed the long term average GHG benefit as shown in Table 22.
Table 22: Long term average GHG benefit (t CO2 / ha)
Rotational harvest Capping
Lowland Highland
Dispersed interplanting (tCO2/ha) None 95 127
Woodlots (tCO2/ha) >25 years 337 419
Boundary planting (tCO2/0.125 ha) >25 years 62 74
Carbon stock changes in the ‘without project scenario’
In the ‘without project’ scenario a continuation of pre-project land uses is expected (as demonstrated in
section G2.2 Additionality). Under a scenario of continuation of pre-project activities further land
degradation is forecast which will deplete further existing carbon stocks in above and below ground
woody biomass. For the sake of conservativeness any future reduction of carbon stocks under a ‘without
project’ scenario has been ignored i.e. the carbon stocks are forecast to remain constant in the future
rather than decreasing – the pre-project carbon store is relatively small and this approach has the net
effect of reducing slightly the forecast of the difference between the baseline and project carbon.
3.3 Leakage

68
Field research conducted in the lower and mid Nyando basin (Camco, September 2011) resulted in a
comprehensive assessment of the potential for leakage to occur as a function of SACC project activities.
Household survey was the principal technique used to evaluate leakage potential and involved
interviewing people in 126 households selected randomly from the 995 households participating in the
SACC project at the time of the survey.
The results of the survey allow a solid conclusion to be drawn - leakage from the SACC project is
insignificant (<10%) and is therefore assumed to be zero (See equation 19 in AR-AMS0001). Refer to
Section CL2.1 of this document for more detailed information about leakage.
Leakage due to conversion of land to cropland
The field survey demonstrated that, other than the Grevillea robusta tree seedlings supplied to farmers
in the project (ranging between 50-100 trees per project participant), there is a wide range of existing
trees that project participants have planted on their farms, either along the boundaries, on woodlots, or
as dispersed interplantings on homesteads and on grazing lands. The most prevalent tree types are
displayed in the table below.
Table 23. Tree species in the study area (Source: Camco field data)
Species Percentage
Eucalyptus species 71%
Grevillea 14%
(Cupressus lusitanica and Pinus patula 4%
Markhamia lutea 4%
Jatropha curcas 3%
Cassia siamea, Croton species, Jacaranda mimosifolia,
Terminalia brownie, Casuarina spp Spathodea campanulata,
Sesbania sesban and fruit trees (mango, orange, and Avocado)
4%
Household surveys demonstrated that the planting of tree species outlined above do not restrict the
continuation of agricultural practices. There has been no displacement of cropping activities to other
areas as a result of AR projects because firstly, the trees under existing AR projects in the lower and mid

69
Nyando were planted along farm boundaries, separate from land used for crops. 93% of project
participants who were surveyed planted trees introduced by AR projects along farm boundaries.
Secondly, project participants planted woodlots on idle land, some of which was degraded and not fit
for cropping activities but was instead suitable for tree planting. The remaining 7% planted trees in
these areas. This means that SACC project interventions would have no effect on cropping activities on
project participant farmland and in fact would utilize land that would otherwise remain idle.
Leakage due to displacement of fuel-wood collection
A high percentage (66%) of the project participants use firewood as the main source of cooking energy,
with 32% using a combination of both charcoal and firewood. A minimal percentage (2%) uses a
combination of firewood, charcoal and Liquefied Petroleum Gas (LPG). Fuel wood is generally obtained
from private farms in the project area, as detailed below, and there is temporal consistency in the
acquisition of fuel wood from these property types.
Table 24. Duration of obtaining firewood from source (Source: Camco field data)
Source Duration
1 - 5 years 5 - 10 years > 10 years
Own farm 19% 8% 73%
Private/neighbouring farms 10% 10% 80%
No fuel wood collection has been displaced from the project area as nothing has changed with regard to
firewood collection; the project participants continue to collect firewood from either their own farms or
private farms.
Leakage due to conversion of land to grazing land
Land owners in the project area keep animals on their land, which require room for grazing. These
animals include Zebu Cattle (Bos primigenius indicus) and small stock such as goats, sheep and poultry24.
A study in 2005 placed the total stock of cattle, sheep and goats in the district at 388,000 animals32. The
average number of animals per household in the project area are detailed below.

70
Table 25. Livestock population currently and in the last 5-10 years (Source: Camco field
data)
Period Cows Goats Sheep Chicken
Average livestock population
over the last 5-10 years 5 10 6 14
Current livestock population 3 2 2 8
Change (%) in average livestock
holding over the previous 10
years
-40% -80% -67% -43%
Animal ownership in the project area is shown to be decreasing from the results of the field survey. No
land outside the AR project area has been converted to grazing land to in order to create space for AR
activities on-farm. Results showed that there were insignificant relocations of livestock to areas outside
the project area. Any relocations that did occur were isolated to existing idle grazing land under control
of the property owner, and that trees were planted on degraded sites deemed unfit for livestock grazing
anyway.
Because no leakage sources have been identified, no mitigation is considered to be necessary. However,
plans have to be put in place to ensure that:
There is adequate fodder for livestock on farm through establishment of fodder crops and
fodder trees. Project participants should be encouraged to do zero grazing as it takes up
smaller sections of land compared to free range system, however, capacity building on
animal husbandry and fodder management is mandatory
There are adequate trees on farm and promotion of alternative sources of cooking energy.
The SACC project should think of supporting farmers in increasing tree cover on-farm,
introducing energy efficient cook stoves, and development of clean cooking energy
sources such as biogas (the average number of livestock kept by these farmers is adequate
and especially if the animals are caged), among others.
There is an improved farming activity such as introduction of integrated farming system
which is efficient and profitable production system that is environmentally responsible,
and includes activities such as Agroforestry.

71
3.4 Summary of GHG Emission Reductions and Removals
Project emissions and leakage are assumed to be zero and are therefore not shown in any subsequent
calculations.
To date 1,344 farmers have implemented AR activities as part of the SACC of which 594 instances have
been validated for conformance with VCS. A summary of the planted areas is shown in Table 26.
Table 26: SACC project planting in 2011 (actual to date)
Location Dispersed interplanting (ha) Woodlots (ha) Boundary planting (ha)
Lower Nyando 0.0 6.6 11.4
Mid Nyando 9.6 3.8 8.0
A summary of the GHG emission reductions and removals forecast as a result of SACC project AR
implementation to date is shown in Table 27.
Table 27: GHG emission reductions and removals forecast as a result of 2011 planting (VCS validated)
Year Cumulative
CO2
Buffer removed
in period
Credits released
from buffer
Remaining
cumulative buffer
Credits for sale
in period
2011 - 627
2012 - 75
2013 1,488
2014 3,428
2015 5,837
2016 8,899
2,759 2,759 6,141
2017 10,317
2018 12,901
2019 15,044
2020 13,771
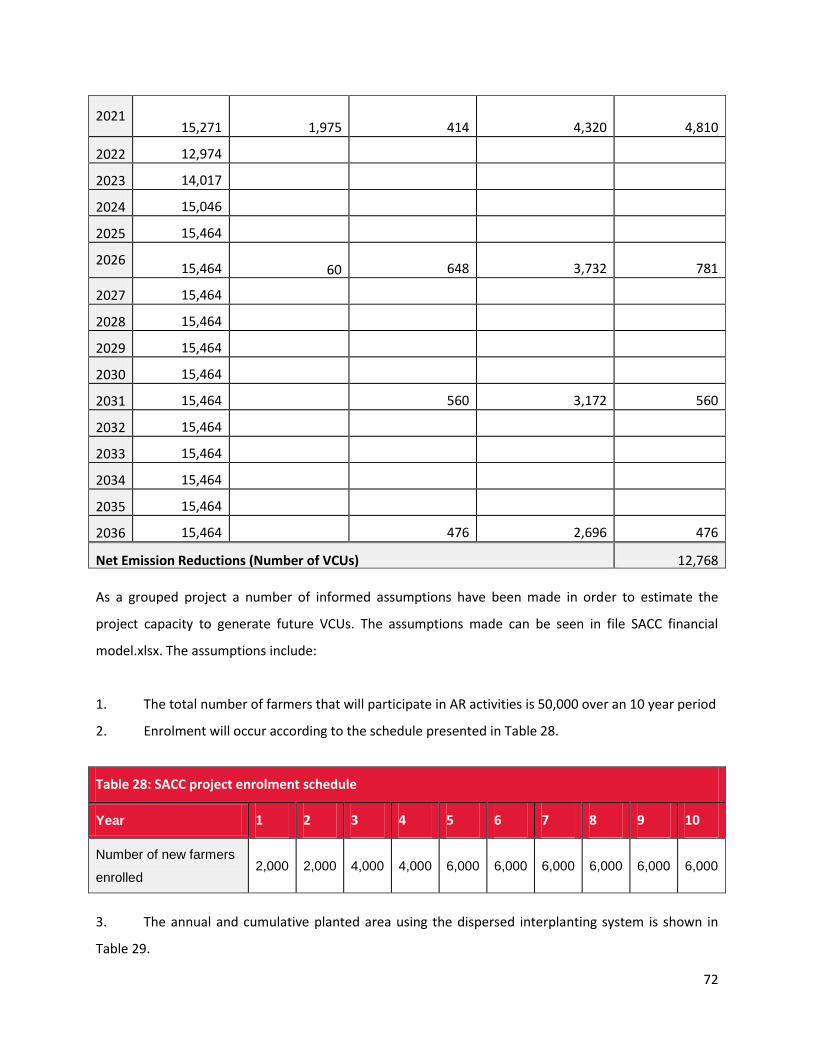
72
2021 15,271
1,975 414 4,320 4,810
2022 12,974
2023 14,017
2024 15,046
2025 15,464
2026 15,464
60 648 3,732 781
2027 15,464
2028 15,464
2029 15,464
2030 15,464
2031 15,464
- 560 3,172 560
2032 15,464
2033 15,464
2034 15,464
2035 15,464
2036 15,464
- 476 2,696 476
Net Emission Reductions (Number of VCUs) 12,768
As a grouped project a number of informed assumptions have been made in order to estimate the
project capacity to generate future VCUs. The assumptions made can be seen in file SACC financial
model.xlsx. The assumptions include:
1. The total number of farmers that will participate in AR activities is 50,000 over an 10 year period
2. Enrolment will occur according to the schedule presented in Table 28.
Table 28: SACC project enrolment schedule
Year 1 2 3 4 5 6 7 8 9 10
Number of new farmers
enrolled 2,000 2,000 4,000 4,000 6,000 6,000 6,000 6,000 6,000 6,000
3. The annual and cumulative planted area using the dispersed interplanting system is shown in
Table 29.
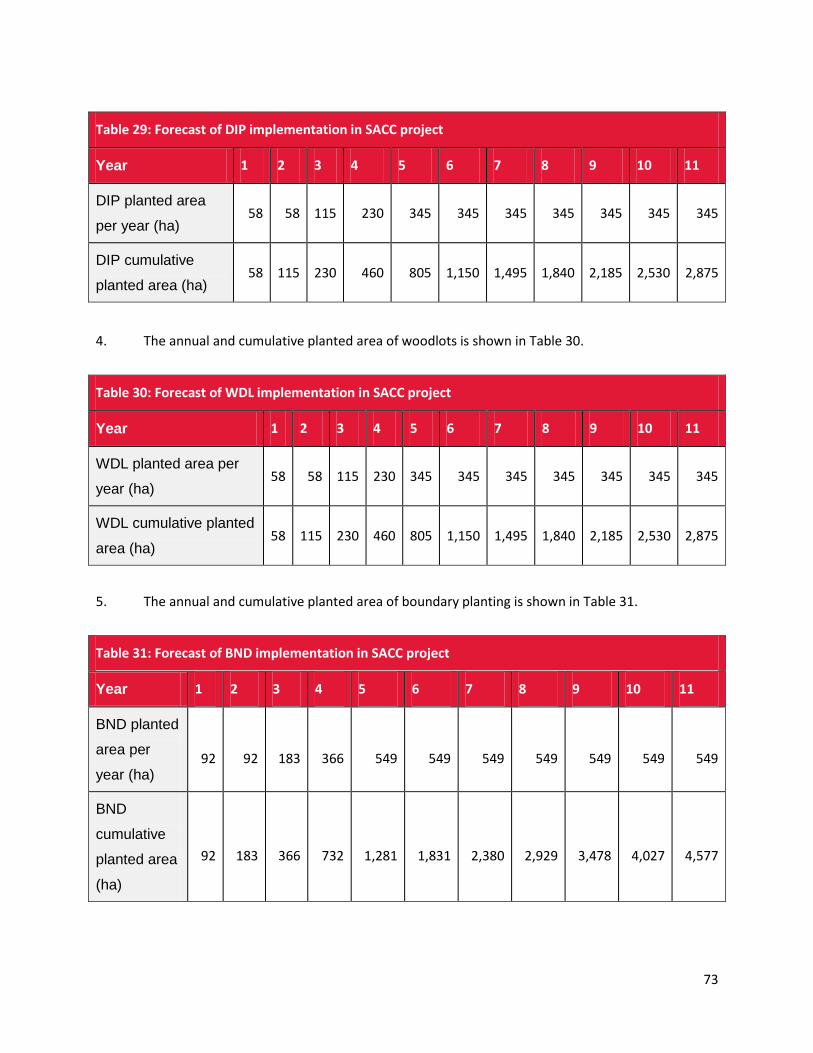
73
Table 29: Forecast of DIP implementation in SACC project
Year 1 2 3 4 5 6 7 8 9 10 11
DIP planted area
per year (ha) 58 58 115 230 345 345 345 345 345 345 345
DIP cumulative
planted area (ha) 58 115 230 460 805 1,150 1,495 1,840 2,185 2,530 2,875
4. The annual and cumulative planted area of woodlots is shown in Table 30.
Table 30: Forecast of WDL implementation in SACC project
Year 1 2 3 4 5 6 7 8 9 10 11
WDL planted area per
year (ha) 58 58 115 230 345 345 345 345 345 345 345
WDL cumulative planted
area (ha) 58 115 230 460 805 1,150 1,495 1,840 2,185 2,530 2,875
5. The annual and cumulative planted area of boundary planting is shown in Table 31.
Table 31: Forecast of BND implementation in SACC project
Year 1 2 3 4 5 6 7 8 9 10 11
BND planted
area per
year (ha)
92
92
183
366
549
549
549
549
549
549
549
BND
cumulative
planted area
(ha)
92
183
366
732
1,281
1,831
2,380
2,929
3,478
4,027
4,577

74
Based on these planting parameters a summary of the potential GHG emission reductions and removals
forecast as a result of SACC group project AR implementation activities between 2012 - 2022 is shown in
Table 32.
Table 32: GHG emission reductions and removals forecast as a result of 2012 - 2022 planting
Year Cumulative
CO2
CO2 gain
pa
Period
gain (tCO2)
Buffer
removed
in period
Credits
released
from
buffer
Remaining
cumulative
buffer
Credits for
sale in
period
2012 -2,558 -2,558
2013 -3,173 -615
2014 -727 2,446
2015 5,621 6,348
2016 25,418 19,797 25,418 7,752 7,752 17,665
2017 78,816 53,398
2018 170,812 91,996
2019 315,323 144,511
2020 510,656 195,334
2021 742,958 232,302 717,541 218,850 1,163 225,439 499,854
2022 1,010,612 267,653
2023 1,314,292 303,680
2024 1,617,967 303,675
2025 1,886,167 268,200
2026 2,111,689 225,522 1,368,730 417,463 33,816 609,086 985,083
2027 2,279,332 167,644
2028 2,389,605 110,272
2029 2,482,045 92,440
2030 2,523,544 41,500
2031 2,530,566 7,021 418,877 127,757 91,363 645,481 382,482
2032 2,555,489 24,924
2033 2,558,712 3,223

75
2034 2,595,021 36,309
2035 2,616,257 21,235
2036 2,622,596 6,340 92,031 28,069 96,822 576,728 160,784
2037 2,622,596 - -
2038 2,570,144 -
-
2039 2,517,692 -
-
2040 2,412,789 -
-
2041 2,202,981 - -
-
86,509 490,219 86,509
2042 1,888,269 -
-
2043 1,573,558 -
-
2044 1,258,846 -
-
2045 944,135 -
-
2046 629,423 -
-
-
73,533 416,686 73,533
Total 2,205,910
The cumulative CO2 is shown to start as negative value because of the baseline carbon stocks which are
conservatively assumed to be removed at the time of implementation of AR activities. The cumulative
CO2 is shown to steadily increase up to year 25 after which it decreases because the crediting period for
each project instance is 25 years after which point we cease to include those carbon stocks in the
accounting process e.g. carbon stocks as a result of planting in 2012 will no longer be included in the
carbon accounting after 2037, carbon stocks as a result of planting in 2013 will no longer be included in
the carbon accounting after 2038 etc.
The baseline scenario in the project area is having detrimental effects on the community of the lower
and mid Nyando, in a number of ways. Evaluation of the baseline effect on communities has been
completed using the CCBA Manual for Social Impact Assessment of Land-based Carbon Projects (2010),
so the project conditions created after the implementation of the SACC project can be compared to the
baseline, or social reference scenario.
G2.4 Effect of Baseline on Communities

76
Using guidance from the manual described above, the baseline is contextualised according to three main
groupings: social, environmental and economic (Table 33). A precise description of the likely baseline
scenario has been developed in close liaison with stakeholders in the local community.
Table 33: Baseline effects on local communities
Social Development
Gender Equity
Access to opportunities and empowerment of girls and women are
unlikely to develop under the baseline scenario. The male will still be
viewed as the head of the household and hence there will be limited
reduction of discrimination and inequalities based on gender.
Access to Education
Access to, engagement in, and attainment through education will
continue as it has done previously. Indeed, the situation may worsen, as
children are taken out of school to cultivate the land, as it suffers from
the increasing effect of environmental degradation.
Access to Health and
Sanitation
Access to medical treatment and improved sanitation, notably through
access to clean water and the availability of sewage treatment will not
improve under the baseline scenario. As agriculture yields so little profit
in the area, there is little money to invest in improving facilities and
infrastructure, so rural communities will remain without adequate
health provisions.
Cultural Identity
Respect for self-determination, intellectual property, benefit-sharing,
and religious tolerance will continue as previously. Tribal clashes may
continue around times of political instability and social conditions may
further deteriorate, inciting people to intolerance and potentially
violence.
Environmental Integrity
Water
Water resources will continue to be put at risk due to the effects of
eutrophication from fertilisers in agricultural run-off. This will
contaminate water used for drinking and may deplete fishing stocks in

77
water bodies in or adjacent to the project area.
Soil Fertility
Maintenance of organic matter and conservation of soil will remain
difficult under the baseline scenario. The removal of trees and increased
erosion from rainfall events will reduce cohesion between soil particles,
hence making them more susceptible to entrainment and removal. This
will ultimately decrease soil fertility in the area.
Climate Change
Mitigation of greenhouse gas emissions and strengthening the resilience
and adaptation capacity of people, their livelihoods, and ecosystems to
climate change are low priorities in the project area. People are
primarily concerned with maintaining fertile land to preserve their
incomes. The link between climate change and increasing environmental
degradation is not well established and hence people do not feel that
they need to take action on the homestead scale to mitigate against this
risk.
Natural Resource
Management
Management of resources from production to post-consumption in
order to support the integrity of ecosystem services is not embedded in
the community mindset. There is need for a structured project to
formalise management of natural resources in the project area, yet
there are not community structures in place to facilitate this.
Economic Resilience
Secure Livelihoods
Currently security of livelihoods in the project area is currently low, as
agricultural yields are subject to variation according to climatic changes.
Increasing land degradation is threatening livelihood security as crop
yields lessen year upon year.
Social Capital
Social capital refers to connections among individuals – in the Nyanza
province social structures are based around local communities and
families, although between communities there is limited formal
communication. This means that problems experienced between
communities are not resolved on a higher level. Indeed, there is tension
between different groups such as the Luo’s and Kalenjin’s across the

78
project area.
Resilience to Economic
Risk
There is limited ability to counter risk through economic diversification
and access to finance. Traditionally, livestock have been kept as a form
of immediately available payment in case of need to access finance. This
relies upon continuation of agricultural land use and hence there is little
economic diversification across the project area.
The above indicators demonstrate that the baseline scenario is not conducive to economic,
environmental or social advancement of the citizens of the Nyando basin. The SACC project area is one
of long term human activity, deforestation and land degradation. The historical trends regarding land
use and land use change in the area indicate that the ‘without project’ scenario will be a continuation of
deforestation and forest degradation of the lands as a result of unsustainable harvesting of forest
products, overgrazing and burning in line with historical trends.The following are characteristic of the
‘without project’ scenario:
No support to social problems and an absence of a framework to address community issues
Community organisations that do exist lack structure and are driven by internal conflict
Poor soil, unproductive farm land and high demand for additional inputs (e.g. fertilisers, pesticides)
which leads to downstream water pollution
Land is degraded and subject to erosive forces; common, non-native species of little conservation
interest predominate
Limited opportunity for economic diversification in the project area
I
Biodiversity in the project area has diminished significantly since widespread deforestation arose in the
1960s. There are no species with a high conservational value. Under the baseline scenario remaining
forest areas would be threatened as people continue to harvest timber for use in domestic activities
such as charcoal making. This would further diminish biodiversity, with the combined influence of
climate change eroding the soils which support naturally occurring plants in the lower and mid Nyando.
G2.5 Effect of Baseline on Biodiversity

79
With the intervention of the SACC project, biodiversity across the area will not markedly increase, due to
the controlled nature of the planting programme. However it is hoped that it will promote conservation
as people realise the value of wooded biomass. Indeed, the trees used in planting schemes may
encourage bats, birds and insects back to the project area, as they provide habitats for these animals.
CARE has many years of experience in environmental programming in Nyanza, Kenya. Over the last
three years CARE has implemented the Agroforestry for Livelihood Enhancement (Aglive) project which
planted 337,241trees with 2,250 farmers in Nyando/Kericho districts. The Sustainable Agriculture in a
Changing Climate project is a sequel to this very successful project and aims to transform the landscape
in Nyanza through carbon financing and other sources of funding that may be leveraged by carbon
financing. Further donor funding will be sought to support the project.
The primary justification for the first phase of the program is learning how carbon finance can be made
to work for smallholder farmers in terms of enhancing farm production and building resilience of
livelihoods, including adaptation to climate change. Within the constraints of financial viability and the
difficulty of monitoring climate impacts from diverse land management systems, the approach that is
being developed by the initiative aims to ensure effective participation of women in particular. Benefits
derived from the project will be shared through a “fair trade approach” alongside other innovative
approaches to counter barriers to the participation of poorer, marginalised groups.
Specific project objectives are:
• Empowering Communities to sustainably use their natural resources, adopt sustainable
agricultural practices and increase land productivity (food security)
• Reducing land degradation, improving soil quality and vegetation
• Equitable sharing of resources within gender and empowering women and youths to be part of
decision making and management structures
G3. Project Design and Goals
G3.1 Major Climate, Community and Biodiversity Goals
80
• Increasing carbon sequestration, conducting research and empowering communities to benefit
from carbon finance
The project has been designed to achieve the four goals by focusing its activities around the following
interventions, which will be rolled out across the lower and mid Nyando under a grouped project
methodology:
1. Agroforestry. This is the use of trees and shrubs in agricultural crop and/or animal production
and land management systems. In the SACC project, trees on farms are used in many forms,
including improved fallows, home gardens, boundary planting, farm woodlots, orchards,
plantation/crop combinations, windbreaks, conservation hedges, and fodder banks. Farmers in
the SACC project are encouraged to adopt some of these practices on their land depending on
the need, size of land and interest. Most of the trees promoted by this project for agroforestry
are meant either to meet the farmer’s energy needs or to improve soil fertility. Currently,
farmers in Nyando use agricultural waste as the main source of energy for cooking which should
be otherwise left on the farm as mulch.
2. Conservation agriculture. Under SACC project guidance Farmers in the lower and mid Nyando
plan to boost agricultural yields and increase food production by adopting conservation
agriculture (CA). This practice also contributes to combating soil erosion and enhancing fertility,
through the implementation of the three conservation agriculture (CA) principles: minimal soil
disturbance, permanent soil cover and crop rotations. The socio-economic and environmental
benefits help poor households to rehabilitate and strengthen their livelihood capital base and
ultimately help SACC farmers to build system resilience in the face of widespread poverty and
increasing vulnerability that affect the basin.
3. Crop diversification. Farmers in the project area have already started to vary the crops that they
grow. New species include butternut and green gram, which provide new sources of income to
the farmers. Crop diversification ensures that farmers are not solely reliant on one species of
crop for income generation and this means that they are more resistant to poverty that may
result if a specific crop fails. This practice will be encouraged across the lower and mid Nayndo

81
as the project commences and will further contribute to strengthening of SACC farmers
livelihood capital base.
By improving the various components of food production systems, the efficiency, resilience, adaptive
capacity and mitigation potential of the overall production systems can be greatly enhanced.
In order to achieve emission reductions three AR interventions, boundary planting, dispersed
interplanting and woodlots, have been designed for implementation (See annex 1). The key elements of
each one of these systems are presented in Table 34.
G3.2 Description of Major Project Activities

Table 34: AFOLU interventions
Intervention Description Tree species Advantages Disadvantages Impact
Boundary
planting
Boundary planting involves the planting of
trees along the perimeter of individual
farmers or communal property with the
objective of obtaining environmental and
livelihood benefits including windbreaks,
soil erosion control, shade/shelter, sale of
poles and other timber products. The
system may involve planting of both
indigenous and exotic tree species.
Grevillea
robusta,
Markhamia
lutea,
casuarina
spp.,
Terminalia
brownii.
-Popular with farmers
-Replicable across multiple
sites
-Allows for inclusion of
famers with smaller land
holding to tree planting
programs and to carbon
finance
-Viability of
deriving carbon
finance from tree
planting system
creating relatively
small carbon sinks
-Challenge of
mapping very
small areas of
boundary planting
-Contributes to carbon sequestration
-Provides source of timber when pruned
Dispersed
interplanting
This system involves the planting of
nitrogen fixing tree species and other
typical agroforestry tree species at a low
stocking density throughout the area of
cultivated land. Crops can continue to be
grown. Nitrogen fixing trees will increase
and extend the expected productivity of
the cultivated land. These species increase
soil nitrogen by actively manufacturing
nitrogen compounds through symbiotic
bacteria located in the roots. Any litter will
act as a green manure (organic fertiliser)
and the tree roots will also help to
preserve the soil structure by retaining
Grevillearobus
ta,
Markhamialut
ea,
Terminaliabro
wnii.
-Dispersed interplanting may
be widely adopted by
individual farmers with small
areas of landholding
-Contribute to enhanced food
production
-Untested system
for many farmers
-Relatively small
carbon uptake
per unit area
planted
-Planted on a more limited scale than the
other interventions and thus contributes
to slightly lower levels of carbon
sequestration
-Provides source of timber when pruned
-Will be planted in closest proximity to
crops and thus will have the greatest
effect on stabilising agricultural soils.

83
moisture and preventing erosion.
Woodlots The system involves planting a variety of
indigenous and naturalised tree species on
fragmented land plots which farmers to
provide multiple benefits such as timber,
firewood, medicine and fodder.
Grevillea
robusta,
Markhamia
lutea,
Terminalia
brownii,
casuarina
spp.,
Eucalyptus
spp.
-Diversify farm production
-Additional revenue stream
-May establish woodlots on
degraded or under-utilised
land where in the long term
this system may help to re-
habilitate degraded lands
-Carbon finance per unit area
relatively high
-Land availability
for farmers with
smaller properties
-Displacement of
other food
producing
activities
-Planted on a large scale relative to other
interventions and thus contributes to
higher levels of carbon sequestration
-Provides source of timber when pruned

The project activities are primarily composed of planting enrichment schemes, using the tree species
outlined in the above table. These species have been chosen because of the livelihood benefits they
bring, with the added benefits of improving soil structure and carbon sequestration. There have been
some problems surrounding the planting of Eucalyptus spp.in the project area, as it requires a lot of
water and high rates of utilisation can result in the lowering of local water tables. However, by ensuring
that this plant is correctly managed and is planted away from areas of crop cultivation, it should not
cause the problems it has previously been associated with. Indeed, combined with the other proposed
species, Eucalyptus spp. should result in the successful deliverance of carbon finance to local
communities.
As stated previously, this is a pro-poor project which places emphasis on sustainable agriculture,
improved livelihoods and the inclusion of women. Other project activities relevant to AR include:
Reduction in livestock numbers. This may be achieved without impacting negatively on
livelihoods by switching from having large numbers of local varieties of goats and cattle to
having smaller numbers of improved (dairy) goats and cattle. Such a switch may yield a higher
income to farmers as well as improving food security.
Switch from goats (browse on trees) to sheep (which will only graze on grass)
Introduction of zero grazing which may be achieved by maintaining ‘women’s’ preferred fodder
tree species on farms such as Gliricidia spp. andLeucaena spp.
Reduced soil erosion through contour planting
Introduction of improved varieties of food crops.
A map identifying the location and boundaries of the project area, where the project activities will occur
and surrounding locations that are predicted to be impacted by the project activities is presented in
Figure 5. The map has been produced using remotely sensed imagery from Landsat 4 and each project
location has a unique GPS identification number attached to it, to ensure that the project can be
monitored after initial implementation.
G3.3 Location of Project Activities

85
The project activities will occur in the areas of seasonal/annual crops mixed with scattered trees/bushes
and under small-scale rice paddies, sugarcane & other crops growing. The areas that are not eligible for
the project activities are all wetland areas, the rice belt, the sugar belt and any land that is classified as
forest at any time point during the historical reference period. The eligible area is 132,629 hectares of
the project area which represents 63.7% of the total project area which is 208,185 ha. The eligible
project areas are shown in light green in Figure 5. During project implementation each participant will
be screened using GIS to ensure that AR activities are only implemented on eligible lands. None of the
surrounding areas are expected to be impacted negatively by the project activities and leakage is not
applicable (refer to section CL2 on offsite climate impacts).
The project start date was September 1st 2010. Given the grouped nature of the project it will extend
over approximately 10 - 12 years before the target 50,000 households have been incorporated into the
AR activities. The initial phase will run over 2 years (see Table 35). After this first phase project validation
will be conducted and the scale of the project will subsequently increase in phases two and three.
Table 35: Project scale to achieve by Year 15
Phase Years Approximate number of households
I 1 and 2 100 – 1,000
II 3 to 5 10,000
III 6 to 10* 50,000
*The project time frame for the third phase of the SACC project may be adjusted, with extension of
number of households to 50,000 before year 10
To date (November 2012) 1,344 households have implemented activities (project instances) under the
SACC AR project.
G3.4 Time Frame and Project Accounting

86
The project will run for an initial accounting period of five years, across which changes in GHG emissions
from the project area will be assessed. After this AR activity responsibilities will be delegated to the
project participants, who will maintain and manage the interventions outlined in project activities on a
local scale. The crediting period for each project instance will be 25 years after project implementation.
The entire project crediting period will last for 35 years however, the project benefits are expected to
continue for at least 50 years, as the trees provide a source of timber for local farmers as they are
seasonally pruned. A crediting period of 25 years is therefore considered to be a conservative approach
to quantify the project GHG benefits.
The VCS Tool for AFOLU Non-permanence Risk Analysis and Buffer Determination VCS Version 3
Procedural Document 4 October 2012, v3.2 has been used as a basis for determining project risk. In line
with this tool, the following steps have been applied to assess likely internal, external and natural risks
associated with the project.
This section has been informed by a number of project studies including Leakage Assessment Report
Final (Camco, 2012) and Making Carbon Finance for Sustainable Agriculture Work for the Poor in
Western Kenya (VIRED, 2010), expert opinion and data collected through focus group discussions and
126 household surveys:
Focus Group Discussions
Participants include Village Council representatives, representatives of retired and aged people, farmer
groups representatives, institutional representatives, and representatives of youth groups. Ensuring a
representative mix of gender is also taken into consideration.
During the FGDs and Key Informant Interviews a checklist of six variables will be used to guide the
discussions. The variables included:
1. General village background information, including demographics, household numbers, ethnicity, etc.
2. Socio-economic services, such as schools, health facilities, water supply, etc.
3. Economic activities
G3.5 Project Risks and Mitigation Measures

87
4. Natural resources availability and use (including forest resources)
5. Dependence on forest resources
6. Forest resources governance structure
Household Surveys
FGDs will be supplemented with household surveys, using a questionnaire administered to village
households. The questionnaire used will include questions covering the following themes:
Household sources of income
Land tenure system - whether households own land and have any legal document to verify land
ownership
Land cover type and size at household level (cropland, forest, grazing area, homestead)
Type and source of cooking energy, monthly consumption, and time periods over which the
households have been getting firewood from a particular source
Notable land use/land cover changes in the last 5-10 years
Possible plans for Afforestation/reforestation of the cut trees
Areas of land converted to cropland, grazing land, and firewood collection points outside project
area to allow project activities
The household survey entailed interviewing household heads/project participants or, in the absence of
the household head, any knowledgeable person within the household, who understand the AR project
A literature search was also useful in providing background and generic information necessary for
population sampling and reporting. Information from literature sources included, among others,
population characteristics, poverty levels, drainage system and soil types, and climatic conditions of the
project area
Internal Risks
Sub-step a) Project Management
Project Management
a)
Species planted (where applicable) associated with more than 25% of the stocks on
which GHG credits have previously been issued are not native or proven to be adapted
to the same or similar agro-ecological zone(s) in which the project is located.
0

88
b) Ongoing enforcement to prevent encroachment by outside actors is required to
protect more than 50% of stocks on which GHG credits have previously been issued. 0
c)
Management team does not include individuals with significant experience in all skills
necessary to successfully undertake all project activities (ie, any area of required
experience is not covered by at least one individual with at least 5 years experience in
the area).
0
d)
Management team does not maintain a presence in the country or is located more
than a day of travel from the project site, considering all parcels or polygons in the
project area.
0
e)
Mitigation: Management team includes individuals with significant experience in
AFOLU project design and implementation, carbon accounting and reporting (eg,
individuals who have successfully managed projects through validation, verification
and issuance of GHG credits) under the VCS Program or other approved GHG programs.
−2
f) Mitigation: Adaptive management plan in place. 0
Total Project Management (PM) [as applicable, (a + b + c + d + e + f)]
Total may be less than zero. -2
Justification: All the tree species selected for planting (see technical specifications) are proven to be well
adapted to the agro-ecological zone. Enforcement to prevent encroachment is not required. The
management team has a country presence and permanent presence within the project area and a track
record of implementing similar projects successfully.
Mitigation: The management team Geoffrey Onyango and Phil Franks, both have significant AFOLU
experience.
Sub-step b) Financial Viability
Financial Viability
a) Project cash flow breakeven point is greater than 10 years from the current risk
assessment 3

89
b) Project cash flow breakeven point is between 7 and up to 10 years from the current risk
assessment 0
c) Project cash flow breakeven point between 4 and up to 7 years from the current risk
assessment 0
d) Project cash flow breakeven point is less than 4 years from the current risk assessment 0
e) Project has secured less than 15% of funding needed to cover the total cash out before
the project reaches breakeven 3
f) Project has secured 15% to less than 40% of funding needed to cover the total cash out
required before the project reaches breakeven 0
g) Project has secured 40% to less than 80% of funding needed to cover the total cash out
required before the project reaches breakeven 0
h) Project has secured 80% or more of funding needed to cover the total cash out before
the project reaches breakeven 0
i) Mitigation: Project has available as callable financial resources at least 50% of total cash
out before project reaches breakeven 0
Total Financial Viability (FV) [as applicable, ((a, b, c or d) + (e, f, g or h) + i)]
Total may not be less than zero. 6
Justification: The project cash flow is forecast to become positive by year 10 (as evidenced by the SACC
financial model.xlsx SCENARIO D), at which point revenue may be derived from the sale of VCUs and
forest products may be harvested. So far the project has secured 15% ($619,000) of the funding
required to cover the total cash out ($3,963,200) before the project reaches breakeven 10 years from
the current risk assessment.
Mitigation: The project has secured start-up funding from the Rockerfeller Foundation. The approval of
further funding is expected soon.
Sub-step c) Opportunity
Opportunity Cost

90
a)
NPV from the most profitable alternative land use activity is expected to be at least 100%
more than that associated with project activities; or where baseline activities are
subsistence-driven, net positive community impacts are not demonstrated
b) NPV from the most profitable alternative land use activity is expected to be between
50% and up to100% more than from project activities
c) NPV from the most profitable alternative land use activity is expected to be between
20% and up to 50% more than from project activities
d)
NPV from the most profitable alternative land use activity is expected to be between
20% more than and up to 20% less than from project activities; or where baseline
activities are subsistence-driven, net positive community impacts are demonstrated
0
e) NPV from project activities is expected to be between 20% and up to 50% more
profitable than the most profitable alternative land use activity
f) NPV from project activities is expected to be at least 50% more profitable than the most
profitable alternative land use activity
g) Mitigation: Project proponent is a non-profit organization -2
h)
Mitigation: Project is protected by legally binding commitment (see Section 2.2.4) to
continue management practices that protect the credited carbon stocks over the length
of the project crediting period
i)
Mitigation: Project is protected by legally binding commitment (see Section 2.2.4) to
continue management practices that protect the credited carbon stocks over at least 100
years
Total Opportunity Cost (OC) [as applicable, (a, b, c, d, e or f) + (g or h)]
Total may not be less than zero. 0
Justification: The project AR systems (woodlots, dispersed interplanting and boundary planting) have all
been designed in consultation with local stakeholders with the objective of making land use activities
more diverse, sustainable and profitable. Assigning an opportunity cost to implementing project
activities of +/- 20% NPV of the most profitable alternative land use scenario is conservative because the

91
NPV of project activites is intended to be significantly higher than the alternative land use scenarios.
Additionally the baseline activities are subsistence driven and the project will deliver positive net
community impacts. Specific factors of positive community impact include:
The adoption of improved farming technology
The adoption of improved livestock management
Increased forest product availability through agroforestry and woodlots
Improved soil fertility and management
New revenue from sale of carbon offsets
Job creation for project development, implementation, administration and MRV
There is a community impact monitoring plan in place which will focus on: (i) Poverty reduced through
locally defined poverty indicators (which may differ by location and change over time) e.g. land
ownership, livestock ownership, ability to afford school fees and (ii) improved food security through
hungry months.
Mitigation: CARE is a non-profit organization. CARE will facilitate the establishment of a community
based structure to assume project ownership.
Sub-step d) Project Longevity
Project Longevity
a) Without legal agreement or requirement to continue the management
practice
= 24 - (project
longevity/5)
b) With legal agreement or requirement to continue the management practice = 30 - (project
longevity/2)
Total 17
Justification: Although the crediting period for each instance of project activity will be 25 years the
project longevity is a minimum of 35 years. The AR implementation will be phased over 10 years i.e. the
final AR instance is scheduled to be implemented in 2021, followed by a 25 year crediting period,
therefore the project longevity will extend to 2046 (as a minimum). The project benefits of each
instance of project activity are expected to continue well beyond the 25 year crediting period for at least
50 years, as the trees provide a source of timber for local farmers as they are seasonally pruned. There is

92
no legal agreement or requirement to continue the management practice. The project longevity risk
score is calculated as 24 – (35/5) = 17
Mitigation: The technical specifications clearly lay out the implementation activities. Participating
farmers must sign contracts that commit them to manage their land in accordance with the technical
specification.
Total
Internal Risk
Total Internal Risk (PM + FV + OC + PL) (-2+4+0+17)
Total may not be less than zero. 21
External Risks
Sub-step a) Land Ownership and Resource Access/Use Rights
Land Ownership and Resource Access/Use Rights
a) Ownership and resource access/use rights are held by same entity(s) 0
b) Ownership and resource access/use rights are held by different entity(s) (eg, land is
government owned and the project proponent holds a lease or concession)
c) In more than 5% of the project area, there exist disputes over land tenure or ownership
d) There exist disputes over access/use rights (or overlapping rights) 5
e)
Mitigation: Project area is protected by legally binding commitment (eg, a conservation
easement or protected area) to continue management practices that protect carbon stocks
over the length of the project crediting period
f)
Mitigation: Where disputes over land tenure, ownership or access/use rights exist,
documented evidence is provided that projects have implemented activities to resolve the
disputes or clarify overlapping claims
-2
Total Land Tenure (LT) [as applicable, ((a or b) + c + d + e+ f)]
Total may not be less than zero. 3

93
Justification: The information relating to land disputes was gathered from chiefs, expert opinion and
PRA (individual farmer meetings and group discussions). Land conflicts are common and these are due
to several factors. The most common land conflict in Lower and Mid Nyando is related to the succession
process. For instance in Kagai and Murrum it was observed that some parents deny their grown up
children / sons’ inheritance or even use of land leading to household land use conflicts and even fights
over land resource. In such cases the youths do resort to renting or even buying their own farm land
from neighbours to minimise conflicts over family land. The assessment revealed that many conflicts are
based on boundary disputes when other people encroach others farmland by attempting to extend their
land through poor ploughing. Breach of sale or lease agreements is also a common phenomenon in all
sites especially on the lower blocks. This was due to change of mind by the sellers/lessors and or their
dependents/sons. Politically motivated land clashes have been rampant mainly in the middle blocks
where the settlers (Luos & other non Kalenjin tribes) have been attacked by the neighbouring Kalenjins
especially during electioneering periods. The number land disputes was deduced from the information
gathered from these various sources to effect less than 5% of properties in the project area. In most
cases land ownership and resource access / use rights are held by the same entity. The only disputes
experienced to date by the project have been a very small number of minor diasagreements over
property boundaries which involve less than 5% of the project area.
Mitigation: The area has several formal and informal means of resolving land and resource use conflict.
For instance where parents have denied their sons access to land some have resorted to either renting
or buying land away from family land to avoid continued family feuds. Other methods noted include
intervention by village elders, local administration (Chief and Assistant-chief) and government land
adjudication office. Peace initiatives held between local politicians and elders have been used to resolve
politically motivated inter-community land conflicts especially within the boundaries between the Luos
and the Kalenjin tribes.
The project is adopting a community based conflict resolution mechanism and through awareness
creation on the need for unity and togetherness will improve inter-household relationships and
encourage pooling of resources. This will benefit both men and women. However, the project does
place strong emphasis upon the inclusion of women and the resource poor within the community.
Women and youths have numerous groups and group activities.

94
The project will also support joint tribal ventures and peace-building initiatives to reduce tensions during
elections. The joint tribal ventures and peace-building initiative will ensure security of produce and
activities for all groups and especially women and the poor. This will particularly benefit women and the
poor who may not have extra resources to put into recovery of lost/ damaged produce and assets. Such
activity includes organizing a joint field day within the project areas where the communities will share
experiences.
CARE has supported the development of a mechanism to resolve dispute through the Village
Management Committee. The key areas where project management expect conflicts to arise include
disputes over land/tree ownerships, livestock/trees conflict, style of project governance by VMCs or
possibly issues arising between community and the Technical staff. The project has initiated the
development of community based governance institutions from the village level (Village management
committees), sub-location level management (SLMC) and up to the project management unit level
(PMU). These institutions have developed a workable conflict resolution mechanism at their level. There
exists a conflict resolution subcommittee within each management institutions to handle any arising
issues. In the event that the VMC may not resolve an issue, they may seek the assistance of the SLMC
and the SLMC may further consult on conflicts that they may not be able to handle with the Project
Management Unit. Any further issues that may not be adequately handle at the project level will be
referred to the government officers who will act as arbitrators.
There is a local but formal approach driven by the Provincial administration in the locations, sub
locations and villages in case of more serious disputes. The chiefs, assistant chiefs and the village elders
will be involved. Others who may be engaged are government staff from the ministries of agriculture in
case of conflicts related to crops & livestock, forestry and mineral resources in relation to trees, Lands in
case of land related conflicts and social services in case of community groups conflicts on management.
The Kenya judicial system is available as a last point of reference through the ministry of justice and
constitution affairs. For government staff, the officers who work within the areas of operation are the
most relevant in this process.
Sub-step b) Community Engagement

95
Community Engagement
a) Less than 50 percent of households living within the project area who are reliant on the
project area, have been consulted
b) Less than 20 percent of households living within 20 km of the project boundary outside
the project area, and who are reliant on the project area, have been consulted 5
c) Mitigation: The project generates net positive impacts on the social and economic well-
being of the local communities who derive livelihoods from the project area -5
Total Community Engagement (CE) [where applicable, (a+b+c)]
Total may be zero 0
Justification: CARE has 7 permanent field staff located in the project area who are continuously involved
in community engagement activities. The community engagement has focused on the project area
working through area chiefs and village technicians. 100% of the current project participants (i.e. 995
households) have been engaged. Of the remaining population in the project area (i.e. the target
population for future project roll-out in the next ten years) a minimum of 50% have already been
engaged. Records of community engagement are maintained by the CARE field staff based in Kisumu.
The project field staff have not been able to reach out to communities beyond the project boundary so
extensively so the purpose of this risk assessment it has been rated as less than 20%.
Mitigation: CARE International has over twenty years of close working relationship with the
communities in the Project Zone. The Aglive project began in 2008 which has now become known as the
SACC project. Prior to project initiation CARE sought the permission of the local community and local
authorities to undertake the project activities. Even though CARE is an NGO operating on humanitarian
activities, they were told in those first meetings by the local administration that they did not need their
permission because CARE are highly welcome given their track record. CARE has made every effort to
seek administrative permission and that of the immediate communities, at every step of the project
development. CARE know very well how critical it is to have local community support for any
afforestation activity or development project, and therefore want to continue be a trusted partner
within the community.

96
The idea for a SACC project in the Nyando Basin area only became possible in late 2009 when the idea of
agroforestry in Nyando basin was seen to be successful under a CARE Kenya project called Aglive. This
project promoted agroforestry trees with climate change resilience crops. CARE policy is not to
introduce new ideas to the community until they are sure that they can implement them. Managing
expectations in impoverished communities is critically important to achieving good long term relations.
Therefore CARE waited until they had identified a donor to finance Phase I of the SACC project prior to
introducing the idea to the community.
That funding arrived in late September 2010, and CARE was then under significant time pressure to
develop PDs for VCS and CCB, as they had a finite financial resource from the donor and had to
complete the AFOLU project before the funds were spent, so CARE commenced documenting the Forest
Carbon Inventory in January 2011. The stakeholders were identified and a meeting was held to inform
them of the new carbon project, the meaning of the carbon market and what it would mean to Nyando
basin community.
CARE has since held a number of training sessions within the community to inform the local community
of what benefits they can achieve through the agriculture and carbon markets and other sources of
carbon finance. The communities were informed that carbon funds, if and when available, will be there
to support the project activities and to make it sustainable. This has been done to avoid raising
unnecessary expectation.
The project has held meetings with the community for purposes of discussions and engagement on the
project objectives, design, specifications and also for definition of roles and responsibility among the
stakeholders. Several training sessions have been carried on climate change, agroforestry technologies,
and land management technologies and on leadership and management for the community based
institutions.
There has always been an open door policy at CARE International and members of the community
interested in learning more, or with questions, suggestions and/or grievances can come to see CARE at
any time. They have incorporated the community’s ideas in the project development. A number of

97
consultative meetings with the community have been held in the past to discuss issues to do with tree
species choice, types of planting system, crops types and involvement.
Furthermore, given the speed at which this project has been initiated, and given the general lack of
education in the community about carbon projects, Care will commit to holding regular meetings within
the community and soliciting feedback against the specific objectives of the Project Activities as well as
general feedback. Care will record attendance at these meetings, document suggestions made, and
resolution of whether or not any amendments to the Project Implementation Plan were made. The
results of these meetings will form part of the project documents under the management of the project
officer in Kisumu office.
The SACC project has also involved all the stakeholders within the project area including the government
which is involved in supporting extension services and goodwill, VIRED International which supports the
research work on social economic and environmental impact assessment, VI- Agroforestry who have
been involved in a similar project for a while, the WRUA (Water resource users association) and Farmers
associations. The farmer’s association, community forest association, provincial administration and the
WRUAs were the entry point of the project into the areas and have been reorganized into some sort of
an organization to take the project over after CARE phases out. A number of workshops and training
sessions have been organised to build capacity of stakeholders on the project goals and design as well as
on climate change related issues.
The project will continue holding meetings for continued engagement and sharing with the
communities;
Quarterly planning review meetings (once in three months)
Annual planning and review meetings (once every year)
Project community entry engagements in new areas (main meeting during entry in new areas)
Baseline information and monitoring feedback sessions (once after conducting baseline survey
and after annual monitoring sessions)
Technology transfer sessions/meetings (continuous depending on the needs)
Leadership and management meetings (continuous depending on the needs)
Sub-step c) Political Risk

98
Political Risk
a) Governance score of less than -0.79
b) Governance score of -0.79 to less than -0.32 4
c) Governance score of -0.32 to less than 0.19
d) Governance score of 0.19 to less than 0.82
e) Governance score of 0.82 or higher
f) Mitigation: Country is implementing REDD+ Readiness or other activities, as set out in this
Section 2.3.3. -2
Total Political (PC) [as applicable ((a, b, c, d or e) + f)]
Total may not be less than zero. 2
Justification: Governance scores were determined from the The World Bank Institute Worldwide
Governance Indicators which are available at: http://info.worldbank.org/governance/wgi/index.asp
Worldwide governance indicators 2007 2008 2009 2010 2011
Voice and accountability -0.22 -0.27 -0.32 -0.21 -0.23
Political stability and absence of violence -1.27 -1.38 -1.44 -1.19 -1.31
Government effectiveness -0.48 -0.56 -0.58 -0.53 -0.54
Regulatory quality -0.24 -0.22 -0.15 -0.09 -0.16
Rule of law -0.97 -1.02 -1.07 -1.01 -1.01
Control of corruption -0.91 -1.02 -1.07 -0.93 -0.92
-0.71Average
Mitigation: The R-PP was assessed by the FCPF PC at PC6. In Kenya $1.8 million has been set aside for
priority REDD Readiness activities
Total
External Risk
Total External Risk (LT + CE + PC)
Total may not be less than zero. 5
Natural Risks

99
Likelihood and
Natural Risks
Significance Likelihood
Less than
every 10
years
Every 10 to
less than 25
years
Every 25 to
less than 50
years
Every 50
to less
than
100
years
Once every 100
years or more, or
risk is not
applicable to the
project area
Catastrophic (70% or more
loss of carbon stocks) FAIL 30 20 5 0
Devastating (50% to less
than 70% loss of carbon
stocks)
30 20 5 2 0
Major (25% to less than
50% loss of carbon stocks) 20 5 2 1 0
Minor (5% to less than 25%
loss of carbon stocks) 5 2 1 1 0
Insignificant (less than 5%
loss of carbon stocks) or
transient (full recovery of
lost carbon stocks expected
within 10 years of any
event)
2 1 1 0 0
No Loss 0 0 0 0 0
LS Score
Significance Likelihood LS score

100
Fire (F) Minor Every 10 to less
than 25 years 2
Pest and Disease Outbreaks
(PD) Insignificant
Every 10 to less
than 25 years 1
Extreme Weather (W) Major Every 10 to less
than 25 years 5
Geological Risk (G) Insignificant
Once every 100
years or more, or
risk is not
applicable to the
project area
0
Other natural risk (ON) N/A
Mitigation
Prevention measures applicable to the risk factor are implemented 0.50
Project proponent has proven history of effectively containing natural risk 0.50
Both of the above 0.25
None of the above 1
Score for each natural risk applicable to the project (determined by (LS × M)
LS M Score
Fire (F) 2
Prevention
measures
applicable to the
risk factor are
implemented
1
Pest and Disease Outbreaks (PD) 1 None of the above 1

101
Justification: The most significant natural risks are from fire and extreme weather events which are
caused by both flooding and drought. The significance of such events is major (i.e. will result in the loss
of 25% to 50% of carbon stocks) with a likelihood of occurring every 10 to 25 years. There are no risks
from pest and diseases outbreaks or from geological risks. Drought poses the most significant risk to AR
activities during first 2 -3 years of establishment.
Mitigation: The fire risk is mitigated by preventing on farm burning. The risk of drought is mitigated by
selecting drought tolerant tree species for planting, timing of planting to coincide with heavy rains,
rainwater harvesting for irrigation and adopting good tree planting techniques to avoid tree seedlings
drying out. CARE has a long and successful track record in mitigating these risks to agroforestry tree
planting in the Nyando area.
Overall Risk
Risk Category Rating
a) Internal Risk 19
b) External Risk 7
c) Natural Risk 4.5
Overall risk rating (a + b + c) 30.5
Extreme Weather (W) 5
Prevention
measures
applicable to the
risk factor are
implemented
2.5
Geological Risk (G) 0 0
Other natural risk (ON) 0 0
Total Natural Risk (as applicable, F + PD + W + G + ON) 4.5

102
Where the overall risk rating is greater than 60, project risk is deemed unacceptably high and the project
fails the entire risk analysis. The estimated risk for this project is 30.5 and hence is deemed acceptable
when determined in line with the VCS procedure. The sum of risk ratings for each risk category is less
than the thresholds designated in the risk tool.
The risk rating can be used to determine the buffer credits that shall be deposited in the AFOLU pooled
buffer account. The overall risk rating is converted into a percentage, which is then multiplied by the net
change in the project’s carbon stocks. This is totalled at 30.5%.
Section G1.8, presents an evaluation of HCVs in the project area. Following the High Conservation Value
Resource Network’s toolkit - Identifying and Managing High Conservation Value Forests: A Guide for
Forest Managers - and referencing the World Database on Protected Areas, no HCVs are present in the
project area. This judgment is consistent with expert opinion.
Despite the absence of HCVs in the project area, the following activities designed to enhance
biodiversity will be employed:
1. Promoting bird and insect species through reforestation
Currently land degradation and deforestation in the lower and mid Nyando has resulted in a decrease in
floral and faunal biodiversity (Section G1.8). The replenishment of tree species, including the naturally
occurring Terminalia spp, within the project area will encourage bird and insect species (pollinators)
back into the lower and mid Nyando, resulting in enrichment of biodiversity on a project-wide scale.
2. Conservation of soil
The project activities will result in the sequestration of carbon through planting schemes, which is
quantified in the carbon stock estimation procedure. However the planting schemes will also result in
additional, unquantified carbon sequestration in the project area through the effect of increased soil
stability. The conservation of soil from the degrading effects of erosion will enhance the soil organic
G3.6 Maintenance of High Conservation Values

103
carbon (SOC) stores in the lower and mid Nyando. SOC is a globally important store of carbon that is
currently threatened due to the increasing effect of soil erosion.
3.Protection of downstream ecosystems from eutrophication
Conservation of soil will reduce the volume of particle bound fertilizers that are exported to
downstream aquatic ecosystems including Lake Victoria. This will subsequently reduce the effect of
eutrophication in the lacustrine environment, which has in recent years had a detrimental impact on
local fisherman, as fish stocks have been depleted. The preservation of such ecosystems will ensure that
there is diversity in employment activities in the project area, hence reducing the pressure placed on
land by grazing animals and plant cultivation.
Residents in the lower and mid Nyando will be the beneficiaries of 25% of the carbon payments made
through the sequestration of carbon, which will provide a small bonus to the farmers involved in the
project. However, the major financial benefit will arise from the extra income generated from selling
the forest products. The use of this SACC project associated carbon finance will allow for the
improvement of local amenities. The sustainable nature of the SACC project ensures that the CCB
benefits will continue into the future, as the benefits are directly related to the continued presence of
trees on small scale farm holdings.
Specifically measures will be taken to maintain and improve:
Climate – through carbon sequestration by AR activities. This will lead to reduced CO₂ emissions
from the project area and the proposed SACC project activities will have a positive net impact on global
climate through increased vegetative uptake of carbon from the atmosphere. Currently the atmospheric
carbon pool is increasing non-linearly due to anthropogenic forcing and hence the climate implications
of this project are beneficial on a long-term, global scale. Trees will be routinely pruned and thinned, but
not harvested until after the end of the project crediting period. This means their climate benefits will
extend over at least a medium term time horizon. After the crediting period trees in woodlots and
G3.7 Measures to Enhance CCB Benefits beyond Project Lifetime

104
boundary areas will be harvested on a rotational basis, and those used for dispersed interplanting will
be thinned selectively.
Community – through carbon finance and improved local amenities. The carbon crediting
scheme associated with the project will continue for 25 years after the project implementation. Bonus
payments arising from carbon payments will provide a small supplement to local incomes. However the
main benefit will result from the provision of a sustainable source of timber for local communities and
the conservation of soil in the project area so it can be used for crop cultivation in a sustainable way.
Extra income generated from harvesting of forest products will allow investment in local amenities for
the benefit of all community members in the lower and mid Nyando that will extend beyond the project
lifetime.
Biodiversity – through planting schemes. These will encourage birds and bats back into the
lower and mid Nyando, which may have been forced to migrate out of the area during previous
deforestation events (of the 1960s/1970s). The replenishment of vegetation in the area may also lead to
the introduction of animal species and hence the SACC project will have a positive net effect on
biodiversity that will continue after the outlined project lifetime, as long as the planting schemes remain
sustainable.
CARE International has over twenty years of close working relationship with the communities in the
Project Zone. The Aglive project began in 2008 which has now become known as the SACC project. Prior
to project initiation CARE sought the permission of the local community and local authorities to
undertake the project activities. Even though CARE is an NGO operating on humanitarian activities, they
were told in those first meetings by the local administration that they did not need their permission
because CARE are highly welcome given their track record. CARE has made every effort to seek
administrative permission and that of the immediate communities, at every step of the project
development. CARE know very well how critical it is to have local community support for any
afforestation activity or development project, and therefore want to continue be a trusted partner
within the community.
G3.8 Stakeholder Involvement

105
The idea for a SACC project in the Nyando Basin area only became possible in late 2009 when the idea of
agroforestry in Nyando basin was seen to be successful under a CARE Kenya project called Aglive. This
project promoted agroforestry trees with climate change resilience crops. CARE policy is not to
introduce new ideas to the community until they are sure that they can implement them. Managing
expectations in impoverished communities is critically important to achieving good long term relations.
Therefore CARE waited until they had identified a donor to finance Phase I of the SACC project prior to
introducing the idea to the community.
That funding arrived in late September 2010, and CARE was then under significant time pressure to
develop PDs for VCS and CCB, as they had a finite financial resource from the donor and had to
complete the AFOLU project before the funds were spent, so CARE commenced documenting the Forest
Carbon Inventory in January 2011. The stakeholders were identified and a meeting was held to inform
them of the new carbon project, the meaning of the carbon market and what it would mean to Nyando
basin community.
CARE has since held a number of training sessions within the community to inform the local community
of what benefits they can achieve through the agriculture and carbon markets and other sources of
carbon finance. The communities were informed that carbon funds, if and when available, will be there
to support the project activities and to make it sustainable. This has been done to avoid raising
unnecessary expectation.
The project has held meetings with the community for purposes of discussions and engagement on the
project objectives, design, specifications and also for definition of roles and responsibility among the
stakeholders. Several training sessions have been carried on climate change, agroforestry technologies,
and land management technologies and on leadership and management for the community based
institutions.
There has always been an open door policy at CARE International and members of the community
interested in learning more, or with questions, suggestions and/or grievances can come to see CARE at
any time. They have incorporated the community’s ideas in the project development. A number of

106
consultative meetings with the community have been held in the past to discuss issues to do with tree
species choice, types of planting system, crops types and involvement.
Furthermore, given the speed at which this project has been initiated, and given the general lack of
education in the community about carbon projects, Care will commit to holding regular meetings within
the community and soliciting feedback against the specific objectives of the Project Activities as well as
general feedback. Care will record attendance at these meetings, document suggestions made, and
resolution of whether or not any amendments to the Project Implementation Plan were made. The
results of these meetings will form part of the project documents under the management of the project
officer in Kisumu office.
The SACC project has also involved all the stakeholders within the project area including the government
which is involved in supporting extension services and goodwill, VIRED International which supports the
research work on social economic and environmental impact assessment, VI- Agroforestry who have
been involved in a similar project for a while, the WRUA (Water Resource Users Association) and
farmers associations. The farmer’s association, community forest association, provincial administration
and the WRUAs were the entry point of the project into the areas and have been reorganized into some
sort of an organization to take the project over after CARE phases out. A number of workshops and
training sessions have been organised to build capacity of stakeholders on the project goals and design
as well as on climate change related issues.
The project will continue holding meetings for continued engagement and sharing with the
communities;
Quarterly planning review meetings (once in three months)
Annual planning and review meetings (once every year)
Project community entry engagements in new areas (main meeting during entry in new areas)
Baseline information and monitoring feedback sessions (once after conducting baseline survey
and after annual monitoring sessions)
Technology transfer sessions/meetings (continuous depending on the needs)
Leadership and management meetings (continuous depending on the needs)

107
Whilst this project is undergoing validation the PDD and all supporting documents will be made available
for public comment for a minimum period of one month on the CCBA website (http://www.climate-
standards.org).Hard copies of all project documentation will be available from Camco‘s offices in Bath
(UK) and Nairobi (Kenya).
Six meetings were held with communities in both lower and mid Nyando. Each region had three
meetings with representatives from rural water associations, farmers and government officials within
those areas. Word was sent announcing the date and place of stakeholders meeting to the chiefs and
their subchiefs who passed the same in their weekly meetings otherwise called “barasa” to the
community. All stakeholders and farmers were welcomed into meeting. The sites were under trees
where community hold their meetings whenever issues arise. CARE liase with both provincial
administration and through the community CBOs to mobilize stakeholders for the meeting. The
meetings were chaired by Care project officer and the community sub-location management committee
chairpersons. The minutes were taken by both Care field staff and the community secretary.
Community comments
The general comments of the communities were that they are very happy with project. They are happy
with the progress of trying to empower them in setting up a governance structure and self ownership.
The project has begun to change the landscape in the form of increased food production and
introduction of a culture of tree planting and valuing of trees. They want more support in raising
seedlings which has been the main drawback for tree planting within the region. They also want more
support in the acquisition of more adaptive and quality seeds. They will still need support in controlling
free grazing and setting up of water points to support the project activities.
The area has several formal and informal means of resolving land and resource use conflict. For instance
where parents have denied their sons access to land some have resorted to either renting or buying land
away from family land to avoid continued family feuds. Other methods noted include intervention by
G3.9 Publicisation of CCBA Public Comment Period
G3.10 Conflict Resolution Process

108
village elders, local administration (Chief and Assistant-chief) and government land adjudication office.
Peace initiatives held between local politicians and elders have been used to resolve politically
motivated inter-community land conflicts especially within the boundaries between the Luos and the
Kalenjin tribes.
The project is adopting a community based conflict resolution mechanism and through awareness
creation on the need for unity and togetherness will improve inter-household relationships and
encourage pooling of resources. This will benefit both men and women. However, the project does
place strong emphasis upon the inclusion of women and the resource poor within the community.
Women and youths have numerous groups and group activities.
The project will also support joint tribal ventures and peace-building initiatives to reduce tensions during
elections. The joint tribal ventures and peace-building initiative will ensure security of produce and
activities for all groups and especially women and the poor. This will particularly benefit women and the
poor who may not have extra resources to put into recovery of lost/ damaged produce and assets. Such
activity includes organizing a joint field day within the project areas where the communities will share
experiences.
The key areas where project management expect conflicts to arise include disputes over land/tree
ownerships, livestock/trees conflict, style of project governance by VMCs or possibly issues arising
between community and the Technical staff. The project has initiated the development of community
based governance institutions from the village level (Village management committees), sub-location
level management (SLMC) and up to the project management unit level (PMU). These institutions have
developed a workable conflict resolution mechanism at their level. There exists a conflict resolution
subcommittee within each management institutions to handle any arising issues. In the event that the
VMC may not resolve an issue, they may seek the assistance of the SLMC and the SLMC may further
consult on conflicts that they may not be able to handle with the Project Management Unit. Any further
issues that may not be adequately handle at the project level will be referred to the government officers
who will act as arbitrators.
There is a local but formal approach driven by the Provincial administration in the locations, sub
locations and villages in case of more serious disputes. The chiefs, assistant chiefs and the village elders
will be involved. Others who may be engaged are government staff from the ministries of agriculture in
case of conflicts related to crops & livestock, forestry and mineral resources in relation to trees, Lands in
109
case of land related conflicts and social services in case of community groups conflicts on management.
The Kenya judicial system is available as a last point of reference through the ministry of justice and
constitution affairs. For government staff, the officers who work within the areas of operation are the
most relevant in this process.
The conflict resolution mechanisms include intervention by village elders, local administration (Chief and
Assistant-chief) and government land adjudication office. It was also reported that some land cases are
taken through the legal processes in law courts. Peace initiatives held between local politicians and
elders have been used to resolve politically motivated inter-community land conflicts. These methods
will be used in conflict resolutions together with the now formed village management committees
(VMCs). The village management committees will be the first stage for conflicts involving members.
Where they are unable to resolve an issue, they will invite elders and then chiefs to support them. As a
last resort court of law people may turn to the court of law. The grievances should be sorted out as soon
as they occur, in the first week.
The project currently relies on donor funding for the initial 2 year phase of the project. The project is
currently involved in fundraising to support the next phase but will rely on carbon sales for future
funding. CARE will always be available to support where necessary and currently responsible for the
project until it hands over the project to the community organization.
This is a project that has been running for almost one and half years, at significant cost to the CARE
International donor, and full financials are available (both retrospective financial reports and forecasts
that include the carbon revenues). This information is commercially sensitive and will be shared with the
Validator at the site visit. All project initial costs associated with project design document have already
been met by CARE International donor.
In principle the financing plan is as follows:
G3.11 Project Financial Support

110
- January 2013 - December 2014: donor funding through the CARE climate-smart small-holder
agriculture program.
- January 2015 - December 2018: 50% donor funding, 50% revenue from sale of carbon credits
- January 2019 onwards: 100% funded from sale of carbon credits
Details of the project finance can be seen in the CARE developed project financial analysis tool (SACC
financial model.xlsx).

111
The project has been working with community farmers association which has been used as an entry
point to the community by the project and as a vehicle for farmer mobilization. The other private firms
that will be involved include Equity Bank, which is hoped to finance seedling production through offering
short-term soft loans for farmers who are interested in home based tree nurseries.
Homa Line limited, an organization based in mid- Nyando, is working on fuelwood plantation activity
and has been involved to some extent in supporting the outgrower fuelwood plantations programme
within this region with the understanding of supplying forest products. The project is in discussion to
involve them to support farmers with seedling production and seed procurement. They can support
farmers in this aspect as part of their corporate social responsibility.
The project is using the water resources users association and water resource management authority as
part of the entry point into the region and uses their goodwill with the community to facilitate the
training and awareness raising. The two, together with Kenya farm producer association (KENFAT) and
community forest association, are being pulled together to form one umbrella organization to manage
the project after CARE phases out.
The SACC project has CCAF and ICRAF as part of the technical team, supporting the project with research
related activities. CARE International and the community organization are the main project proponent.
Specific responsibility within SACC lies with Maina Njoroge of CARE Kenya. In addition CARE Kenya
depends on the support of PECCN and an outside consulting company, Camco, to assist in the detailed
preparation of the carbon accounting and of this project design document.
Details of the main project proponent and contributing organisations are supplied below:
G4. Management Capacity and Best Practices
G4.1 Project Proponent Identification

112
CARE
Function
CARE is the implementing partner-it roles include farmer mobilization ,
implementation of field activities, management of community structures and
monitoring of the project
Organisational
Capacity Private , non –profit organization( NGO)
Number of
Employees 530
Core Business Poverty alleviation and provision of relief in emergencies.
Relevant
Experience
CARE Kenya has many years working experience with farming communities in
Kenya, and particular in western Kenya where it has been involved in agroforestry
and market led agriculture. CARE Kenya has just concluded a successful Payment
for Environmental Services project.
Date of
Registration 1968
Contact Person Gary Mcgurk
Job Title Assistant Country Director Programs
Email [email protected]
Telephone Number +254-20-2710069/2712374
Address
CARE international in Kenya,
Mucai Drive , Off Ngong Rd.
P.O. Box 43864-00200 GPO
Nairobi ,Kenya
Website www.care.or.ke
ICRAF
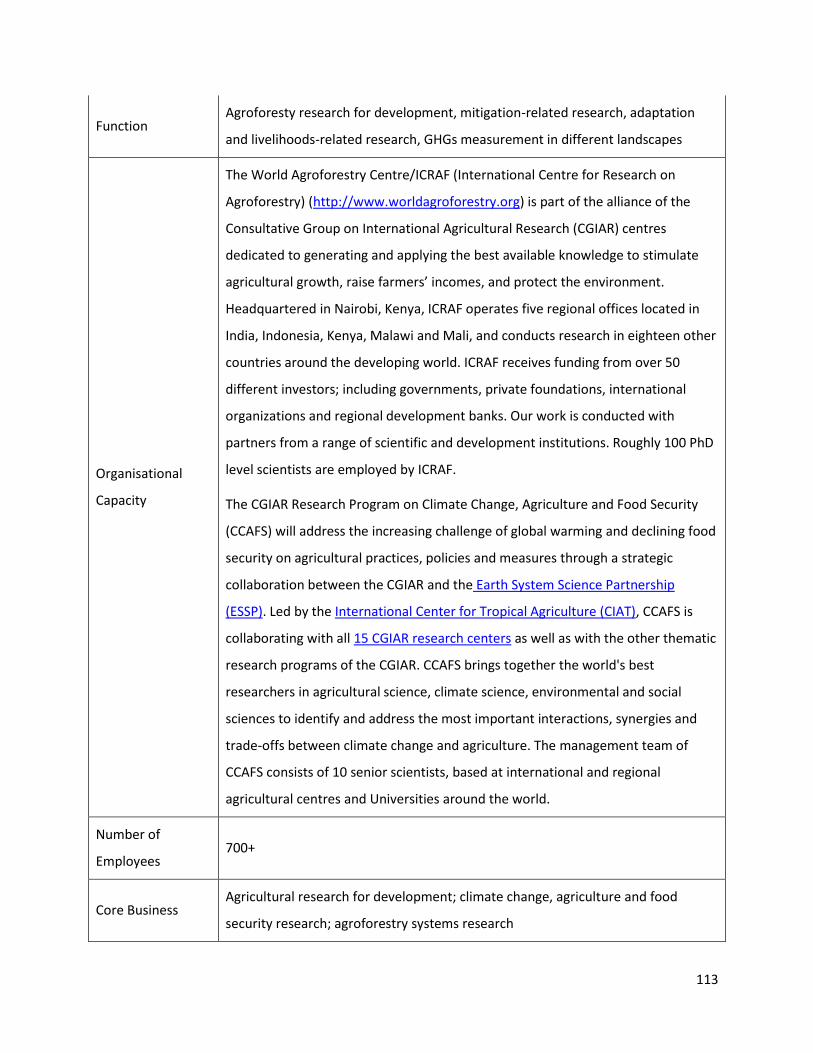
113
Function Agroforesty research for development, mitigation-related research, adaptation
and livelihoods-related research, GHGs measurement in different landscapes
Organisational
Capacity
The World Agroforestry Centre/ICRAF (International Centre for Research on
Agroforestry) (http://www.worldagroforestry.org) is part of the alliance of the
Consultative Group on International Agricultural Research (CGIAR) centres
dedicated to generating and applying the best available knowledge to stimulate
agricultural growth, raise farmers’ incomes, and protect the environment.
Headquartered in Nairobi, Kenya, ICRAF operates five regional offices located in
India, Indonesia, Kenya, Malawi and Mali, and conducts research in eighteen other
countries around the developing world. ICRAF receives funding from over 50
different investors; including governments, private foundations, international
organizations and regional development banks. Our work is conducted with
partners from a range of scientific and development institutions. Roughly 100 PhD
level scientists are employed by ICRAF.
The CGIAR Research Program on Climate Change, Agriculture and Food Security
(CCAFS) will address the increasing challenge of global warming and declining food
security on agricultural practices, policies and measures through a strategic
collaboration between the CGIAR and the Earth System Science Partnership
(ESSP). Led by the International Center for Tropical Agriculture (CIAT), CCAFS is
collaborating with all 15 CGIAR research centers as well as with the other thematic
research programs of the CGIAR. CCAFS brings together the world's best
researchers in agricultural science, climate science, environmental and social
sciences to identify and address the most important interactions, synergies and
trade-offs between climate change and agriculture. The management team of
CCAFS consists of 10 senior scientists, based at international and regional
agricultural centres and Universities around the world.
Number of
Employees 700+
Core Business Agricultural research for development; climate change, agriculture and food
security research; agroforestry systems research

114
Relevant
Experience
20+ years of general ag research 4 development; roughly 5-8 years of mitigation-
related experience (payments for environmental services, REDD+, adoption of
agroforestry, livelihood strategies, adaptation and mitigation practices on farm)
across the world
Date of
Registration
ICRAF was established in 1978; CCAFS in 2009 (still in the process of being
registered as a separate organization)
Contact Person Henry Neufeldt, ICRAF ([email protected]); CCAFS – Lini Wollenberg
Job Title Leader, Climate Change research at ICRAF; Pro-poor mitigation theme leader,
CCAFS
Email Henry Neufeldt, ICRAF ([email protected]); CCAFS – Lini Wollenberg
Telephone Number +254-20-422-3000
Address ICRAF, PO Box 30677, Nairobi, Kenya 00100
Website www.worldagroforestry.org; www.ccafs.cgiar.org
Camco
Function Carbon qualification, capacity building and awareness creation
Organisational
Capacity Private company
Number of
Employees 274 globally, 15 in Nairobi, Kenya
Core Business Climate change, energy, forestry and land use
Relevant
Experience
Camco has more than 15 years experience developing land use and forestry
carbon offset projects. Camco supported the design of the Plan Vivo Standard and
has helped with registration of all four registered Plan Vivo projects. Camco has
vast experience in the quantification and monitoring of carbon benefits from AR

115
and REDD interventions. Camco has undertaken numerous studies relating to
carbon finance opportunities for clients including UNDP, UNEP, ICRAF, Care
International and WWF. Camco has developed tools and protocols to assist with
carbon qualification.
Date of
Registration 1989 (registered as Energy for Sustainable Development)
Contact Person William Garrett (employed by Verco, sub-contracted by Camco Kenya for the SACC
project)
Job Title Principal Consultant
Email [email protected]
Telephone Number +254 20 387 5902
Address
P.O.Box 76406-00508
Muringa Road
Off Elgeyo Marakwet Road
Nairobi, Kenya
Website http://www.camcoglobal.com/
The SACC project is intended to be a long term initiative, evolving from an “agricultural carbon project”
to a climate-smart agriculture programme. As per the financial model it is assumed that the program
will grow in size until it includes at least 50,000 farmers.
It is assumed that CARE will act as the project proponent and manager until the end of year 2016 and
then hand over to a locally-based organization. Between year 2016 and 2021 CARE will provide back-
stopping to this local organization. From year 2022 the organization will be self-reliant.

116
Figure 13: SACC management/governance structure
Based on consultations with local stakeholders, it is proposed that the locally-based programme
organisation will be a form of farmers’ organisation/cooperative. This would comprise three levels of
committees from village level to overall programme level (= Board) plus a small programme
management unit (PMU) which will be accountable to the Board. At all levels the membership of
governance structures will be civil society-based with government officials being ex-officio or co-opted
as appropriate (e.g. assistant chief, government extension staff).
The PMU, comprising a small number of paid staff, would be established as a separate legal entity from
the farmers’ organization / cooperative that would be contracted to perform the required functions
(and dismissed and replaced in the event of unsatisfactory performance). Until the end of 2016 CARE

117
will perform the functions of the PMU. Recent experience in Kenya suggests that this is better in terms
of both efficiency and effectiveness than having the PMU being an integral part of the farmers
cooperative.
Figure 14 illustrates the proposed institutional structure with solid arrows showing lines of
accountability in terms of governance.
The SACC project is currently supporting the establishment of Village Management Committees (VMC),
Sub-Location Management Committees (SLMC) and one overall management committee (BMC) for each
of the two extension blocks (which will be merged into a single Board as the programme transitions to
its long term institutional structure). Based on this experience, and consultations with key stakeholders,
the following is proposed in terms responsibilities and membership of the committees at different
levels, and the responsibilities of the PMU.
Table 36: Management structures, status and responsibilities
Structure Membership/Status Responsibilities
Village
Management
Committee
(VMC)
Representatives of existing farmers
groups
Representatives of farmers ensuring
effective representation of women
and marginalised/vulnerable groups
Manage benefit sharing resources
Monitoring and overseeing activities
Coordinate Resource Persons
Mobilising farmers
Conflict resolution
Record keeping
Sub-location
Management
Committee
(SLMC)
Representatives of VMCs
Assistant Chief
Record-keeping (aggregation of village level
records)
Overseeing activities in sub-location
Facilitate quarterly progress review meetings
Conflict resolution
Block Representatives from SLMC Record-keeping (aggregation of sub-location-

118
Management
Committee
(BMC)
Relevant government staff level records)
Overseeing activities in sub-location
Facilitate quarterly progress review meetings
Programme
Management
Board (to
replace
BMCs)
Representatives of SLMCs
Government staff
Representatives of supporting
agencies (e.g. CARE, KARI, KEFRI)
Representatives of Donors?
Overall governance of the programme
Overseeing Programme Management Unit
Programme
Management
Unit (PMU)
A separate legal entity – NGO or
private sector
Programme implementation, including
managing extension services
Capacity building of staff and farmers
Facilitating linkages to research organisations
and sources of climate information
Programme monitoring and evaluation,
including maintaining farmer database
Engaging investors
Financial compliance incl. annual audits
Administering benefit-sharing
Financial and technical reporting
The key technical skills required to implement the project successfully include community engagement
and carbon measurement and monitoring skills. The following profiles demonstrate the technical skills
possessed by key personnel.
G4.2 Technical and Management Expertise

119
CARE
Phil Franks
With an MSc in natural resource management, Phil Franks has 25 years experience working in
agriculture, agroforestry and natural resource management in Africa. Since 2000 Phil has coordinated
the Integrated Conservation and Development Network of CARE International which evolved into the
Poverty, Environmental and Climate Change Network (PECCN) in 2008. PECCN is a global initiative that
creates a platform across CARE International for learning and global advocacy. Since 2008 Phil has also
served as the coordinator of the carbon finance theme programming theme of PECCN supporting REDD
and other AFOLU programming with a strong pro-poor agenda. Based in Kenya, Phil will act as an
advisor to this initiative and CARE’s focal point for the partnership with CCAFS.
Geoffrey Onyango
With a BSc in forestry, Geoffrey Onyango has 15 years experience in the design and implementation of
forest conservation and afforestation/reforestation projects, mainly in East Africa, including 6 years
experience working with the carbon company CAMCO on the development of AFOLU and energy carbon
projects. Geoffrey joined CARE in April 2010 with the responsibility to support the development of
AFOLU projects, promote learning on AFOLU programming and build capacity of staff of CARE and its
partners in AFOLU programming. Based in Kenya, Geoffrey will have overall responsibility for
coordinating CARE’s contribution to initiative, and will take the leading role in the carbon project design
component.
Rosemary Ogolla
Project Officer. In charge of day to day activities in the field coordination and supervisor for the two
Field Technicians. Rosemary has a Diploma in agriculture, with many years experience in management
of field activities. Specific experience in agroforestry extension and market led agriculture.
Njoroge Maina
With a BSc in forestry Maina started his career with 7 years working in the Kenya Forest Department
rising to the level of District Forest Officer. From government Maina moved to CARE Kenya in 1993,
where has accumulated over 17 years of experience in the design and implementation of development
projects with particular emphasis on agriculture and agroforestry extension and sustainable land

120
management, including “pro-poor” payments for environmental services with communities in critical
water catchment areas. Maina will take responsibility for coordinating CARE Kenya’s contribution to
the initiative and, in particular, the small-scale implementation component.
Robert McAyoo
Field technician- Main point of contact for the farmers. The Technician is responsible for training
respective farmers in the block, material distribution and general follow up on implementation.
Certificate in agriculture. McAyoo has many years of experience working communities much of which
involve tree planting with farmers.
Sophie Juma
Field technician- same as with McAyoo above
CAMCO
William Garrett (WJG), Principal Consultant, Overmoor, UK
Will Garrett (MSc, MA, BA, NCH) is a Principal Consultant and Business Development Manager with
Camco (now Verco) since 2004. He has twenty years experience in the forestry and environmental
sector. The focus of his role at Camco has been on forestry, land use change and ecosystem services. He
has helped to develop many community based land use carbon offset projects mainly in eastern and
southern Africa, Latin America and the Far East. In Mozambique Will was instrumental in developing
carbon baselines, technical specifications and achieving Plan Vivo registration for the Nhambita
community forestry and carbon project. Will has also managed carbon qualification through Plan Vivo
registration for projects in Tanzania (2010) and Malawi (2011). Will is managing REDD+ projects in Kenya
and Tanzania targeting VCS registration and CCB validation and verification in 2011. Will is a Forest
Certification specialist (UKWAS, PEFC & FSC) with experience in sustainable forest management and
community development in Europe, Latin America, Africa and China. He speaks Spanish, Portuguese and
Italian.
Emmanuel Ekakoro (EEE), Consultant, Nairobi, Kenya
Mr Emmanuel Emorut Ekakoro is a holder of a BSc. Degree in Wood Science & Technology from Moi
University, Kenya, where he received professional training in sustainable forest products production and

121
utilisation. He worked in the furniture industry for one year after which he enrolled for an MPhil Degree
in Bioenergy & the Environment at the same university. He has received training in climate change and
environmental management, sustainable energy production and utilisation technologies, and energy
management, planning and policy development, with particular emphasis on biomass energy. He is also
trained in biogas plant design and construction. Mr. Ekakoro is an accomplished researcher with three
papers presented at international biomass energy conferences. He joined Camco in 2006 as sub-
contract biomass specialist, from where he has gained hands-on technical experience in the science,
technology, theory, policy and legislative issues regarding energy, environment and climate change,
their implications and mitigation alternatives incorporating energy production, utilisation and
conservation. Mr. Ekakoro currently works with Camco as a carbon modeling specialist under the Plan
Vivo system, which is an Offset Project Method for small scale LULUCF projects with a focus on
promoting sustainable development and improving rural livelihoods and ecosystems. Plan Vivo works
very closely with rural communities, emphasises participatory design, ongoing stakeholder consultation,
and the use of native species.
In his association with Camco, he has been involved in the formulation and development of a national
policy on sustainable biomass energy and charcoal policy and environment in Kenya. Outside Camco, he
has undertaken other significant energy projects, including a UNDP – GEF funded Biomass Energy
Project whose goal was to remove barriers to the adoption of improved biomass stoves through
knowledge transfer to institutions and Small and Medium Enterprises (SMEs) in Kenya. This project was
implemented through RETAP – Renewable Energy Technology Assistance Project. Mr. Ekakoro has also
worked as a research assistant in Moi University during which period he was involved in the formation
of pilot charcoal production and tree growing associations in Nyanza Province of Kenya through Thuiya
Enterprises Ltd & VI-Agroforestry. In addition, he has worked in private capacity as a consultant for local
communities on energy crop production, efficient charcoal production technologies, and renewable
energy alternatives in Uasin Gishu District of Kenya. He is a member of the Forestry Society of Kenya and
writes as a part-time columnist for the East African Standard, a local daily newspaper.
Amy Pickard (AP), Analyst, Overmoor, UK
Amy Pickard (MSci) is an analyst with Camco. She recently completed a Masters degree in Geography at
the University of Bristol, focusing her dissertation on the carbon sequestration potential of natural
environments. She has extensive experience in carbon cycle modeling and has a solid understanding of

122
carbon policies on both a national and international scale. Amy is an accomplished researcher, with her
first scientific publication “Characterising substrate controls on organic carbon in subglacial
environments” due to be released in the Journal of Geophysical Research in January 2012. She has
previously worked for a solar energy company, where she initially developed her interest in clean energy
and carbon markets.
CARE International will continue to train its employees involved in the project and the community on
climate change issues and managing carbon financed projects. There are more training activities lined
up in the next phase on community awareness and climate change resilience crops within Nyando Basin.
CARE international will ensure continued training of its employee on climate change, mitigation and
adaptation. All relevant information will continue being posted to CARE’s public folders where it will be
accessible to incoming staff. The capacity of selected community trainers will be enhanced to enable
them to train fellow community members thus anchoring the information in the community. Fliers and
short reports translated into vernacular will be distributed to community after training on particular
aspects of the project activities. T- shirts with short messages will be distributed to farmers to remind
them of the project goals and aspirations. The training will be tailor made for the literate stakeholders
e.g. government official and other stakeholders and another to target the farmers who may not know
how to read. The training will be through direct contact with the farmers, through the resource persons
or through VMC etc. all public functions will be used for training when and where necessary.
Results show that attending appropriate training is a crucial prerequisite for the correct adoption of
project activities. However, training is more effective when trainers pursue true participation and when
social capital among farmers is stronger and CARE International has adopted this policy. Further
important determinants of adoption are the level of education and the economic incentives provided to
vulnerable households.
G4.3 Capacity Building
G4.4 Community Employment Opportunities

123
The project has so far employed seven staff including one project officer who is assisted by two
extension officers. The extension staff are assisted by 2 interns and 56 lead farmers who are considered
part of the project support staff. The project also has one vehicle driver.
In the long run, the project intends to employ in the roll out phase a further 4 extension staff and 300
lead farmers. When in full operation in year 10, the project should be able to employ at least 10
extension staff and over 6,000 lead farmers. Each lead farmer should have at least 15 to 25 farmers
under their jurisdiction and one extension staff will have at least 600 lead farmers.
The lead farmers will be employed on contractual basis and their main role will be to support farmer
mobilization and farmer training. The lead farmers will be given incentives in the form of cash and cash
equivalents to facilitate transportation, lunches and time spend on project. The zonal project officers
will be taking charge of all the administrative and technical issues within those zones. As the project
progresses more officers will be employed depending on the need. The project policy is to employ as
much as possible from the project zone unless those skills are not available locally.
Table 37: Summary of Job Creation
Title Number
Project Officer 1
Extension Officer 2
Intern 2
Lead Farmer 6000
Vehicle Driver 1
To inculcate project ownership priority in recruitment will be given to local communities. To ensure this
happens these adverts will first be placed on local community notice boards and sensitization on vacant
positions done through community media such as churches. Only if the desired qualifications cannot be
locally found will the position be open to applicants from other areas. To ensure quality precise job
descriptions and qualifications will drafted before the adverts are done. In conformity with the

124
constitution, women will particularly be encouraged to fill vacant positions. The whole concept of
gender balancing and equal opportunity employment will be followed.
Kenyan’s constitution address labour rights in the bill of rights in chapter 6 and chapter 70 to 86 of the
same constitution deals with fundamental rights of all Kenyans. The following Acts of parliament
supports those two chapters; Employment Act (Cap. 226); Regulation of Wages and Conditions of
Employment Act (Cap. 229), - Industrial Training Act (Cap. 237), - Workmen’s Compensation Act (Cap.
236), - Shop Hours Act (Cap. 231), - Mombasa Shop Hours Act (Cap. 232), - Factories Act (Cap. 514), -
Trade Unions Act (Cap. 233),- Trade Disputes Act (Cap. 234); Companies Act (Cap. 486); Bankruptcy Act
(Cap. 53); Merchant Shipping Act (Cap. 389); Export Processing Zone’s Act (Cap. 547); Immigration Act
(Cap. 172); Pension Act (Cap. 189); Retirement Benefits Act (No. 3 of 1997); National Social Security
Fund Act (Cap. 258); National Hospital Insurance Act (Cap. 255); Provident Fund Act (Cap. 191); Public
Health Act (Cap. 242). In individual labor cases British common law is applicable up to now. The Judiciary
Act (Cap. 16) of 1967, section 3(1) states: “The jurisdiction of the High Court and of all subordinate
courts shall be exercised in conformity with;
a) The Constitution;
b) Subject thereto, all other written laws; including the Acts of the Parliament of the United Kingdom
c) subject thereto and so far as the same do not extend or apply, the substance of the common law, the
doctrines of equity and the statutes of general application in force in England on the12th August 1897,
and the procedure and practice observed in courts of justice in England at that date:
Provided that the said common law, doctrines of equity and statutes of general application shall apply
so far only as the circumstances of Kenya and its inhabitants permit and subject to such qualifications as
those circumstances may render necessary.”
All workers will sign a contract which will indicate their rights and privileges, their corresponding
obligations and penalties for non compliance. A complaint mechanism (as indicated elsewhere) will
encourage fair play in all areas. Continuous training (see G3.4) will inculcate a sense of project
G4.5 Relevant Employment Laws

125
ownership and thus encourage voluntary compliance. Before the workers sign work contracts, they will
undergo a compulsory training, highlighting their rights and safety as per CARE’s regulations. CARE is an
equal opportunity employer and we will instill that in the SACC work force.
CARE International is committed to worker safety and has a very strong track record of safety. CARE self
insures our medical plan so employees and their families are fully covered for any illness or injury they
incur whether on the job or not. The employment document is CARE classified information which will be
shared with the validator during the field visit. CARE has a comprehensive safety training programme for
all employees and every quarter a refresher is organized for all employess.
Generally, no serious safety issues are anticipated in the implementation of the project. All employees
will sign adherence to health and Safety procedures and, in the event injuries occur, lessons will be
drawn and shared with all to ensure H&S procedures are updated as need be.
CARE International has many years working with communities and has developed a clientele niche of
Philanthropic donors supporting its project activities. CARE is an international NGO with a presence in
almost 80 countries and has been in existence for over 50 years.
So far the project has secured ~15% ($619,000) of the funding required to cover the total cash out
($3,963,200) before the project reaches breakeven in 10 year’s time. The project cash flow is forecast to
become positive by year 10 (as evidenced by the SACC financial model.xlsx SCENARIO D), at which point
revenue may be derived from the sale of VCUs and forest products may be harvested. The approval of
additional project start up and roll out funding is expected before the end of 2012.
G4.6 Employee Safety Assessment
G4.7 Financial Health of Implementing Organisations

126
As a tree planting program that takes place voluntarily on existing farm land, the laws relevant to the
project are:
The employment laws listed in G4.5. SACC is not in violation of any of these laws.
Companies Act (Cap. 486). SACC is registered to operate in Kenya.
Environmental Management and Co-ordination Act No. 8 of 1999
Other legal and institutional frameworks and statutes on environmental standards and sustainable use
of natural resource legislation of direct relevance to the SACC project are described below:
Forest Management, Utilisation and Conservation
The primary legislation in the management, utilization and conservation of Forest and forest resources is
the Forests Act (2005), supplemented by the Draft Forest Policy. The goals of the Forests Act (2005) and
the Forest Policy are to enhance the contribution of the forest sector in the provision of economic, social
and environmental goods and services. The specific objectives are to:
• Contribute to poverty reduction, employment creation and improvement of livelihoods through
sustainable use, conservation and management of forests and trees.
• Contribute to sustainable land use through soil, water and biodiversity conservation, and tree
planting through the sustainable management of forests and trees.
• Promote the participation of the private sector, communities and other stakeholders in forest
management to conserve water catchment areas, create employment, reduce poverty and ensure
the sustainability of the forest sector.
• Promote farm forestry to produce timber, woodfuel and other forest products.
• Promote dryland forestry to produce woodfuel and to supply wood and non-wood forest products.
• Promote forest extension to enable farmers and other forest stakeholders to benefit from forest
management approaches and technologies.
• Promote forest research, training and education to ensure a vibrant forest sector.
G5. Legal Status and Property Rights
G5.1 Relevant Laws and Project Compliance

127
• The key elements of the forest policy relevant to the project include (i) Involvement of forest
adjacent communities and other stakeholders in forest management and conservation; (ii) Forest
management planning based on an ecosystem approach; and (iii) Provision of appropriate incentives
to promote sustainable use and management of forest resources. Section 41 (1) of the Act states that
“All indigenous forests and woodlands shall be managed on a sustained yield basis for purposes of (a)
conservation of water, soil and biodiversity; (b) riverine and shoreline protection; (iii) cultural use and
heritage; (iv) recreation and tourism; (v) sustainable production of wood and non-wood products; (vi)
carbon sequestration and other environmental services; (vii) education and research purposes; and
habitat for wildlife in terrestrial forests and fisheries in mangrove forests.
Land Tenure and Land Use
There are numerous statutes that specifically deal with rights of ownership and control of land. The
Kenya constitution, which is the basic law of the land provides for protection of private property from
deprivation without lawful compensation. The constitution also provides that such property may be
‘acquired if it is necessary in the interest of defence, public security, and public morality’. Other statutes
and acts include Government Lands Act (Cap. 280); Registration of Titles Act (Cap. 281), Land Titles Act
(Cap. 282), Land Consolidation Act (Cap. 283), Land Adjudication Act (Cap. 284), Land (Perpetual
Succession) Act (Cap. 286), Land (Group Representatives) Act (Cap. 287), Trust Land Act (Cap. 288),
Mazrui Lands Trust Act (Cap. 289), Trusts of Land Act (Cap. 290), Land Acquisition Act (Cap. 295),
Registered Land Act (Cap. 300) Land Control Act (Cap. 302),Agriculture Act (Cap 318), Physical Planning
Act, Local Government Act, the Land Planning Act (Cap. 303), and EMCA (1999) under Part V on the
Protection and Conservation of the Environment. The Land Planning Act makes provision for the
planning and use of land in Kenya, and promotes public participation in the preparation of plans giving
proper consideration to the potential for economic and social development. Section 9 of the subsidiary
legislation (The Development and Use of Land Regulations, 1961) under the Land Planning Act requires
that before the local authorities submit any plans to the Minister for approval, steps should be taken as
may be necessary to acquire from the owners of any land affected by such plans. Particulars of
comments and objections made by the landowners should be submitted. This is intended to reduce
conflict with the interest such as settlement and other social and economic activities.
Trust Lands Act Cap. 288 of 1962 (revised 1970)

128
At independence, all land that was not in private or government ownership became Trust Land, under
the control of County Councils to be used for the benefit of the residents of the area (MENR, 1994)16.
The Trust Land Act makes provision for rights in Trust Land and controls the occupation of land. The Act
also sets out the procedures for the setting aside of land for a variety of purposes likely to benefit the
persons ordinarily resident in that area or for transfer to the Government. Of particular relevance to
forestry is the fact that the Act makes provisions for general conservation, protection and controlled
utilisation of trees and other forest products on land, other than gazetted Forest Reserves.
Agricultural Act Cap 318 Laws of Kenya as revised in 1986.
The Agricultural Act promotes and maintains a stable agriculture, provide for soil and water
conservation and good land husbandry and management. Section 48 of the Agriculture Act prohibits,
regulates and controls agricultural activities (e.g. cultivation of river banks and slopes), which may lead
to the siltation of watercourses. This ties in very closely with the Water Act (Cap 372) in terms of
alteration of water quality in rivers and other receiving water bodies due to siltation. It also relates to
Sections 10 and 11 of the Chief’s Authority Act (Cap 128), which controls/forbids agricultural or other
activities (such as grazing), which may interfere with the functions of catchment areas. This linkage is
clearly demonstrated such that for a water permit to be granted to a user by the ministry responsible for
water, a soil erosion certificate according to the Agricultural Act must be issued first, as an assurance
that soil erosion considerations have been taken care of.
Physical Planning
Physical Planning is regulated by the Physical Planning Act (Cap 286), an Act of Parliament which
provides for the development and control of construction of buildings and land development in Kenya
regardless of land ownership. The Physical Planning Act was promulgated for the preparation and
implementation of physical development plans and connected purposes. This Act, which was
promulgated in 1996, requires the Proponent of a Project to submit an EIA to the respective local
authority if in the opinion of the local authority the Project is anticipated to have adverse environmental
impacts (Section 36 of the Act). Similarly, under the Act, project proponents are required to acquire a
Compliance Certificate from the Director of Physical Planning to indicate that the proposed
developments are in line with the physical development plan of the area in which such developments
are proposed.
129
Wildlife, Fisheries and Marine Environment
Important pieces of legislation include (i) Wildlife (Conservation and Management) Act; (ii) the Fisheries
Act; and (iii) Public Health Act. The Wildlife (Conservation & Management) (Amendment) Act No. 16 of
1989, Cap 376 Laws of Kenya provides for the protection, conservation, management and utilization of
wildlife (fauna and flora) in all areas of Kenya.The Fisheries Act 1977, Cap 378 Laws of Kenya, aims to
protect fisheries resources and provide for their proper exploitation. Sessional Paper No. 3 of 1975:
Statement on Future Wildlife Management Policy in Kenya stipulates that it is important to protect
important habitats and secure migratory routes of animals outside protected areas.
Local Government Act, Cap. 265 (revised 1986)
This Act allows Local Authorities to alienate, own and sell land within their jurisdiction under the Trust
Lands Act or to purchase land within the jurisdiction of other local authorities. Under the Act, the
Ministry of Local Government has a mandate to plan for the management of natural resources in their
jurisdiction on behalf of the resident local community.
Environmental Management and Coordination
Environmental Management and Co-ordination Act No. 8 of 1999, provide a legal and institutional
framework for the management of the environmental related matters. It is the framework law on
environment, which was enacted on the 14th of January 1999 and commenced in January 2002.
Topmost in the administration of EMCA is National Environment Council (NEC), which formulates
policies, set goals, and promotes environmental protection programs. The implementing organ is
National Environment Management Authority (NEMA). EMCA (1999) comprises of the parts covering all
aspect of the environment, and aims at coordinating environmental protection activities in the country.
This legislation is based on the principle that an understanding of the impact of our actions on the
environment is a pre-requisite for sustainable development and a basis for our survival. Section 58 of
the Act requires that all new development projects undertake Environmental Impact Assessment (E.I.A)
while section 68 requires all on-going projects to have an Environmental Audit with a view to finding out
if the processes and mitigation measures to counter such impacts. In analyzing the relevant statues on
environmental management and coordination, reference has also been made to a number of other
legislation including (i) Environmental (Impact Assessment and Monitoring) Regulations, 2003; (ii)
Constitution (Trust Lands) Act; (iii) Agriculture Act; (iv) All land tenure and land use related legislation
including (Land Acquisition Act, Land Adjudication Act, Government Lands Act, Registration of Titles Act,

130
Trust Land Act and Land Control Act); (v) Fisheries Act; (vi) Forests Act; (vii) Irrigation act; (viii) Lakes and
Rivers Act; (ix) Local Government Act; (x) National Water Conservation and Pipeline Corporation Act; (xi)
Physical Planning Act; (xii) River Basin Development Authorities Act; and (xiv) Wildlife (Conservation and
Management) Act.
Other developments and legislation of importance to the SACC project
The East African Community (EAC) Protocol for the Environment and Natural Resources Management:
Articles 111, 112, 114 and 116 of the East African Community Treaty established the guidelines on
cooperation in environment, natural resources, wildlife and tourism management.
The National Biodiversity Strategy and Action Plan (NBSAP) (GoK 2000) identifies the necessary steps to
take to conserve biodiversity in conformity with requirements of the CBD. The strategy specifies the
trends and priority goals of environmental management and protection, and outlines the short-term and
long-term tasks to be achieved. National Environmental Strategy proceeds from the traditional goal of
environmental protection – which is to provide people with a healthy environment and natural
resources necessary to promote economic development without causing significant damage to nature,
and to preserve the diversity of landscapes and biodiversity while taking into consideration economic
development. The priorities presented in the strategy are taken into account when planning
environmental activities, developing international co-operation and allocating national funds.
The SACC project complies with all the national and local laws and regulations listed above and all
relevant international treaties.
CARE has signed contracts with the community organization seeking their approval in accepting to co-
manage the SACC project and the community organization also signed contracts with households
authorizing the organization to administer and manage the project on their behalf. See contracts at the
project database in Kisumu and also in the annex.
G5.2 Documentation of Legal Approval
G5.3 Project Encroachment and Free, Prior and Informed Consent

131
Numerous consultations were undertaken prior to the implementation of the project, as described in
detail in Section G3.8. The aim of these consultations and agreements was to provide assurance that the
project will not encroach uninvited on private property, community property, or government property
and has obtained the free, prior, and informed consent of those whose rights will be affected by the
project. The most important area that needs adequate consultations and agreements are the land
owners, as the AR activities will predominantly be taking place on private land, or land occupied by
tenants. From the initial research in the project area, stakeholders were identified, and consultation
allowed an assessment of their interests and potential roles in the project. Stakeholders are now
consenting and well informed of the project interventions. As a result of this consultation, the farmers
who have agreed to join the project are doing so voluntarily and signing up a contract indicating their
consent.
No involuntary relocations of the residing population have taken place or will take place as a result of
the SACC project. Integral to this is that the prevailing pre project agricultural activities are not in any
way displaced by the proposed AR scheme. This would cause displacement of food production and, as a
direct result of this, people. The SACC project has been designed to complement existing practices in the
lower and mid Nyando.
The illegal activities that currently take place within the project zone include logging for timber, for
construction poles, for firewood, for charcoal production and poaching for wild meat and fire. These
activities impact upon the scarce timber resources in the project area that have been rapidly degraded
since the 1960s on the remaining parcels of forested land. Illegal logging at the private land holding scale
(i.e. on farm trees) is not a problem within the SACC project area (Onyango, G., personal communication
2012).
G5.4 Involuntary Relocation
G5.5 Identification and Reduction of Illegal Activities in the Project Zone

132
The project will help to reduce illegal activities through the implementation of the project activities
listed in G3.2 Description of Major Project Activities. Ensuring that timber resources are available on the
homestead scale in a sustainable form will reduce pressure on existing timber supplies in the lower and
mid Nyando and in protected areas such as the Tinderet Forest, which borders the project area.
The SACC project is undertaken with the full consent and on behalf of the communities that live within
the project area. These communities will be the beneficiaries of carbon payments directly and indirectly.
The carbon credit rights belong to the landholder who implements the AR (as demonstrated by land
tenure documents). The landholder will receive 25% of the carbon. The remaining 75% will fund the
project and be put towards the purchasing of tree seedlings. The total amount of money received by
farmers from carbon payments will be small relative to the extra income they will generate from co-
benefits and the sale of forest products. This benefit sharing arrangement has been designed with the
full participation and agreement of the relevant local communities.
Carbon rights are distributed by a benefit sharing mechanism that performs both the functions of
disbursing benefits to the farmers that are supplying the environmental service (i.e., carbon
sequestration) in an equitable manner, and the function of aggregating supply and selling the agreed
volume of credits (supply minus buffer) to a suitable buyer. In effect, this aggregation agency may
perform a very similar role to that of an agricultural marketing cooperative, possibly including the
provision of extension services. This initiative will draw extensively on the experience of such
cooperatives, paying particular attention to identifying and addressing constraints to effective
participation of women and other marginalized groups whose interests are not well addressed in some
existing cooperative models.
A key dimension of the design of the benefit sharing mechanism is determining the form that benefits
should take (cash or in-kind, communal or individual), taking into account the implications of different
options in terms of gender equity. In designing the benefit-sharing mechanism, opportunities to
leverage additional social impact must also be taken into account - for example small amounts of money
can have much greater impact, particularly for women, if invested in a community-based group
G5.6 Carbon Rights

133
microfinance scheme such as the Village Savings and Loan Association (VSLA) model that CARE has
developed and promoted in many countries in Africa.
Key methods to ensure the sharing of carbon rights include:
-Carbon value chain analysis and financial modeling of likely benefit flows;
-Facilitating design of the benefit-sharing/aggregation mechanism and associated institutional
arrangements, ensuring the full and effective participation of both male and female
stakeholders;
-Developing templates for simple contracts between farmers and the aggregation agency;
-Identifying and exploring options for leveraging additional social benefits, including climate
change adaptation benefits.
Individual, farmer carbon purchase agreements will be made to the validator upon request.

134
AR-AMS0001 simplified baseline and monitoring methodology for small-scale A/R CDM project activities
implemented on grasslands or croplands with limited displacement of pre-project activities was applied
to measure the climate impact of the SACC project. Carbon credits (VCUs) will be issued and registered
through the Verified Carbon Standard.
Net change is equal to carbon stock changes with the project minus carbon stock changes without the
project (calculated in G2.3).
There are no significant (>5%) increases in non-CO2 GHG emissions (such as CH4 or N2O) in thewithout
or with project scenarios. Burning activity in the project area is limited and will be further restricted due
to the SACC project (so no increase is expected). Increased use of inorganic fertilisers or pesticides is not
expected as a result of the SACC project.
There are no significant (>5%) increases in other non-CO2 GHG emissions in thewithout or with project
scenarios.
III.CLIMATE SECTION
CL1. Net Positive Climate Impacts
CL1.1 Net Change in Carbon Stocks
CL1.2 Net Change in Non-CO2 Emissions
CL1.3 Other Non-CO2 GHG Emissions from Project Activities
CL1.4 Net Climate Impact

135
The net climate impact (per hectare) of the project = net change in carbon stocks + net change in non-
CO2 GHGs – other GHGs from project activities – project-related unmitigated negative offsite climate
impacts. Detailed analysis of the net climate impact is presented in Section G2.3. The positive net
climate impact of the SACC project activities is summarised in Table 38.
Table 38 Summary of baseline, project emissions, leakage and ex-ante forecast of removals (tCO2 / ha / year)
Ye
ar
Net change in carbon stocks
Ne
t ch
ange
in
no
n-C
O2
GH
Gs
Pro
ject
em
issi
on
s
Leak
age
Net climate impact
DIP
-
low
lan
d
DIP
-
up
lan
d
WD
L -
low
lan
d
WD
L -
up
lan
d
BN
D -
low
lan
d
BN
D -
up
lan
d
DIP
-
low
lan
d
DIP
-
up
lan
d
WD
L -
low
lan
d
WD
L -
up
lan
d
BN
D -
low
lan
d
BN
D -
up
lan
d
1 -16 -16 -16 -16 -2 -2 0 0 0 -16 -16 -16 -16 -2 -2
2 -14 -8 -7 6 -1 1 0 0 0 -14 -8 -7 6 -1 1
3 2 5 51 35 6 7 0 0 0 2 5 51 35 6 7
4 21 19 126 75 14 13 0 0 0 21 19 126 75 14 13
5 41 35 208 157 23 22 0 0 0 41 35 208 157 23 22
6 62 55 308 267 35 33 0 0 0 62 55 308 267 35 33
7 72 65 310 292 43 41 0 0 0 72 65 310 292 43 41
8 90 86 393 392 54 53 0 0 0 90 86 393 392 54 53
9 107 108 476 495 65 66 0 0 0 107 108 476 495 65 66
10 101 107 399 448 56 59 0 0 0 101 107 399 448 56 59
11 115 127 454 524 64 69 0 0 0 115 127 454 524 64 69
12 78 91 441 521 51 56 0 0 0 78 91 441 521 51 56
13 86 104 486 588 57 63 0 0 0 86 104 486 588 57 63
14 94 116 351 433 62 70 0 0 0 94 116 351 433 62 70
15 101 129 379 478 67 77 0 0 0 101 129 379 478 67 77
16 108 142 349 449 71 84 0 0 0 108 142 349 449 71 84
17 115 155 372 487 76 91 0 0 0 115 155 372 487 76 91
18 121 168 340 456 81 97 0 0 0 121 168 340 456 81 97
19 128 181 358 489 85 104 0 0 0 128 181 358 489 85 104
20 134 194 377 521 89 111 0 0 0 134 194 377 521 89 111
21 140 207 394 554 94 118 0 0 0 140 207 394 554 94 118
22 146 220 412 586 98 125 0 0 0 146 220 412 586 98 125
23 151 233 429 618 102 131 0 0 0 151 233 429 618 102 131

136
24 157 246 445 650 106 138 0 0 0 157 246 445 650 106 138
25 162 260 462 682 109 145 0 0 0 162 260 462 682 109 145
The SACC project is being validated using the Verified Carbon Standard (VCS). Verified Emmission
Reductions (VERs) will be issued through VCS. According to the VCS Association (http://www.v-c-
s.org/topics/double-counting ), “Double counting of GHG emission reductions and/or removals may
occur in scenarios where there are multiple entities along a project’s value chain who could claim
ownership of such reductions/removals.” It follows that establishing clear ownership of the
reductions/removals will avoid double counting. Only landholders that are able to demonstrate clear
land tenure will be eligible to participate in the SACC project. Section G5.6 outlines the transparent
benefit sharing mechanism adopted by the SACC project which demonstrates why the risk of double
counting is considered to be insignificant.
Field research conducted in the lower and mid Nyando basin (September 2011) resulted in a
comprehensive assessment of the potential for leakage to occur as a function of SACC project activities.
Household surveying was the principal technique used to evaluate leakage potential and involved
interviewing people in 126 randomly selected households. The spokesperson within the household was,
selected based upon their knowledge of AR activities.
The results of the survey allow a solid conclusion to be drawn - leakage from the SACC project is
insignificant. Minimal leakage is expected to result from the project. Three potential sources of leakage
specific to the project are reviewed here along with reasons why these don't apply to the project, which
were first identified by the household surveys.
Leakage due to conversion of land to cropland
CL1.5 Avoiding Double Counting
CL2. Offsite Climate Impacts (‘Leakage’)
CL2.1 Types of Leakage and Offsite GHG Increases

137
The field survey demonstrated that, other than the Grevillea robusta tree seedlings supplied to farmers
in the project (ranging between 50-100 trees per project participant), there is a wide range of existing
trees that project participants have planted on their farms, either along the boundaries, on woodlots, or
as dispersed interplantings on homesteads and on grazing lands. The most prevalent tree types are
displayed in the table 39 below.
Table 39: Tree species in the study area (Source: Camco field data)
Species Percentage
Eucalyptus species 71%
Grevillea 14%
(Cupressus lusitanica and Pinus patula 4%
Markhamia lutea 4%
Jatropha curcas 3%
Cassia siamea, Croton species, Jacaranda mimosifolia, Terminalia brownie,
Casuarina spp Spathodea campanulata, Sesbania sesban and fruit
trees(mango, orange, and Avocado)
4%
Household surveys demonstrated that the planting of tree species outlined above do not restrict the
continuation of agricultural practices. There has been no displacement of cropping activities to other
areas as a result of AR projects because firstly, the trees under existing AR projects in the lower and mid
Nyando were planted along farm boundaries, separate from land used for crops. 93% of project
participants who were surveyed planted trees introduced by AR projects along farm boundaries.
Secondly, project participants planted woodlots on idle land, some of which was degraded and not fit
for cropping activities but was instead suitable for tree planting. The remaining 7% planted trees in
these areas. This means that SACC project interventions would have no effect on cropping activities on
project participant farmland and in fact would utilize land that would otherwise remain idle.
Leakage due to displacement of fuel-wood collection

138
A high percentage (66%) of the project participants use firewood as the main source of cooking energy,
with 32% using a combination of both charcoal and firewood. A minimal percentage (2%) uses a
combination of firewood, charcoal and Liquefied Petroleum Gas (LPG). Fuel wood is generally obtained
from private farms in the project area, as detailed below, and there is temporal consistency in the
acquisition of fuel wood from these property types.
Table 40: Duration of obtaining firewood from source (Source: Camco field data)
Source Duration
1 - 5 years 5 - 10 years > 10 years
Own farm 19% 8% 73%
Private/neighboring farms 10% 10% 80%
No fuelwood collection has been displaced from the project area as nothing has changed with regard to
firewood collection; the project participants continue to collect firewood from either their own farms or
private farms. The few who do not purchase their fuel wood, and hence there is no risk that there will
be displacement of fuel wood collection.
Leakage due to conversion of land to grazing land Land owners in the project area keep animals on their land, which require room for grazing. These
animals include Zebu Cattle (Bos primigenius indicus) and small stock such as goats, sheep and poultry
(Mailu, 2000). A study in 2005 placed the total stock of cattle, sheep and goats in the district at 388,000
animals. The average number of animals per household in the project area are detailed below.
Table 41: Livestock population currently and in the last 5-10 years (Source: Camco field data)
Period Cows Goats Sheep Chicken
Average livestock population over the last
5-10 years 5 10 6 14
Current livestock population 3 2 2 8
Change (%) in average livestock holding
over the previous 10 years -40% -80% -67% -43%

139
Animal ownership in the project area is shown to be decreasing from the results of the field survey. No
land outside the AR project area has been converted to grazing land to allow AR activities on-farm.
Results showed that there were insignificant relocations of livestock to areas outside the project area,
but relocations were instead isolated to existing idle grazing land under control of the property owner,
and that trees were planted on degraded sites deemed unfit for livestock grazing.
Although no leakage sources have been identified, the following activities have been developed by the
project to mitigate against any potential future leakage:
Capacity building on animal husbandry and fodder management which is mandatory for all
SACC project participants. All project participants must ensure that there is adequate
fodder for livestock on their farm through establishment of fodder crops and fodder trees.
Project participants are encouraged to do zero grazing because it takes up smaller sections
of land compared to free range grazing.
All SACC project participants should ensure that there are sufficient trees on their farm to
meet their livelihood needs. The SACC project supports all farmers to increase tree cover
on their farms.
The SACC project promotes improved cooking technologies, such as:
o Energy efficient cook stoves, and
o The development of clean cooking energy sources such as biogas.
Project participants will develop improved farming activities such as the introduction of
integrated farming systems which are efficient, profitable and environmentally
responsible. This includes activities such as agroforestry.
CL2.2 Leakage Mitigation
CL2.3 Unmitigated Negative Offsite Climate Impacts

140
There is no expected leakage, consequently the amount to be subtracted from the net climate impact of
the project is zero (See equation 19 in AR-AMS0001 V.6.).
None have been identified during the comprehensive field research that was conducted in the SACC
project area.
The purpose of the monitoring plan is to set a framework for quantifying and documenting changes in
project-related carbon pools (within and outside the project boundaries) and project emissions.
Carbon Pools to Monitor: The carbon pools selected for the SACC project are those found in above and
below ground woody biomass. These are the pools which should be monitored.
Location of Monitoring: Climate impact monitoring will be done in the project areas. As it has been
determined that there is negligible leakage associated with the SACC project, there is no requirement
for monitoring outside the project area.
Initial Monitoring: The first monitoring will occur during validation in 2012.
Specifically the following parameters will be measured at validation:
Table 42: Data Available at Validation
Data Unit /
Parameter Data unit Description
Source of
data
Value
applied:
Purpose of the
data
Location Latitude and
longitude
Single point location of
the area where project GPS
Geo-reference
number Baseline
CL2.4 Unmitigated Negative Offsite Non-CO2 Climate Impacts
CL3. Climate Impact Monitoring
CL3.1 Plan for Selecting and Monitoring Carbon Pools and Non-CO2 GHGs

141
activity has been
implemented
Project area ha
Size of the area where
the project activity has
been
implemented
GPS Geo-reference
number Baseline
Ownership Name Ownership of land of
project area
Project
registration
data
Baseline

The following parameters will be measured subsequent to validation, over varying time scales:
Table 43: Data to be monitored
Data Unit
/
Parameter
Data
unit Description
Source of
data
Description of
measurement
methods to be
applied
Frequency of
monitoring/recording:
Value
monitored
Monitoring
equipment
QA/QC
procedures
applied
Number of
trees Trees
Number of
trees in a
project area by
strata
Physical
counts
Physical counts of trees
in each stratum by
quantifiers
Ongoing measurement
taken by quantifiers as
they visit project areas.
Each PA could be
visitedas much as once
per year
Transcript
or handheld
computer to
record data
Part of
overall
QA/QC
procedures
discussed at
end of
section
DBH cm Diameter of
tree at 1.3m
Physical
measurements
DBH of up to 20
representative
trees of each
age/species stratum
Ongoing measurement
taken by Quantifiers as
they visit project areas
Measuring
tape
As above
Total CO₂ Tonnes
Total CO₂
sequestered by
trees
Calculation
Allometric equations are
assigned to each
stratum. DBH values are
Calculation takes place
with each monitoring
report
Computer
and data
base
As above

143
applied to the allometric.
Average biomass of a
tree in each stratum is
calculated and multiplied
by number of trees in
each stratum. Biomass is
converted to
CO2e and the CO2e of the
stratum are totaled
Area
displaced ha
Area of
cropland
displaced due
to project
activity
Survey
Project participants
asked whether cropland
has been displaced
Monitoring only in first
crediting period Survey
Use of
survey
Grazing
animals
displaced
Head of
cattle
Number of
domesticated
grazing animals
within the
project
boundary
displaced due
to the project
activity
Survey
Project participants
asked whether grazing
animals have been
displaced
Monitoring only in first
crediting period Survey
Use of
survey

The monitoring plan will be adhered to strictly. Monitoring will take place every five years for the
duration of the 25 year crediting period (full project period of 35 years). Full responsibility for project
monitoring lies with CARE. They have sole responsibility for recording the parameters detailed in the
above tables.
The project proponents, CARE, will adopt the following QA/QC procedures to ensure monitoring is
thorough and to the standards required by VCS:
Quantifier Training: Quantifiers will receive explicit training so that quantifications are performed in a
standard and regular fashion.
Staff Audits: Staff members will periodically audit peer quantifiers, including an independent sampling
of tree counts and circumference measurement.
Multiple Tracks: In order to ensure that the location and perimeter of each discrete project area is
accurate, each GPS track of the parcel will be measured at least twice.
Data Quality: Quantifiers will count every tree in each discrete project area. Counting each tree is 100%
sampling and provides greater than 1% precision at the 95% confidence level.
Desk Audit: Quantifiers will develop analytical tools for reviewing data as it comes in from the field to
look at track data, tree counts, and completeness of data.
Transparency: By providing the quantification data online and available to anyone with an internet
connection, the project proponents will be subject to constant data scrutiny. This transparency and the
actual visits that have already taken place provide further motive to make sure the field data is correct.
CL3.2 Commitment to Monitoring Plan

145
CARE will develop a full monitoring and Evaluation plan within the first 6 months of validation that is by
end of April 2013. The developed monitoring plan will cover the full crediting period that will be strictly
adhered to per CARE monitoring and Evaluation practice. Monitoring will take place every 5 years for
the duration of the project with CARE taking responsibility for recording the parameters details.
The SACC project commits to continue leakage monitoring for at least five years after all activity
displacement or other leakage causing activity has taken place.
The proposed project activities will have a positive net impact on communities in the lower and mid
Nyando. Specific impacts derived from the project are outlined below, in relation to pre-designated
Social Carbon indicators, in alignment with the Social Carbon Standard Version 4.2 June 2011, a
participatory method of monitoring the co-benefits of a project.
This methodology compares the ‘with project’ scenario to the ‘without project’ scenario, in order to
ensure that the project interventions have a net positive effect on the recipient communities. Annex 4
of the Application Manual: SOCIAL CARBON for Forest Projects, Draft Version 0.01, 2010 lists the
indicators applicable to forest projects for six resources, namely Social, Human, Financial, Natural,
Biodiversity and Carbon. According to the standard guidelines, data used to score the indicators should
be collected through participative methods, for example group work, interviews and questionnaires.
Extensive research has been conducted in the SACC project area by the project proponents and this
information has been used to complete the Social Carbon assessment.
Methodology for Scoring the Social Carbon Indicators
IV. COMMUNITY SECTION
CM1. Net Positive Community Impacts
CM1.1 Impacts on Communities

146
The scoring of the indicators from Annex 4 of the Application Manual: SOCIALCARBON for Forest
Projects (2010) adheres to the following Social Carbon guidelines:
1. The researcher should compare the characteristics of the project with the six scenarios available for
the indicator and select the one that best represents the characteristics of the project and the
respective index should be attributed to the indicator. The indicators receive scores ranging from the
worst scenario (level 1) to the ideal situation (sustainable use of resource – level 6), according to the
following guidelines:
Table 44: Scoring the Social Carbon Indicators
Scores Classification Characteristics
1 and 2 Critical
Existence of irregularities; high socio-environmental risk; significant levels of
social and environmental degradation; or situation of extreme hardship,
which significantly compromises the quality of life of the population.
3 and 4 Satisfactory
Meets all the legal requirements relating to its activities; surpasses them
through the adoption of good practices and voluntary actions in some cases;
or the quality of life reaches the minimum acceptable standard but requires
improvement.
5 and 6 Sustainable
Exceeds its legal obligations and/or common practice in the market, in many
cases adopting the best-possible practices for the sector; or communities have
reached a sustainable livelihood, with adequate access to material and social
goods, are capable of recovering independently from situations of stress, and
are not causing the deterioration of basic environmental resources through
their activities.
2. Select at least three and a maximum of ten indicators for each one of the six resources.
3. When an indicator does not apply, the research should identify the indicator as “Not Applicable.” No
value should be agreed upon in this case.
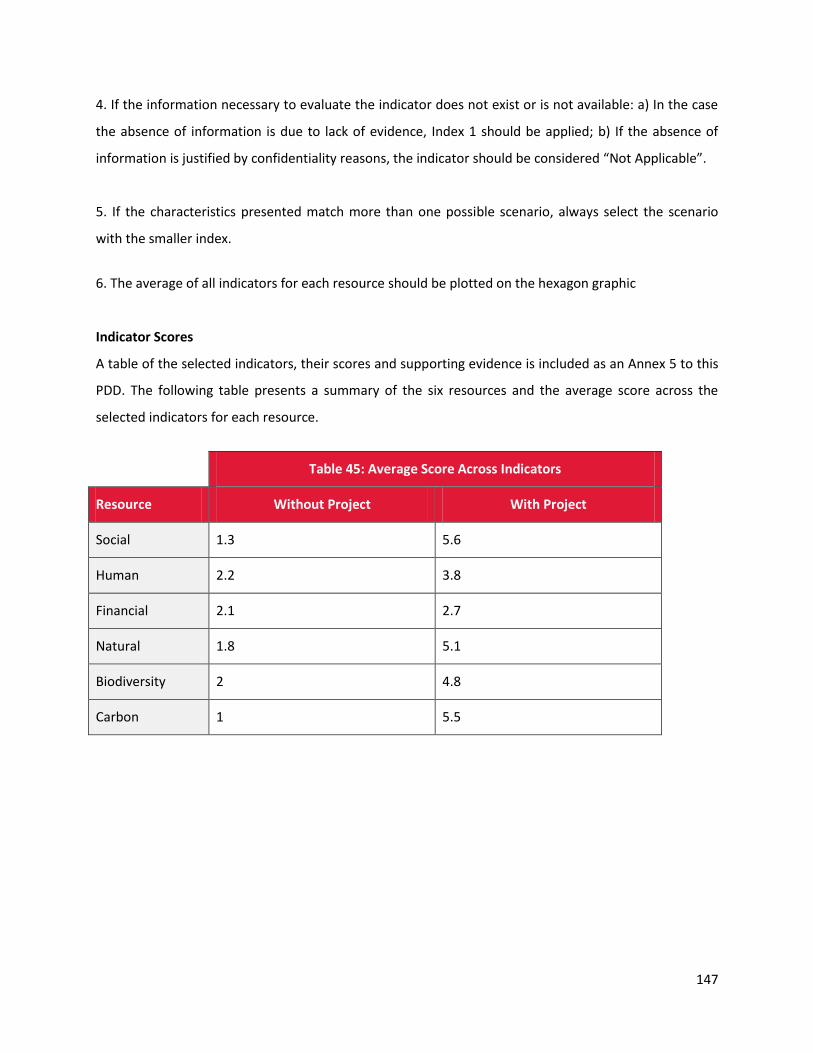
147
4. If the information necessary to evaluate the indicator does not exist or is not available: a) In the case
the absence of information is due to lack of evidence, Index 1 should be applied; b) If the absence of
information is justified by confidentiality reasons, the indicator should be considered “Not Applicable”.
5. If the characteristics presented match more than one possible scenario, always select the scenario
with the smaller index.
6. The average of all indicators for each resource should be plotted on the hexagon graphic
Indicator Scores
A table of the selected indicators, their scores and supporting evidence is included as an Annex 5 to this
PDD. The following table presents a summary of the six resources and the average score across the
selected indicators for each resource.
Table 45: Average Score Across Indicators
Resource Without Project With Project
Social 1.3 5.6
Human 2.2 3.8
Financial 2.1 2.7
Natural 1.8 5.1
Biodiversity 2 4.8
Carbon 1 5.5

148
Figure 14: Social indicator scores radar diagram
The radar diagram illustrates the difference in the six resources between the “without” and “with”
project scenarios. It illustrates the positive effects the project has on communities living within the
project zone. Project benefits include:
The adoption of improved farming technology
The adoption of improved livestock management
Increased forest product availability through agroforestry and woodlots
Improved soil fertility and management
New revenue from sale of carbon offsets
Job creation for project development, implementation, administration and MRV
None of the above benefits would exist without the project. The absence of carbon revenues means
there would be no livelihood diversification or new employment opportunities, a reduction in ecosystem
services and watershed quality and deforestation and forest degradation would continue to occur.
Assumptions Made:
The improved farming technology was included in the project to ensure that smallholders had sufficient
short term benefits to motivate participation in the project. The adoption of these technologies—and
their resulting benefits from reduced soil erosion, improved fertility, higher yields, and productivity—

149
would translate into net community benefits. This area does not have access to extension services
provided by the government; without the project, farmers would not necessarily have access to these
benefits. In addition, as part of the project, CARE trains and builds the capacity of a cadre of extension
workers to continue to promote and track the adoption of these practices. Similarly, households in the
project area face a long history of soil degradation and erosion, with few households using fertilizers to
replenish soil nutrients. Thus, part of the training of the agricultural extension work will focus on
improving soil fertility and management, in order to see improvements in overall soil health. For this
reason, both improved farming technology and improved soil fertility and management were included
as benefits.
Similarly, improved livestock would bring substantial benefits—both from the introduction of
new/improved species of livestock, but also through the production of fodder and forages to improve
the productivity of animals and livestock. As livestock serve important functions in the livelihoods of
project participants (ie, serving as important sources of emergency cash and a significant asset),
improvements in productivity of animal product outputs would help to secure an additional source of
income and improve the productivity of the household’s assets. A key part of training will be training
farmers on the proper way to take care of livestock, which will also serve the function of reducing tree-
livestock conflicts at the community level.
Households in the project area (especially in lower Nyando) face a significant lack of fuelwood and
timber products; households surveyed in other CCAFS research in the area calculated that households
on average spend 750-1500 KES per month purchasing fuelwood. In addition, the costs of poles—and
their relative scarcity—make building houses and investing in fencing material expensive and sometimes
prohibitive. Thus, the ability to harvest tree products—both from pruning and trimming—as well as
timber—was mentioned by men and women as a key benefit and reason for entering into the project.
Households expected the carbon revenue to provide an additional source of income, which could be
used for meeting expenses, such as paying school fees, or investing in small businesses and farming.
CM1.2 Negative Impacts on High Conservation Values

150
As previously stated, Section G1.8 presents an evaluation of HCVs in the project area. Following the High
Conservation Value Resource Network’s toolkit - Identifying and Managing High Conservation Value
Forests: A Guide for Forest Managers - and referencing the World Database on Protected Areas, no HCVs
are present in the project area. This judgement is consistent with expert opinion.
Whilst we can therefore be certain that no High Conservation Values will be negatively affected by the
project activities, the project aims to develop natural resources, local livelihoods and social capital. The
following descriptions outline some of the approaches taken:
Areas that provide critical ecosystem services
A number of studies have focused on the impact that current land use practices in the Nyando basin are
having on the quality of land in the SACC project area (Njuguna, n.d.). The consensus is that intensive
agriculture and historical deforestation have left the area in a state of degradation, with poor, infertile
soils and diminished natural resources. The reliance of local communities on the land for agricultural
purposes means a continuation of the current land use scenario is to the significant detriment of the
area as a whole. Any activity that introduces woody biomass back to the SACC project area will have
only positive implications for the local people and the land that they rely on for income generation.
Areas that are fundamental for the livelihoods of local communities
The project will prevent harvesting of forest products and community engagement in other drivers of
land degradation including excessive grazing of animals. However agricultural land, which is the main
source of income for 73% of people in the project area, will be protected by the project interventions.
Interventions such as boundary planting and dispersed interplanting involve the strategic planting of
trees across land under crop which will serve to bind the soil and reduce erosional losses. Hence
agricultural land, which is fundamental for the livelihoods of local communities in the SACC project area
is protected by the project, with no negative impacts identified.
Areas that are critical for the traditional cultural identity of communities
The project will look to address some cultural issues, such as the treatment of women in society.
Traditionally they have never been viewed as heads of households and were excluded from agricultural
activities such as sowing of crops. The SACC project looks to address this sensitive cultural issue through
the inclusion of women in project interventions from the outset. This will have a positive net effect on

151
society, as women take steps to participating in a community free of gender stereotypes.

152
As it was determined that leakage caused by the SACC project is negligible, the offsite impacts of the
project are believed to be limited. The project interventions are implemented on the homestead scale
within the project area and hence their effects on the surrounding land are minimal.
The only expected effect of the SACC project outside the project area that would arise as a result of AR
activities in the lower and mid Nyando is an increase in interest surrounding agroforestry interventions
in neighboring communities. There is potential for another similar project to be implemented in the
Homabay region, dependent on the success of the SACC project, and it is likely that project participants
in future schemes would be fully receptive to AR activities.
Negative offsite stakeholder impacts are negligible and thus mitigation of the project impacts on offsite
stakeholders is not necessary.
As demonstrated in CM.1 the SACC project has numerous benefits to stakeholders. No negative offsite
stakeholder impacts have been detected and the project activities cannot be attributed to a decrease in
the well-being of other stakeholders. Indeed the environmental benefits of the project will be felt by
downstream communities as runoff from agricultural land reduces, and water quality in aquatic
ecosystems will improve.
CM2. Offsite Stakeholder Impacts
CM2.1 Negative Offsite Stakeholder Impacts
CM2.2 Mitigating Negative Offsite Social and Economic Impacts
CM2.3 Net Impacts on Stakeholder Groups

153
The table on the following page summarises the section of the project’s monitoring plan that focuses on
impact versus the projects overall development objectives which are expressed in terms of improving
food security and, more broadly, reducing poverty. In the case of food security the indicator and means
of verification have been predefined based on standard methods used by CARE in Kenya. In the case of
poverty reduction the indicators will be defined by communities themselves with some examples given
of indicators that are likely to be proposed. This monitoring plan will be reviewed and finalised and then
the necessary baselines established within 6 months of validation.
Develop initial plan for assessing the effectiveness of measures used to maintain or enrich HCV related
to community well-being present in the project zone:
Areas that Provide Critical Ecosystem Services: River Nyando The positive impact that reforestation and increased tree density in the project area has on the River
Nyando is well understood. Under the ‘without project’ scenario, the river condition will deteriorate as
there are an insufficient number of trees to bind and stabilize soils. Conversely, AR activities in the ‘with
project’ scenario will improve groundwater recharge, soil structure and will regulate stream flow, as the
rate of rainfall to runoff is reduced. It therefore follows that monitoring the condition of trees planted in
the SACC project area will give a strong indication of the condition of the River Nyando. As such, the
monitoring plan for G1.8.4 follows the biodiversity monitoring plan for trees outlined in Section B3.1.
Areas that are Fundamental for the Livelihoods of Local Communities: Agriculture
Agriculture employs over three quarters of the people living in the SACC project area. Improvements in
crop yields are expected as the project continues, as the trees will serve to bind the soil, and over time
CM3. Community Impact Monitoring
CM3.1 Develop Community Monitoring Plan
CM3.2 Develop High Conservation Value Monitoring Plan

Table 46: SACC Community impact monitoring plan
Indicator Means of Verification
Source of information Method of collection Frequency Baseline
Poverty reduced
Locally defined poverty
indicators (which may differ
by location and change over
time) e.g. land ownership,
livestock ownership, ability to
afford school fees
Community members grouped
by well-being and gender
Participatory impact
assessment tool
Every 5 years
Reflexive counter-factual (i.e.
no baseline needed)
Community members grouped
by well-being and gender Most significant change Every 5 years
Reflexive counter-factual (i.e.
no baseline needed)
Improved food security
Hungry months
Households in participating
villages
Questionnaire
Every 2.5 years
Before project:
Lower Nyando already done
Mid Nyando to be done
ASAP
Community members grouped
by well-being and gender
Focus group discussion
(especially for attribution) Every 2.5 years
Reflexive counter-factual (i.e.
no baseline needed)
this will allow fertility to increase. Food security is a good indicator of agricultural yields, as farmers in
the area use their own crops to supplement their food intake and to sell on for profit. Both would result
in increased food security and hence this is an excellent indicator of agriculture in the lower and mid
Nyando. Food security will be measured in household surveys and community focus groups.
Areas that are Critical for the Traditional Cultural Identity of Communities: Gender roles
The dominance of males in some agricultural activities, such as the sowing of seeds, has led to the
exclusion of women from agricultural practices historically in the lower and mid Nyando basin. The SACC
project involves women from the commencement of the interventions and CARE envisage their
involvement throughout the project. This will be assessed routinely through household surveys and the
formation of women’s groups.
CARE commits to developing a full monitoring plan and completing the necessary baselines within 6
months of project validation and to disseminate this plan and the results of monitoring to the
communities, stakeholders and wider public. This level of scrutiny will ensure that the monitoring plan is
completed to a high standard, with all aspects of community effects considered and explored on a
consistent basis.
The dissemination of information amongst the community will be facilitated by the community which
has developed organized institutions right from the village level. This has provided ease in handling
information and any project and community related dynamics at the lowest level. This organization
moves to the sub location, block and the project management level. These levels of arrangement will be
used to disseminate all the project information to the participating farmers and also the larger
community.
The village and the sub locations are key points of communication level to easily reach the larger
community. The project will use the community elected leadership at these levels to mobilize the
farmers reinforced by the village elders and the chiefs/assistant chiefs in order to effectively reach the
larger community.
CM3.3 Commit to Monitoring Plan

156
The project will continue communication through the project staff to the community either directly or
through community based institutions and the resource persons. Related information will also be kept
at the management institutions levels through reports and other documentations for reference.

157
Social and Biodiversity Impact Assessment (SBIA) Manual for REDD+ Projects, Part 1 - Core Guidance for
Project Proponents and Part 3 - Biodiversity Impact Assessment Toolbox were used to estimate changes
in biodiversity as a result of the project in the project zone and in the project lifetime.
The following is a list of factors from the Biodiversity Impact Assessment Toolbox (p.5) that positively
influence the direction and scale of biodiversity impacts in AR projects. These factors are common to the
SACC project:
1. Minimal inputs of water, fertilizers, and pesticides
Households in the project area face a long history of soil degradation and erosion, with few
households using fertilizers to replenish soil nutrients. Part of the training of the agricultural
extension work will focus on improving soil fertility and management, in order to see improvements
in overall soil health. In addition, conservation of soil will reduce the volume of particle bound
fertilizers that are exported to downstream aquatic ecosystems including Lake Victoria. This will
subsequently reduce the effect of eutrophication in the lacustrine environment
2. Plantations incorporating native species
AR activities planned in the project area will introduce indigenous tree species including, Markhamia
lutea and Terminalia brownii and carefully selected exotic / naturalized species including Eucalyptus
spp, Casuarina spp, Grevillea robusta and Leucaena Leucocephala. Exotic tree species selection has
been done with the objective of meeting the needs of project participants for forest products.
3. Planting site extremely degraded
V. BIODIVERSITY SECTION
B1. Net Biodiversity Impacts
B1.1 Project Impacts on Biodiversity

158
The project area covers 208,185 hectares of mixed use land, much of which is in a degraded state;
remote sensing analyses of the project area indicate that a large proportion of the land is degraded
or degrading agricultural land, which historically would have been forested. Historical deforestation
in the project area has left a mosaic of degraded bush and scrub in which only a few highly
fragmented native forest areas remain. Further, the Nyando River Basin is considered to be a soil
erosion hotspot, with some of the most severe erosion on the African continent.
4. Planting site close to intact native forest
The project area borders with Tinderet Forest Reserve, a 282 km2 (28,200 hectares) protected area
created to maintain a natural forest landscape (WDPA, 2012).
Likewise, the project avoids the following activities that lead to more negative / fewer positive
biodiversity impacts:
1. Continuous inputs of water, fertilizers, or pesticides
2. Monoculture plantations
3. Planting site already in good condition
4. Planting site far from intact native forest
The following sections describe the initial conditions of the project area prior to the start of the project:
• Describe the types and condition of vegetation within the project area (G1.2)
• Describe current biodiversity and threats to biodiversity in the project zone (G1.7)
• Describe High Conservation Values if present (G1.8)
Section G2.5 Effect of Baseline on Biodiversity explains how biodiversity in the project area has
diminished significantly since widespread deforestation arose in the 1960s. There are no species with a
high conservational value in the project area and in the absence of the project activities biodiversity is
expected to continue to diminish.
Biodiversity maintenance and improvements are expected to be a positive outcome of the proposed
SACC project activities. Biodiversity benefits linked with the project include the following:

159
• Protection of water courses – reduced siltation – breeding ground for most fish in Lake Victoria
• Terminalia brownii – threatened species
• Return of bat and bird species
• Protection of naturally occurring plants
Although the project primarily aims to benefit the local community, the project will also have numerous
biodiversity benefits. Biodiversity impacts are clearly shown below, as specified in the Biodiversity
Carbon impact assessment tool.
The Social and Biodiversity Impact Assessment (SBIA) Manual for REDD+ Projects presents the following
process for biodiversity assessment:
SBIA Stage1: Starting conditions study and stakeholder identification
SBIA Stage 2: “Without‐project” social and biodiversity projections
SBIA Stage 3: Project design and theory of change (“with‐project” social and biodiversity projections)
SBIA Stage 4: Negative impacts, risks and mitigation/prevention measures
SBIA Stage 5: Identification of indicators
SBIA Stage 6: Developing the monitoring plan
SBIA Stage 7: Data collection, analysis, and reporting
In summary, historical deforestation in the project area has left a mosaic of degraded bush and scrub in
which only a few highly fragmented native forest areas remain. It is evident that land types are
degraded and have relatively low species diversity; this landscape does not support significant levels of
biodiversity and no HCVs are present. In the absence of the project activities, this situation will get even
worse. Project activities that include minimal inputs of water, fertilizers, and pesticides, incorporate
native species and plant on extremely degraded land close to intact native forest will positively influence
the direction and scale of biodiversity in the project area.
B1.2 Demonstrate No HCVs Negatively Impacted

160
As previously stated, Section G1.8 presents an evaluation of HCVs in the project area. Following the High
Conservation Value Resource Network’s toolkit - Identifying and Managing High Conservation Value
Forests: A Guide for Forest Managers - and referencing the World Database on Protected Areas, no HCVs
are present in the project area. This judgement is consistent with expert opinion.
Globally, regionally or nationally significant concentrations of biodiversity values
There are no (a) protected areas (b) threatened species (c) endemic species (d) areas that support
significant concentrations of a species in the project area.
Globally, regionally or nationally significant large landscape-level areas
The SACC project will not negatively impact any of the remaining pockets of forest, shown by the remote
sensing analysis to account for less than 5% of the project area. The project promotes the planting of
trees on the homestead scale, which over time will become a timber resource as the trees are pruned.
This new source of timber will reduce pressure on existing woody biomass resources and hence the
project will have a positive impact on areas supporting indigenous forests.
Threatened or rare ecosystems
The Tinderet Forest is a threatened ecosystem adjacent to the SACC project area. For reasons stated
previously, pressure on this resource will be minimized as a result of the project interventions and hence
the SACC project will support and contribute to the sustentation the remaining section of the Tinderet
Forest.
The following species have been proposed for use in the SACC project:
Grevillea robusta
Markhamia lutea
Casuarina spp.
Terminalia brownii.
Leucaena Leucocephala
Eucalyptus spp.
B1.3 Identification of Species Used by the Project

161
No known invasive species will be introduced into any area affected by the project. It is therefore certain
that the population of any invasive species in the lower and mid Nyando will not increase as a result of
the project.
The use of Eucalyptus in agroforestry initiatives has been previously critiqued as it has been
documented to result in lowered water tables in semi-arid areas due to its high demand for water.
However, Eucalyptus spp. also has excellent credentials for use in small scale woodlots, as it is fast
growing and can sequester carbon over reduced time scales. As long as the plant is properly managed
and kept separate from areas used for crop cultivation, there should be no detrimental effects
associated with its use in the SACC project. Indeed, in correctly managed woodlots Eucalyptus will be an
integral part of the carbon finance programme. Similarly Grevillea robusta, Casuarina spp. and Leucaena
leucocephala are non native species which are promoted by this project because they are multi-purpose
trees, preferred by the project participants which have a high level of suitability for agroforestry systems
We guarantee that no GMOs have or will be used in the course of the project. As a consequence, GMOs
will not be used to generate emissions reductions or removals.
B1.4 Effect of Non-native Species Use
B1.5 No GMO Guarantee
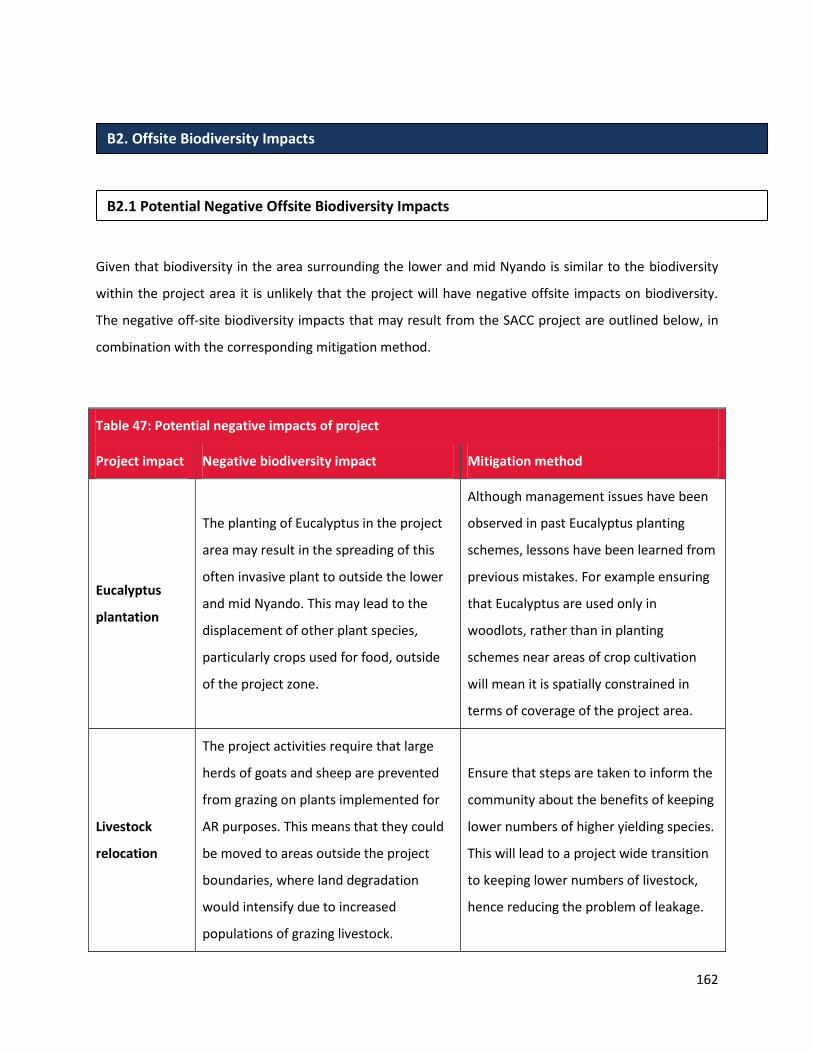
162
Given that biodiversity in the area surrounding the lower and mid Nyando is similar to the biodiversity
within the project area it is unlikely that the project will have negative offsite impacts on biodiversity.
The negative off-site biodiversity impacts that may result from the SACC project are outlined below, in
combination with the corresponding mitigation method.
Table 47: Potential negative impacts of project
Project impact Negative biodiversity impact Mitigation method
Eucalyptus
plantation
The planting of Eucalyptus in the project
area may result in the spreading of this
often invasive plant to outside the lower
and mid Nyando. This may lead to the
displacement of other plant species,
particularly crops used for food, outside
of the project zone.
Although management issues have been
observed in past Eucalyptus planting
schemes, lessons have been learned from
previous mistakes. For example ensuring
that Eucalyptus are used only in
woodlots, rather than in planting
schemes near areas of crop cultivation
will mean it is spatially constrained in
terms of coverage of the project area.
Livestock
relocation
The project activities require that large
herds of goats and sheep are prevented
from grazing on plants implemented for
AR purposes. This means that they could
be moved to areas outside the project
boundaries, where land degradation
would intensify due to increased
populations of grazing livestock.
Ensure that steps are taken to inform the
community about the benefits of keeping
lower numbers of higher yielding species.
This will lead to a project wide transition
to keeping lower numbers of livestock,
hence reducing the problem of leakage.
B2. Offsite Biodiversity Impacts
B2.1 Potential Negative Offsite Biodiversity Impacts

163
Identify potential negative offsite biodiversity impacts that the project is likely to cause.
The strategy to mitigate any potential negative offsite biodiversity impacts is based on “Seeing is
believing” where a few farmers will be used to adopt to the new technology and enjoy the benefits such
as increased milk production, reduced breeding period and faster growth resulting into higher returns
and increased weight fetching more cash. Working with government livestock production office, the
project will sensitize the community to shift from big herds of largely unproductive cattle( Zebu) to
smaller herds of the more productive exotic ones. To ensure appropriate acclimatization, this will
involve intensive cross breeding of the Zebu with the exotic breeds. Similar work with goats will be done
to shift from small East African goat to more productive exotic breeds. Likewise the community will be
encouraged to adopt restricted grazing and zero grazing. Towards this the community will encourage
through training to plant improved pasture such as Napier grass.
The Social and Biodiversity Impact Assessment (SBIA) Manual for REDD+ Projects, Part 3 - Biodiversity
Impact Assessment Toolbox (p.3) presents an overview of potential biodiversity impacts anticipated for
reforestation projects outside of the project area:
Table 48: Potential Biodiversity Impacts in Project Zone of Reforestation Projects
Positive Impact Negative Impact
+ Regional forest benefits - Spread non-native species to surrounding
landscape
+ Benefit downstream aquatic
communities via reduced erosion - Potential introduction of GMOs
+ Increased habitat connectivity between
B2.2 Mitigation of Potential Negative Offsite Biodiversity Impacts
B2.3 Evaluate Potential Negative Offsite Impacts on Biodiversity

164
regional forest patches
Whilst the project activities, previously described, will contribute to regional forest benefits, reduced
erosion and increased habitat connectivity, measures to control the spread of non-native species and a
commitment to no GMOs use in the course of the project mean we can be certain that the offsite
negative impacts on biodiversity will be negligible.

165
Biodiversity monitoring is designed to measure changes in plants and animals, their habitats,
ecosystems and the stress factors on ecosystem functions. In the SACC project this means identifying
the current status, distribution and trends of habitats and species populations and the underlying
factors affecting these. CARE has initiated plan for selecting biodiversity variables to be monitored and
the frequency of monitoring (every five years) and reporting to ensure that monitoring variables are
directly linked to the project’s biodiversity objectives and to anticipated impacts (positive and negative)
as shown in table 48.
Table 49: Biodiversity monitoring variables
Class Indicator Data Set Method Comments
Vegetation
structure
Change in
crown
cover percent
SACC manager will
estimate Canopy
cover in % at
upper canopy level
(whether
tree, shrub,
grass, etc.)
Standard canopy
cover methods,
done
least annually
Significant disturbance/ARR is
generally indicated by changes
in canopy cover and dominant
species. However, records will
be long term to take into
account short-term fluctuations
due to factors such as tire and
weather patterns.
Habitat
distribution
Change in
vegetation
along
watercourses
Area of riparian
Vegetation
type.
Boundary of
riparian
vegetation,
etc.
Remote sensing or
transect, survey
Changes in riparian vegetation
can have significant effects on
aquatic biodiversity through
direct (change in water
temperature and light
availability) and indirect
(increased run-off, siltation,
etc.) impacts.
B3. Biodiversity Impact Monitoring
B3.1 Develop Biodiversity Monitoring Plan

166
Animals
distribution
Increase in
number and
introduction of
new ones
Numbers, or
presence/increase
or
absence depends
General
Observations and
also stories from
the communities.
Can provide early warning of
impacts on species before
changes in numbers become
obvious.
Invasive species
Change in
presence,
location, area,
numbers of
invasive
plant or animal
species
Survey, transect or
results, patrol
reports,
reports from
community
members
Transects or
interviews
The significance of the invasive
species for the biodiversity
values.
Whilst no HCVs have been identified in the project area (see section G1.8 for an evaluation of HCVs in
the project area), the purpose of this HCV monitoring is to make sure that any changes in the identified
HCVs are noticed. Action will be taken in the case that a change is identified, which in turn means that
the requirement to maintain or enhance values can be met.
CARE has developed an initial plan for assessing the effectiveness of measures used to maintain or
enhance High Conservation Values related to globally, regionally or nationally significant biodiversity
(G1.8.1-3) present in the project zone as below.
Management and monitoring
Table 50: Plan for assessing HCV values
Activity Guidance
B3.2 Develop HCV Monitoring Plan

167
G1.8.1: Globally, regionally or nationally
significant concentrations of biodiversity
values, including protected areas,
threatened species, endemic species and
areas that support significant
concentrations of a species during any
time in their lifecycle
Riparian areas protection are significant
because the rivers act as breeding
ground for fish in lake Victoria
Regeneration and ARR is being
encouraged in those areas
Conservation agriculture and
contour/terracing farming is been
protect to support soil erosion control
and reduce siltation into the lake/rivers
G1.8.2: Globally, regionally or nationally
significant large landscape-level areas
where viable populations of most if not all
naturally occurring species exist in natural
patterns of distribution and abundance
Protection of the riparian areas against
degradation.
Control of fires
Control of overgrazing on these areas.
Constantly monitoring through
community leaders
Controlled logging to reduce further
degradation as generations and ARR is
encouraged.
G1.8.3: Threatened or rare ecosystems –
Terminalia forests and their status.
Encourage ARR of T. brownie on farm
and regeneration where possible
especially on the areas bordering
Kisumu and Kericho counties.
Encourage use of thinning and pruning
from other tree species for timber than
cut down T. brownie trees
B3.3 Commit to Monitoring Plan

168
CARE commit to developing a full monitoring plan at the point of project validation and to disseminate
this plan and the results of monitoring to the communities, stakeholders and wider public. This level of
scrutiny will ensure that the monitoring plan is completed to a high standard, with all aspects of
biodiversity effects considered and explored on a consistent basis.
The project uses organized community meetings and community workshops as the most important
dissemination points. These meetings are held at convenient/suitable points and schedules so as to
encourage maximum attendance and participation by the community members. Dissemination is also
done during community planning and review meetings, field days, training sessions and chiefs/assistant
chief’s barazas.
Depending on the kind of information, the project will disseminate information through shared reports
and documentations. Information, Education and Communication (IEC) materials will be developed for
reference and education.

169
Kenya as a nation is just above the threshold for classification as a LDC, with approximately 46% of the
population living below the food poverty line (Kenya Integrated Household Budget Survey, 2006).
However there is significant differentiation between rural and urban areas, with a higher percentage of
people living in poverty in rural environments. The poverty headcount in rural areas is 50%, which is the
percentage necessary for the SACC project to qualify for Gold Level status.
On a local administrative level the Nyando basin is classified primarily as a rural area, with a high
incidence of consumption poverty. This has been estimated at 66% and 65% in two separate studies,
produced by ICRAF and Verchot et al (2008) respectively. Such a high level of poverty indicates that the
area targeted by the SACC project is a low human development zone. The project activities will extend
to households considered very poor on a global scale and beneficiaries of the project will be able to use
the resultant carbon finance to improve social, economic and environmental conditions in the lower and
mid Nyando.
The SACC project aims to extend to more than 50,000 households in the lower and mid Nyando and
aims to include 50% of the poorest members of society in AR activities proposed by CARE, in order for
the project to truly be classified as pro-poor. The well-being rankings in the Lower Nyando showed the
percentage of SACC project participants identified as poor and very poor closely matches the percentage
of the poor and very poor households in the Lower Block. As the project is designed to reach 50% of the
farmers in the target area, it can be assumed that it will reach 50% of the very poor and poor
households in the Lower Block.
VI. GOLD LEVEL SECTION
GL2. Exceptional Community Benefits
GL2.1 Demonstrate the Project Zone is in a Low Human Development Country
GL2.2 Benefits to Poorest Households

170
In Middle Nyando, the participatory well-being rankings show a slight skew towards the participants
classified as middle. The very poor and poor make up a smaller percentage of the SACC project, as
compared to their percentage in the Middle Nyando population.
However, research10 currently underway is identifying the constraints that prevent the very poor from
participating in the Middle Nyando, as well as strategies that communities have used to enable poor and
very poor households to participate. The learning from this research and ongoing impact monitoring
will be incorporated into project activities to meet the goal of reaching 50% of the poorest households.
Table 51: Nyando wealth distribution
Well Being
Category
Estimated % in
Lower Nyando
% of Participants in
Lower Nyando
Estimated % in
Middle Nyando
% of Participants in
Middle Nyando
Very Poor 9.1 10.2 12.54 2.3
Poor 73.6 72.2 51.6 58.7
Middle 17 16.7 28.9 38.0
Rich 1.3 0.85 6.8 1.0
Land availability
Poorer farmers have very small farms. Thus, some smallholders feel that they do not have the room to
plant woodlots or incorporate the required 50 trees within fields. The project is attempting to reduce
this barrier by encouraging smallholders to plant boundary trees, which is, in fact, the most popular
planting configuration. In the future, SACC can organize study visits or field days at very small, well-
organized farms to demonstrate their potential.
Supply of tree seedlings
10
This research was conducted by CCAFS and CARE; participatory methods were used to create 4 well-being categories (specific for Lower and Middle Nyando).
GL2.3 Identifying and Addressing Barriers to Benefits Reaching Poorer Households

171
Although most farmers including the very poor appreciate the benefits of tree-planting a major
constraint to tree-planting by the very poor is access to tree seedlings. They cannot afford to buy
seedlings from commercial suppliers and even the cost of raising them (buying seeds and water during
the dry season) is well beyond their means. For this reason the project has opted to supply each farmer
with up to 100 seedlings free of charge.
Benefit sharing
The risk of poorer farmers failing to get an equitable share of carbon revenues due to elite capture is
being addressed through a strong focus on long term governance structures of the project, ensuring that
poorer, more vulnerable households, and women as a specific social group, are effectively represented
in these governance structures, especially at village level which is the level at which decisions on how
carbon revenues are spent will be made.
Need for Short-Term Benefits
Many of the smallholders in Lower and Mid-Nyando have suggested that they cannot make the long-
term investments in tree-planting as they need to see immediate benefits. The SACC project is
addressing this barrier by integrating an agricultural component to the project which provides farmers
with extension services and experimental quantities of seed for short-term cash crops. Farmers regard
these rapid-return agricultural development activities as a key benefit of the carbon project.
As part of the project design process an ex ante social impact assessment was conducted which included
identification of potential negative social impacts on poorer more vulnerable groups within the
community, and appropriate measures to avoid or mitigate these potential negative impacts.
Potential negative impacts
Distribution of benefits. In most cases men control land and its associated assets hence women
and youth may be marginalized in the sharing of benefits unless strategies are put in place to
ensure equity in distribution of benefits. Activities that are presently in women’s hands (access)
but not in their control and which will start to generate income as a consequence of carbon
GL2.4 Project Impacts on Poor and Vulnerable Individuals and Households

172
sequestration may be taken from them. The type and severity of the present day situation of the
dominance of men over women make this a very likely scenario.
Food production. Food production may be compromised as family resources are channeled
towards tree planting if the returns prove to be good. Food production may be relegated to
leased out farms or sufficient attention may not be given to food production if the returns from
planting trees are deemed good by men.
Reduced demand for labour. If substantial areas that are currently under agriculture are
switched to woodlots demand for agriculture labour may be reduced which could impact on
poorer households who tend to be more dependent on labour as a source of income. It seems
unlikely at this point that this will be a significant risk given that the area of land likely to switch
from agriculture to woodlots is relatively small in relation to the total farmed area, and given
other factors affecting the labour market. Hence rather than develop specific mitigation
measures at this point the project will monitor this risk (e.g through monitoring average labour
rates in the project area versus outside) and develop a response if/when this proves necessary –
for example alternative income generating activities.
Proposed mitigation strategies
Gender relations. The project will include awareness raising activities with both men and
women to encourage change in attitudes to gender defined roles, enabling women to have
greater control over assets and increased influence in decision-making.
Accurate information: It is important that accurate information is provided to community
members on the potential levels of income from carbon so that farmers make informed choices
and avoid inappropriate decisions based on un-realistic expectations
As indicated in the monitoring plan in section CM3.1, the participatory methods that will be used to
monitor social impacts will be applied to separate well-being groups. The community will be sub-divided
into 4 separate groups by well-being/poverty status and the method applied to each group separately.
In the case of questionnaires, well-being indicators will be included in the questionnaire that then allow
for disaggregation of data by well-being group during the analysis.
GL2.5 A Differentiated Approach to Community Impact Modelling

173
It is standard practice in CARE to ensure that M&E takes a differentiated approach that enables
assessment of impacts on poorer households, women and other potentially marginalized groups.
For marginalization we note key socio-cultural characteristics of each project participant (such as gender
or ethinicity).
For poverty status we use one of two approaches:
1. Conduct a well-being ranking in each community so that we are able to identify the well-
being/poverty status of each project participant
2. Include in impact survey questionnaires 2-3 indicators that enable the well-being/poverty status
of the respondent to be determined with an element of triangulation. These indicators are
identified in discussion with local communities and may vary from one village to the next.
CCB does not require details of the project M&E system to be provided at the validation stage but these
details should be provided within 12 months of validation. As noted in the CCB PDD we commit to
developing a full M&E plan included details of key data collection and analytical methods within this 12
month window.
The community impact monitoring approach will be based upon principles described in the following
documents:
World Bank Institute (2005) Introduction to Poverty Analysis [Online]
Available at: http://siteresources.worldbank.org/PGLP/Resources/PovertyManual.pdf [Accessed
06.11.12]
Maxwell , S. and Frankenberger, T. (1992) Household Food Security: Concepts, Indicators, and
Measurements, UNICEF/IFAD
CARE (2002) Household Livelihood Security Assessments: A Toolkit for Practitioners, TANGO
International Inc., Tucson, Arizona
Key data collection and analytical methods outlined in the documents listed above include:

174
Defining an indicator of welfare;
o Process indicators
o Outcome indicators
Resource availability
Relevance and accuracy
Timeliness
Establishing a minimum acceptable standard of that indicator to separate the poor from the non-
poor (the poverty line);
Generating a summary statistic to aggregate the information from the distribution of this welfare
indicator relative to the poverty line;
Selecting user groups
Household Livelihood Security approaches
These sources facilitate the identification of positive and negative impacts on poorer households and
individuals and other disadvantaged groups, such as women.

175
List of Acronyms
AFOLU
AIDs
AR
CARE
CCB
CERs
CDM
CR
EAC
EN
GHG
GPS
HIV
ICRAF
LDC
NBSAP
REDD
TIST
SACC
SOC
VCS
VU
Agriculture, Forestry and Other Land Use
Acquired Immune Deficiency syndrome
Afforestation/Reforestation
Cooperative for Assistance and Relief Everywhere
Climate, Community & Biodiversity
Certified Emission Reductions
Clean Development Mechanism
Critically Endangered
East African Community
Endangered Species
Greenhouse Gas
Geographical Positioning System
Human Immunodeficiency Virus
World Agroforestry Centre
Low Development Country
National Biodiversity Strategy and Action Plan
Reducing Emissions from Deforestation and Forest Degradation in Developing
Countries
The International Small Group and Tree Planting Program
Sustainable Agriculture in a Changing Climate
Soil Organic Carbon
Voluntary Carbon Standard
Vulnerable Species
176
References Andriesse and van der Pouw (1985) Reconnaissance Soil Map of the Lake Basin Development Authority,
Western Kenya. World Soil Information Database. Online. Available at:
http://library.wur.nl/isric/index2.html?url=http://library.wur.nl/WebQuery/isric/6398 (Accessed
September 2011)
Alonso, L., Deichmann, J., McKenna, S., Naskrecki, P. and Richards, J. (Eds.) (2011) Still Counting...:
Biodiversity Exploration for Conservation - The First 20 Years of the Rapid Assessment Program.
Conservation International, USA
Ayaga (2007) Community Perspectives, Challenges and Opportunities to Integrated Ecosystem
Management- Experiences from the Western Kenya Integrated Ecosystem Management Project
Crow (2009) The Springs of Nyando:Water, Social Organization and Livelihoods in Western Kenya
Daas, J (2002) Hydraulic Conductivity measurement in the Katuk-Odeyo Watershed, Western Kenya. Its
distribution over different type of Land use and its implications on hydrological response. World
Agroforestry Centre Publication Series
FAO. (2005) Customary and statutory rights for land use in Nyando basin, Kenya. Online at:
http://www.fao.org/forestry/37249/en/ http://stud.epsilon.slu.se/3658/ (Accessed September 2011)
Harvey and Gonzalez Vilalobos (2007) Agroforestry systems conserve species-rich but modified
assemblages of tropical birds and bats Biodiversity and Conservation, 16, 2257-2292
ICRAF (2003) Improved land management in the Lake Victoria Basin. Online. Available at: Improved land
management in the Lake Victoria Basin (Accessed September 2011)
Kenge (2009) Participatory watershed management to decrease land degradation and sediment
transport in Kagera and Nyando catchments of Lake Victoria basin. Online. Available at:
http://library.wur.nl/isric/index2.html?url=http://library.wur.nl/WebQuery/isric/6398 (Accessed
September 2011)
Kenya National Statistics. Online at: http://www.unicef.org/infobycountry/kenya_statistics.html
(Accessed September 2011)

177
Kung’u, J. and Namirembe, S. (2012) The Nyando Atlas: Mapping out the Ecosystem Condition by Agro
Ecological Landscape of Nyando River Basin, World Agroforestry Centre
Lake Victoria Basin Commission (LVBC) (2011) A Study on Aquatic Biodiversity in the Lake Victoria Basin,
Kenya, ACTS Press, Afircan Centre for Technology Studies, LVBC
Lindell (2011) Sugarcane and agroforestry farming in western Kenya - A comparative study of different
farming systems in the Nyando district. Online. Available at: http://stud.epsilon.slu.se/3658/ (Accessed
September 2011)
Olang, L. and Fürst, J. (2010) Effects of land cover change on flood peak discharges and runoff volumes:
model estimates for the Nyando River Basin, Kenya. Hydrological Processes 25 (1)
Olaka. Integration of RS and GIS to assess human impact on ecosystems change in Nyando Basin, Kenya.
Online. Available at: http://www.pages-igbp.org/products/osmabstracts/OlakaLydia.pdf (Accessed
September 2011)
Mailu (2000) Water hyacinth: an environmental disaster in the Winam Gulf of Lake Victoria and its
control. Water Hyacinth Working Group. Online. Available at:
http://www.oceandocs.net/bitstream/1834/1281/1/IOBC101-105.pdf (Accessed September 2011)
Mbaria, J. (2006) Linking research to extension for watershed management. Online. Available at:
http://www.worldagroforestry.org/water/downloads/publications/Nyando%20book.pdf (Accessed
September 2011)
Ministry of Livestock and Fisheries Development, Department of Livestock Production (2005) Online.
Available at: http://www.livestock.go.ke/ (Accessed September 2011)
Mugo, J. and Tweddle, D. 1997. Preliminary surveys of the fish and fisheries of the Nzoia, Nyando and
Sondu Miriu rivers, Kenya [Online]
Available at: http://aquaticcommons.org/4925/1/9906P106.pdf Accessed: 05.11.12

178
Mungai, D., Swallow, B., Mburu, J., Onyango, L. and Njui, A. (Eds.) (2002) Proceedings of a Workshop on
Reversing Environmental and Agricultural Decline in the Nyando River Basin, World Agroforestry Centre
(ICRAF)
Mungai, D (ed.) (2002) Reversing Environmental and Agricultural Decline in the Nyando River Basin.
Online at:http://www.worldagroforestrycentre.org/downloads/publications/PDFs/pr14285.pdf
(Accessed September 2011)
Ntiba. M. J., Kudoja. W. M and Mukasa. C. T (2001) Management issues in the Lake Victoria watershed,
Lakes and reservoirs. 6: 211-216.
Njuguna (n.d.) Nyando Basin Final report. Western Kenya Integrated Ecosystem Management Project.
Online. Available at:
http://www.worldagroforestry.org/economics_papers/anonymous/WKIEMP/Datasets/Louis%20Verchot
/Envi%20assessment/WKIEMP%20environmental%20assessment.pdf (Accessed September 2011)
Nyakundi (2010) Community perceptions and response to flood risk in Nyando, Western Kenya
Obiero, K., Raburu, P., Okeyo-Owuor, J. and Raburu, E. (2012) Community perceptions on the impact of
the recession of Lake Victoria waters on Nyando Wetlands, Scientific Research and Essays, Vol. 7(16), pp.
1647-1661
Odada, E., Olago, O. and Ochola, W., Eds. (2006) Environment for Development: An Ecosystems
Assessment of Lake Victoria Basin, UNEP/PASS
Ogutu ZA, Misana S, Mwaka V (2005) Land Use Research in the Lake Victoria basin, Analysis and
Synthesis, Inter-University Council for East Africa, Lake Victoria Research (VicRes) Initiative, Eina Jesdak
Consult Business Service Ltd, Kampala, Uganda.
Ongwenyi, G.S et al (1993) Impacts of floods and drought on the development of water resources of
Kenya: case studies of Nyando and Tana catchments. Hydrology of Warm Humid Regions.

179
Onyango et al (2005) Hydronomics and terranomics in the Nyando basin of Western Kenya. Online.
Available at: http://www.nri.org/projects/waterlaw/AWLworkshop/ONYANGO-L.pdf (Accessed
September 2011)
Pagiola (1996) Price policy and returns to soil conservation in semi-arid Kenya. Environmental and
Resource Economics, 8 (3) 225-271
Raburu et al (2006) Impact of agro-industrial activities on the water quality of River Nyando, Lake
Victoria Basin, Kenya. Odada, Eric & Olago, Daniel O. (Ed.) Proceedings of the 11th World Lakes
Conference: vol. 2. p. 307-314
Ramsar (2005) Guidelines for the Rapid Assessment of Inland, Coastal and Marine Wetland Biodiversity,
Wetlands and Water: Supporting Life, Sustaining Livelihoods, Kampala, Uganda, 8-15 November 2005
Reversing Agricultural and Economic Decline in the Nyando River Basin (2002). Online. Available at:
(http://www.worldagroforestrycentre.org/downloads/publications/PDFs/pr14285.pdf/) (Accessed
September 2011)
Richards, M. & Panfil, S.N. (2010) Manual for Social Impact Assessment of Land-Based Carbon Projects.
Version 1. Forest Trends, Climate, Community & Biodiversity Alliance, Rainforest Alliance and Fauna &
Flora International. Washington, DC.
Sang, J.K (2005) Modeling the impact of changes in land use, climate and reservoir storage on flooding in
the Nyando basin. Thesis online. Available at: http://biomath.ugent.be/~ann/Sang_thesis_Nyando.pdf
(Accessed September 2011)
Swallow, B., Onyango, L. and Meinzen-Dick, R. (n.d.) Catchment Property Rights and the Case of Kenya’s
Nyando Basin. Proceedings of the African Regional Workshop on Watershed Management. Online at:
http://www.fao.org/forestry/11734-0d4379d5b6d74256f7244af4f9cdfef46.pdf (Accessed September
2011)

180
Thorlakson (2011) Reducing Subsistence Farmers’ Vulnerability to Climate Change: The potential
contributions of agroforestry in Western Kenya. Online. Available at:
http://www.wcfia.harvard.edu/node/6530 (Accessed September 2011)
Tobella, A.B (2009). Water infiltration in the Nyando River basin, Kenya. Online. Available at:
http://stud.epsilon.slu.se/906/1/Bargues_A_100303.pdf (Accessed September 2011)
Verchot et al (2007) Opportunities for climate change mitigation in agriculture. Online. Available:
http://www.icraf.com/downloads/publications/PDFs/rp15435.pdf (Accessed September 2011)
Verchot, L., van Straaten, O. and Zomer, R. (2007) Pre-feasibility Report Nyando River Watershed, Kenya.
Online. Available at:
http://www.joanneum.at/encofor/casestudies/docs/prefeasibility%20reports/Kenya%20-
%20Nyando%20Prefeasibility_Report.pdf (Accessed September 2011)
Verchot, L., Boye, A. and Zomer, R. (2008) "Baseline report Nyando river basin: Western Kenya
integrated ecosystem management project findings from the baseline surveys," World Agroforestry
Centre, Nairobi, 2008”
Victoria Institute for Research on Environment and Development (VIRED) International (2010). Making
Carbon Finance for Sustainable Agriculture Work for the Poor in Western Kenya (Implemented by CARE
Kenya) Social Impact Assessment Report
World Agroforestry Centre (n.d.) Improved land management in the Lake Victoria Basin. Online.
Available at: http://www.worldagroforestry.org/downloads/publications/PDFs/OP14439.PDF (Accessed
September 2011)
Yanda. P.Z.; Shishira. E. K., F.N. Madulu; and Kauzeni. A. S (2001) Survey and Mapping of Land Use/Cover
and Erosion Hazard in Lake Victoria Basin. Institute of Resource Assessment (IRA) in Collaboration with
Lake Victoria Environmental Management Project (LVEMP) Final Report.
YMEP Kenya. Online. Available at: http://www.rfsu.se/en/Engelska/The-YMEP-web/Programme-
Sites/YMEP-Kenya/ (Accessed September 2011)

181
Annexes
Annexes are not attached to this document but are included as separate documents.
Annex 1. Technical specifications
Annex 2. Historical analysis of land use /land covers changes & definition of eligibility of lands for
afforestation and reforestation activities of the Western Kenya CARE/AFOLU Project
Annex 3. Making Carbon Finance for Sustainable Agriculture Work for the Poor
Annex 4. Social carbon indicators for forest projects
Annex 5 - Indicator Scores and Evidence - Social Carbon