susser holdings corporation burkenroad investment research report (final)
TRANSCRIPT

March 17, 2013
SUSSER HOLDINGS CORPORATION SUSS/NYSE
Continuing Coverage: Susser Holdings Changing its 'Stripes' with Major Spin-Off
Investment Rating: Market Outperform
PRICE: $ 46.88 S&P 500: 1,560.70 DJIA: 14,514.11 RUSSELL 2000: 952.48
Susser Holdings split the wholesale petroleum segment and launched an IPO as a Master Limited Partnership (MLP) under the ticker SUSP.
The offering of the MLP will lower the cost of capital and provide tax benefits.
Susser Holdings develops sophisticated technologies to maximize efficiency and profitability of convenience store operations.
Potential short term income pressure from its aggressive development of new stores.
Texas economy gives Susser Holdings a geographic advantage for continued growth.
Proprietary Laredo Taco Company® in over 60% of the Company’s convenience stores helps drive customer flow.
Our 12-month target price is $61.00. Valuation 2012 A 2013 E 2014 EEPS $ 2.19 $ 1.65 $ 1.77P/E 21.4x 28.4x 26.4x CFPS $ 5.20 $ 5.79 $ 6.45P/CFPS 9.0x 8.1x 7.3x Market Capitalization Stock DataEquity Market Cap (MM): $ 997.84 52-Week Range: $24.61 - $48.15
Enterprise Value (MM): $ 1,318.89 12-Month Stock Performance: 85.96%
Shares Outstanding (MM): 21.29 Dividend Yield: nil
Estimated Float (MM): 17.40 Book Value Per Share: $ 28.226-Mo. Avg. Daily Volume: 14 Beta: 0.52
Company Quick View:
Location: Corpus Christi, Texas Industry: Retail - Convenience Store Description: Susser Holdings Corporation operates convenience stores in Texas, New Mexico, and Oklahoma. The Company is involved in an MLP with Susser Petroleum, which handles the wholesale motor fuel segment. Key Products & Services: Susser owns a selection of brands of fast foods, cigarettes, snacks, and soft drinks sold at its Stripes locations. Branded motor fuels are also sold at these locations. Web Site: www.susser.com
Analysts: Investment Research Manager: Xue Yang Thomas Poe Jingya Zhi Qiqi Huang Spencer Schulz Evan Slazinik Thomas Murphy
The BURKENROAD REPORTS are produced solely as a part of an educational program of Tulane University's Freeman School of Business. The reports are not investment advice and you should not and may not rely on them in making any investment decision. You should consult an investment professional and/or conduct your own primary research regarding any potential investment.
Wall Street's Farm Team
BURK
ENRO
AD R
EPO
RTS

Susser Holdings Corp. (SUSS) BURKENROAD REPORTS (www.burkenroad.org) March 17, 2013
2
STOCK PRICE PERFORMANCE
Figure 1: 5-year Stock Price
Performance
Source: Yahoo! Finance
INVESTMENT SUMMARY
Susser Holdings offers multifunctional convenience stores that combine in-store restaurants and retail gas stations for consumers. We give Susser Holdings a Market Outperform rating. Our 12-month target price is $61.00. We used four valuation methods: discounted free cash flow to firm, discounted free cash flow to equity, EV/Sales multiple, and EV/EBITDA multiple valuation methods.
Susser Holdings has experienced tremendous growth lately, and this growth is likely to continue. The Company recently conducted an initial public offering of Susser Petroleum stock to raise capital from a favorable market valuation of its petroleum subsidiary. This capital will be used to open new stores and pay off high yield bonds callable in May 2013. The offering will also provide tax benefits to Susser Holdings through Susser Petroleum’s structure as a Master Limited Partnership.
Susser Holdings has recently partnered with Apache Corporation to offer natural gas based fuel at two of Susser Holdings’ locations. Although natural gas development is not in Susser Holdings’ immediate plans, it does show the Company’s continued dedication to innovation. The Company also benefits from the growth environment of a relatively strong Texas economy.
Susser Holdings fosters growth by opening new stores as well as by expanding cash flows in its current locations. This growth model exposes the Company to substantial risks, because of significant capital investment and high levels of uncertainty are associated with opening new stores. Although this growth strategy is capital intensive, it is likely that recent corporate developments, along with growth through a recognized brand, will allow the Company to achieve its desired expansion.
Susser Holdings Corp. (SUSS) BURKENROAD REPORTS (www.burkenroad.org) March 17, 2013
3
PREVIOUS BURKENROAD RATINGS AND PRICES
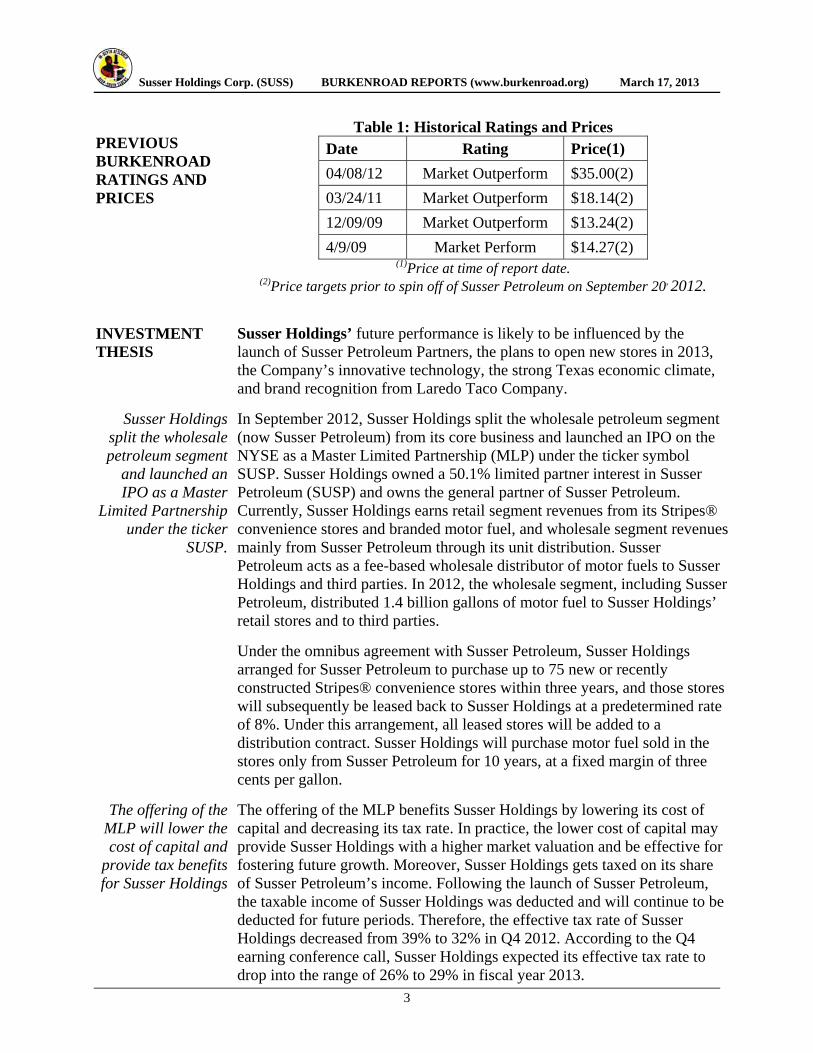
Table 1: Historical Ratings and Prices Date Rating Price(1)
04/08/12 Market Outperform $35.00(2)
03/24/11 Market Outperform $18.14(2)
12/09/09 Market Outperform $13.24(2)
4/9/09 Market Perform $14.27(2) (1)Price at time of report date.
(2)Price targets prior to spin off of Susser Petroleum on September 20, 2012.
INVESTMENT THESIS
Susser Holdings’ future performance is likely to be influenced by the launch of Susser Petroleum Partners, the plans to open new stores in 2013, the Company’s innovative technology, the strong Texas economic climate, and brand recognition from Laredo Taco Company.
Susser Holdings split the wholesale petroleum segment
and launched an IPO as a Master
Limited Partnership under the ticker
SUSP.
In September 2012, Susser Holdings split the wholesale petroleum segment (now Susser Petroleum) from its core business and launched an IPO on the NYSE as a Master Limited Partnership (MLP) under the ticker symbol SUSP. Susser Holdings owned a 50.1% limited partner interest in Susser Petroleum (SUSP) and owns the general partner of Susser Petroleum. Currently, Susser Holdings earns retail segment revenues from its Stripes® convenience stores and branded motor fuel, and wholesale segment revenues mainly from Susser Petroleum through its unit distribution. Susser Petroleum acts as a fee-based wholesale distributor of motor fuels to Susser Holdings and third parties. In 2012, the wholesale segment, including Susser Petroleum, distributed 1.4 billion gallons of motor fuel to Susser Holdings’ retail stores and to third parties.
Under the omnibus agreement with Susser Petroleum, Susser Holdings arranged for Susser Petroleum to purchase up to 75 new or recently constructed Stripes® convenience stores within three years, and those stores will subsequently be leased back to Susser Holdings at a predetermined rate of 8%. Under this arrangement, all leased stores will be added to a distribution contract. Susser Holdings will purchase motor fuel sold in the stores only from Susser Petroleum for 10 years, at a fixed margin of three cents per gallon.
The offering of the MLP will lower the cost of capital and
provide tax benefits for Susser Holdings
The offering of the MLP benefits Susser Holdings by lowering its cost of capital and decreasing its tax rate. In practice, the lower cost of capital may provide Susser Holdings with a higher market valuation and be effective for fostering future growth. Moreover, Susser Holdings gets taxed on its share of Susser Petroleum’s income. Following the launch of Susser Petroleum, the taxable income of Susser Holdings was deducted and will continue to be deducted for future periods. Therefore, the effective tax rate of Susser Holdings decreased from 39% to 32% in Q4 2012. According to the Q4 earning conference call, Susser Holdings expected its effective tax rate to drop into the range of 26% to 29% in fiscal year 2013.
Susser Holdings Corp. (SUSS) BURKENROAD REPORTS (www.burkenroad.org) March 17, 2013
4
Susser Holdings develops
sophisticated technologies to
maximize efficiency and profitability of convenience store
operations.
Throughout its development, Susser Holdings has maintained an innovative business model to stay ahead in the competitive market. In the 1960s, the Company pioneered the “pay-at-the-pump” system to allow customers to buy gas with credit cards. More recently, in November 2012, Stripes LLC, a subsidiary of Susser Holdings, announced a partnership with Apache Corporation to begin selling natural gas at selected Stripes® convenience stores in Texas. Initially, compressed natural gas fueling dispensers will be available at two of Susser Holdings covenience stores. Management does not have any plans to develop natural gas in the near future, but if natural gas were to become relevant in the future Susser Holdings will have an advantage.
Susser Holdings’ innovation also includes the advanced systems the Company created to efficiently manage its convenience stores. The Company has developed technology that helps stop revenue leakages, a major problem in the convenience store industry. The system, called “cashier analysis,” alows for managers to quickly identify the exact moments when an employee theft or error occurred and caused a loss in revenue. Through this technology, a manager can either fire an employee caught pocketing money from sales, or provide additional training.
The Company has also developed sophisticated systems to track customer behavior on a micro level.This technology allows Susser Holdings to cater to customers more direclty than its competitors, because it can detect consumer habits that would have otherwise been too small to notice. This service allows the Company to add substantial value for its customers, and helps build brand loyalty.
Susser Holdings may face short-term
income pressure from its aggressive
development of new stores.
New stores drive Susser Holdings’ cash flow growth, especially as Susser Holdings continues to build larger stores. Before 2000, the Company had only 145 legacy stores, and from 2000 to 2012, the Company built 131 new, larger stores. In fiscal year 2012, the average annual cash flow per old, small store was $294,000, while the average annual cash flow per new, large store was $640,000. The Company plans to open 29-35 stores using the large-store model in 2013. However, opening new stores involves some risk, which could make growth uncertain. The Company has said that it generally takes six months for a new store to be cash flow positive, but in the competitive Texas market there is a chance it could take longer than that. Large capital expenditures and negative cash flows from new stores are likely to affect the Company’s net income in the short term.

Susser Holdings Corp. (SUSS) BURKENROAD REPORTS (www.burkenroad.org) March 17, 2013
5
The Texas economy gives Susser Holdings a geographic
advantage for continued growth.
The Texas economy is currently performing well in relation to that of the rest of the United States. The state unemployment rate, job growth, and automobile sales all indicate that the Texas economy is recovering from the recession. On December 31, 2012, the Texas unemployment rate was 6.1%, which was 1.3% less than 2011 and 1.8% less than the national rate at that time. Also, in 2012 the Texas nonfarm employment was 2.5% higher than 2011. The Texas consumer price index increased 1.5% during 2012, and Texas consumer confidence increased 8% from 2011 to 2012.
Because the Texas economy is doing better than that of the other states, Texans are likely to have more disposable income to spend in convenience stores attached to gas stations, and to purchase new cars. Therefore, Susser Holdings has a chance to increase sales volume. Ultimately, the benefits of the strong Texas economy will make expansion easier for Susser Holdings and will be a driver of revenues in the future.
Proprietary Laredo Taco Company® in
over 60% of the Company
convenience stores helps drive
customer flow.
About 358 of the Stripes® locations offer restaurant services that provide fresh food, primarily under the proprietary Laredo Taco Company® brand. The Laredo Taco Company® offers a variety of Mexican fast food with all fresh ingredients prepared and cooked on site. Laredo Taco Company® has positioned Susser Holdings as a competitive player in the restaurant industry, especially with blue collar workers looking for fast breakfast and lunch options
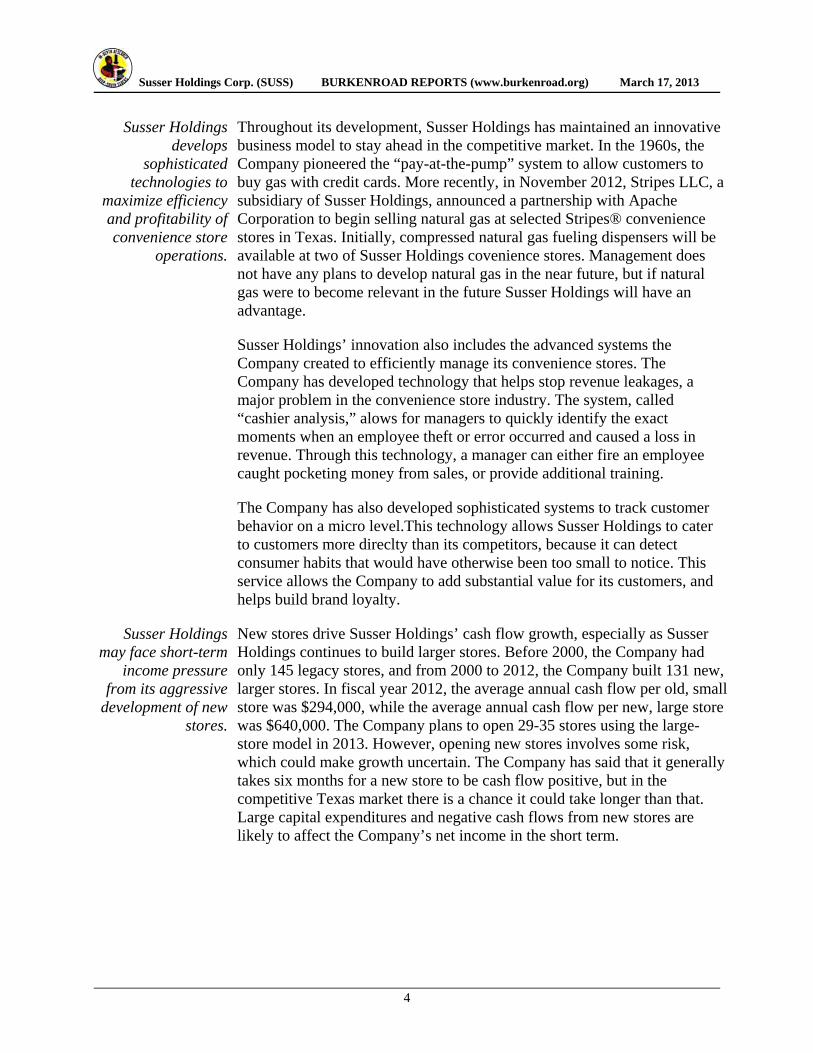
VALUATION We calculated Susser Holdings’ 12-month target price as $61.00. We used four valuation methods: discounted free cash flow to firm, discounted free cash flow to equity, EV/Sales multiple, and EV/EBITDA multiple valuation methods. The detailed valuation is shown in Figure 2.
Susser Holdings, as a convenience store operator with retail gas stations, has stable, although seasonal, revenues and cash flows and the future cash flow is relatively easy to forecast. We used CAPM and WACC to derive Susser Holdings’ cost of capital, plus a 6% liquidity premium, because over 90% of the Company’s floating interest is held by institutional investors. We used both free cash flow to firms (FCFF) and free cash flow to equity (FCFE) to calculate the relative value of the Company, and the result gave similar results (FCFF of $59.21 and FCFE of $62.71).
We also used different market multiples to evaluate Susser Holdings’ relative market position. We decided to use Casey’s, Pantry, and Susser Holdings’ 2012 historical multiples as the comparables. We then used an EV/Sales and EV/EBITDA ratio to calculate the final value of the Company because we think it is important to account for market view of the Company. The final price given by EV/Sales is $60.12 and EV/EBITDA is $61.22.
Susser Holdings Corp. (SUSS) BURKENROAD REPORTS (www.burkenroad.org) March 17, 2013
6
Figure 2: Valuation Results
INDUSTRY ANALYSIS
Susser Holdings Corporation operates in the convenience store (C-store) industry. The Company has the largest combined retail/wholesale footprint in the Southwest, and the largest non-refining motor fuel distributor and C-store operator in Texas.
Continuing Growth Despite the tough economy, U.S. C-stores have benefitted substantially from a large consumer base and a growing retail industry. In 2012, the industry saw two growth strategies: acquisitions (7Eleven, Speedway, Valero, Tesoro, Sunoco) and new-store development (Susser Holdings, Wawa, Casey's General Stores, Kum & Go). The US C-stores Forecast to 2014 expects “U.S. C-store market to expand at a CAGR [compounded annual growth rate] of around 11% during 2011-2014 to reach around $856.5 billion” and expects “that the U.S. working population will climb to the level of 211.9 million by 2014-end.”
In December 2012, Texas added 4,100 nonagricultural jobs and announced an unemployment rate of 6.1%. The unemployment rate has been below the national rate for 72 consecutive months. The Texas home mortgage foreclosure rate was one in every 1,432 mortgages for December 2012, which is substantially better than comparable states. Susser Holdings locates its main business in Texas, and the relatively strong job and housing markets are likely to boost Susser Holdings’ future revenue growth as investors gain confidence in the economy.
Mature Industry Despite promising future growth, Susser Holdings is in a mature industry where growth highly corresponds to that of the general economy. Macro-economic factors, such as GDP growth and the unemployment rate will affect the profitability of this industry. Above-average growth can come from increased market share or acquisitions, but this growth will likely decelerate.

Susser Holdings Corp. (SUSS) BURKENROAD REPORTS (www.burkenroad.org) March 17, 2013
7
Threat of Entry The threat of entry into the C-store industry is high. The barriers to entry for the C-store industry are low because entering requires limited capital investment and time. As of December 31, 2011, there were 148,126 C-stores in the United States, and more than 60% of the C-stores are single stores.
Bargaining Power of Suppliers
For merchandise operations, Susser Holdings provides food, beverage, cigerattes, and other merchandise products. The bargaining power of the suppliers is inversely proportional to the number of suppliers in the industry, and therefore low.
For retail motor fuel operations, Susser Holdings sells Valero branded motor fuel at 60% of its locations, as well as Chevron, Phillips 66, Exxon and Shell. The demand for motor fuel is increasing; consequently, the bargaining power of suppliers is higher in this segment.
Bargaining Power of Buyers
Because of the competitive nature of the industry, consumers usually decide which store to visit first based on its location, and then on prices when stores are near one another. Susser Holdings has the largest combined retail/wholesale footprint in the Southwest, and is the largest non-refining motor fuel distributor and C-store operator in Texas. The Company has a strong and loyal customer base; therefore, the bargaining power of buyers has not been a problem for Susser Holdings.
Availability of Substitutes
Susser Holdings’ substitutes include pharmacies, dollar stores, and grocery stores with a similar variety of merchandise. Restaurants like McDonalds are also substitutes for Susser Holdings’ restaurant, Laredo Taco Company®.
Competitive Rivalry The C-store business is very competitive. A store’s ability to earn a profit depends on competitive pricing, effective merchandising, and a heavily trafficked location. Its competitive position is also dependent on its services. For example, C-stores with a restaurant and a gas station must compete with comparable restaurants while also competing with other motor fuel retailers.
COMPANY DESCRIPTION
Susser Holdings Corporation (SUSS/NYSE) The Company owns and operates Stripes® C-stores and is also majority shareholder of Susser Petroleum Partners LP. Sam Susser and his wife started the Company with two gas stations in Corpus Christi, Texas 75 years ago. Eventually Mr. Susser expanded from retail fuel sales into the wholesale fuel industry by creating Susser Petroleum. The second generation of Sussers, brothers Jerry and Sam J. Susser, joined the Company in the 1960’s and invented the first system for credit card payment at gas pumps. Sam L. Susser, grandson of the founder, joined the Company in 1988, and with his leadership Susser Holdings once again began expanding its retail store segment, starting with the acquisition of 26 C-stores in his first year.

Susser Holdings Corp. (SUSS) BURKENROAD REPORTS (www.burkenroad.org) March 17, 2013
8
On October 24, 2006, Susser Holdings Corporation was formed and completed an initial public offering of $107.25 million on NASDAQ. In the same year, the C-stores were rebranded under the Stripes® name. The Susser Holdings stock transitioned from NASDAQ to the New York Stock Exchange on December 21, 2012.
In September 2012, Susser Holdings sold 49.9% of Susser Petroleum Partners LP, and Susser Petroleum Partners LP became the largest independent wholesale fuel distributor in Texas. Susser Holdings operates the 11th largest company-operated C-store chain in the United States, while still owning 50.1% of Susser Petroleum.
Location The Company’s headquarets are in Corpus Christi, Texas, and it currently operates 559 Stripes® C-stores in Texas, New Mexico, and Oklahoma. The Company has continued its rapid expansion by opening 25 new locations in 2012, and is planning on building between 29 and 35 new stores in 2013.
Figure 3 :Combined Susser Footprint
Source: Susser Holdings Company Website
Operating Segment Susser Holdings contributed most of its wholesale segment into the spin-off MLP in Septemeber 2012. The Company owns the retail business as well as the consignment dealer and fuel transportation part of the wholesale business. Susser Holdings’ C-store operation is known under the Stripes® brand. The Stripes® locations offer food, beverage, and merchandise products as well as branded motor fuel.
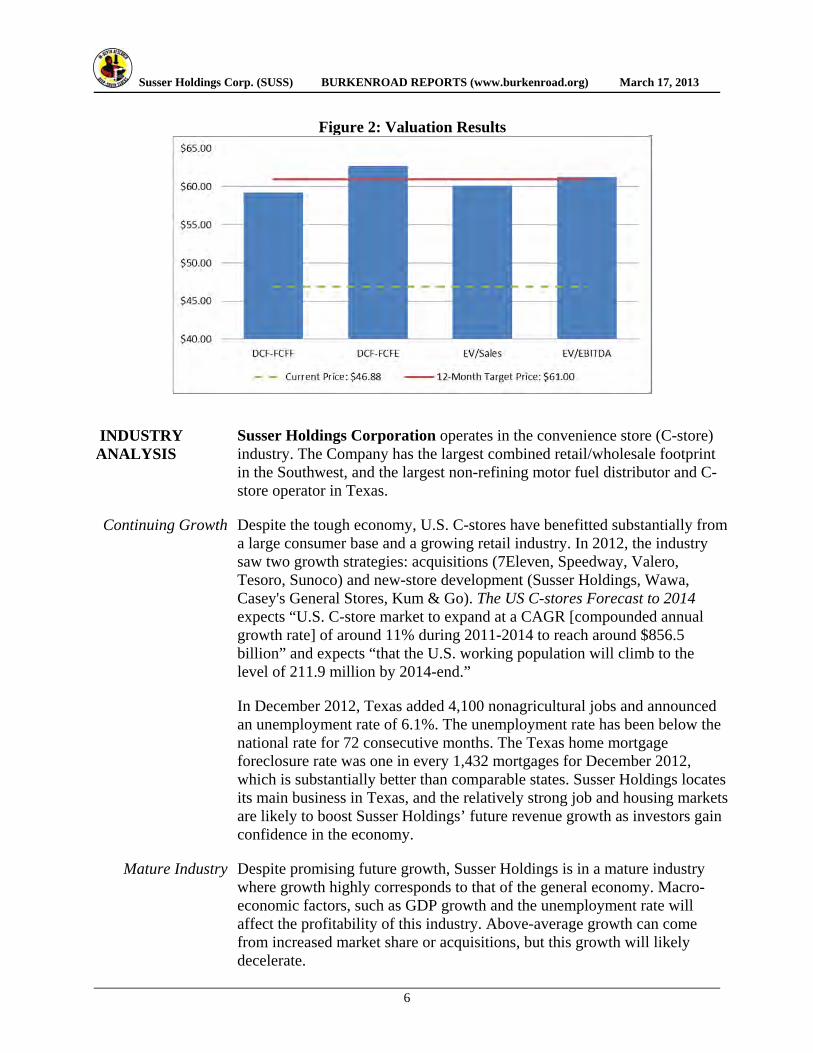
Merchandise sales account for 17% of Susser Holdings’s total revenues, and branded motor fuel retail accounts for 51%. An additional 31% is contributed by the wholesale fuel segment, now controlled by Susser Petroleum.
Susser Holdings Corp. (SUSS) BURKENROAD REPORTS (www.burkenroad.org) March 17, 2013
9
Figure 4: FY2012 Revenue Break Down
Valero brand motor fuel is sold in 60% of the locations. Other brands include Chevron/Texaco, Phillips 66, Exxon, and Shell. As of November 2012, Susser Holdings partnered with Apache Corporation to begin offering natural gas options. Initially only two Stripes® locations in Texas will provide this service.
The Stripes® C-stores sell food, beverage, grocery, and some non-food merchandise. A Laredo Taco Company®, Susser Holdings’ proprietary Mexican restaurant, is found in 340 of the stores. The restaurants prepare Mexican food with fresh ingredients and have become popular breakfast and lunch options, especially with the restaurant’s core customers, male blue-collar workers. The retail segement also includes a variety of Susser Holdings’ proprietary brands including Quake energy drinks, Slush Monkey frozen drinks, and Royal cigarettes, which are the 22nd highst-selling cigarette brand in Texas.
Strategy According to its Q3 2012 report, Susser Holdings will continue to consolidate the operations of Susser Petroleum and gain tax advantages with the MLP system. This new structure lowered the cost of capital for Susser Holdings, as noted in the Q4 2012 earnings call, and illustrates the Company’s strategic mindset. Susser Holdings decided to use part of the cash from the Susser Petroleum IPO to pay off its high yield bonds callable in May 2013. The Company is considering refinancing in the current low cost bond market.
The primary focus for future development is to increase the Company’s presence in existing markets as well as to expand into new ones. Part of this strategy includes a focus on building larger stores to cater to its customers. For example, around 85% of Susser Holdings C-stores are open 24/7, and all but five of the C-stores sell motor fuel.

Susser Holdings Corp. (SUSS) BURKENROAD REPORTS (www.burkenroad.org) March 17, 2013
10
In the retail segment, Susser Holdings has the technology to stock its stores based precisely on its customers’ preferences. The Company avoids making generalizations about these preferences, and instead evaluates each store individually to optimize its merchandise segment. The Company uses this technology to set the prices for each store differently and competitively. For example, in its South-Texas locations, low-priced and Hispanic-inspired flavors influence almost every item in the store, while Houston-based stores provide options for more diverse communities.
To further increase the efficiency of operations, Susser Holdings has a few incentive programs to motivate employees. The Company offers bonuses and promotion opportunities for the Stripes® location managers who succefully improve store performance. The Company also provides opportunities for its employees to buy stock shares.
Competition The business model of Susser Holdings is divided among three segments, all of which operate in highly competitive markets: branded motor fuel retail, merchandise retail, and in-store restaurant options.
This branded fuel retail segment competes with other large operators selling major oil brands like Exxon and Shell, as well as smaller gas station chains. As a result, Susser Holdings has very little pricing power. Oil price fluctuations also decrease pricing power.
As a market leader, Susser Holdings can purchase goods at a discount. Susser Holdings earns the highest margins in its retail goods segment, because the Company has a competitive advantage as the largest gas station operator in the region.
Susser Holdings’ in-house restaurant, Laredo Taco Company®, competes with fast-food restaurants, as well as local Mexican restaurants. This market benefits from high demand, but it is constrained by its large number of players.
Latest Developments
On September 25, 2012, Susser Holdings split the wholesale segment and launched an IPO on the NYSE as a Master Limited Partnership (MLP). Following the partnership’s IPO, Susser Holdings granted Susser Petroleum Partners LP (SUSP) the right to lease 75 newly constructed stores to Susser Holdings at an annual rate of 8.0% for 15 years. In addition, Susser Petroleum can acquire up to 75 newly constructed C-stores and earn a profit margin of $0.03 per gallon of fuel sold in these stores for 10 years. Given the real estate partnership between the two companies, more acquisitions are expected to be completed in 2013.
In November 2012, Susser Holdings announced the addition of natural gas fueling dispensers at two Stripes® C-stores in Texas. Natural gas is a fast-growing green alternative to standard motor fuel, and could potentially play a more important role for Susser Holdings in the future.

Susser Holdings Corp. (SUSS) BURKENROAD REPORTS (www.burkenroad.org) March 17, 2013
11
On December 21, 2012, Susser Holdings transferred its common stock listing to NYSE from NASDAQ, under the ticker symbol SUSS. Susser Holdings made this transition because of its growing operations and continued expansion. Susser Holdings and Susser Petroleum are both traded on the same stock exchange.
During 2012, Susser Holdings built 25 new retail stores, and in Q4 2012 opened 10 new Stripes® C-stores. There are 11 C-stores still under constrction, and Susser Holdings continues to build larger convenience stores. The last 18 newly built stores averaged about 6,200 square feet with an average of 10 motor fuel dispensers.
PEER ANALYSIS We identify The Pantry Inc. and Casey’s General Stores Inc. as peers for Susser Holdings. Although the two companies are not close competitors, both are in the C-store industry and are comparable in company size and market position.
Table 2 compares the three companies’ Market Capitalization, Price-to-Earnings ratio, EBITDA Margin, Debt-to-Equity ratio, Dividend Yield, Return on Equity, and Earnings per Share. Susser Holdings’ EBITDA Margin falls in the middle of its peers, demonstrating that the operating expenses are hurting earnings. Susser Holdings’ earnings per share is lower than Casey’s, but that is likely because Casey’s is a larger and more established company. Susser Holdings is financing its growth responsibly, as demonstrated by its 163.8% Debt/Equity ratio.
Table 2: Peer Ratio Analysis
Company Market
Cap. P/E EBITDA % D/E Dividend % ROE EPS
Susser Holdings 87,989 20.95 2.87 163.8 -- 13.16 1.99
Pantry 29,432 37.86 2.4 313.48 -- 2.32 0.33
Casey's 208,664 18.81 4.44 117.6 1.21 21.36 2.9
Source: Reuters, January 30, 2013
Casey’s General Store Inc.
(CASY/NASDAQ)
Casey’s General Store is a Midwestern C-store operator with a business model similar to Susser Holdings. Casey’s operates 1,700 retail fuel and C-stores primarily in Illinois, Missouri and Iowa, and offers its own proprietary brands of pizza, sandwiches, and donuts.
The Pantry Inc. (PTRY/NASDAQ)
The Pantry Inc., widely known by the Kangaroo® brand, also operates on the same business model as Susser Holdings, but without the proprietary restaurant brand. Instead, it operates in-store locations of many popular fast-food franchises, such as Hardees, Subway, and Dairy Queen.

Susser Holdings Corp. (SUSS) BURKENROAD REPORTS (www.burkenroad.org) March 17, 2013
12
MANAGEMENT PERFORMANCE AND BACKGROUND
In order to quantify the performance of Susser Holdings’ upper management, we compared the Company’s return on invested capital (ROIC) to that of its industry peers. This ratio measures how much value a company’s capital is generating for shareholders, and is measured by subtracting dividends from net income and dividing that figure by a company’s total capital.
Susser Holdings’ average return on invested capital is stronger than that of The Pantry Inc. This difference in returns shows favorably for Susser Holdings, especially because The Pantry operates with much more leverage, which is not adjusted for in the ratio. Investors should demand higher return from a riskier and more highly levered company, and our ROIC analysis shows that The Pantry had a downward return from 2008 to 2012. Susser Holdings’ return on invested capital is lower than that of Casey’s General Store, which returned an average of over 12% from 2008 to 2012. This seems to indicate that Casey’s General Store is using its capital more efficiently than Susser Holdings.
Table 3: Return on Invested Capital Company 2012 2011 2010 2009 2008 Average
Susser Holdings 10.35% 9.72% 1.49% 3.69% 6.39% 6.33%
Casey 15.22% 13.56% 13.03% 9.26% 9.77% 12.17%
Pantry 3.55% 4.14% -7.14% 6.73% 4.50% 2.36%
Source: ThomsonOne, February 19, 2013
Sam L. Susser President and Chief Executive Officer (49) Sam L. Susser is president and chief executive officer of Susser Holdings Corporation and has been with his family business since 1992. Prior to working at the wholesale petroleum segment at Susser, Mr. Susser founded Southguard Corporation in 1988, which was the predecessor to Susser Holdings Corp. He worked at Salomon Brothers in corporate finance and mergers and acquisitions from 1985 to 1988, after graduating from the University of Texas at Austin with a bachelor’s degree in business administration in finance.
Rocky B. Dewbre President and Chief Operating Officer – Wholesale (47) Rocky B. Dewbre was appointed president and chief operating officer of the wholesale division of Susser Holdings in January 2005. Mr. Dewbre has been with Susser Holdings since 1992, when he came on as manager of finance and administration. He also worked four years at the accounting firm Deloitte & Touche as an auditor and consultant. He earned a bachelor of business administration in accounting/management information systems at Texas Tech in Lubbock, Texas and earned his MBA from the University of Texas at Austin.

Susser Holdings Corp. (SUSS) BURKENROAD REPORTS (www.burkenroad.org) March 17, 2013
13
Steven C. DeSutter President and Chief Executive Officer – Retail (59) Steve DeSutter is president and chief executive officer of the retail division of Susser Holdings, a position he has held since joining the Company in June 2008. Before Susser Holdings, Mr. DeSutter worked at TurnWorks Inc., a private equity firm, as executive vice president, and as vice president of operations for QIP Holder, a parent company of the Quiznos franchise. From 2004 to 2006, he was part of the Burger King Corporation, eventually holding the position of executive vice president of Europe and the Middle East. Prior to these positions, he worked with British Petroleum for 18 years in operations, finance, and accounting. He earned a bachelor of science in commerce at Niagara University in New York.
Mary E. Sullivan Executive Vice President, Chief Financial Officer, and Treasurer (56) Mary E. Sullivan is executive vice president, chief financial officer, and treasurer of Susser Holdings and has been with the Company since 2000. She is a CPA, CFA, and CMA. Prior to taking over the responsibility for finance and accounting at Susser Holdings, Ms. Sullivan was director of finance for the City of Corpus Christi, Texas. She graduated from Texas A&M University – Corpus Christi earning a bachelor’s degree in mathematics, an MBA, and a master of science in computer science.
E. V. (Chip) Bonner Jr.
Executive Vice President & General Counsel (57) Chip Bonner Jr. was appointed executive vice president and general counsel of Susser Holdings in 2000. Before coming to Susser Holdings, Mr. Bonner worked at Corpus Christi-based law firm Porter, Rogers, Dahlman & Gordon for 19 years. He earned his bachelor of science at Trinity University in San Antonio with specializations in finance and accounting, and his J.D. at St. Mary’s University School of Law in San Antonio.
Board of Directors Susser Holdings’ board of directors is a six member group, including: Sam L. Susser (president and chief executive officer), Bruce W. Krysiak (director and non-executive chairman since 2000), Armand S. Shapiro (director and chair of the audit committee), Sam J. Susser (director and former chairman), David P. Engel (independent director and long-term investor), and Ronald G. Steinhart (independent director).
Management Incentives
A committee of at least three independent directions determines the Management compensation for Susser Holdings. To determine compensation, the committee looks at company performance, individual performance, and the compensation levels of comparable peers.
Susser Holdings’ management compensation follows a “share” philosophy. In the 2012 Proxy Statement, the Company revealed that its 2011 and 2012 target compensation levels are more heavily weighted toward performance-based and long-term equity incentive compensation than peer compensation levels. According to Susser Holdings’ CFO, the Company currently plans to continue to offer performance based restricted stock options to higher management.
Susser Holdings Corp. (SUSS) BURKENROAD REPORTS (www.burkenroad.org) March 17, 2013
14
SHAREHOLDER ANALYSIS
Susser Holdings Corporation (SUSS/NYSE) had 20.76 million shares outstanding with a market capitalization of $884 million as of February 4, 2013. The Company’s shareholders are mainly institutional investors (80.16%) with one large private investor. The CEO and president, Sam Susser, holds about 11% of the shares outstanding. One institution (FMR LLC) owns over 5% of the shares. The general market opinion is that Susser Holdings is a growth stock rather than a value stock.
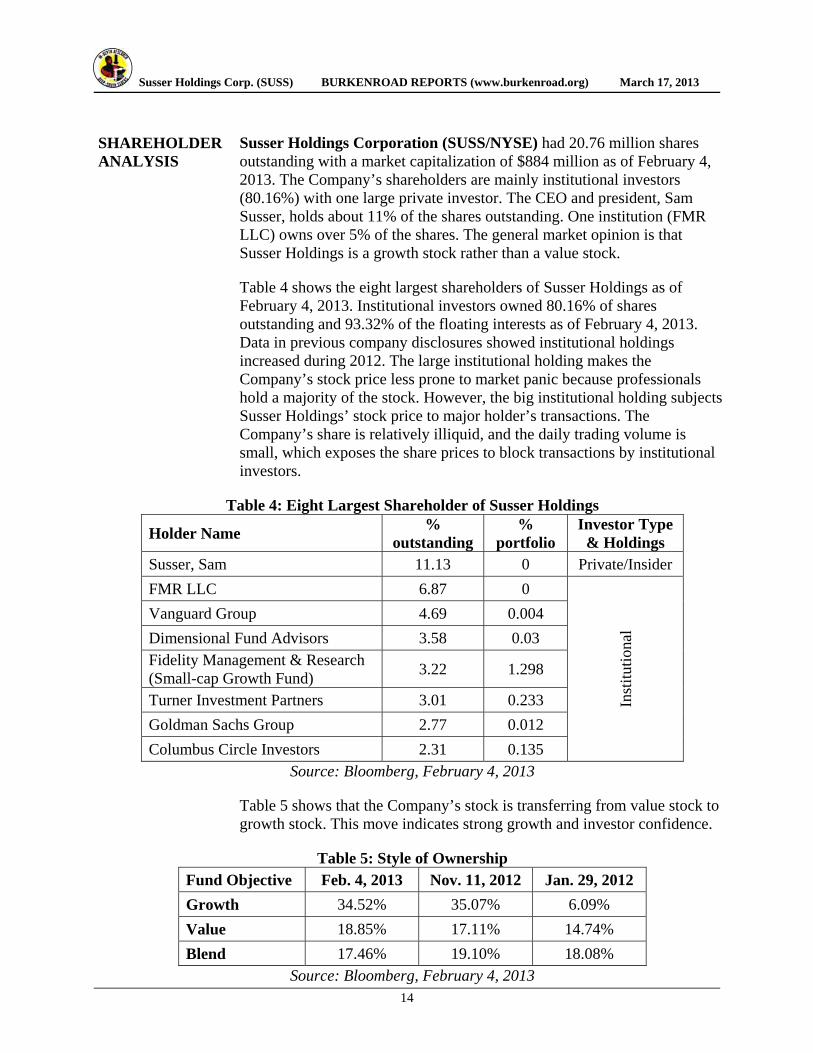
Table 4 shows the eight largest shareholders of Susser Holdings as of February 4, 2013. Institutional investors owned 80.16% of shares outstanding and 93.32% of the floating interests as of February 4, 2013. Data in previous company disclosures showed institutional holdings increased during 2012. The large institutional holding makes the Company’s stock price less prone to market panic because professionals hold a majority of the stock. However, the big institutional holding subjects Susser Holdings’ stock price to major holder’s transactions. The Company’s share is relatively illiquid, and the daily trading volume is small, which exposes the share prices to block transactions by institutional investors.
Table 4: Eight Largest Shareholder of Susser Holdings
Holder Name %
outstanding %
portfolio Investor Type
& Holdings Susser, Sam 11.13 0 Private/Insider
FMR LLC 6.87 0
Inst
itut
iona
l Vanguard Group 4.69 0.004
Dimensional Fund Advisors 3.58 0.03 Fidelity Management & Research (Small-cap Growth Fund)
3.22 1.298
Turner Investment Partners 3.01 0.233
Goldman Sachs Group 2.77 0.012
Columbus Circle Investors 2.31 0.135 Source: Bloomberg, February 4, 2013
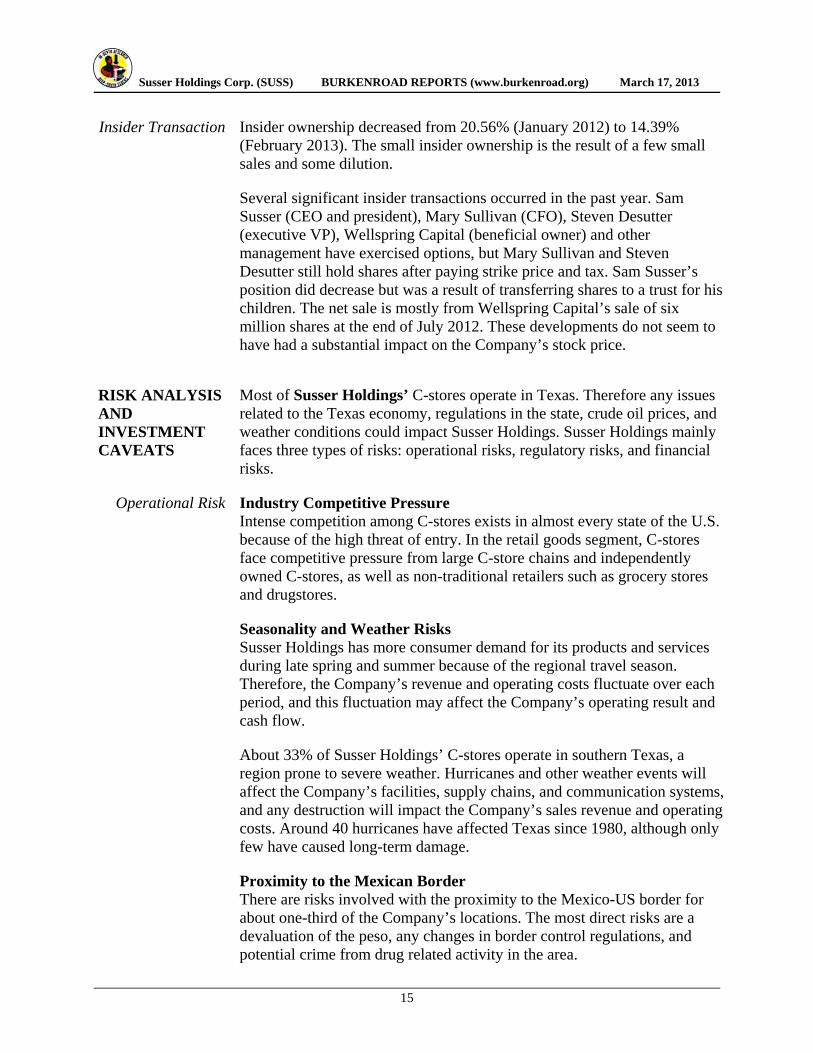
Table 5 shows that the Company’s stock is transferring from value stock to growth stock. This move indicates strong growth and investor confidence.
Table 5: Style of Ownership Fund Objective Feb. 4, 2013 Nov. 11, 2012 Jan. 29, 2012
Growth 34.52% 35.07% 6.09%
Value 18.85% 17.11% 14.74%
Blend 17.46% 19.10% 18.08% Source: Bloomberg, February 4, 2013
Susser Holdings Corp. (SUSS) BURKENROAD REPORTS (www.burkenroad.org) March 17, 2013
15
Insider Transaction Insider ownership decreased from 20.56% (January 2012) to 14.39% (February 2013). The small insider ownership is the result of a few small sales and some dilution.
Several significant insider transactions occurred in the past year. Sam Susser (CEO and president), Mary Sullivan (CFO), Steven Desutter (executive VP), Wellspring Capital (beneficial owner) and other management have exercised options, but Mary Sullivan and Steven Desutter still hold shares after paying strike price and tax. Sam Susser’s position did decrease but was a result of transferring shares to a trust for his children. The net sale is mostly from Wellspring Capital’s sale of six million shares at the end of July 2012. These developments do not seem to have had a substantial impact on the Company’s stock price.
RISK ANALYSIS AND INVESTMENT CAVEATS
Most of Susser Holdings’ C-stores operate in Texas. Therefore any issues related to the Texas economy, regulations in the state, crude oil prices, and weather conditions could impact Susser Holdings. Susser Holdings mainly faces three types of risks: operational risks, regulatory risks, and financial risks.
Operational Risk Industry Competitive Pressure Intense competition among C-stores exists in almost every state of the U.S. because of the high threat of entry. In the retail goods segment, C-stores face competitive pressure from large C-store chains and independently owned C-stores, as well as non-traditional retailers such as grocery stores and drugstores.
Seasonality and Weather Risks Susser Holdings has more consumer demand for its products and services during late spring and summer because of the regional travel season. Therefore, the Company’s revenue and operating costs fluctuate over each period, and this fluctuation may affect the Company’s operating result and cash flow.
About 33% of Susser Holdings’ C-stores operate in southern Texas, a region prone to severe weather. Hurricanes and other weather events will affect the Company’s facilities, supply chains, and communication systems, and any destruction will impact the Company’s sales revenue and operating costs. Around 40 hurricanes have affected Texas since 1980, although only few have caused long-term damage.
Proximity to the Mexican Border There are risks involved with the proximity to the Mexico-US border for about one-third of the Company’s locations. The most direct risks are a devaluation of the peso, any changes in border control regulations, and potential crime from drug related activity in the area.
Susser Holdings Corp. (SUSS) BURKENROAD REPORTS (www.burkenroad.org) March 17, 2013
16
Fluctuation of Motor Fuel Prices In 2012, 51% of the Company’s total revenue came from the branded motor fuel sales. Thus, the volatility of motor fuel prices directly impacts the Company’s revenues and profits. Rising gas prices may also discourage customers from making purchases inside the C-stores. That impact on merchandise sales is shrinking, however, as the Company continues to build large stores that are able to drive customer flow independent from motor fuel demand.
Risk of Change in Relationship with Principle Suppliers Susser Holdings purchases more than 28% of the merchandise products from McLane and most of the Laredo Taco Company® restaurants’ ingredients from Labatt. Susser Holdings relies on these two principal suppliers to provide merchandise and ingredients and support its daily operation. A change in their relationship could severely impact the Company’s business.
Regulatory Risk The C-store industry is subject to regulatory changes, primarily real estate and environmental regulations. Federal and state laws and regulations regarding alcohol and cigarette sales, employee healthcare and social benefits, and merger and acquisitions could impact the revenues of Susser Holdings.
Changes in Legislation and Regulation As the Company stated in its Q4 2012 earnings conference call, the Obama healthcare reform will not have a material impact until 2014, but Susser Holdings is planning for the future. The Company needs to decide how it will finance those expenses, likely either through increasing spending or decreasing its staff.
The Patient Protection and Affordable Care Act (PPACA) also creates problems for Susser Holdings. This Act requires C-stores with restaurants to place specific nutritional information on menus. This could be costly and negatively impact sales.
Environmental Regulations Federal and state regulations regarding underground storage tanks may require significant expenditures in the future if the Company decides to upgrade, modify, or replace its tanks and piping. Although Susser Holdings believes it is in material compliance with all applicable regulatory requirements, the regulatory requirements are subject to change, and could require additional expenditures in the future.
Financial Risk: We used three ratios to evaluate the financial risk of Susser Holdings: the solvency ratio, the current ratio, and the quick ratio. The solvency ratio uses a company’s net income with depreciation added back to evaluate a company’s earnings against its liabilities.

Susser Holdings Corp. (SUSS) BURKENROAD REPORTS (www.burkenroad.org) March 17, 2013
17
The current ratio evaluates a company’s liquidity and ability to cover its short term liabilities. The quick ratio is a similar concept, but it removes the effects of inventories from a company’s current assets.
Susser Holdings’ current and quick ratios are solid, and have improved significantly since 2010. However, the large difference between the Company’s quick ratio and current ratio shows that inventories make up a significant portion of Susser Holdings’ liquid assets. It could make the Company less financially stable in the future should liquidity issues arise.
Table 6 : Historical ratios of Susser Holdings 2010-YE 2011-YE 2012-Q1 2012-Q2 2012-Q3
Quick Ratio 0.705 1.110 1.015 1.059 2.343
Current Ratio 1.177 1.618 1.473 1.537 2.768
Solvency Ratio 0.064 0.125 0.015 0.053 0.02 Source: Susser Holdings
Table 7 shows a comparison between Susser Holdings and its two peers for the year. Although Susser Holdings is average in terms of long-term solvency (interest coverage and D/E ratio), it has much better liquidity than its peers (shown by the quick ratio and current ratio).
Table 7: Ratio Analysis Against Comparable Companies Susser Holdings Casey Pantry
Quick Ratio 1.01 0.25 0.48
Current Ratio 1.62 0.91 0.99
Interest Coverage Ratio 2.80 6.10 1.07
Debt/Equity Ratio 134.75 134.11 313.48 Source: Bloomberg
Altman Z-Score The Altman Z-Score is a method used to evaluate the credit risk of a public company. The Z-Score uses balance sheet and income statement items, such as current assets, current liabilities, retained earnings, EBIT and sales. A score of 1.8 or below indicates a strong possibility of bankruptcy within two years, a score between 1.8 and 2.99 indicates a moderate possibility of bankruptcy within two years, and a score greater than 3 indicates low bankruptcy risk.
Susser Holdings has been in the safe zone from 2009 to 2012, and the Z-Score is steadily improving. As shown in Table 8, Susser Holdings and its two peers, Casey’s General Store Inc. and The Pantry Inc., are all in the safe zone. Susser Holdings seems to have done a better job because its Z-Score is improving at a faster rate than Pantry’s.

Susser Holdings Corp. (SUSS) BURKENROAD REPORTS (www.burkenroad.org) March 17, 2013
18
Table 8: Z-score Comparison Company 2009 2010 2011 2012
Susser Holdings 3.98 4.60 5.51 5.87
Casey 6.92 4.90 5.70 N.A.
Pantry 4.29 4.99 5.34 N.A.
FINANCIAL PERFORMANCE AND PROJECTIONS
We based our projections on various assumptions regarding operations, investing, and financing.
Operating Assumptions
We used a multifactor regression for the next eight quarters’ revenue of both the retail and wholesale segments. From the regression results based on the previous seven years, we found that diesel price is the key driver of fuel revenue. If the diesel price deviates too far from the EIA short-term forecast, the revenue projection may fall short, and we assume a downward trend in diesel prices. We also assume all other drivers (retail gallons sold, number of stores and seasonality) will not see significant changes in the near future, and there will not be any extraordinary events, like hurricanes or major consolidations.
Investing Assumptions
We assume Susser Holdings’ future investment activities will be focused on filling existing markets by building more and larger stores. We also assume that Susser Holdings will continue with its current strategy of dropping stores down to Susser Petroleum and leasing them back.
Financing Assumptions
We assume Susser Holdings will finance its business using the recent proceeds from the Susser Petroleum IPO and the increased cash flows resulting from the decreased effective tax rate. We also assume the Company is going to pay off its high yield bonds callable on May 2013, and refinance with a revolver line of credit thereafter. Our projection shows that Susser Holdings is generating enough cash flow to pay down all the debt without a need for external cash.
SITE VISIT On March 15, 2013, our team was up early to catch a 6 a.m. flight to Corpus Christi to meet with Susser Holdings management. CFO Mary Sullivan greeted us in the lobby at Susser Holdings headquarters to begin our day. The first two hours were spent going through a presentation on the Company’s latest performance report. Sullivan then introduced us to Jessica Garcia and Chris Switzer, who are part of the team that decides what to carry in each store based on customers’ buying habits.
Susser Holdings Corp. (SUSS) BURKENROAD REPORTS (www.burkenroad.org) March 17, 2013
19
After the presentation, we went to look at Stripes® locations. First we toured an older, smaller store, and then we moved on to the larger store format that the Company is now using. For lunch we were finally able to try the Laredo Tacos, which were definitely as fresh and authentic as advertised. We were there during lunch hour, and the crowd lining up to purchase the food made it clear how important this segment is for driving customer flow. After lunch we sat and discussed how the Company uses data tracking to efficiently keep the stores stocked, and how it develops its many proprietary brands, like Royal Cigarettes, to match customers’ preferences.
We then all headed back to the office. Garcia and Switzer headed back to work, and financial analyst Blake Overall joined Ms. Sullivan for a few hours of Q&A during which we learned more about the Company’s plans for future stores and clarified some confusions we had regarding the MLP structure. After that, Mr. Overall took us on a brief tour of the IT department, which powers the Company’s data tracking technology.
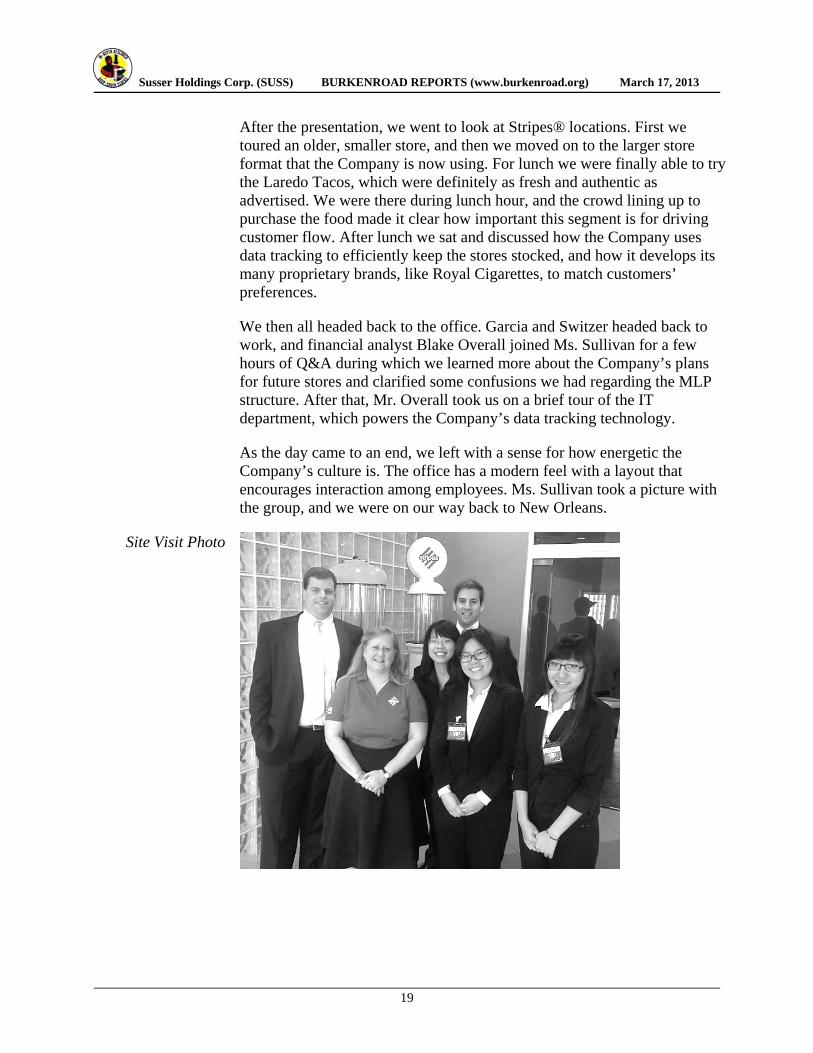
As the day came to an end, we left with a sense for how energetic the Company’s culture is. The office has a modern feel with a layout that encourages interaction among employees. Ms. Sullivan took a picture with the group, and we were on our way back to New Orleans.
Site Visit Photo

Susser Holdings Corp. (SUSS) BURKENROAD REPORTS (www.burkenroad.org) March 17, 2013
20
INDEPENDENT OUTSIDE RESEARCH
Our team contacted a financial analyst who works for a market research firm. His report was based on Susser’s Q3 FY12. In his report, he talks about the target price of the Company and the method he used to value the Company. For investment risk, he mentioned areas that deserve special attention, including volatility in crude oil and wholesale petroleum costs, supplier relationships, wholesale costs and taxes related to tobacco products, credit and debit card fees legislation, and seasonality and adverse weather conditions.
We also reached out to an equity analyst who has been working with Susser Holdings since its IPO in 2006. He offered insight into which companies to consider the peers of Susser Holdings, including Casey’s General Stores (CSY) and The Pantry (PTRY), both companies that operate restaurants with C-stores. He also mentioned WaWa and Sheetz, two private companies with a significant presence in the C-store market in the Northeast and Southeast. He also grouped Susser Holdings with WalMart (WMT) when considering motor fuel sales in Texas, as well as Murphy USA, a subsidiary of Murphy Oil Corporation (MUR) that operates many of the C-stores attached to WalMart gas stations.
The analyst also offered his information regarding Susser Holdings’ recent partnership with Apache Corporation. He confirmed our belief that this is a long-term innovation and that it is unlikely to have any immediate effects for this report because of the high cost of infrastructure necessary to accommodate natural gas at pumping stations.
We visited the Susser Holdings headquarters in Corpus Christi, Texas to further our insight of the Company’s operations. During the trip we met with Company employees, including CFO Mary Sullivan.
The Susser Holdings website, and financial publications including Bloomberg, also proved to be helpful resources during our research.
Susser Holdings Corp. (SUSS) BURKENROAD REPORTS (www.burkenroad.org) March 17, 2013
21
WWBD? What Would Ben (Graham) Do?
BEN GRAHAM ANALYSIS (slightly modified)
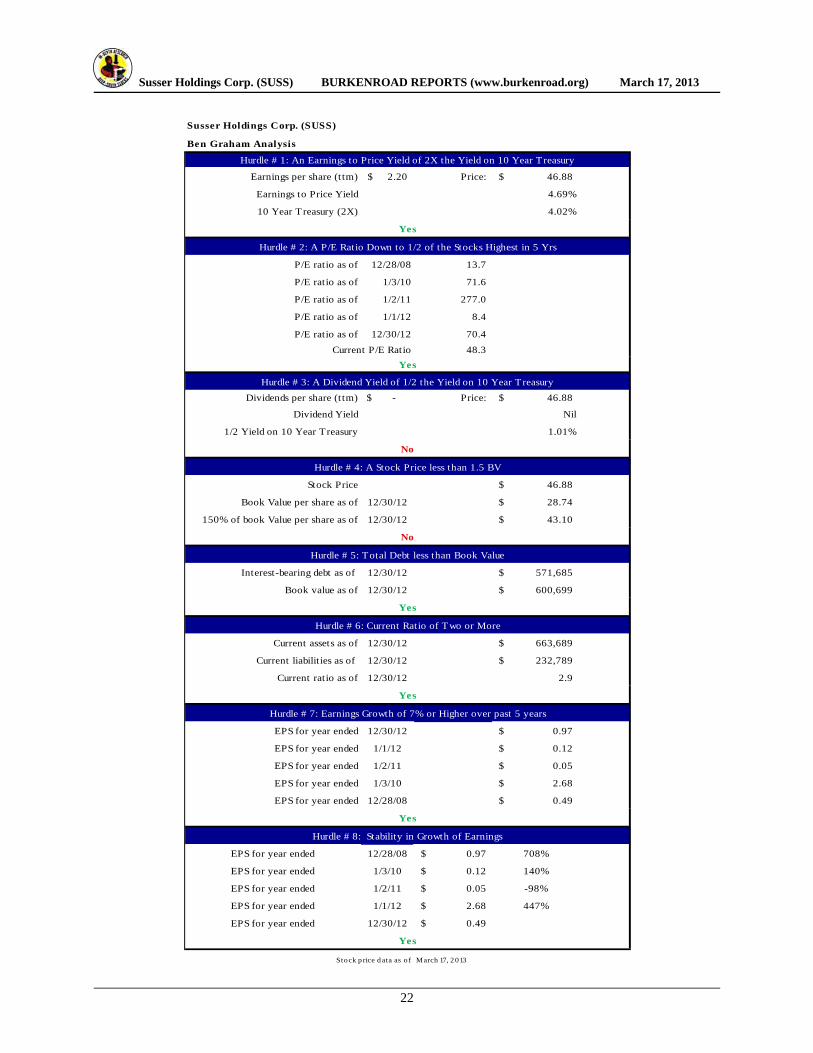
Benjamin Graham, a source of inspiration for Warren Buffet and often referred to as “the father of value investing,” developed a method of equity analysis that uses ten key statistics to evaluate a security. Our modified Burkenroad Ben Graham Analysis uses eight of these statistics to evaluate the attractiveness of an investment in Susser Holdings. The eight categories construct a risk/reward barrier with the first four concerning the relative price with respect to earnings, and the rest measuring risks.
Susser Holdings satisfies six of the eight categories in our Ben Graham Analysis based on current company and market data. The one category the Company does not satisfy, dividend yield, should not be a red flag for investors because the Company is experiencing a growth stage. We can report that the Company now satisfies the earnings stability category—a category it has not satisfied in previous years. (The complete data set used in the Ben Graham Analysis can be seen in the following table.).
Susser Holdings Corp. (SUSS) BURKENROAD REPORTS (www.burkenroad.org) March 17, 2013
22
Earnings per share (t tm) 2.20$ Price: 46.88$
Earnings to Price Yield 4.69%
10 Year T reasury (2X) 4.02%
P/E ratio as of 12/28/08 13.7
P/E ratio as of 1/3/10 71.6
P/E ratio as of 1/2/11 277.0
P/E ratio as of 1/1/12 8.4
P/E ratio as of 12/30/12 70.4
Current P/E Ratio 48.3
Dividends per share (t tm) -$ Price: 46.88$
Dividend Yield Nil
1/2 Yield on 10 Year Treasury 1.01%
Stock Price 46.88$
Book Value per share as of 12/30/12 28.74$
150% of book Value per share as of 12/30/12 43.10$
Interest-bearing debt as of 12/30/12 571,685$
Book value as of 12/30/12 600,699$
Current assets as of 12/30/12 663,689$
Current liabilit ies as of 12/30/12 232,789$
Current ratio as of 12/30/12 2.9
EPS for year ended 12/30/12 0.97$
EPS for year ended 1/1/12 0.12$
EPS for year ended 1/2/11 0.05$
EPS for year ended 1/3/10 2.68$
EPS for year ended 12/28/08 0.49$
EPS for year ended 12/28/08 0.97$ 708%
EPS for year ended 1/3/10 0.12$ 140%
EPS for year ended 1/2/11 0.05$ -98%
EPS for year ended 1/1/12 2.68$ 447%
EPS for year ended 12/30/12 0.49$
Stock p rice d ata as o f March 17, 2 013
Hurdle # 2: A P/E Ratio Down to 1/2 of the Stocks Highest in 5 Yrs
Yes
Susser Holdings Corp. (SUSS)
Ben Graham Analysis
Hurdle # 1: An Earnings to Price Yield of 2X the Yield on 10 Year Treasury
Yes
Hurdle # 3: A Dividend Yield of 1/2 the Yield on 10 Year Treasury
Yes
No
Hurdle # 4: A Stock Price less than 1.5 BV
No
Hurdle # 5: Total Debt less than Book Value
Hurdle # 7: Earnings Growth of 7% or Higher over past 5 years
Yes
Hurdle # 8: Stability in Growth of Earnings
Yes
Hurdle # 6: Current Ratio of Two or More
Yes

Su
sser
Hol
din
gs C
orp
. (S
US
S)
BU
RK
EN
RO
AD
RE
PO
RT
S (
ww
w.b
urk
enro
ad.o
rg)
Mar
ch 1
7, 2
013
23
Susse
r H
old
ing
s C
orp
. (S
US
S)
Ann
ual a
nd Q
uart
erly
Ea
rnin
gs
36
4 d
ay
36
4 d
ay
36
4 d
ay
36
4 d
ay
36
4 d
ay
In th
ou
sa
nd
sp
eri
od
en
de
dp
eri
od
en
de
dp
eri
od
en
de
dp
eri
od
en
de
dp
eri
od
en
de
d
Fo
r th
e p
eri
od
en
de
d 2
01
0 A
20
11
A 2
01
2 A
31
-Ma
r-1
3 E
30
-Ju
n-1
3 E
29
-Se
p-1
3 E
29
-De
c-1
3 E
20
13
E3
0-M
ar-
14
E2
9-J
un
-14
E2
8-S
ep
-14
E2
8-D
ec-
14
E2
01
4 E
Re
ven
ue
s:
M
erc
ha
nd
ise
sa
les
80
6,2
52
$
88
1,9
11
$
97
6,4
52
$
25
3,9
23
$
26
5,2
78
$
26
9,1
08
$
26
4,3
41
$
1,0
52
,65
0$
2
64
,32
6$
2
76
,04
0$
2
81
,65
6$
2
76
,53
2$
1
,09
8,5
54
$
M
oto
r fu
el
3,0
81
,35
1
4
,26
4,4
22
4,7
88
,05
0
1
,28
7,6
05
1,3
18
,50
1
1
,26
0,9
59
1,2
56
,86
5
5
,12
3,9
29
1,2
93
,76
9
1
,33
5,6
68
1,3
25
,06
3
1
,31
4,1
59
5,2
68
,65
9
Oth
er
inco
me
43
,02
7
4
7,8
35
53
,62
5
1
3,6
06
13
,44
3
1
3,4
50
13
,86
5
5
4,3
64
14
,07
4
1
3,9
28
14
,01
5
1
4,4
14
56
,43
2
T
ota
l re
ven
ue
s3
,93
0,6
30
5,1
94
,16
8
5
,81
8,1
27
1,5
55
,13
3
1
,59
7,2
23
1,5
43
,51
7
1
,53
5,0
71
6,2
30
,94
4
1
,57
2,1
69
1,6
25
,63
6
1
,62
0,7
35
1,6
05
,10
5
6
,42
3,6
45
Co
st o
f sa
les
:
Me
rch
an
dis
e
53
5,5
69
5
84
,31
0
64
5,5
00
1
68
,08
1
17
5,5
97
1
78
,13
2
17
4,9
77
6
96
,78
7
17
4,9
67
1
82
,72
1
18
6,4
39
1
83
,04
7
72
7,1
73
Mo
tor
fue
l 2
,91
9,7
22
4,0
50
,85
9
4
,55
6,4
10
1,2
44
,17
3
1
,23
3,5
40
1,1
90
,59
2
1
,20
5,8
59
4,8
74
,16
4
1
,25
0,4
02
1,2
50
,64
1
1
,25
5,5
83
1,2
59
,56
6
5
,01
6,1
91
O
the
r
2,2
37
2
,01
3
4,8
23
3
96
39
1
3
92
40
4
1
,58
3
41
0
4
06
40
8
4
20
1,6
43
T
ota
l co
st o
f sa
les
3,4
57
,52
8
4
,63
7,1
82
5,2
06
,73
3
1
,41
2,6
50
1,4
09
,52
9
1
,36
9,1
16
1,3
81
,24
0
5
,57
2,5
35
1,4
25
,77
9
1
,43
3,7
67
1,4
42
,42
9
1
,44
3,0
32
5,7
45
,00
7
G
ros
s p
rofit
47
3,1
02
5
56
,98
6
61
1,3
94
1
42
,48
3
18
7,6
93
1
74
,40
2
15
3,8
31
6
58
,40
9
14
6,3
90
1
91
,86
9
17
8,3
06
1
62
,07
3
67
8,6
38
O
pe
ratin
g e
xpe
ns
es
:P
ers
on
ne
l1
49
,89
4
16
0,4
46
1
80
,04
2
47
,39
8
4
8,6
80
47
,04
4
4
6,7
86
18
9,9
08
4
7,9
17
49
,54
6
4
9,3
97
48
,92
1
1
95
,78
1
Ge
ne
ral a
nd
ad
min
istr
ativ
e3
6,6
99
43
,27
3
4
8,7
96
13
,43
9
1
3,8
02
13
,33
8
1
3,2
65
53
,84
4
1
3,5
86
14
,04
8
1
4,0
05
13
,87
0
5
5,5
09
Op
era
ting
12
6,6
99
1
44
,09
9
15
7,5
89
4
2,2
24
43
,36
7
4
1,9
09
41
,67
9
1
69
,17
9
42
,68
7
4
4,1
38
44
,00
5
4
3,5
81
17
4,4
11
R
en
t4
2,6
23
45
,73
8
4
6,4
07
14
,46
3
1
4,8
54
14
,35
5
1
4,2
76
57
,94
8
1
4,6
21
15
,11
8
1
5,0
73
14
,92
7
5
9,7
40
(Ga
in)
los
s o
n d
isp
os
al o
f as
se
ts a
nd
imp
air
me
nt c
ha
rge
3,1
93
1
,22
0
69
4
D
ep
reci
atio
n, a
mo
rtiz
atio
n, a
nd
acc
retio
n4
3,9
98
47
,32
0
5
1,4
34
14
,59
4
1
5,4
01
16
,39
5
1
7,3
89
63
,77
9
1
8,0
60
18
,56
6
1
9,0
72
19
,57
8
7
5,2
76
To
tal o
pe
ratin
g e
xpe
ns
es
40
3,1
06
4
42
,09
6
48
4,9
62
1
32
,11
6
13
6,1
05
1
33
,04
0
13
3,3
96
5
34
,65
8
13
6,8
71
1
41
,41
7
14
1,5
52
1
40
,87
7
56
0,7
17
In
com
e (
los
s)
fro
m o
pe
ratio
ns
69
,99
6
1
14
,89
0
12
6,4
32
1
0,3
66
51
,58
9
4
1,3
61
20
,43
5
1
23
,75
1
9,5
19
5
0,4
52
36
,75
3
2
1,1
96
11
7,9
21
In
tere
st e
xpe
ns
e, n
et
(64
,03
9)
(40
,72
6)
(41
,01
9)
(10
,25
0)
(10
,25
0)
(10
,25
0)
(10
,25
0)
(41
,00
0)
(8,3
50
)
(8
,00
6)
(7,4
90
)
(7
,14
5)
(30
,99
0)
Oth
er
mis
cella
ne
ou
s(1
74
)
(3
46
)
(4
71
)
(1
41
)
(1
41
)
(1
41
)
(1
41
)
(5
64
)
(1
41
)
(1
41
)
(1
41
)
(1
41
)
(5
64
)
T
ota
l oth
er
exp
en
se
, ne
t(6
4,2
13
)
(4
1,0
72
)
(4
1,4
90
)
(1
0,3
91
)
(1
0,3
91
)
(1
0,3
91
)
(1
0,3
91
)
(4
1,5
64
)
(8
,49
1)
(8,1
47
)
(7
,63
1)
(7,2
86
)
(3
1,5
54
)
In
com
e (
los
s)
be
fore
inco
me
taxe
s5
,78
3
73
,81
8
8
4,9
42
(25
)
4
1,1
98
30
,97
0
1
0,0
44
82
,18
7
1
,02
9
42
,30
5
2
9,1
23
13
,91
0
8
6,3
66
Inco
me
tax
(exp
en
se
) b
en
efit
(4,9
94
)
(2
6,3
47
)
(3
3,6
45
)
9
(15
,24
3)
(11
,45
9)
(3,7
16
)
(3
0,4
09
)
(3
81
)
(1
5,6
53
)
(1
0,7
75
)
(5
,14
7)
(31
,95
6)
Ne
t in
com
e (
los
s)
78
9$
4
7,4
71
$
51
,29
7$
(1
6)
$
2
5,9
55
$
19
,51
1$
6
,32
8$
51
,77
8$
6
48
$
26
,65
2$
1
8,3
47
$
8,7
63
$
5
4,4
11
$
Le
ss
: Ne
t in
com
e a
ttrib
uta
ble
to n
on
con
tro
llin
g in
tere
sts
3
1
4
4,5
72
4
,28
3
4,2
83
4
,28
3
4,2
83
1
7,1
32
4,2
83
4
,28
3
4,2
83
4
,28
3
17
,13
2
N
et i
nco
me
attr
ibu
tab
le to
Su
ss
er
Ho
ldin
gs
Co
rpo
ratio
n7
86
$
47
,45
7$
4
6,7
25
$
(4,2
99
)$
21
,67
2$
1
5,2
28
$
2,0
45
$
3
4,6
46
$
(3,6
35
)$
22
,36
9$
1
4,0
64
$
4,4
80
$
3
7,2
79
$
Ea
rnin
gs
pe
r s
ha
re:
Ba
sic
0.0
5$
2
.74
$
2.2
5$
(0
.21
)$
1.0
4$
0
.73
$
0.1
0$
1
.65
$
(0.1
7)
$
1
.07
$
0.6
7$
0
.21
$
1.7
7$
D
ilute
d0
.05
$
2.6
8$
2
.19
$
(0.2
1)
$
1
.01
$
0.7
1$
0
.09
$
1.6
1$
(0
.17
)$
1.0
4$
0
.65
$
0.2
1$
1
.73
$
We
igh
ted
ave
rag
e c
om
mo
n s
ha
res
ou
tsta
nd
ing
:B
as
ic1
7,0
18
17
,28
9
2
0,7
28
20
,93
1
2
0,9
31
20
,95
9
2
0,9
59
20
,95
9
2
0,9
86
20
,98
6
2
1,0
14
21
,01
4
2
1,0
14
Dilu
ted
17
,19
1
1
7,7
03
21
,31
5
20
,93
1
21
,52
0
21
,54
8
21
,54
8
21
,54
8
20
, 98
6
21
,57
5
21
,60
3
21
,60
3
21
,60
3
SE
LE
CT
ED
CO
MM
ON
-SIZ
E A
MO
UN
TS
(%
of t
ota
l re
ven
ue
s u
nle
ss
oth
erw
ise
no
ted
)M
erc
ha
nd
ise
sa
les
20
.51
%1
6.9
8%
16
.78
%1
6.3
3%
16
.61
%1
7.4
3%
17
.22
%1
6.8
9%
16
.81
%1
6.9
8%
17
.38
%1
7.2
3%
17
.10
%M
oto
r fu
el r
eve
nu
es
78
.39
%8
2.1
0%
82
.30
%8
2.8
0%
82
.55
%8
1.6
9%
81
.88
%8
2.2
3%
82
.29
%8
2.1
6%
81
.76
%8
1.8
7%
82
.02
%M
erc
ha
nd
ise
co
st o
f sa
les
(%
of m
erc
ha
nd
ise
sa
les
)6
6.4
3%
66
.25
%6
6.1
1%
66
.19
%6
6.1
9%
66
.19
%6
6.1
9%
66
.19
%6
6.1
9%
66
.19
%6
6.1
9%
66
.19
%6
6.1
9%
Mo
tor
fue
l co
st o
f sa
les
(%
of m
oto
r fu
el s
ale
s)
94
.75
%9
4.9
9%
95
.16
%9
6.6
3%
93
.56
%9
4.4
2%
95
.94
%9
5.1
3%
96
.65
%9
3.6
3%
94
.76
%9
5.8
5%
95
.21
%P
ers
on
ne
l3
.81
%3
.09
%3
.09
%3
.05
%3
.05
%3
.05
%3
.05
%3
.05
%3
.05
%3
.05
%3
.05
%3
.05
%3
.05
%G
en
era
l an
d a
dm
inis
tra
tive
0.9
3%
0.8
3%
0.8
4%
0.8
6%
0.8
6%
0.8
6%
0.8
6%
0.8
6%
0.8
6%
0.8
6%
0.8
6%
0.8
6%
0.8
6%
Op
era
ting
3.2
2%
2.7
7%
2.7
1%
2.7
2%
2.7
2%
2.7
2%
2.7
2%
2.7
2%
2.7
2%
2.7
2%
2.7
2%
2.7
2%
2.7
2%
Re
nt
1.0
8%
0.8
8%
0.8
0%
0.9
3%
0.9
3%
0.9
3%
0.9
3%
0.9
3%
0.9
3%
0.9
3%
0.9
3%
0.9
3%
0.9
3%
SE
LE
CT
ED
YE
AR
TO
YE
AR
CH
AN
GE
SM
erc
ha
nd
ise
sa
les
2.7
8%
9.3
8%
10
.72
%1
2.3
2%
4.8
0%
4.9
5%
9.7
6%
7.8
0%
4.1
0%
4.0
6%
4.6
6%
4.6
1%
4.3
6%
Mo
tor
fue
l re
ven
ue
s2
4.1
7%
38
.39
%1
2.2
8%
9.5
6%
6.2
6%
2.3
6%
10
.24
%7
.01
%0
.48
%1
.30
%5
.08
%4
.56
%2
.82
%M
erc
ha
nd
ise
co
st o
f sa
les
2
.34
%9
.10
%1
0.4
7%
11
.80
%5
.30
%4
.95
%1
0.2
9%
7.9
5%
4.1
0%
4.0
6%
4.6
6%
4.6
1%
4.3
6%
Mo
tor
fue
l co
st o
f sa
les
2
3.9
1%
38
.74
%1
2.4
8%
9.1
0%
6.3
4%
1.1
0%
11
.82
%6
.97
%0
.50
%1
.39
%5
.46
%4
.45
%2
.91
%P
ers
on
ne
l0
.01
%7
.04
%1
2.2
1%
13
.09
%8
.62
%-0
.28
%1
.41
%5
.48
%1
.10
%1
.78
%5
.00
%4
.56
%3
.09
%G
en
era
l an
d a
dm
inis
tra
tive
6.7
7%
17
.91
%1
2.7
6%
22
.91
%6
.40
%9
.89
%4
.02
%1
0.3
5%
1.1
0%
1.7
8%
5.0
0%
4.5
6%
3.0
9%
Op
era
ting
7.9
4%
13
.73
%9
.36
%1
5.5
0%
9.7
2%
1.7
5%
3.3
7%
7.3
5%
1.1
0%
1.7
8%
5.0
0%
4.5
6%
3.0
9%
Re
nt
15
.51
%7
.31
%1
.46
%2
2.8
6%
31
.26
%2
3.9
7%
21
.61
%2
4.8
7%
1.1
0%
1.7
8%
5.0
0%
4.5
6%
3.0
9%
20
13
E2
01
4 E
Su
sser
Hol
din
gs C
orp
. (S
US
S)
BU
RK
EN
RO
AD
RE
PO
RT
S (
ww
w.b
urk
enro
ad.o
rg)
Mar
ch 1
7, 2
013
24
Susse
r H
old
ing
s C
orp
. (S
US
S)
Ann
ual a
nd Q
uart
erly
Ea
rnin
gs
36
4 d
ay
36
4 d
ay
36
4 d
ay
36
4 d
ay
36
4 d
ay
In th
ou
sa
nd
sp
eri
od
en
de
dp
eri
od
en
de
dp
eri
od
en
de
dp
eri
od
en
de
dp
eri
od
en
de
d
Fo
r th
e p
eri
od
en
de
d 2
01
0 A
20
11
A 2
01
2 A
31
-Ma
r-1
3 E
30
-Ju
n-1
3 E
29
-Se
p-1
3 E
29
-De
c-1
3 E
20
13
E3
0-M
ar-
14
E2
9-J
un
-14
E2
8-S
ep
-14
E2
8-D
ec-
14
E2
01
4 E
OT
HE
RR
eta
il re
ven
ue
Me
rch
an
dis
e8
06
,25
2$
8
81
,91
1$
9
76
,45
2$
2
53
,92
3$
2
65
,27
8$
2
69
,10
8$
2
64
,34
1$
1
,05
2,6
50
$
26
4,3
26
$
27
6,0
40
$
28
1,6
56
$
27
6,5
32
$
1,0
98
,55
4$
F
ue
l1
,98
7,0
72
2,7
15
,27
9
2
,99
5,8
40
80
9,5
24
8
24
,44
4
80
1,6
07
8
12
,36
4
3,2
47
,93
9
8
38
,76
9
86
1,0
48
8
67
,12
3
87
4,6
14
3
,44
1,5
54
Oth
er
30
,54
2
3
3,6
84
53
,62
5
9
,97
1
9,6
77
9
,31
8
9,6
48
3
8,6
13
10
,26
1
9
,97
8
9,6
69
9
,98
9
39
,89
6
T
ota
l re
tail
reve
nu
e2
,82
3,8
66
$
3,6
30
,87
4$
4
,02
5,9
17
$
1,0
73
,41
7$
1
,09
9,3
99
$
1,0
80
,03
3$
1
,08
6,3
53
$
4,3
39
,20
2$
1
,11
3,3
56
$
1,1
47
,06
5$
1
,15
8,4
49
$
1,1
61
,13
5$
4
,58
0,0
05
$
Wh
ole
sa
le r
eve
nu
e n
et o
f in
terc
om
pa
ny
elim
ina
tion
s F
ue
l1
,09
4,2
79
$
1,5
49
,14
3$
1
,79
2,2
10
$
47
8,0
81
$
49
4,0
57
$
45
9,3
52
$
44
4,5
01
$
1,8
75
,99
0$
4
55
,00
0$
4
74
,62
0$
4
57
,94
0$
4
39
,54
5$
1
,82
7,1
04
$
Oth
er
9,8
85
1
2,3
34
9,1
36
3
,63
5
3,7
67
4
,13
2
4,2
17
1
5,7
51
3,8
13
3
,95
0
4,3
47
4
,42
6
16
,53
6
T
ota
l wh
ole
sa
le r
eve
nu
e1
,10
4,1
64
$
1,5
61
,47
7$
1
,80
1,3
46
$
48
1,7
16
$
49
7,8
24
$
46
3,4
85
$
44
8,7
18
$
1,8
91
,74
2$
4
58
,81
2$
4
78
,57
0$
4
62
,28
7$
4
43
,97
1$
1
,84
3,6
40
$
Inte
rco
mp
an
y e
limin
atio
ns
Fu
el
(1,5
78
,65
3)
$
(2,2
57
,78
8)
$
Oth
er
(10
,22
9)
(12
,48
3)
To
tal i
nte
rco
mp
an
y e
limin
atio
ns
(1,5
88
,88
2)
$
(2,2
70
,27
1)
$
-$
-$
-$
-$
-$
-$
-$
-$
-$
-$
-$
All
oth
er
reve
nu
e2
,60
0
1,8
17
T
ota
l re
ven
ue
s3
,93
0,6
30
$
5,1
94
,16
8$
5
,82
7,2
63
$
1,5
55
,13
3$
1
,59
7,2
23
$
1,5
43
,51
7$
1
,53
5,0
71
$
6,2
30
,94
4$
1
,57
2,1
69
$
1,6
25
,63
6$
1
,62
0,7
35
$
1,6
05
,10
5$
6
,42
3,6
45
$
Ga
llon
s
Re
tail
73
5,7
63
7
35
,76
3
85
3,1
63
2
23
,99
1
22
8,4
50
2
32
,90
9
23
7,3
68
9
22
,71
8
24
1,8
27
2
46
,28
6
25
0,7
45
2
55
,20
4
99
4,0
62
Wh
ole
sa
le n
et o
f in
terc
om
pa
ny
elim
ina
tion
s4
94
,20
9
49
4,2
09
5
94
,90
9
13
8,2
23
1
39
,28
4
14
0,3
45
1
41
,40
7
55
9,2
59
1
42
,46
8
14
3,5
29
1
44
,59
0
14
5,6
51
5
76
,23
8
Inte
rco
mp
an
y e
limin
atio
ns
(73
9,1
04
)
(73
9,1
04
)
(22
4,5
05
)
(22
9,2
79
)
(23
4,0
52
)
(23
8,8
25
)
(92
6,6
61
)
(24
3,5
98
)
(24
8,3
72
)
(25
3,1
45
)
(25
7,9
19
)
(1,0
03
,03
4)
Wh
ole
sa
le d
ea
ler/
oth
ers
(24
4,8
95
)
Ga
llon
s p
er
sto
re1
,39
5
1,3
80
1
,56
0
39
7
3
98
40
0
4
02
1,5
99
4
04
40
6
4
08
41
0
1
,62
3
wh
ole
sa
le g
allo
ns
be
fore
inte
rco
. Elim
ina
tion
s1
,23
3,3
13
1,2
33
,31
3
5
94
,90
9
36
2,7
28
3
68
,56
3
37
4,3
97
3
80
,23
2
1,4
85
,92
0
3
86
,06
6
39
1,9
01
3
97
,73
5
40
3,5
70
1
,57
9,2
72
Pri
ce p
er
ga
llon
Re
tail
2.7
0$
3
.69
$
3.5
1$
3
.61
$
3.6
1$
3
.44
$
3.4
2$
3
.52
$
3.4
7$
3
.50
$
3.4
6$
3
.43
$
3.4
6$
W
ho
les
ale
ne
t of i
nte
rco
mp
an
y e
limin
atio
ns
2.2
1$
3
.13
$
3.5
1$
3
.46
$
3.5
5$
3
.27
$
3.1
4$
3
.35
$
3.1
9$
3
.31
$
3.1
7$
3
.02
$
3.1
7$
In
terc
om
pa
ny
elim
ina
tion
s2
.14
$
3.0
5$
# c
on
ven
ien
ce s
tore
s5
26
54
1
5
41
57
0
5
78
58
6
5
94
59
4
6
02
61
0
6
18
62
6
6
26
Ave
rag
e #
co
nve
nie
nce
sto
res
52
7
5
33
54
7
5
65
57
4
5
82
59
0
5
77
59
8
6
06
61
4
6
22
61
3
20
13
E2
01
4 E

Su
sser
Hol
din
gs C
orp
. (S
US
S)
BU
RK
EN
RO
AD
RE
PO
RT
S (
ww
w.b
urk
enro
ad.o
rg)
Mar
ch 1
7, 2
013
25
Susse
r H
old
ing
s C
orp
. (S
US
S)
Ann
ual a
nd Q
uart
erly
Ba
lanc
e S
hee
tsIn
tho
us
an
ds
As
of
02
-Ja
n-1
1 A
01
-Ja
n-1
2 A
30
-De
c-1
2 A
31
-Ma
r-1
3 E
30
-Ju
n-1
3 E
29
-Se
p-1
3 E
29
-De
c-1
3 E
30
-De
c-1
3 E
30
-Ma
r-1
4 E
29
-Ju
n-1
4 E
28
-Se
p-1
4 E
28
-De
c-1
4 E
30
-De
c-1
4 E
AS
SE
TS
Ca
sh
an
d c
as
h e
qu
iva
len
ts4
7,9
43
$
12
0,5
64
$
28
6,2
32
$
29
8,5
19
$
57
,50
6$
6
0,2
73
$
51
,31
7$
5
1,3
17
$
52
,81
8$
4
6,0
56
$
53
,25
8$
5
0,9
55
$
50
,95
5$
A
cco
un
ts r
ece
iva
ble
, ne
t6
0,3
56
75
,27
5
1
05
,87
4
10
0,5
78
1
03
,94
1
96
,77
1
9
3,6
88
93
,68
8
9
5,7
96
99
,92
1
9
6,5
21
92
,69
7
9
2,6
97
Inve
nto
rie
s, n
et
84
,14
0
9
8,7
23
11
5,0
48
1
24
,18
9
12
3,9
15
1
20
,36
2
12
1,4
28
1
21
,42
8
12
5,3
43
1
26
,04
5
12
6,8
07
1
26
,86
0
12
6,8
60
A
ss
ets
he
ld fo
r s
ale
(m
ark
eta
ble
se
curi
ties
)1
48
,26
4
14
8,2
64
1
48
,26
4
14
8,2
64
1
48
,26
4
14
8,2
64
1
48
,26
4
14
8,2
64
1
48
,26
4
14
8,2
64
1
48
,26
4
Oth
er
curr
en
t as
se
ts1
7,5
17
19
,62
0
8
,27
1
8,2
71
8
,27
1
8,2
71
8
,27
1
8,2
71
8
,27
1
8,2
71
8
,27
1
8,2
71
8
,27
1
To
tal c
urr
en
t as
se
ts2
09
,95
6
31
4,1
82
6
63
,68
9
67
9,8
21
4
41
,89
7
43
3,9
41
4
22
,96
8
42
2,9
68
4
30
,49
2
42
8,5
58
4
33
,12
1
42
7,0
47
4
27
,04
7
Pro
pe
rty
an
d e
qu
ipm
en
t, n
et
40
9,1
53
4
74
,24
3
60
2,1
51
6
15
,02
1
64
3,1
17
6
70
,21
8
69
6,3
26
6
96
,32
6
70
0,7
17
7
04
,60
2
70
7,9
81
7
10
,85
4
71
0,8
54
G
oo
dw
ill2
40
,15
8
24
4,3
98
2
44
,39
8
24
4,3
98
2
44
,39
8
24
4,3
98
2
44
,39
8
24
4,3
98
2
44
,39
8
24
4,3
98
2
44
,39
8
24
4,3
98
2
44
,39
8
Inta
ng
ible
as
se
ts, n
et
41
,36
5
4
8,2
68
45
,76
4
4
4,9
01
44
,03
7
4
3,1
74
42
,31
0
4
2,3
10
41
,52
6
4
0,7
42
39
,95
7
3
9,1
73
39
,17
3
O
the
r n
on
curr
en
t as
se
ts1
3,7
07
14
,87
9
1
5,3
81
15
,38
1
1
5,3
81
15
,38
1
1
5,3
81
15
,38
1
1
5,3
81
15
,38
1
1
5,3
81
15
,38
1
1
5,3
81
To
tal a
ss
ets
91
4,3
39
$
1,0
95
,97
0$
1
,57
1,3
83
$
1,5
99
,52
1$
1
,38
8,8
29
$
1,4
07
,11
2$
1
,42
1,3
83
$
1,4
21
,38
3$
1
,43
2,5
13
$
1,4
33
,68
0$
1
,44
0,8
38
$
1,4
36
,85
3$
1
,43
6,8
53
$
Lia
bili
ties
an
d s
ha
reh
old
ers
’ eq
uity
Cu
rre
nt l
iab
ilitie
s:
Acc
ou
nts
pa
yab
le1
32
,91
8$
1
43
,08
8$
1
71
,54
5$
2
00
,89
5$
2
00
,90
3$
1
95
,06
4$
1
96
,57
2$
1
96
,57
2$
2
02
,78
8$
2
04
,36
7$
2
05
,45
6$
2
05
,38
0$
2
05
,38
0$
A
ccru
ed
exp
en
se
s a
nd
oth
er
curr
en
t lia
bili
ties
41
,67
9
4
9,5
64
61
,20
8
5
6,6
63
56
,66
5
5
5,0
18
55
,44
3
5
5,4
43
57
,19
7
5
7,6
42
57
,94
9
5
7,9
28
57
,92
8
C
urr
en
t ma
turi
ties
of l
on
g-t
erm
de
bt
55
0
1
,49
2
36
3
7
47
4
7
48
4
8
32
,18
9
6
4,3
29
96
,47
0
1
28
,61
0
12
8,6
10
D
efe
rre
d g
ain
, sh
ort
-te
rm p
os
itio
n2
,10
4
De
ferr
ed
pu
rch
as
e p
rice
—T
CF
S a
cqu
isiti
on
, cu
rre
nt
1,1
54
T
ota
l cu
rre
nt l
iab
ilitie
s1
78
,40
5
19
4,1
44
2
32
,78
9
25
7,5
95
2
57
,61
4
25
0,1
30
2
52
,06
4
25
2,0
64
2
92
,17
3
32
6,3
38
3
59
,87
4
39
1,9
17
3
91
,91
7
Lo
ng
-te
rm d
eb
t4
30
,75
6
44
9,8
37
5
71
,64
9
57
1,6
39
1
28
,62
1
12
8,6
11
1
28
,60
1
12
8,6
01
9
6,4
51
64
,30
1
3
2,1
50
Re
volv
ing
lin
e o
f cre
dit
35
,59
0
3
5,5
90
23
5,5
90
2
35
,59
0
23
5,5
90
2
35
,59
0
23
5,5
90
2
05
,59
0
19
0,5
90
1
75
,59
0
17
5,5
90
D
efe
rre
d g
ain
, lo
ng
-te
rm p
ort
ion
32
,72
7
3
0,8
88
28
,54
8
2
8,5
48
28
,54
8
2
8,5
48
28
,54
8
2
8,5
48
28
,54
8
2
8,5
48
28
,54
8
2
8,5
48
28
,54
8
D
efe
rre
d ta
x lia
bili
ty, l
on
g-t
erm
po
rtio
n3
9,2
61
68
,21
6
8
5,2
11
86
,74
3
91
,26
9
95
,70
9
99
,90
2
99
,90
2
10
0,5
99
1
01
,27
2
10
1,8
71
1
02
,40
4
10
2,4
04
O
the
r n
on
curr
en
t lia
bili
ties
18
,62
7
1
7,9
50
16
,89
7
1
6,8
97
16
,89
7
1
6,8
97
16
,89
7
1
6,8
97
16
,89
7
1
6,8
97
16
,89
7
1
6,8
97
16
,89
7
T
ota
l lo
ng
-te
rm li
ab
ilitie
s5
21
,37
1
56
6,8
91
7
37
,89
5
73
9,4
17
5
00
,92
5
50
5,3
55
5
09
,53
8
50
9,5
38
4
78
,08
5
41
6,6
08
3
70
,05
6
32
3,4
39
3
23
,43
9
To
tal l
iab
ilitie
s6
99
,77
6
76
1,0
35
9
70
,68
4
99
7,0
12
7
58
,53
9
75
5,4
85
7
61
,60
2
76
1,6
02
7
70
,25
8
74
2,9
46
7
29
,93
1
71
5,3
57
7
15
,35
7
Sh
are
ho
lde
rs' e
qu
ity:
Co
mm
on
sto
ck1
72
21
0
2
12
20
9
2
09
21
0
2
10
21
0
2
10
21
0
2
10
21
0
2
10
Ad
diti
on
al p
aid
-in
ca
pita
l1
86
,92
1
26
9,3
68
2
76
,43
0
27
8,2
59
2
80
,08
5
28
1,9
11
2
83
,73
7
28
3,7
37
2
85
,56
2
28
7,3
88
2
89
,21
4
29
1,0
40
2
91
,04
0
Tre
as
ury
sto
ck(4
5)
(9,6
29
)
(8
,06
8)
(8,0
68
)
(8
,06
8)
(8,0
68
)
(8
,06
8)
(8,0
68
)
(8
,06
8)
(8,0
68
)
(8
,06
8)
(8,0
68
)
(8
,06
8)
Re
tain
ed
ea
rnin
gs
(d
efic
it)2
6,7
42
74
,19
9
1
20
,92
4
11
6,6
25
1
38
,29
7
15
3,5
25
1
55
,57
0
15
5,5
70
1
51
,93
5
17
4,3
05
1
88
,36
9
19
2,8
49
1
92
,84
9
To
tal S
us
se
r H
old
ing
s C
orp
ora
tion
sh
are
ho
lde
rs’ e
qu
ity2
13
,79
0
33
4,1
48
3
89
,49
8
38
7,0
25
4
10
,52
3
42
7,5
77
4
31
,44
8
43
1,4
48
4
29
,63
9
45
3,8
35
4
69
,72
5
47
6,0
31
4
76
,03
1
No
nco
ntr
olli
ng
inte
res
t7
73
78
7
2
11
,20
1
21
5,4
84
2
19
,76
7
22
4,0
50
2
28
,33
3
22
8,3
33
2
32
,61
6
23
6,8
99
2
41
,18
2
24
5,4
65
2
45
,46
5
To
tal s
ha
reh
old
ers
' eq
uity
21
4,5
63
3
34
,93
5
60
0,6
99
6
02
,50
9
63
0,2
90
6
51
,62
7
65
9,7
81
6
59
,78
1
66
2,2
55
6
90
,73
4
71
0,9
07
7
21
,49
6
72
1,4
96
T
ota
l lia
bili
ties
an
d s
ha
reh
old
ers
' eq
uity
91
4,3
39
$
1,0
95
,97
0$
1
,57
1,3
83
$
1,5
99
,52
1$
1
,38
8,8
29
$
1,4
07
,11
2$
1
,42
1,3
83
$
1,4
21
,38
3$
1
,43
2,5
13
$
1,4
33
,68
0$
1
,44
0,8
38
$
1,4
36
,85
3$
1
,43
6,8
53
$
SE
LE
CT
ED
CO
MM
ON
SIZ
E B
AL
AN
CE
SH
EE
T A
MO
UN
TS
(a
s a
% o
f to
tal r
eve
nu
es
)A
cco
un
ts r
ece
iva
ble
, ne
t7
.49
%8
.54
%1
0.8
4%
39
.61
%3
9.1
8%
35
.96
%3
5.4
4%
8.9
0%
36
.24
%3
6.2
0%
34
.27
%3
3.5
2%
8.4
4%
Inve
nto
rie
s, n
et
10
.44
%1
1.1
9%
11
.78
%4
8.9
1%
46
.71
%4
4.7
3%
45
.94
%1
1.5
4%
47
.42
%4
5.6
6%
45
.02
%4
5.8
8%
11
.55
%P
rop
ert
y a
nd
eq
uip
me
nt,
ne
t5
0.7
5%
53
.77
%6
1.6
7%
24
2.2
1%
24
2.4
3%
24
9.0
5%
26
3.4
2%
66
.15
%2
65
.10
%2
55
.25
%2
51
.36
%2
57
.06
%6
4.7
1%
Acc
ou
nts
pa
yab
le1
6.4
9%
16
.22
%1
7.5
7%
79
.12
%7
5.7
3%
72
.49
%7
4.3
6%
18
.67
%7
6.7
2%
74
.04
%7
2.9
5%
74
.27
%1
8.7
0%
Acc
rue
d e
xpe
ns
es
an
d o
the
r cu
rre
nt l
iab
ilitie
s5
.17
%5
.62
%6
.27
%2
2.3
1%
21
.36
%2
0.4
4%
20
.97
%5
.27
%2
1.6
4%
20
.88
%2
0.5
7%
20
.95
%5
.27
%S
EL
EC
TE
D C
OM
MO
N S
IZE
BA
LA
NC
E S
HE
ET
AM
OU
NT
S (
as
a %
of t
ota
l as
se
ts)
To
tal c
urr
en
t as
se
ts2
2.9
6%
28
.67
%4
2.2
4%
42
.50
%3
1.8
2%
30
.84
%2
9.7
6%
29
.76
%3
0.0
5%
29
.89
%3
0.0
6%
29
.72
%2
9.7
2%
Pro
pe
rty
an
d e
qu
ipm
en
t, n
et
44
.75
%4
3.2
7%
38
.32
%3
8.4
5%
46
.31
%4
7.6
3%
48
.99
%4
8.9
9%
48
.92
%4
9.1
5%
49
.14
%4
9.4
7%
49
.47
%G
oo
dw
ill2
6.2
7%
22
.30
%1
5.5
5%
15
.28
%1
7.6
0%
17
.37
%1
7.1
9%
17
.19
%1
7.0
6%
17
.05
%1
6.9
6%
17
.01
%1
7.0
1%
Inta
ng
ible
as
se
ts, n
et
4.5
2%
4.4
0%
2.9
1%
2.8
1%
3.1
7%
3.0
7%
2.9
8%
2.9
8%
2.9
0%
2.8
4%
2.7
7%
2.7
3%
2.7
3%
Oth
er
no
ncu
rre
nt a
ss
ets
1.5
0%
1.3
6%
0.9
8%
0.9
6%
1.1
1%
1.0
9%
1.0
8%
1.0
8%
1.0
7%
1.0
7%
1.0
7%
1.0
7%
1.0
7%
To
tal c
urr
en
t lia
bili
ties
19
.51
%1
7.7
1%
14
.81
%1
6.1
0%
18
.55
%1
7.7
8%
17
.73
%1
7.7
3%
20
.40
%2
2.7
6%
24
.98
%2
7.2
8%
27
.28
%L
on
g-t
erm
de
bt
47
.11
%4
1.0
4%
36
.38
%3
5.7
4%
9.2
6%
9.1
4%
9.0
5%
9.0
5%
6.7
3%
4.4
8%
2.2
3%
0.0
0%
0.0
0%
Re
volv
ing
lin
e o
f cre
dit
0.0
0%
0.0
0%
2.2
6%
2.2
3%
16
.96
%1
6.7
4%
16
.57
%1
6.5
7%
16
.45
%1
4.3
4%
13
.23
%1
2.2
2%
12
.22
%D
efe
rre
d g
ain
, lo
ng
-te
rm p
ort
ion
3.5
8%
2.8
2%
1.8
2%
1.7
8%
2.0
6%
2.0
3%
2.0
1%
2.0
1%
1.9
9%
1.9
9%
1.9
8%
1.9
9%
1.9
9%
De
ferr
ed
tax
liab
ility
, lo
ng
-te
rm p
ort
ion
4.2
9%
6.2
2%
5.4
2%
5.4
2%
6.5
7%
6.8
0%
7.0
3%
7.0
3%
7.0
2%
7.0
6%
7.0
7%
7.1
3%
7.1
3%
Oth
er
no
ncu
rre
nt l
iab
ilitie
s2
.04
%1
.64
%1
.08
%1
.06
%1
.22
%1
.20
%1
.19
%1
.19
%1
.18
%1
.18
%1
.17
%1
.18
%1
.18
%T
ota
l sh
are
ho
lde
rs' e
qu
ity2
3.4
7%
30
.56
%3
8.2
3%
37
.67
%4
5.3
8%
46
.31
%4
6.4
2%
46
.42
%4
6.2
3%
48
.18
%4
9.3
4%
50
.21
%5
0.2
1%
20
13
E2
01
4 E
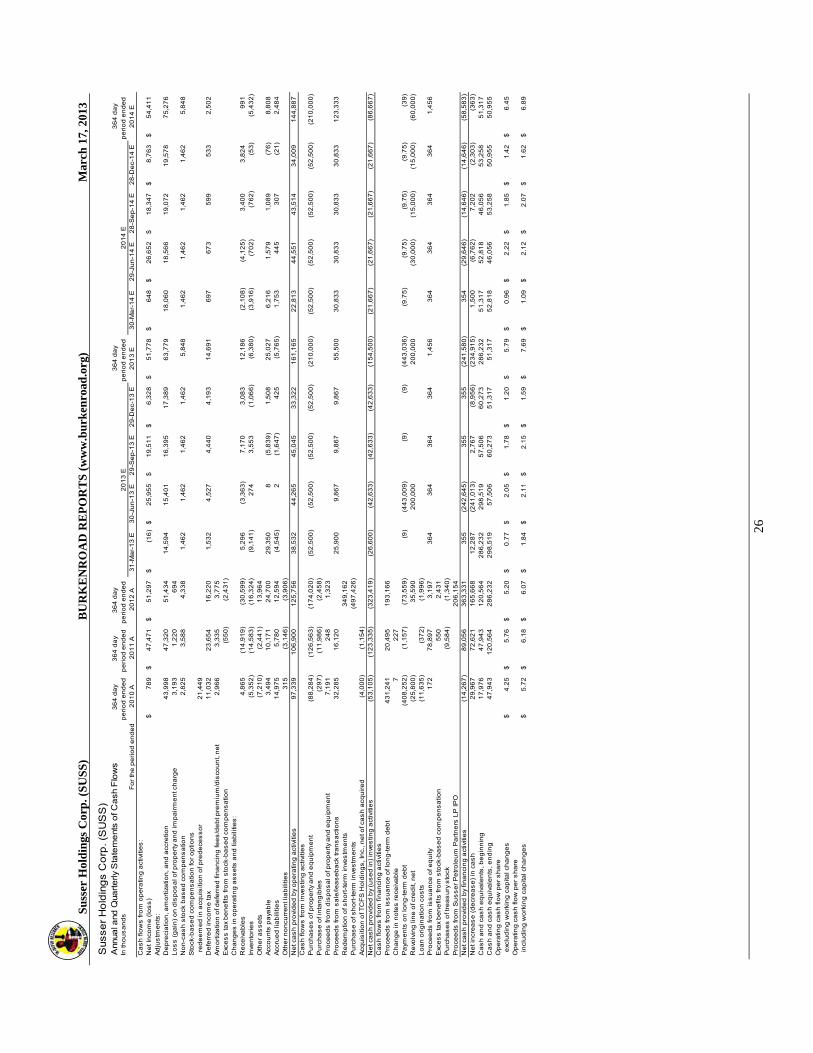
Su
sser
Hol
din
gs C
orp
. (S
US
S)
BU
RK
EN
RO
AD
RE
PO
RT
S (
ww
w.b
urk
enro
ad.o
rg)
Mar
ch 1
7, 2
013
26
Susse
r H
old
ing
s C
orp
. (S
US
S)
Ann
ual a
nd Q
uart
erly
Sta
tem
ent
s o
f Ca
sh F
low
s3
64
da
y3
64
da
y3
64
da
y3
64
da
y3
64
da
yIn
tho
us
an
ds
pe
rio
d e
nd
ed
pe
rio
d e
nd
ed
pe
rio
d e
nd
ed
pe
rio
d e
nd
ed
pe
rio
d e
nd
ed
Fo
r th
e p
eri
od
en
de
d 2
01
0 A
20
11
A 2
01
2 A
31
-Ma
r-1
3 E
30
-Ju
n-1
3 E
29
-Se
p-1
3 E
29
-De
c-1
3 E
20
13
E3
0-M
ar-
14
E2
9-J
un
-14
E2
8-S
ep
-14
E2
8-D
ec-
14
E2
01
4 E
Ca
sh
flo
ws
fro
m o
pe
ratin
g a
ctiv
itie
s:
Ne
t In
com
e (
los
s)
78
9$
4
7,4
71
$
51
,29
7$
(1
6)
$
2
5,9
55
$
19
,51
1$
6
,32
8$
51
,77
8$
6
48
$
26
,65
2$
1
8,3
47
$
8,7
63
$
5
4,4
11
$
Ad
jus
tme
nts
:D
ep
reci
atio
n, a
mo
rtiz
atio
n, a
nd
acc
retio
n4
3,9
98
47
,32
0
5
1,4
34
14
,59
4
1
5,4
01
16
,39
5
1
7,3
89
63
,77
9
1
8,0
60
18
,56
6
1
9,0
72
19
,57
8
7
5,2
76
Lo
ss
(g
ain
) o
n d
isp
os
al o
f pro
pe
rty
an
d im
pa
irm
en
t ch
arg
e3
,19
3
1,2
20
6
94
No
n-c
as
h s
tock
ba
se
d c
om
pe
ns
atio
n2
,82
5
3,5
88
4
,33
8
1,4
62
1
,46
2
1,4
62
1
,46
2
5,8
48
1
,46
2
1,4
62
1
,46
2
1,4
62
5
,84
8
Sto
ck-b
as
ed
co
mp
en
sa
tion
for
op
tion
s
re
de
em
ed
in a
cqu
isiti
on
of p
red
ece
ss
or
21
,44
9
D
efe
rre
d in
com
e ta
x 1
1,0
32
23
,65
4
1
6,2
20
1,5
32
4
,52
7
4,4
40
4
,19
3
14
,69
1
6
97
67
3
5
99
53
3
2
,50
2
Am
ort
iza
tion
of d
efe
rre
d fi
na
nci
ng
fee
s/d
eb
t pre
miu
m/d
isco
un
t, n
et
2,9
66
3
,33
5
3,7
75
E
xce
ss
tax
be
ne
fits
fro
m s
tock
-ba
se
d c
om
pe
ns
atio
n�
(55
0)
(2,4
31
)
C
ha
ng
es
in o
pe
ratin
g a
ss
ets
an
d li
ab
ilitie
s:
Re
ceiv
ab
les
4,8
65
(1
4,9
19
)
(3
0,5
99
)
5
,29
6
(3,3
63
)
7
,17
0
3,0
83
1
2,1
86
(2,1
08
)
(4
,12
5)
3,4
00
3
,82
4
99
1
In
ven
tori
es
(5,3
52
)
(1
4,5
83
)
(1
6,3
24
)
(9
,14
1)
27
4
3
,55
3
(1,0
66
)
(6
,38
0)
(3,9
16
)
(7
02
)
(7
62
)
(5
3)
(5,4
32
)
O
the
r a
ss
ets
(7,2
10
)
(2
,44
1)
13
,96
4
A
cco
un
ts p
aya
ble
3,4
94
1
0,1
71
24
,70
0
2
9,3
50
8
(5
,83
9)
1,5
08
2
5,0
27
6,2
16
1
,57
9
1,0
89
(7
6)
8,8
08
A
ccru
ed
lia
bili
ties
14
,97
5
5
,78
0
12
,59
4
(4
,54
5)
2
(1
,64
7)
42
5
(5
,76
5)
1,7
53
4
45
30
7
(2
1)
2,4
84
O
the
r n
on
curr
en
t lia
bili
ties
31
5
(3
,14
6)
(3,9
06
)
N
et c
as
h p
rovi
de
d b
y o
pe
ratin
g a
ctiv
itie
s9
7,3
39
10
6,9
00
1
25
,75
6
38
,53
2
4
4,2
65
45
,04
5
3
3,3
22
16
1,1
65
2
2,8
13
44
,55
1
4
3,5
14
34
,00
9
1
44
,88
7
Ca
sh
flo
ws
fro
m in
ves
ting
act
iviti
es
Pu
rch
as
es
of p
rop
ert
y a
nd
eq
uip
me
nt
(88
,28
4)
(12
6,5
63
)
(17
4,0
20
)
(52
,50
0)
(52
,50
0)
(52
,50
0)
(52
,50
0)
(21
0,0
00
)
(52
,50
0)
(52
,50
0)
(52
,50
0)
(52
,50
0)
(21
0,0
00
)
Pu
rch
as
e o
f in
tan
gib
les
�(2
97
)
(1
1,9
86
)
(2
,45
8)
Pro
cee
ds
fro
m d
isp
os
al o
f pro
pe
rty
an
d e
qu
ipm
en
t7
,19
1
24
8
1
,32
3
Pro
cee
ds
fro
m s
ale
/lea
se
ba
ck tr
an
sa
ctio
ns
32
,28
5
1
6,1
20
25
,90
0
9
,86
7
9,8
67
9
,86
7
55
,50
0
3
0,8
33
30
,83
3
3
0,8
33
30
,83
3
1
23
,33
3
Re
de
mp
tion
of s
ho
rt-t
erm
inve
stm
en
ts3
49
,16
2
Pu
rch
as
e o
f sh
ort
-te
rm in
ves
tme
nts
(49
7,4
26
)
Acq
uis
itio
n o
f TC
FS
Ho
ldin
gs
, In
c., n
et o
f ca
sh
acq
uir
ed
(4,0
00
)
(1
,15
4)
Ne
t ca
sh
pro
vid
ed
by
(us
ed
in)
inve
stin
g a
ctiv
itie
s(5
3,1
05
)
(1
23
,33
5)
(3
23
,41
9)
(2
6,6
00
)
(4
2,6
33
)
(4
2,6
33
)
(4
2,6
33
)
(1
54
,50
0)
(2
1,6
67
)
(2
1,6
67
)
(2
1,6
67
)
(2
1,6
67
)
(8
6,6
67
)
C
as
h fl
ow
s fr
om
fin
an
cin
g a
ctiv
itie
sP
roce
ed
s fr
om
iss
ua
nce
of l
on
g-t
erm
de
bt
43
1,2
41
2
0,4
95
19
3,1
66
C
ha
ng
e in
no
tes
re
ceiv
ab
le7
22
7
P
aym
en
ts o
n lo
ng
-te
rm d
eb
t(4
08
,25
2)
(1
,15
7)
(73
,55
9)
(9)
(4
43
,00
9)
(9
)
(9)
(4
43
,03
6)
(9
.75
)
(9.7
5)
(9
.75
)
(9.7
5)
(3
9)
Re
volv
ing
lin
e o
f cre
dit,
ne
t(2
5,8
00
)
3
5,5
90
20
0,0
00
2
00
,00
0
(30
,00
0)
(15
,00
0)
(15
,00
0)
(60
,00
0)
Lo
an
ori
gin
atio
n c
os
ts(1
1,6
35
)
(3
72
)
(1
,99
6)
Pro
cee
ds
fro
m is
su
an
ce o
f eq
uity
17
2
7
8,8
97
3,1
97
3
64
36
4
3
64
36
4
1
,45
6
36
4
3
64
36
4
3
64
1,4
56
E
xce
ss
tax
be
ne
fits
fro
m s
tock
-ba
se
d c
om
pe
ns
atio
n�
55
0
2
,43
1
Pu
rch
as
es
of t
rea
su
ry s
tock
(9,5
84
)
(1
,34
0)
Pro
cee
ds
fro
m S
us
se
r P
etr
ole
um
Pa
rtn
ers
LP
IPO
20
6,1
54
N
et c
as
h p
rovi
de
d b
y fin
an
cin
g a
ctiv
itie
s(1
4,2
67
)
8
9,0
56
36
3,3
31
3
55
(24
2,6
45
)
35
5
3
55
(24
1,5
80
)
35
4
(2
9,6
46
)
(1
4,6
46
)
(1
4,6
46
)
(5
8,5
83
)
N
et i
ncr
ea
se
(d
ecr
ea
se
) in
ca
sh
29
,96
7
7
2,6
21
16
5,6
68
1
2,2
87
(24
1,0
13
)
2,7
67
(8
,95
6)
(23
4,9
15
)
1,5
00
(6
,76
2)
7,2
02
(2
,30
3)
(36
3)
Ca
sh
an
d c
as
h e
qu
iva
len
ts, b
eg
inn
ing
1
7,9
76
47
,94
3
1
20
,56
4
28
6,2
32
2
98
,51
9
57
,50
6
6
0,2
73
28
6,2
32
5
1,3
17
52
,81
8
4
6,0
56
53
,25
8
5
1,3
17
Ca
sh
an
d c
as
h e
qu
iva
len
ts, e
nd
ing
47
,94
3
1
20
,56
4
28
6,2
32
2
98
,51
9
57
,50
6
6
0,2
73
51
,31
7
5
1,3
17
52
,81
8
4
6,0
56
53
,25
8
5
0,9
55
50
,95
5
O
pe
ratin
g c
as
h fl
ow
pe
r s
ha
re
exc
lud
ing
wo
rkin
g c
ap
ital c
ha
ng
es
4.2
5$
5
.76
$
5.2
0$
0
.77
$
2.0
5$
1
.78
$
1.2
0$
5
.79
$
0.9
6$
2
.22
$
1.8
5$
1
.42
$
6.4
5$
O
pe
ratin
g c
as
h fl
ow
pe
r s
ha
re
in
clu
din
g w
ork
ing
ca
pita
l ch
an
ge
s5
.72
$
6.1
8$
6
.07
$
1.8
4$
2
.11
$
2.1
5$
1
.59
$
7.6
9$
1
.09
$
2.1
2$
2
.07
$
1.6
2$
6
.89
$
20
13
E2
01
4 E
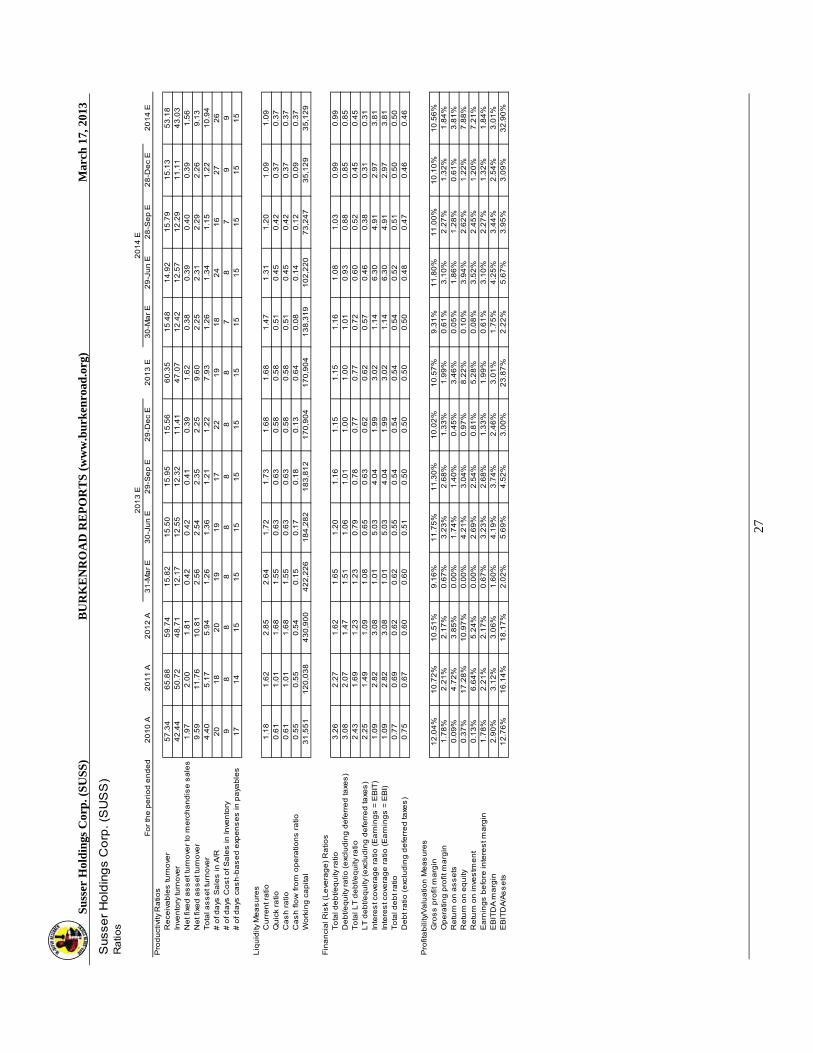
Su
sser
Hol
din
gs C
orp
. (S
US
S)
BU
RK
EN
RO
AD
RE
PO
RT
S (
ww
w.b
urk
enro
ad.o
rg)
Mar
ch 1
7, 2
013
27
Susse
r H
old
ing
s C
orp
. (S
US
S)
Ra
tios
Fo
r th
e p
eri
od
en
de
d 2
01
0 A
20
11
A 2
01
2 A
31
-Ma
r E
30
-Ju
n E
29
-Se
p E
29
-De
c E
20
13
E3
0-M
ar
E2
9-J
un
E2
8-S
ep
E2
8-D
ec
E2
01
4 E
Pro
du
ctiv
ity R
atio
sR
ece
iva
ble
s tu
rno
ver
57
.34
65
.88
59
.74
15
.82
15
.50
15
.95
15
.56
60
.35
15
.48
14
.92
15
.79
15
.13
53
.18
Inve
nto
ry tu
rno
ver
42
.44
50
.72
48
.71
12
.17
12
.55
12
.32
11
.41
47
.07
12
.42
12
.57
12
.29
11
.11
43
.03
Ne
t fix
ed
as
se
t tu
rno
ver
to m
erc
ha
nd
ise
sa
les
1.9
72
.00
1.8
10
.42
0.4
20
.41
0.3
91
.62
0.3
80
.39
0.4
00
.39
1.5
6N
et f
ixe
d a
ss
et t
urn
ove
r9
.59
11
.76
10
.81
2.5
62
.54
2.3
52
.25
9.6
02
.25
2.3
12
.29
2.2
69
.13
To
tal a
ss
et t
urn
ove
r4
.40
5.1
75
.94
1.2
61
.36
1.2
11
.22
7.9
31
.26
1.3
41
.15
1.2
21
0.9
4#
of d
ays
Sa
les
in A
/R2
01
82
01
91
91
72
21
91
82
41
62
72
6#
of d
ays
Co
st o
f Sa
les
in In
ven
tory
98
88
88
88
78
79
9#
of d
ays
ca
sh
-ba
se
d e
xpe
ns
es
in p
aya
ble
s1
71
41
51
51
51
51
51
51
51
51
51
51
5
Liq
uid
ity M
ea
su
res
Cu
rre
nt r
atio
1.1
81
.62
2.8
52
.64
1.7
21
.73
1.6
81
.68
1.4
71
.31
1.2
01
.09
1.0
9Q
uic
k ra
tio0
.61
1.0
11
.68
1.5
50
.63
0.6
30
.58
0.5
80
.51
0.4
50
.42
0.3
70
.37
Ca
sh
ra
tio0
.61
1.0
11
.68
1.5
50
.63
0.6
30
.58
0.5
80
.51
0.4
50
.42
0.3
70
.37
Ca
sh
flo
w fr
om
op
era
tion
s r
atio
0.5
50
.55
0.5
40
.15
0.1
70
.18
0.1
30
.64
0.0
80
.14
0.1
20
.09
0.3
7W
ork
ing
ca
pita
l3
1,5
51
12
0,0
38
43
0,9
00
42
2,2
26
18
4,2
82
18
3,8
12
17
0,9
04
17
0,9
04
13
8,3
19
10
2,2
20
73
,24
73
5,1
29
35
,12
9
Fin
an
cia
l Ris
k (L
eve
rag
e)
Ra
tios
To
tal d
eb
t/eq
uity
ra
tio3
.26
2.2
71
.62
1.6
51
.20
1.1
61
.15
1.1
51
.16
1.0
81
.03
0.9
90
.99
De
bt/e
qu
ity r
atio
(e
xclu
din
g d
efe
rre
d ta
xes
)3
.08
2.0
71
.47
1.5
11
.06
1.0
11
.00
1.0
01
.01
0.9
30
.88
0.8
50
.85
To
tal L
T d
eb
t/eq
uity
ra
tio2
.43
1.6
91
.23
1.2
30
.79
0.7
80
.77
0.7
70
.72
0.6
00
.52
0.4
50
.45
LT
de
bt/e
qu
ity (
exc
lud
ing
de
ferr
ed
taxe
s)
2.2
51
.49
1.0
91
.08
0.6
50
.63
0.6
20
.62
0.5
70
.46
0.3
80
.31
0.3
1In
tere
st c
ove
rag
e r
atio
(E
arn
ing
s =
EB
IT)
1.0
92
.82
3.0
81
.01
5.0
34
.04
1.9
93
.02
1.1
46
.30
4.9
12
.97
3.8
1In
tere
st c
ove
rag
e r
atio
(E
arn
ing
s =
EB
I)1
.09
2.8
23
.08
1.0
15
.03
4.0
41
.99
3.0
21
.14
6.3
04
.91
2.9
73
.81
To
tal d
eb
t ra
tio0
.77
0.6
90
.62
0.6
20
.55
0.5
40
.54
0.5
40
.54
0.5
20
.51
0.5
00
.50
De
bt r
atio
(e
xclu
din
g d
efe
rre
d ta
xes
)0
.75
0.6
70
.60
0.6
00
.51
0.5
00
.50
0.5
00
.50
0.4
80
.47
0.4
60
.46
Pro
fita
bili
ty/V
alu
atio
n M
ea
su
res
Gro
ss
pro
fit m
arg
in1
2.0
4%
10
.72
%1
0.5
1%
9.1
6%
11
.75
%1
1.3
0%
10
.02
%1
0.5
7%
9.3
1%
11
.80
%1
1.0
0%
10
.10
%1
0.5
6%
Op
era
ting
pro
fit m
arg
in1
.78
%2
.21
%2
.17
%0
.67
%3
.23
%2
.68
%1
.33
%1
.99
%0
.61
%3
.10
%2
.27
%1
.32
%1
.84
%R
etu
rn o
n a
ss
ets
0.0
9%
4.7
2%
3.8
5%
0.0
0%
1.7
4%
1.4
0%
0.4
5%
3.4
6%
0.0
5%
1.8
6%
1.2
8%
0.6
1%
3.8
1%
Re
turn
on
eq
uity
0.3
7%
17
.28
%1
0.9
7%
0.0
0%
4.2
1%
3.0
4%
0.9
7%
8.2
2%
0.1
0%
3.9
4%
2.6
2%
1.2
2%
7.8
8%
Re
turn
on
inve
stm
en
t0
.13
%6
.64
%5
.24
%0
.00
%2
.69
%2
.54
%0
.81
%5
.28
%0
.08
%3
.52
%2
.45
%1
.20
%7
.21
%E
arn
ing
s b
efo
re in
tere
st m
arg
in1
.78
%2
.21
%2
.17
%0
.67
%3
.23
%2
.68
%1
.33
%1
.99
%0
.61
%3
.10
%2
.27
%1
.32
%1
.84
%E
BIT
DA
ma
rgin
2.9
0%
3.1
2%
3.0
6%
1.6
0%
4.1
9%
3.7
4%
2.4
6%
3.0
1%
1.7
5%
4.2
5%
3.4
4%
2.5
4%
3.0
1%
EB
ITD
A/A
ss
ets
12
.76
%1
6.1
4%
18
.17
%2
.02
%5
.69
%4
.52
%3
.00
%2
3.8
7%
2.2
2%
5.6
7%
3.9
5%
3.0
9%
32
.90
%
20
14
E2
01
3 E

THIS PAGE LEFT INTENTIONALLY BLANK

THIS PAGE LEFT INTENTIONALLY BLANK

THIS PAGE LEFT INTENTIONALLY BLANK

BURKENROAD REPORTS RATING SYSTEM MARKET OUTPERFORM: This rating indicates that we believe forces are in place that would enable this company's stock to produce returns in excess of the stock market averages over the next 12 months. MARKET PERFORM: This rating indicates that we believe the investment returns from this company's stock will be in line with those produced by the stock market averages over the next 12 months. MARKET UNDERPERFORM: This rating indicates that while this investment may have positive attributes, we believe an investment in this company will produce subpar returns over the next 12 months. BURKENROAD REPORTS CALCULATIONS
CPFS is calculated using operating cash flows excluding working capital changes.
All amounts are as of the date of the report as reported by Bloomberg or Yahoo Finance unless otherwise noted. Betas are collected from Bloomberg.
Enterprise value is based on the equity market cap as of the report date, adjusted for long-term debt, cash, and short-term investments reported on the most recent quarterly report date.
12-month Stock Performance is calculated using an ending price as of the report date. The stock performance includes the 12-month dividend yield.
2012-2013 COVERAGE UNIVERSE AFC Enterprises Inc. (AFCE) Amerisafe Inc. (AMSF) Bristow Group Inc. (BRS) CalIon Petroleum Company (CPE) Cal-Maine Foods Inc. (CALM) Carbo Ceramics Inc. (CRR) Cash America International Inc. (CSH) CLECO Corporation (CNL) Conn's Inc. (CONN) Conrad Industries Inc. (CNRD) Crown Crafts Inc. (CRWS) Cyberonics Incorporated (CYBX) Denbury Resources Inc. (DNR) EastGroup Properties Inc. (EGP) EPL Oil & Gas Inc. (EPL) Evolution Petroleum Corp. (EPM) Gulf Island Fabrication Inc. (GIFI) Hibbett Sports (HIBB) Hornbeck Offshore Services Inc. (HOS) Houston Wire & Cable Company (HWCC)
IBERIABANK Corp. (IBKC) ION Geophysical Corp. (IO) Key Energy Services (KEG) Marine Products Corp. (MPX) MidSouth Bancorp Inc. (MSL) PetroQuest Energy Inc. (PQ) Pool Corporation (POOL) Powell Industries Inc. (POWL) Rollins Incorporated (ROL) RPC Incorporated (RES) Sanderson Farms Inc. (SAFM) SEACOR Holdings Inc. (CKH) Sharps Compliance Inc. (SMED) Stone Energy Corp. (SGY) Superior Energy Services Inc. (SPN) Susser Holdings Corp. (SUSS) Susser Petroleum Partners (SUSP) Team Incorporated (TISI) Teche Holding Company (TSH) Willbros Group Inc. (WG)
PETER RICCHIUTI Director of Research Founder of Burkenroad Reports [email protected] ANTHONY WOOD Senior Director of Accounting [email protected]
PIKE HOWARD DILIP KUMAR KYLE MAY Associate Directors of Research
BURKENROAD REPORTS Tulane University New Orleans, LA 70118-5669 (504) 862-8489 (504) 865-5430 Fax

To receive complete reports on any of the companies we follow, contact:Peter Ricchiuti, Founder & Director of Research
Tulane UniversityFreeman School of BusinessBURKENROAD REPORTS
Phone: (504) 862-8489Fax: (504) 865-5430
E-mail: [email protected] visit our web site at www.BURKENROAD.org
Printed on Recycled Paper
Named in honor of William B. Burkenroad Jr., an alumnus and a longtime supporter of Tulane’s business school, and funded through contributions from his family and friends, BURKENROAD REPORTS is a nationally recognized program, publishing objective, investment research reports on public companies in our region. Students at Tulane University’s Freeman School of Business prepare these reports.Alumni of the BURKENROAD REPORTS program are employed at a number of highly respected financial institutions including:ABN AMRO Bank · Aegis Value Fund · Invesco/AIM Capital Management · Alpha Omega Capital Partners · American General Investment Management · Ameriprise Financial · Atlas Capital · Banc of America Securities · Bank of Montreal · Bancomer · Barclays Capital · Barings PLC · Bearing Point · Bessemer Trust · Black Gold Capital· Bloomberg · Brookfield Asset Management · Brown Brothers Harriman Capital · Blackrock Financial Management · Boston Consulting Group · Buckingham Research · California Board of Regents · Cambridge Associates· Canaccord Genuity · Cantor Fitzgerald · Chaffe & Associates · Citadel Investment Group · Citibank · Citigroup Private Bank · City National Bank · Cornerstone Resources · Credit Suisse · D. A. Davidson & Co. · Deutsche Banc · Duquesne Capital Management · Equitas Capital Advisors· Factset Research · Financial Models · First Albany · Fiduciary Trust · Fitch Investors Services · Forex Trading · Franklin Templeton · Friedman Billings Ramsay · Fulcrum Global Partners · Gintel Asset Management · Global Hunter Securities · Goldman Sachs · Grosever Funds · Gruntal & Co. · Guggenheim Securities , LLC · Hancock Investment Services · Healthcare Markets Group · Capital One Southcoast · Howard Weil Labouisse Friedrichs · IBERIABANK Capital Markets · J.P. Morgan Securities · Janney Montgomery Scott · Jefferies & Co. · Johnson Rice & Co. · KBC Financial · KDI Capital Partners · Key Investments · Keystone Investments · Legacy Capital · Liberty Mutual · Lowenhaupt Global Advisors · Mackay Shields · Manulife/John Hancock Investments · Marsh & McLennan · Mercer Partners · Merrill Lynch · Miramar Asset Management · Moodys Investor Services · Morgan Keegan · Morgan Stanley · New York Stock Exchange · Perkins Wolf McDonnell · Piper Jaffray & Co. · Professional Advisory Services · Quarterdeck Investment Services · RBC · Raymond James · Restoration Capital · Rice Voelker, LLC · Royal Bank of Scotland· Sandler O'Neill & Partners · Sanford Bernstein & Co. · Scotia Capital · Scottrade · Second City Trading LLC · Sequent Energy · Sidoti & Co · Simmons & Co. · Southwest Securities · Stephens & Co. · Sterne Agee · Stewart Capital LLC · Stifel Nicolaus · Sun-Trust Capital Markets · Susquehanna Investment Group · Thomas Weisel Partners · TD Waterhouse Securities · Texas Employee Retirement System · Texas Teachers Retirement System · ThirtyNorth Investments · Thornburg Investment Management · Tivoli Partners · Tudor Pickering & Co. · Tulane University Endowment Fund · Turner Investment Partners · UBS · Value Line Investments · Vaughan Nelson Investment Management · Wells Fargo Capital Management · Whitney National Bank · William Blair & Co. · Zephyr Management