ds burkenroad report_pq
TRANSCRIPT

PETROQUEST ENERGY INCORPORATED PQ/NYSE
Continuing Coverage: Chance of Thunder on the Bayou
Investment Rating: MARKET OUTPERFORM
Opportunity for production growth in Thunder Bayou
Woodford joint venture expiration could free capital for reallocation
Low commodity prices could negatively impact long‐term strategy
PetroQuest has increased leverage to finance growth
Hedging position insufficient in 2015
Our 12‐month target price is $7.00
Company Quick View:
PetroQuest Energy Inc. is an independent oil and gas, exploration and production company. The Company acquires, drills, and operates oil, natural gas, and natural gas liquids wells and currently operations in the Gulf Coast, East Texas, and Oklahoma. As of December 2013, the Company had proved reserves of 3.1 thousand barrels of oil (Mbbl), 29.1 billion cubic feet equivalent of natural gas liquids (bcfe), and 254.2 billion cubic feet of natural gas (bcf). Based out of Lafayette, Louisiana, PetroQuest Energy Inc. was founded in 1983 and has 126 full‐time employees.
Analysts: Investment Research Manager: Dylan Fox Matthew Guidry Andrew Grin Dan Smith Alex Berrick
November 7, 2014
PRICE: $ 4.01 S&P 500: 2,031.92 DJIA: 17,573.93 RUSSELL 2000: 4,632.53
Valuation
EPS
P/ECFPS
P/CFPS
2013 A$ 0.1428.6x $ 0.954.2x
2014 E$ 0.4010.0x $ 2.381.7x
2015 E$ (0.24)
NM$ 2.061.9x
Market Capitalization Stock DataEquity Market Cap (MM): $ 264.75 52‐Week Range: $3.70 ‐ $7.59
Enterprise Value (MM): $ 620.15 12‐Month Stock Performance: ‐4.75%
Shares Outstanding (MM): 66.02 Dividend Yield: Nil
Estimated Float (MM): 57.24 Book Value Per Share: $ 1.976‐Mo. Avg. Daily Volume: 658,583 Beta: 2.07
The BURKENROAD REPORTS are produced solely as a part of an educational program of Tulane University's Freeman School of Business. The reports are not investment advice and you should not and may not rely on them in making any investment decision. You should consult an investment professional and/or conduct your own primary research regarding any potential investment.
Wall Street's Farm Team
BURK
ENRO
AD R
EPO
RTS
4/1/13 4:47 PM

PetroQuest Energy Inc. (PQ) BURKENROAD REPORTS (www.burkenroad.org) November 7, 2014
2
Figure 1: 5‐year Stock Price Performance
INVESTMENT SUMMARY
We give PetroQuest Energy Inc. a rating of Market Outperform and a 12 month target price of $7.00. Our valuation represents a 74.56% appreciation from the stock price on November 7, 2014. We implemented the three year present value of future oil and gas reserves, net of estimated direct expenses, discounted at an annual rate of 10%, also known as the PV‐10 valuation method, to arrive at our target price.
PetroQuest is an independent oil and natural gas exploration and production company with production focused in the East Texas Cotton Valley, Oklahoma Woodford Shale, and Gulf Coast on‐shore, and Gulf Coast shallow offshore areas. The forecast for PetroQuest is largely dependent on production parameters, potential increases in future well production, exposure to commodity prices, and exposure to interest rate risk. The Company has been successful in recent years in implementing its strategy of diversifying its assets from purely offshore and shallow onshore oil and natural gas, into a mix of shorter life assets and long life, low risk oil and natural gas liquids assets. While PetroQuest has diversified, the Company continues to use its geologic and drilling expertise in developing shorter life assets of South Louisiana and the Gulf Coast.
PetroQuest’s ability to create cash flows will be significantly influenced by two upcoming events: the conclusion of the Company’s Woodford joint venture with NextEra in the second quarter of 2015, and the result of the Company’s drilling operations in the Thunder Bayou Prospect in the Gulf Coast. Future investment decisions hinge on whether the joint venture with NextEra is extended and the level of production realized by the Thunder Bayou Prospect.
$3.00
$4.00
$5.00
$6.00
$7.00
$8.00
$9.00
$10.00
11/7/2009 11/7/2010 11/7/2011 11/7/2012 11/7/2013 11/7/2014
PetroQuest Energy Inc. (PQ) BURKENROAD REPORTS (www.burkenroad.org) November 7, 2014
3
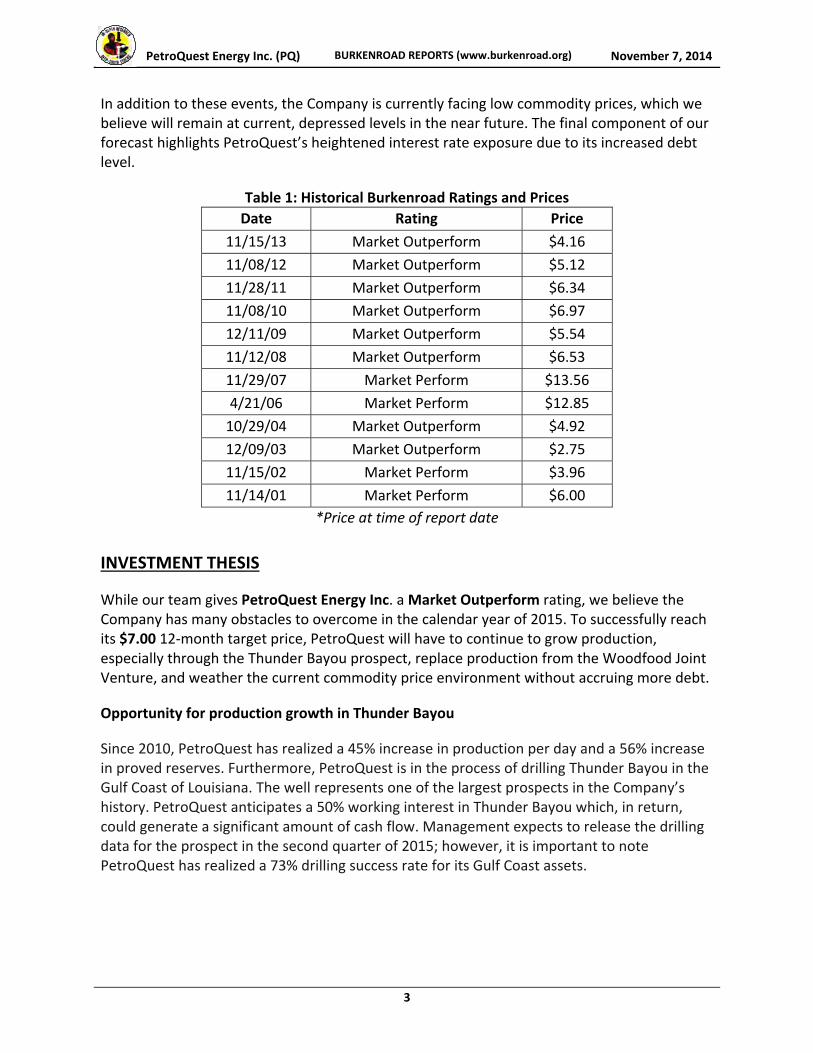
In addition to these events, the Company is currently facing low commodity prices, which we believe will remain at current, depressed levels in the near future. The final component of our forecast highlights PetroQuest’s heightened interest rate exposure due to its increased debt level.
Table 1: Historical Burkenroad Ratings and Prices
Date Rating Price
11/15/13 Market Outperform $4.16
11/08/12 Market Outperform $5.12
11/28/11 Market Outperform $6.34
11/08/10 Market Outperform $6.97
12/11/09 Market Outperform $5.54
11/12/08 Market Outperform $6.53
11/29/07 Market Perform $13.56
4/21/06 Market Perform $12.85
10/29/04 Market Outperform $4.92
12/09/03 Market Outperform $2.75
11/15/02 Market Perform $3.96
11/14/01 Market Perform $6.00
*Price at time of report date
INVESTMENT THESIS
While our team gives PetroQuest Energy Inc. a Market Outperform rating, we believe the Company has many obstacles to overcome in the calendar year of 2015. To successfully reach its $7.00 12‐month target price, PetroQuest will have to continue to grow production, especially through the Thunder Bayou prospect, replace production from the Woodfood Joint Venture, and weather the current commodity price environment without accruing more debt.
Opportunity for production growth in Thunder Bayou
Since 2010, PetroQuest has realized a 45% increase in production per day and a 56% increase in proved reserves. Furthermore, PetroQuest is in the process of drilling Thunder Bayou in the Gulf Coast of Louisiana. The well represents one of the largest prospects in the Company’s history. PetroQuest anticipates a 50% working interest in Thunder Bayou which, in return, could generate a significant amount of cash flow. Management expects to release the drilling data for the prospect in the second quarter of 2015; however, it is important to note PetroQuest has realized a 73% drilling success rate for its Gulf Coast assets.
PetroQuest Energy Inc. (PQ) BURKENROAD REPORTS (www.burkenroad.org) November 7, 2014
4
Woodford joint venture expiration could free capital for reallocation
In 2010, PetroQuest formed a favorable joint venture with NextEra Energy Inc. in the Woodford Shale region. The joint venture (also referred to as a “drilling promote”) with NextEra distributes the cost of development of the property as well as the revenue that it produces. Since the operation began, PetroQuest has paid 25% of expenditures in exchange 50% of the revenue stream. The current joint venture is set to conclude in the second quarter of 2015 unless a new agreement is developed with NextEra. According to PetroQuest management, the conclusion of the joint venture would result in a reallocation of capital toward other basins. PetroQuest will likely invest in its Cotton Valley assets if the joint venture is not renewed.
Low commodity prices could negatively impact long‐term strategy
PetroQuest maintains a long‐term strategy of utilizing free cash flows from its shorter life Gulf Coast assets to develop its longer‐life assets such as Woodford and Cotton Valley. The $188.8 million shallow‐water Gulf of Mexico acquisition represents the Company’s commitment to the proceeding strategy and the importance of its shorter life free cash flows. Since 2007, PetroQuest has generated over $400 million in free cash flow from its Gulf Coast assets.
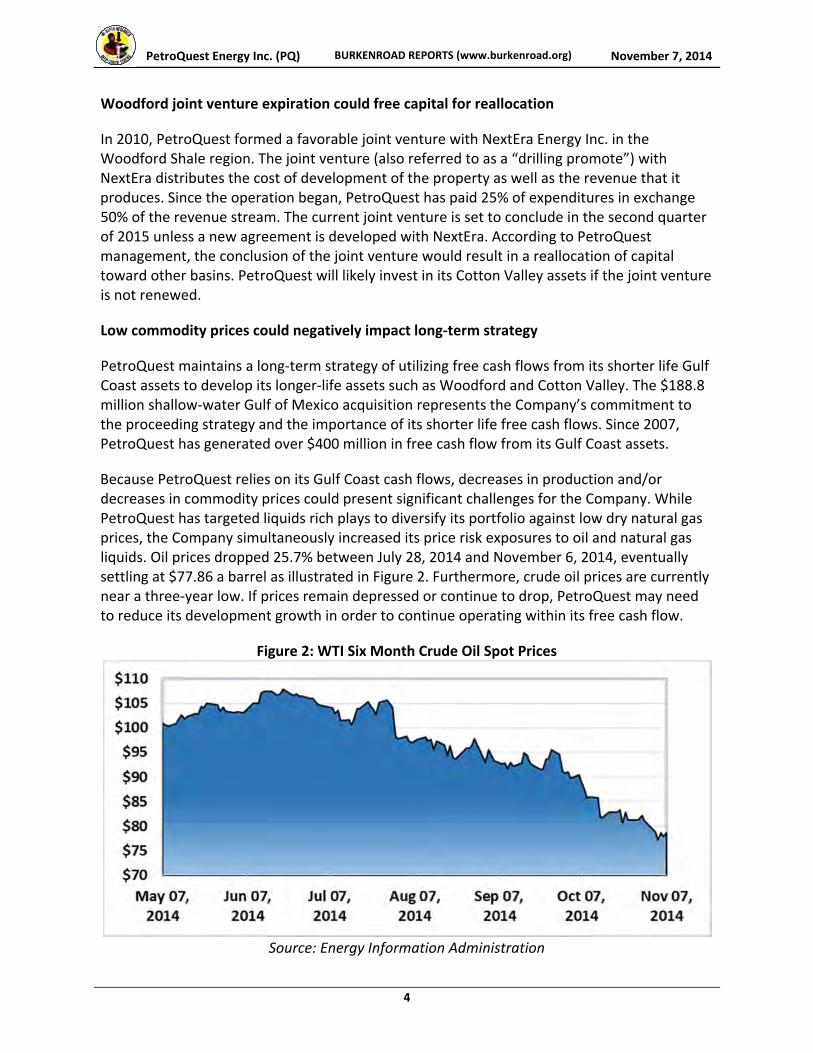
Because PetroQuest relies on its Gulf Coast cash flows, decreases in production and/or decreases in commodity prices could present significant challenges for the Company. While PetroQuest has targeted liquids rich plays to diversify its portfolio against low dry natural gas prices, the Company simultaneously increased its price risk exposures to oil and natural gas liquids. Oil prices dropped 25.7% between July 28, 2014 and November 6, 2014, eventually settling at $77.86 a barrel as illustrated in Figure 2. Furthermore, crude oil prices are currently near a three‐year low. If prices remain depressed or continue to drop, PetroQuest may need to reduce its development growth in order to continue operating within its free cash flow.
Figure 2: WTI Six Month Crude Oil Spot Prices
Source: Energy Information Administration
PetroQuest Energy Inc. (PQ) BURKENROAD REPORTS (www.burkenroad.org) November 7, 2014
5
PetroQuest has increased leverage to finance growth
To fund recent reserve and production growth, PetroQuest significantly increased its leverage. PetroQuest’s debt to equity ratio has grown from .67 in December, 2012 to 4.29 by December 31, 2013—a 540% increase. While the ratio has since declined to 3.24 on November 6, 2014, PetroQuest still remains highly leveraged compared to its industry peers. In 2013, the Company took on an additional $200 million in 10% Senior notes in order to fund the Gulf of Mexico Acquisition. The proceeding notes, along with $150 million in outstanding notes, are due in 2017. As a consequence of the newest offering, management indicated that the Company plans to refinance the 10% Senior notes by the end of 2015.
Hedging position insufficient in 2015
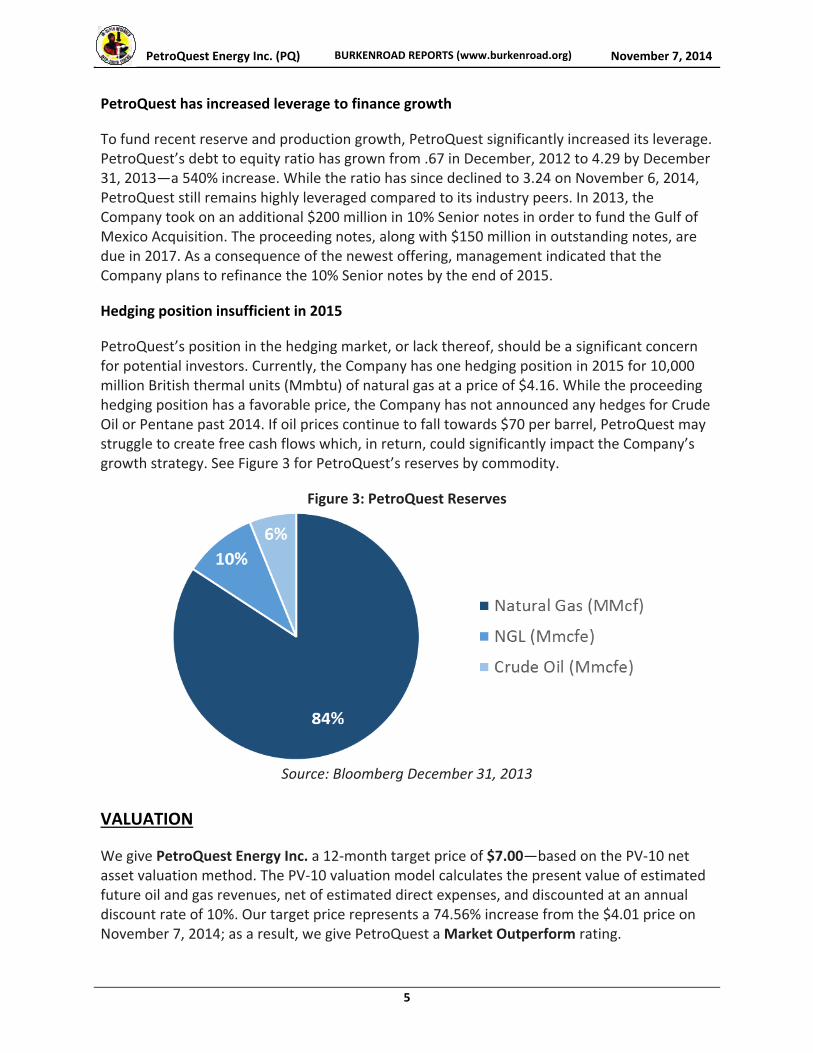
PetroQuest’s position in the hedging market, or lack thereof, should be a significant concern for potential investors. Currently, the Company has one hedging position in 2015 for 10,000 million British thermal units (Mmbtu) of natural gas at a price of $4.16. While the proceeding hedging position has a favorable price, the Company has not announced any hedges for Crude Oil or Pentane past 2014. If oil prices continue to fall towards $70 per barrel, PetroQuest may struggle to create free cash flows which, in return, could significantly impact the Company’s growth strategy. See Figure 3 for PetroQuest’s reserves by commodity.
Figure 3: PetroQuest Reserves
Source: Bloomberg December 31, 2013
VALUATION
We give PetroQuest Energy Inc. a 12‐month target price of $7.00—based on the PV‐10 net asset valuation method. The PV‐10 valuation model calculates the present value of estimated future oil and gas revenues, net of estimated direct expenses, and discounted at an annual discount rate of 10%. Our target price represents a 74.56% increase from the $4.01 price on November 7, 2014; as a result, we give PetroQuest a Market Outperform rating.
PetroQuest Energy Inc. (PQ) BURKENROAD REPORTS (www.burkenroad.org) November 7, 2014
6
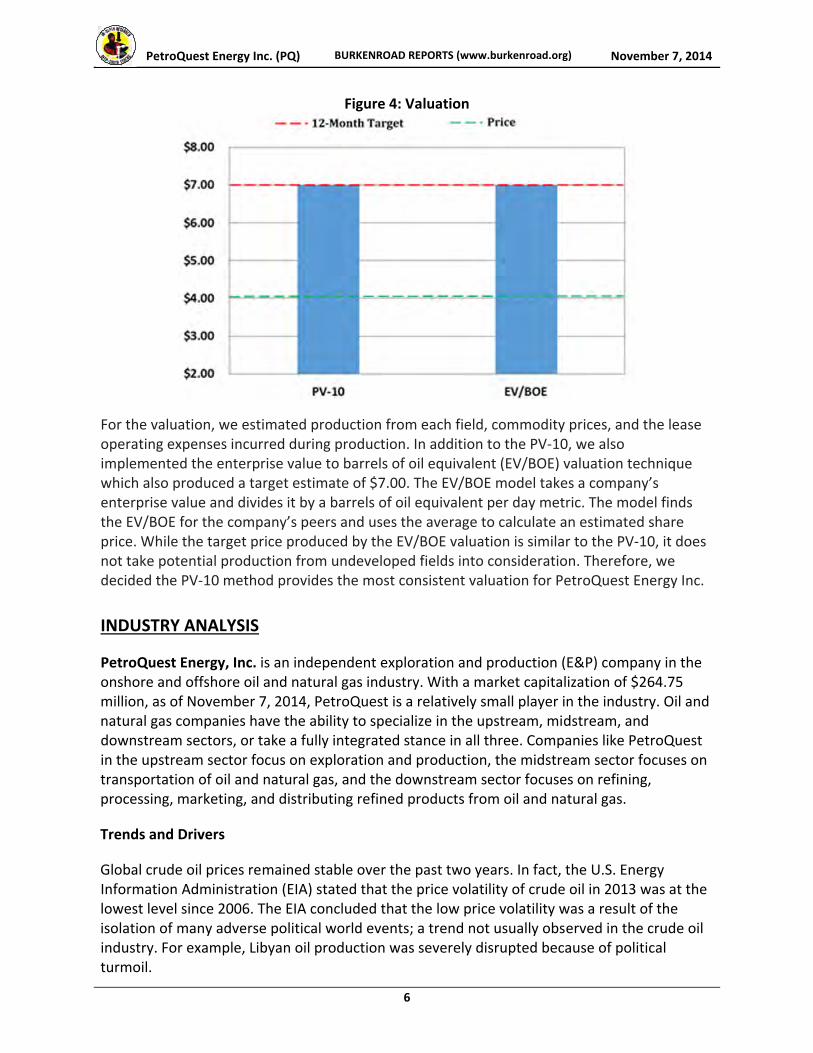
Figure 4: Valuation
For the valuation, we estimated production from each field, commodity prices, and the lease operating expenses incurred during production. In addition to the PV‐10, we also implemented the enterprise value to barrels of oil equivalent (EV/BOE) valuation technique which also produced a target estimate of $7.00. The EV/BOE model takes a company’s enterprise value and divides it by a barrels of oil equivalent per day metric. The model finds the EV/BOE for the company’s peers and uses the average to calculate an estimated share price. While the target price produced by the EV/BOE valuation is similar to the PV‐10, it does not take potential production from undeveloped fields into consideration. Therefore, we decided the PV‐10 method provides the most consistent valuation for PetroQuest Energy Inc.
INDUSTRY ANALYSIS
PetroQuest Energy, Inc. is an independent exploration and production (E&P) company in the onshore and offshore oil and natural gas industry. With a market capitalization of $264.75 million, as of November 7, 2014, PetroQuest is a relatively small player in the industry. Oil and natural gas companies have the ability to specialize in the upstream, midstream, and downstream sectors, or take a fully integrated stance in all three. Companies like PetroQuest in the upstream sector focus on exploration and production, the midstream sector focuses on transportation of oil and natural gas, and the downstream sector focuses on refining, processing, marketing, and distributing refined products from oil and natural gas.
Trends and Drivers
Global crude oil prices remained stable over the past two years. In fact, the U.S. Energy Information Administration (EIA) stated that the price volatility of crude oil in 2013 was at the lowest level since 2006. The EIA concluded that the low price volatility was a result of the isolation of many adverse political world events; a trend not usually observed in the crude oil industry. For example, Libyan oil production was severely disrupted because of political turmoil.

PetroQuest Energy Inc. (PQ) BURKENROAD REPORTS (www.burkenroad.org) November 7, 2014
7
However, other members of the Organization of the Petroleum Exporting Countries (OPEC), such as Saudi Arabia, consistently maintained oil output levels to support global oil demand. This helped create a relatively stable global oil supply.
The domestic development of shale oil has also been a large driver of stable crude oil prices. From 2012 to 2013, the U.S. increased crude oil production by 967,000 barrels per day to the highest level of production since 1989. According to the EIA, this production increase of 15% is the largest annual increase in the U.S. since 1940. As a result of this increase and a refusal of Organization of Petroleum Exporting Countries (OPEC) to reduce its production, oil price have dropped significantly during the fiscal year of 2014.
With the advances in onshore horizontal drilling and hydraulic fracturing, the U.S. has significantly increased its production of natural gas and is set to overtake Russia as the largest natural gas producer by 2015. Unlike crude oil prices, which are based on global demand, natural gas prices are based on local factors. In 2008, an increased supply of natural gas caused prices to decline roughly $8 per thousand cubic feet of natural gas to a price of $4, where prices have since remained. Low natural gas prices have forced natural gas producers, such as PetroQuest, to move away from dry gas exploration and production into the higher priced natural gas liquids or liquid rich shales. Other upstream companies have also been shifting out of natural gas and into oil in the near term.
Federal & State Regulations
PetroQuest is subject to federal and state laws regulating its drilling, operating, disposal, and abandonment of oil and gas wells in Texas, Oklahoma, Louisiana, and the Gulf of Mexico. At the state level, PetroQuest’s operations are regulated by the Louisiana Department of Natural Resources, the Texas Railroad Commission, and the Oklahoma Corporation Commission. These regulatory organizations have broad authority to regulate and oversee all aspects of exploration, production, and site restoration within Texas, Oklahoma, and Louisiana.
At the federal level, the Bureau of Ocean Energy Management (BOEM) and the Bureau of Safety and Environmental Enforcement (BSEE) regulate PetroQuest’s operations of federal oil and natural gas leases in the Gulf of Mexico. The BOEM oversees oil and gas resource potential, manages oil and gas lease sales in federal waters, and conducts environmental reviews. The BSEE ensures compliance with offshore regulatory requirements and coordination of oil spill cleanup, and holds operators accountable for commitments made when oil and gas leases are requested. Additionally, the Federal Energy and Regulatory Commission (FERC) regulates the transport and sale of oil and natural gas in interstate commerce to ensure no discrimination in accessing pipelines.
Environmental Regulations
The Environmental Protection Agency (EPA) has the primary federal authority to enforce federal environmental laws in the U.S. Other regulatory agencies that influence environmental regulations include the National Oceanic and Atmospheric Administration (NOAA), the U.S. Department of Energy (DOE), the Bureau of Land Management (BLM), and the BSEE.
PetroQuest Energy Inc. (PQ) BURKENROAD REPORTS (www.burkenroad.org) November 7, 2014
8
The primary federal laws influencing the oil and gas industry include: Energy Policy Act of 2005, Clean Air Act, Clean Water Act Federal Resource Conservation and Recovery Act, Oil Pollution Act, Coastal Zone Management Act, and Comprehensive Environmental Response Compensation and Liability Act.
State governments also have significant influence over environmental regulations that affect PetroQuest’s oil and gas drilling operations. The primary state authorities that carry out state oil and gas environmental laws are the Louisiana Department of Natural Resources, the Railroad Commission of Texas (RCT), and the Oklahoma Corporation Commission.
Barriers to Entry
PetroQuest operates in the upstream exploration and development sector of the oil and gas industry. As an upstream player, the Company experiences high upfront capital investments and strict regulation from federal and state agencies. By entering into the sector, companies are exposed to many different risks such as decreases in commodity prices, dry wells, increasing costs, labor shortages, political barriers, and subpar production. The industry also requires very experienced professional engineers, scientists, and geologists that have years of experience identifying and exploiting reserves. Consequently, companies interested in entering the upstream sector need a surplus of capital and a profound understanding of the industry’s technical challenges and regulatory requirements.
Bargaining Power of Suppliers
In the exploration and development sector, the bargaining power of suppliers is high. The power exists because oil and gas companies solicit specialized services to prospect, test, and drill the commodities. The proceeding services require not only state‐of‐the‐art equipment but also the expertise to operate efficiently. As a result, upstream oil and gas companies rely on a small group of suppliers and pay premium prices.
Bargaining Power of Buyers
The bargaining power of buyers in the oil and gas industry is low. There is very little elasticity of demand in the industry, which reduces the negotiation room for the buyers. The demand for oil, both at the intermediary and consumer level, is extremely high. As a whole, buyers may have some influence over pricing based on product quality but it is not nearly the influence suppliers’ yield.
Availability of Substitutes
The availability of substitutes to replace the oil and gas industry is very small. The upstream oil and gas industry provides crude products that are refined to be used for major everyday necessities. These necessities consist of powering utilities, heating houses and transportation. The main substitutes are renewable energy, carbon, and nuclear energy. Over the near future, none of these substitutes pose a major threat to the oil and gas industry. With renewable energy still being developed and nuclear energy posing major safety concerns, oil and gas will continue to be the main energy source across the globe.
PetroQuest Energy Inc. (PQ) BURKENROAD REPORTS (www.burkenroad.org) November 7, 2014
9
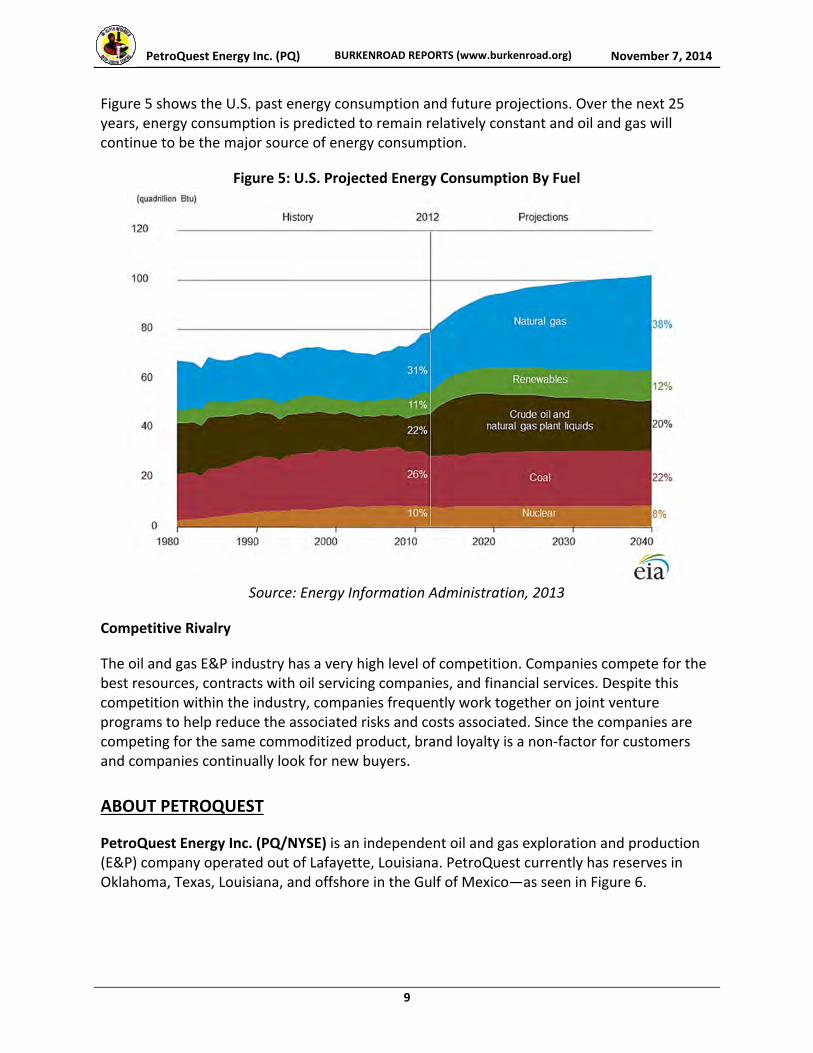
Figure 5 shows the U.S. past energy consumption and future projections. Over the next 25 years, energy consumption is predicted to remain relatively constant and oil and gas will continue to be the major source of energy consumption.
Figure 5: U.S. Projected Energy Consumption By Fuel
Source: Energy Information Administration, 2013
Competitive Rivalry
The oil and gas E&P industry has a very high level of competition. Companies compete for the best resources, contracts with oil servicing companies, and financial services. Despite this competition within the industry, companies frequently work together on joint venture programs to help reduce the associated risks and costs associated. Since the companies are competing for the same commoditized product, brand loyalty is a non‐factor for customers and companies continually look for new buyers.
ABOUT PETROQUEST
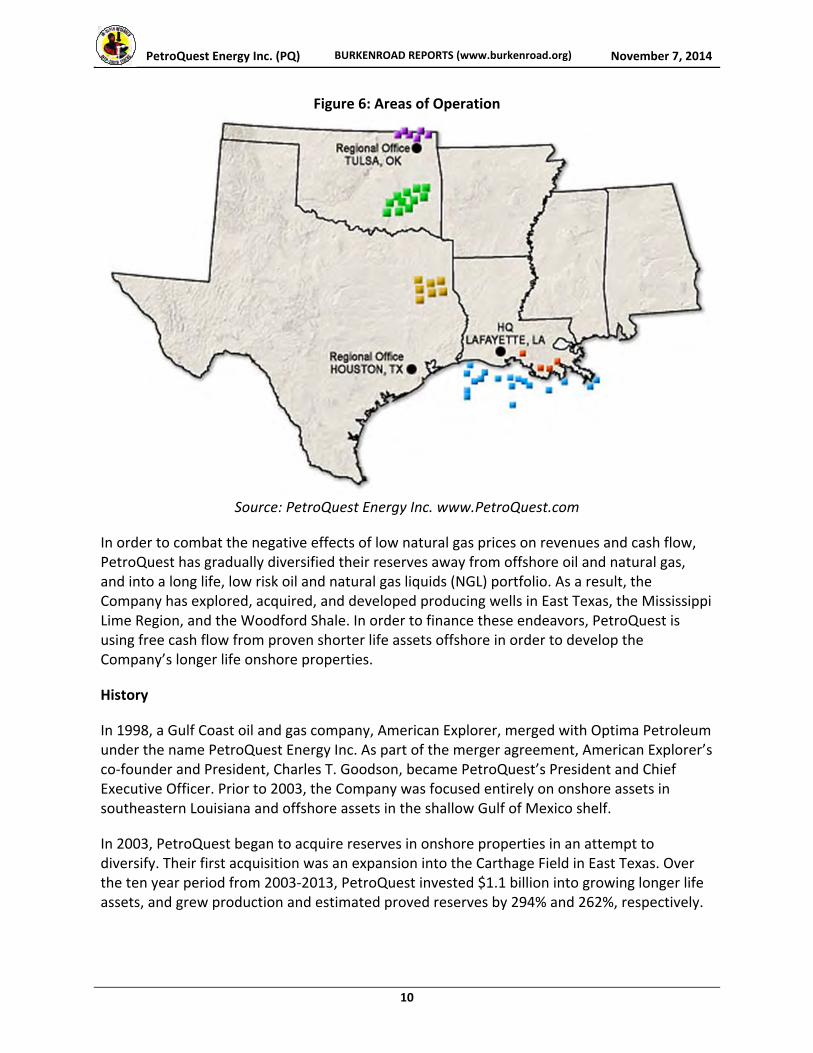
PetroQuest Energy Inc. (PQ/NYSE) is an independent oil and gas exploration and production (E&P) company operated out of Lafayette, Louisiana. PetroQuest currently has reserves in Oklahoma, Texas, Louisiana, and offshore in the Gulf of Mexico—as seen in Figure 6.
PetroQuest Energy Inc. (PQ) BURKENROAD REPORTS (www.burkenroad.org) November 7, 2014
10
Figure 6: Areas of Operation
Source: PetroQuest Energy Inc. www.PetroQuest.com
In order to combat the negative effects of low natural gas prices on revenues and cash flow, PetroQuest has gradually diversified their reserves away from offshore oil and natural gas, and into a long life, low risk oil and natural gas liquids (NGL) portfolio. As a result, the Company has explored, acquired, and developed producing wells in East Texas, the Mississippi Lime Region, and the Woodford Shale. In order to finance these endeavors, PetroQuest is using free cash flow from proven shorter life assets offshore in order to develop the Company’s longer life onshore properties.
History
In 1998, a Gulf Coast oil and gas company, American Explorer, merged with Optima Petroleum under the name PetroQuest Energy Inc. As part of the merger agreement, American Explorer’s co‐founder and President, Charles T. Goodson, became PetroQuest’s President and Chief Executive Officer. Prior to 2003, the Company was focused entirely on onshore assets in southeastern Louisiana and offshore assets in the shallow Gulf of Mexico shelf.
In 2003, PetroQuest began to acquire reserves in onshore properties in an attempt to diversify. Their first acquisition was an expansion into the Carthage Field in East Texas. Over the ten year period from 2003‐2013, PetroQuest invested $1.1 billion into growing longer life assets, and grew production and estimated proved reserves by 294% and 262%, respectively.

PetroQuest Energy Inc. (PQ) BURKENROAD REPORTS (www.burkenroad.org) November 7, 2014
11
Products
PetroQuest produces and sells natural gas, natural gas liquids (NGL), and crude oil under fixed and floating market contracts at current market prices. For the second quarter ending June 30, 2014, PetroQuest produced 230.2 million barrels of oil (Mboe), 7.696 billion of cubic feet equivalent (Bcfe) of gas, and 1.658 Bcfe of NGL. This represents a 99.0% increase in oil production, 14.3% increase in gas production, and 31.9% increase in NGL production, compared to the second quarter of 2013. The growth of PetroQuest’s crude oil and NGL production demonstrates the Company’s strategic focus on growing reserves and production of its higher priced commodities. While natural gas prices spiked in early 2014 because of harsh winter weather, prices decreased to nearly $4.50 per million British thermal units (mmBtu) by June 30, 2014. Analysts predict a slow, long‐term rise in natural gas prices, though short term prices will remain volatile and significantly lower than NGL and crude oil prices. PetroQuest’s 2013 reserves were 254.168 Bcf of natural gas, 29.140 Bcfe NGL, and 3.084 million barrels of oil equivalent (MMBoe) of crude oil. These reserves represent a 31.7%
increase in natural gas, 14.9% increase in NGL, and 86.3% increase in crude oil over 2012.
Strategy
Maintain Financial Flexibility
PetroQuest counteracts the volatile energy sector by controlling the timing of its capital investments. As a result, the Company expects to manage changing commodity prices and unexpected movements in the global financial market. Furthermore, PetroQuest continues to operate a commodity hedging program that transforms non‐core assets into cash for new operations. The capital raised from this program is used for potential projects that are consistent with PetroQuest’s long‐term growth strategy.
Diversify for Balanced Growth
PetroQuest’s reserves portfolio is diversified between low and high‐risk projects. By concluding the 2013 calendar year with 81% of reserves in low‐risk basins, PetroQuest was able to confidently pursue the higher risk and higher potential flow basins along the Gulf Coast. Though Petroquest will maintain its reserves in liquefied natural gas, crude oil, and natural gas, the Company plans to allocate more resources to liquefied natural gas and crude oil production than natural gas due to current market prices.
Prospect Unexploited and High Potential Properties
PetroQuest focuses on prospective drill sites that are consistent with the Company’s existing operations. The Company seeks large acreage properties that permit the latest exploration, development, and operating techniques.
PetroQuest Energy Inc. (PQ) BURKENROAD REPORTS (www.burkenroad.org) November 7, 2014
12
Concentrate Production in Established Areas
PetroQuest plans to contain exploration and development activities to Oklahoma, Texas, and the Gulf Coast Basin. By concentrating its operational activities, the Company reduces operational expenses. Furthermore, PetroQuest believes its existing resources and relationships in Oklahoma, Texas, and the Gulf Coast Basin will offer new opportunity for expansion.
Competitors
PetroQuest competes in the independent oil and gas exploration and production industry. Its main competitors are independent oil and gas companies that operate in the same production areas. The Company’s major competitors include Abraxas Petroleum Corporation, EV Energy Partners Limited Partnership, PostRock Energy Corporation, Cimarex Energy Company, Newfield Exploration Company, and Quicksilver Resources Incorporated. These companies operate in the same areas and directly compete with PetroQuest for market share. The Company’s two major competitors are the Abraxas Petroleum Corporation and Newfield Exploration Company. These two companies, headquartered in Texas, operate under a similar market capitalization and conduct operations in the competitive gulf coast regions.
Latest Developments
Oklahoma ‐ Woodford
PetroQuest continues to participate in the drilling of natural gas liquids in the Woodford Shale Region. In 2013, the Company invested $36.2 million acquiring an additional 13,500 acres for prospective drill sites. Additionally, in 2013, the region realized an average daily production of 47 MMcfe—a 5% increase from 2012 daily production. PetroQuest’s increase in efficiency resulted in a reallocation of capital for the 2014 calendar year. The Company predicts the Woodford Shale region will consume 50% of its 2014 total capital expenditures.
East Texas
PetroQuest invested $11.3 million in East Texas properties in 2013. The Company drilled one gross well and plugged and abandoned other mature wells. The Company also added 2,000 new net acres to its existing 50,000 net acres in the East Texas region, increasing proved reserves by 3%. 2013 net production averaged 16.3 MMcfe per day, representing a 6% decrease from 2012. PetroQuest is currently drilling six gross wells and its #10 horizontal Cotton Valley Well achieved the highest initial production rate of any of PetroQuest’s East Texas horizontally drilled wells since entering the Cotton Valley in 2011.
Gulf of Mexico Acquisition
In the summer of 2013, PetroQuest purchased shallow water assets in the Gulf of Mexico for $188.8 million This acquisition included 16 wells located on seven platforms that effectively expanded the Company’s production by 235,000 gross barrels of oil as well as an additional gross 30.5 billion cubic feet of gas equivalent (bcfe) of estimated proved reserves.
PetroQuest Energy Inc. (PQ) BURKENROAD REPORTS (www.burkenroad.org) November 7, 2014
13
Using their expertise in offshore drilling, the Company plans to create free cash flow to develop longer life assets, specifically in the Woodford Shale and Cotton Valley plays.
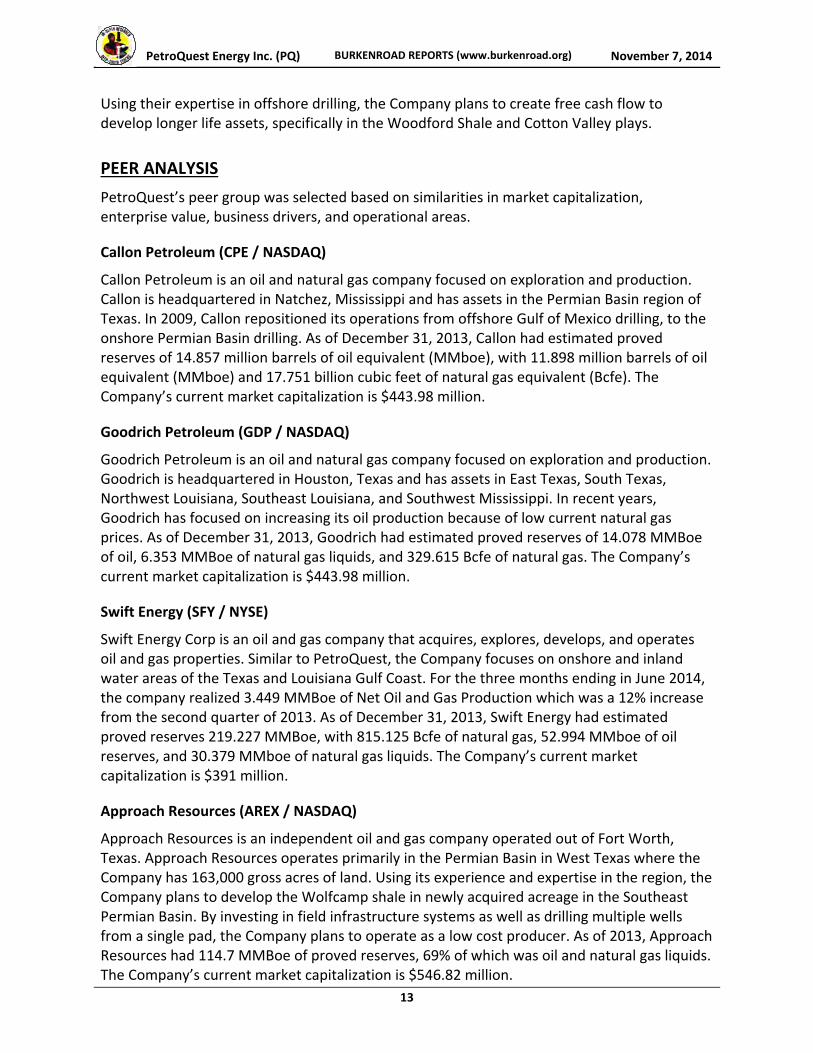
PEER ANALYSIS
PetroQuest’s peer group was selected based on similarities in market capitalization, enterprise value, business drivers, and operational areas.
Callon Petroleum (CPE / NASDAQ)
Callon Petroleum is an oil and natural gas company focused on exploration and production. Callon is headquartered in Natchez, Mississippi and has assets in the Permian Basin region of Texas. In 2009, Callon repositioned its operations from offshore Gulf of Mexico drilling, to the onshore Permian Basin drilling. As of December 31, 2013, Callon had estimated proved reserves of 14.857 million barrels of oil equivalent (MMboe), with 11.898 million barrels of oil equivalent (MMboe) and 17.751 billion cubic feet of natural gas equivalent (Bcfe). The Company’s current market capitalization is $443.98 million.
Goodrich Petroleum (GDP / NASDAQ)
Goodrich Petroleum is an oil and natural gas company focused on exploration and production. Goodrich is headquartered in Houston, Texas and has assets in East Texas, South Texas, Northwest Louisiana, Southeast Louisiana, and Southwest Mississippi. In recent years, Goodrich has focused on increasing its oil production because of low current natural gas prices. As of December 31, 2013, Goodrich had estimated proved reserves of 14.078 MMBoe of oil, 6.353 MMBoe of natural gas liquids, and 329.615 Bcfe of natural gas. The Company’s current market capitalization is $443.98 million.
Swift Energy (SFY / NYSE)
Swift Energy Corp is an oil and gas company that acquires, explores, develops, and operates oil and gas properties. Similar to PetroQuest, the Company focuses on onshore and inland water areas of the Texas and Louisiana Gulf Coast. For the three months ending in June 2014, the company realized 3.449 MMBoe of Net Oil and Gas Production which was a 12% increase from the second quarter of 2013. As of December 31, 2013, Swift Energy had estimated proved reserves 219.227 MMBoe, with 815.125 Bcfe of natural gas, 52.994 MMboe of oil reserves, and 30.379 MMboe of natural gas liquids. The Company’s current market capitalization is $391 million.
Approach Resources (AREX / NASDAQ)
Approach Resources is an independent oil and gas company operated out of Fort Worth, Texas. Approach Resources operates primarily in the Permian Basin in West Texas where the Company has 163,000 gross acres of land. Using its experience and expertise in the region, the Company plans to develop the Wolfcamp shale in newly acquired acreage in the Southeast Permian Basin. By investing in field infrastructure systems as well as drilling multiple wells from a single pad, the Company plans to operate as a low cost producer. As of 2013, Approach Resources had 114.7 MMBoe of proved reserves, 69% of which was oil and natural gas liquids. The Company’s current market capitalization is $546.82 million.
PetroQuest Energy Inc. (PQ) BURKENROAD REPORTS (www.burkenroad.org) November 7, 2014
14
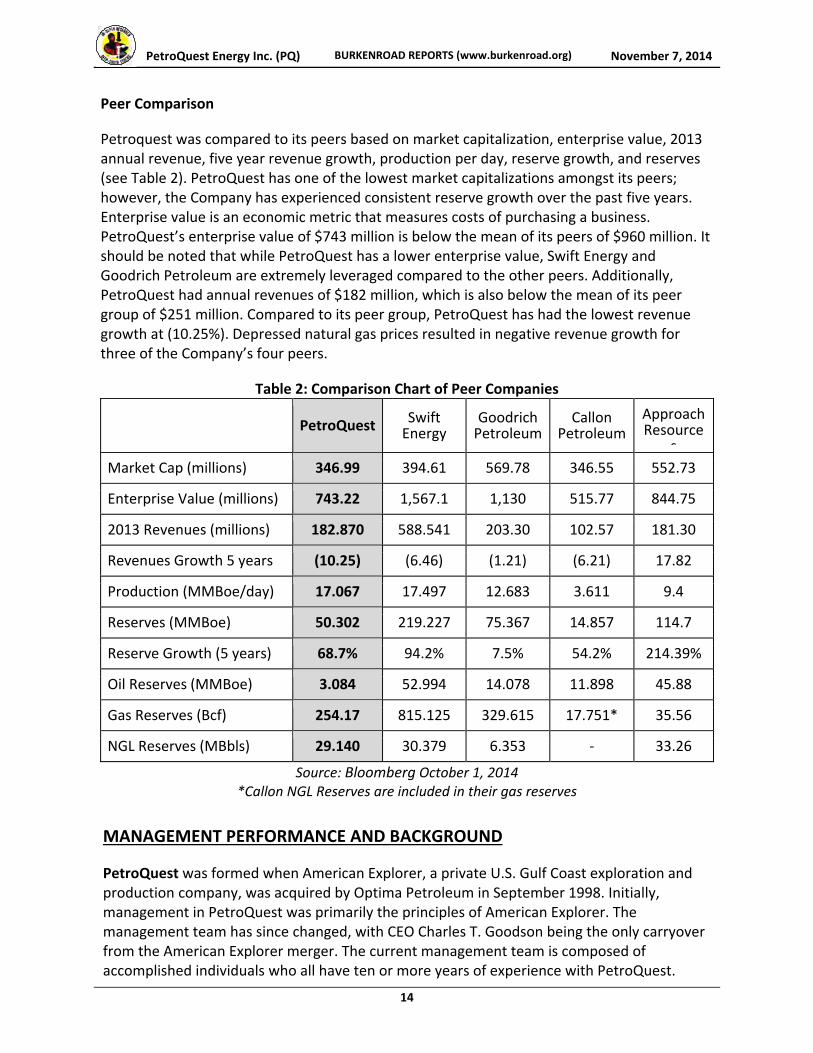
Peer Comparison
Petroquest was compared to its peers based on market capitalization, enterprise value, 2013 annual revenue, five year revenue growth, production per day, reserve growth, and reserves (see Table 2). PetroQuest has one of the lowest market capitalizations amongst its peers; however, the Company has experienced consistent reserve growth over the past five years. Enterprise value is an economic metric that measures costs of purchasing a business. PetroQuest’s enterprise value of $743 million is below the mean of its peers of $960 million. It should be noted that while PetroQuest has a lower enterprise value, Swift Energy and Goodrich Petroleum are extremely leveraged compared to the other peers. Additionally, PetroQuest had annual revenues of $182 million, which is also below the mean of its peer group of $251 million. Compared to its peer group, PetroQuest has had the lowest revenue growth at (10.25%). Depressed natural gas prices resulted in negative revenue growth for three of the Company’s four peers.
Table 2: Comparison Chart of Peer Companies
PetroQuest Swift Energy
Goodrich Petroleum
Callon Petroleum
Approach Resource
s
Market Cap (millions) 346.99 394.61 569.78 346.55 552.73
Enterprise Value (millions) 743.22 1,567.1 1,130 515.77 844.75
2013 Revenues (millions) 182.870 588.541 203.30 102.57 181.30
Revenues Growth 5 years (10.25) (6.46) (1.21) (6.21) 17.82
Production (MMBoe/day) 17.067 17.497 12.683 3.611 9.4
Reserves (MMBoe) 50.302 219.227 75.367 14.857 114.7
Reserve Growth (5 years) 68.7% 94.2% 7.5% 54.2% 214.39%
Oil Reserves (MMBoe) 3.084 52.994 14.078 11.898 45.88
Gas Reserves (Bcf) 254.17 815.125 329.615 17.751* 35.56
NGL Reserves (MBbls) 29.140 30.379 6.353 ‐ 33.26
Source: Bloomberg October 1, 2014 *Callon NGL Reserves are included in their gas reserves
MANAGEMENT PERFORMANCE AND BACKGROUND
PetroQuest was formed when American Explorer, a private U.S. Gulf Coast exploration and production company, was acquired by Optima Petroleum in September 1998. Initially, management in PetroQuest was primarily the principles of American Explorer. The management team has since changed, with CEO Charles T. Goodson being the only carryover from the American Explorer merger. The current management team is composed of accomplished individuals who all have ten or more years of experience with PetroQuest.

PetroQuest Energy Inc. (PQ) BURKENROAD REPORTS (www.burkenroad.org) November 7, 2014
15
Return on invested capital (ROIC) is an important method of measuring the performance of a company’s management. While many analysts use return on equity (ROE) in order to evaluate management, only ROIC compares company earnings to total capital investment by combining both equity and total debt. The ability to generate returns on invested capital provides insight into management’s effectiveness.
In 2011 and 2012, PetroQuest underperformed the average ROIC of its observed peers. Still, 2012 saw the only negative ROIC over the three year period from 2011‐2013. PetroQuest’s large variance in ROIC can be attributed to the issuance of a large amount of debt to finance the Gulf of Mexico Acquisition in 2013. Most companies have shown a decline in ROIC over the last three years, exhibiting a recent overall downtrend in the industry as shown in the average row in Table 3.
Table 3: Return Over Invested Capital for PetroQuest and its Peers
ROIC 2011 2012 2013
PetroQuest 3.58% (38.65)% 7.48%
Callon Petroleum 45.88% 2.80% 1.10%
Goodrich Petroleum 2.16% (5.67)% (8.26)%
Swift Energy 7.89% 3.17% 1.56%
Approach Resources 2.26% 1.52% 9.54%
Average 12.35% (7.37)% 2.28%
Source: Morningstar October 12, 2014
Charles T. Goodson Chief Executive Officer (58)
Charles T. Goodson began working in the oil and gas industry with Mobil Oil from 1977 to 1980 and with Callon Petroleum from 1980 to 1985. After leaving Callon, he co‐founded American Explorer, an exploration and production company focused on the Gulf of Mexico and the Gulf Coast. Mr. Goodson owned American Explorer and served as President until 1998 when the company merged with PetroQuest Energy. Since 1998, Goodson has served as PetroQuest’s President and Chief Executive Officer.
W. Todd Zehnder Chief Operating Officer (38)
W. Todd Zehnder began working in the oil and gas industry with KPMG from 1997 to 2001. Mr. Zehnder joined PetroQuest in 2001 and has served the Company as Executive Vice President, Chief Financial Officer and Treasurer, Vice President of Corporate Development, Vice President of Oil and Gas Marketing, and Controller. He is a Certified Public Accountant and has served as PetroQuest’s Chief Operating Officer since October 2009.
PetroQuest Energy Inc. (PQ) BURKENROAD REPORTS (www.burkenroad.org) November 7, 2014
16
J. Bond Clement Chief Financial Officer (42)
J. Bond Clement is a Certified Public Accountant who began working for various energy clients at Arthur Anderson from 1993 to 1996. From 1996 until 2004, Mr. Clement worked in several finance and accounting positions at Stone Energy and Freeport‐McMoRan. He joined Petroquest in October 2004 and has served as Chief Financial Officer since October 2009.
Art M. Mixon Executive Vice President Operations and Production (58)
Art M. Mixon joined Petroquest in January 2001 after working for over 20 years in the oil and gas industry with Amoco, British Petroleum Amoco, and British Petroleum. Mr. Mixon is currently a Registered Professional Engineer and currently serves as PetroQuest’s Executive Vice President of Operations and Production.
Management Incentives
PetroQuest uses a Compensation Committee to establish and monitor the Company’s compensation system. The Committee develops an executive compensation system that encourages both short and long term performance. Furthermore the Committee determines management incentives, the CEO’s bonus, and reviews, evaluates, and approves the compensation of all directors and executive officers. They also must approve all benefits including salary adjustments, bonuses, and stock options. Financial and strategic performances are the main criteria for establishing the compensation system.
SHAREHOLDER ANALYSIS
PetroQuest’s shares attract niche investors that operate growth and blend portfolios. The majority of the Company’s outstanding shares are distributed between Investment Advisors and individuals, with holdings of 67.33% and 17.18%, respectively.
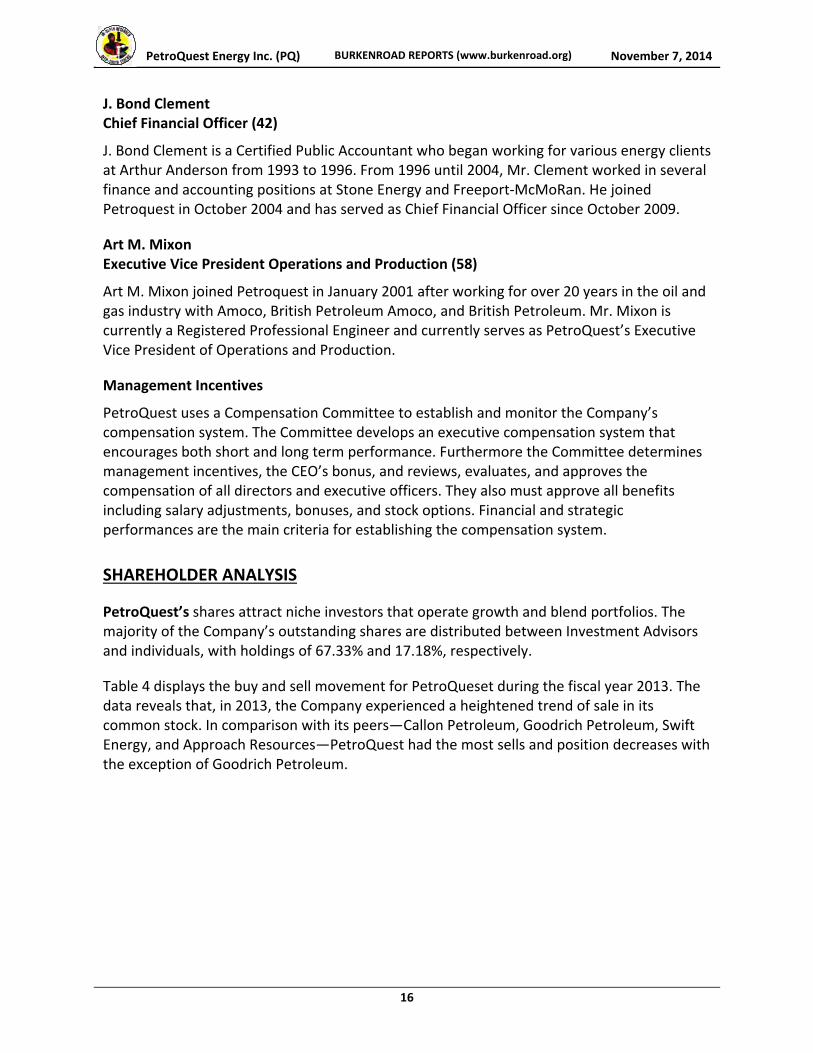
Table 4 displays the buy and sell movement for PetroQueset during the fiscal year 2013. The data reveals that, in 2013, the Company experienced a heightened trend of sale in its common stock. In comparison with its peers—Callon Petroleum, Goodrich Petroleum, Swift Energy, and Approach Resources—PetroQuest had the most sells and position decreases with the exception of Goodrich Petroleum.
PetroQuest Energy Inc. (PQ) BURKENROAD REPORTS (www.burkenroad.org) November 7, 2014
17
Table 4: PetroQuest Investor Rotation
Rotation Investors % Outstanding Value ($MM)
Buys 103 32.47 156.81
Buy‐Ins 44 3.4 16.18
Position Increase 59 29.07 140.63
Sells 146 35.15 165.48
Sell‐Outs 78 0 0.00
Positions Decrease 68 35.15 165.48
No Change 31 3.17 15.58
Source: Thompson One October 12, 2014
Petroquest’s Insider Holdings
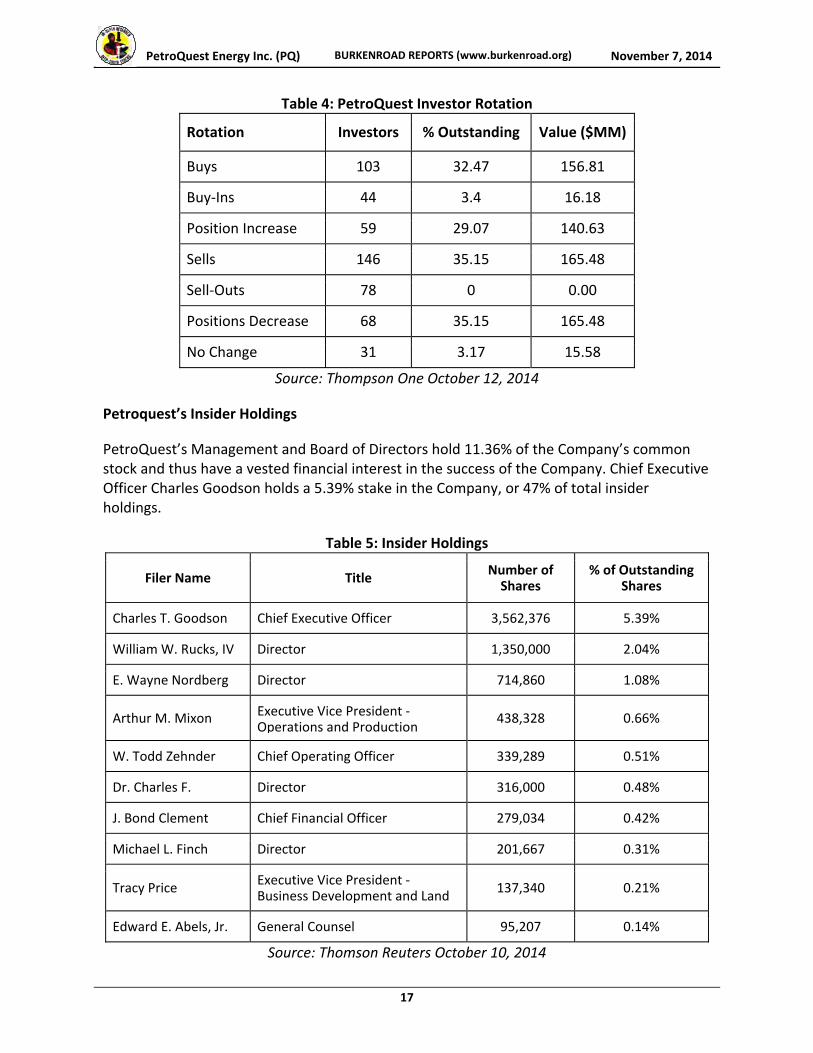
PetroQuest’s Management and Board of Directors hold 11.36% of the Company’s common stock and thus have a vested financial interest in the success of the Company. Chief Executive Officer Charles Goodson holds a 5.39% stake in the Company, or 47% of total insider holdings.
Table 5: Insider Holdings
Filer Name Title Number of Shares
% of Outstanding Shares
Charles T. Goodson Chief Executive Officer 3,562,376 5.39%
William W. Rucks, IV Director 1,350,000 2.04%
E. Wayne Nordberg Director 714,860 1.08%
Arthur M. Mixon Executive Vice President ‐Operations and Production
438,328 0.66%
W. Todd Zehnder Chief Operating Officer 339,289 0.51%
Dr. Charles F. Director 316,000 0.48%
J. Bond Clement Chief Financial Officer 279,034 0.42%
Michael L. Finch Director 201,667 0.31%
Tracy Price Executive Vice President ‐Business Development and Land
137,340 0.21%
Edward E. Abels, Jr. General Counsel 95,207 0.14%
Source: Thomson Reuters October 10, 2014

PetroQuest Energy Inc. (PQ) BURKENROAD REPORTS (www.burkenroad.org) November 7, 2014
18
PetroQuest Institutional Holders
PetroQuest’s top ten institutional holders own 31.13% of the Company and the top three institutions hold 17.43% of the Company. The concentration of Company holdings among a small group of investors decreases the stocks liquidity. Index and growth funds make up the majority of these institutional investors as the Company is held in many small capitalization growth funds. It should also be noted that, as of October 2014, institutional investors held approximately 65% of PetroQuest shares, which is a decline from a high of 86.29% held by institutions in March of 2013.
Table 6: Institutional Holders
Source: Bloomberg October 7, 2014 *N/A Indicates holding PetroQuest in multiple portfolios
Holder Investor Style Number of Shares
% of Outstanding
Shares
Blackrock Index 5,741,237 8.69%
Vanguard Group Inc Index 3,692,194 5.59%
Voya Investment Management LLC N/A 2,081,500 3.15%
Dimensional Fund Advisors LP Core Growth 1,931,813 2.92%
Segall Bryant & Hamill Core Growth 1,416,616 2.14%
Kennedy Capital Management Growth At Reasonable Price 1,257,196 1.90%
Driehaus Capital Management LLC
Aggressive Growth 1,120,280 1.69%
Frank Russell Trust Company N/A 1,119,262 1.69%
Allianz Se Core Growth 1,112,180 1.68%
State Street Corp Index 1,108,614 1.68%
RISK ANALYSIS AND INVESTMENT CAVEATS
PetroQuest is exposed to a variety of risks standard to the oil and gas exploration and production industry that can impact the company in the short and long term. These risks factors fall into three main categories: operational, regulatory, and financial.
Operational Risks
Environmental Risks
Severe weather—especially in the Gulf Coast region—can impose catastrophic damage to exploration and production companies. Approximately 40% of PetroQuest’s production is exposed to the risk of severe weather in the Gulf Coast region including hurricanes, tropical storms, flooding, and coastal erosion.

PetroQuest Energy Inc. (PQ) BURKENROAD REPORTS (www.burkenroad.org) November 7, 2014
19
Such events can halt operations, damage facilities and equipment, and restrict production through third party pipelines. While PetroQuest’s offshore properties are exposed to severe weather risks, the Company also possesses safer onshore oil and gas properties.
Reserve Replacement Risk
PetroQuest’s ability to find, develop, and acquire additional oil and gas reserves is critical in determining its future financial condition. Exploration and production companies can experience severe decline curves in production and, in turn, are required to invest heavily in exploration opportunities. To maintain adequate reserves, PetroQuest relies on its ability to drill commodity rich sites while simultaneously avoiding low‐yielding or dry wells.
Commodity Price Risk
The price received for PetroQuest’s oil and gas influences revenues, profitability, future growth, and the carrying value of oil and natural gas properties. As a consequence, commodity prices drive the current and future financial condition of the Company. Oil and gas prices are affected by changes in supply and demand, market uncertainty, weather conditions, and the level of consumer product demand. The increase of natural gas production in the U.S. has resulted in less price volatility. However, as a consequence of heightened production, prices of oil and natural gas have dropped significantly. To combat commodity price risk, PetroQuest developed a diversified portfolio with oil natural gas, and natural gas liquids in on and off‐shore locations. Therefore, the Company has the ability adjust production as a response to volatile commodity prices.
Regulatory Risks
PetroQuest’s ability to continue exploration and production of its offshore and onshore assets is significantly influenced by federal and state regulations. Both oil and gas drilling activity and the health and safety of workers are regulated in the U.S. Future regulations could change the areas where drilling is allowed or the types of drilling activities allowed, and could lead to increased costs for environmental cleanup. Additionally, the increased attention on hydraulic fracturing and its environmental impact could result in increased federal and state oversight of onshore activities.
The impact regulatory risk can have on exploration and production companies is illustrated by the 2010 Deepwater Horizon oil spill that resulted in a six month moratorium on deep‐water drilling by the U.S. Department of the Interior. While this specific regulation did not affect PetroQuest because it does not operate in deep waters, future oil spills or environmental events could lead to new regulations that adversely impact Petroquest.
Financial, Liquidity, and Business Risks
Compared to its peers, PetroQuest exhibits a slightly above average liquidity risk. Liquidity risk refers to a company’s ability to pay off its short term financial obligations so as to mitigate large losses.

PetroQuest Energy Inc. (PQ) BURKENROAD REPORTS (www.burkenroad.org) November 7, 2014
20
As shown in Table 7, PetroQuest has a low cash ratio which is common in the exploration and production industry. At the end of fiscal year 2013, PetroQuest had a cash ratio of 0.09. This table implies that PetroQuest has less cash on hand than current liabilities and thus could struggle to pay short term debt obligations. In addition, it might be difficult to acquire additional debt because a low cash ratio is usually a red flag for creditors.
PetroQuest’s current ratio of 0.73 and quick ratio of 0.37 are comparable to its peers. The current ratio and the quick ratio measure a company's ability to pay off its liabilities with all of its assets or its most liquid assets, respectively. Generally speaking, ratios under 1 are a sign that a company might not be able to pay off its obligations, if necessary. However, these ratios appear to be on par with industry averages and peer averages.
As shown in the last column of Table 7, PetroQuest demonstrates a low ratio of cash flow from operations over average current liabilities as compared to its peers. The ratio of 0.55 is well below the peer average of 1.28 and is only greater than Goodrich Petroleum’s ratio of 0.54. This could be attributed to the Company’s recent acquisition of property in the Gulf of Mexico that was financed predominantly with debt. In addition, the Company is in a transition, shifting its portfolio onshore and has taken on debt to complete this shift.
Table 7: Liquidity Ratios at the End of 2013
Company Cash Ratio
Current Ratio
Quick Ratio
Cash Flow from Operations/ Avg. Current Liabilities
PetroQuest 0.09 0.73 0.37 0.55
Callon Petroleum 0.05 0.47 0.38 1.07
Goodrich Petroleum 0.32 0.87 0.34 0.54
Swift Energy 0.02 0.49 0.42 1.76
Approach Resources 0.7 1.07 0.97 1.74
Peer Average 0.27 0.73 0.53 1.28
Source: Bloomberg October 1, 2014
Credit Risk
Credit risk refers to the probability a company will default on its debt payments. PetroQuest has continued to increase its debt liability over the past year in order to retain capital. The Company has a higher total debt‐to‐equity ratio than its peers. This higher debt‐to‐equity ratio is a result of an acquisition in the Gulf of Mexico that was financed entirely with $188.8 million of debt. The financing for this acquisition nearly doubled the total debt‐to‐equity and total debt to assets ratio from the previous year. with the increase in debt, PetroQuest is able to maintain an interest coverage ratio higher than the peer average and the ratio is relatively unchanged from the previous year of 1.64 (see Table 8).

PetroQuest Energy Inc. (PQ) BURKENROAD REPORTS (www.burkenroad.org) November 7, 2014
21
Table 8: Credit Ratios at End of 2013
Company Total Debt/ Equity (%)
Interest Coverage
(x)
Total Debt/ Total Asset
(%)
Market Capitalization (Millions)
Reserves (MMBOE)
PetroQuest 428.88 1.62 63.70 275 50.3
Callon Petroleum
27.14 2.26 17.87 263.5 14.9
Goodrich Petroleum 136.18 (.79) 49.84 753.3 75.4
Swift Energy 110.56 1.64 43.21 585.9 219.2
Approach Resources 35.19 3.02 21.82 753.6 114.7
Peer Average 77.27 1.53 33.19 589.08 106.05
Source: Bloomberg October 1, 2014
FINANCIAL PERFORMANCE AND PROJECTIONS
PetroQuest’s financial performance and projections are based on its ability to produce cash flows in the Gulf Coast to continue growth in the Cotton Valley fields. Because of significant uncertainty in the Company’s future (i.e. the continuation of the Woodford Joint Agreement and the success of the Bayou Thunder prospect) we were forced to make numerous assumptions in our revenue model. Despite PetroQuest’s recent effort to diversify its portfolio across oil, natural gas, and natural gas liquids, the Company is subject to significant commodity price risk. While oil prices remain depressed, our model does not reflect the extent of the drop below $85.
Production
Our revenue model relies on the estimated reserves and production for each of the following fields: Woodford, Mississippi Lime, Cotton Valley, and the Gulf Coast. After speaking with management regarding the estimated CAPEX for 2015, we came to the conclusion that PetroQuest would cease its operations in the Mississippi Lime region. Additionally, we made the assumption that the Company would not renew its joint venture with Nextera in the Woodfood region. As a consequence, we projected no new wells in the Woodford region starting in the second quarter of 2015. Lastly, during our meeting with management, Mr. Quantz referenced a significant reallocation of CAPEX from the Woodford region to Cotton Valley if the joint venture were to end. Therefore, our estimated reserves and production reflect 20 new net wells per annum in the Cotton Valley region.

PetroQuest Energy Inc. (PQ) BURKENROAD REPORTS (www.burkenroad.org) November 7, 2014
22
Commodity Prices
Commodity prices significantly impact our revenue model because PetroQuest’s revenues from production are determined by the price of oil, natural gas, and natural gas liquids. Exploration and production companies can mitigate the impact of changing commodity prices by hedging their production; however PetroQuest has currently announced only one hedging position for natural gas in 2015 and none for crude oil or Pentane. Taking into account the hedged and unhedged portions of production, we forecasted revenues using commodity prices compiled by the Burkenroad Reports program. These commodity prices were the result of a compilation of publicly available data from the Energy Information Administration’s (EIA) Short‐Term Outlook, the EIA’s Annual Energy Outlook, and Louisiana Light Sweet Crude New York Mercantile Exchange Futures. While these forecasts were updated October 13, 2014 to account for the significant drop in oil prices to $85 per barrel, the continued drop in oil prices below $75 per barrel has not been accounted for in our model
Financing
Currently, PetroQuest has $350 million of 10% senior notes outstanding expiring in 2017. The Company plans to refinance the notes next year as indicated by management. We were unable to forecast any significant changes in interest expenses because the terms of the refinancing agreement are uncertain.
SITE VISIT
On Friday, October 24, our team of analysts traveled to Lafayette, Louisiana to visit PetroQuest’s headquarters. The team met with Matt Quantz, the Company’s Manager of Investor Relations and Corporate Communications. Mr. Quantz walked us through PetroQuest’s October 2014 investor presentation, detailing PetroQuest’s current and future operations. First, he explained the Company's growth over the past four years citing its 45% growth in production, 56% growth in proved reserves, 87% growth in present value with a 10 percent discount rate (PV10), and 44 percent growth in earnings before interest, taxes, depreciation, and amortization (EBITDA). Despite growth and promising performance indicators, Mr. Quantz acknowledged that the stock price has suffered, dropping 37% since 2010. While he appeared optimistic about PetroQuest’s financial standing, he acknowledged the importance of its Thunder Bayou prospect and the Woodford Joint Venture.
Currently, PetroQuest has a joint agreement (also referred to as a “drilling promote”) with NextEra to drill multiple wells in the Woodford shale region. This agreement shares the cost of developing the property as well as the revenue that it produces. Under this agreement, PetroQuest pays 25% of the expenditures and receives 50% of the revenue stream. NextEra offered these terms in return for PetroQuest’s experience in the exploration and production industry. Mr. Quantz explained to us that the joint agreement is set to expire in the second quarter of 2015.

PetroQuest Energy Inc. (PQ) BURKENROAD REPORTS (www.burkenroad.org) November 7, 2014
23
Mr. Quantz then discussed PetroQuest’s current operations and future prospects in the Gulf Coast. He noted one large factor that could affect PetroQuest’s future production is the Thunder Bayou Prospect, which is one of the largest drilling prospects PetroQuest has ever undertaken. PetroQuest is in the process of drilling the onshore Thunder Bayou prospect in South Louisiana and has a 50% working interest. The prospect represents a significant opportunity for the Company as it is believed to hold 162 billion cubic feet equivalent (Bcfe) of unrisked reserves. Mr. Quantz indicated that the Company is currently evaluating the progress internally and will likely release more data on the progress of this well by Q1 of 2015.
Site Visit Photo
PetroQuest Energy Inc. (PQ) BURKENROAD REPORTS (www.burkenroad.org) November 7, 2014
24
INDEPENDENT OUTSIDE RESEARCH
To adequately evaluate PetroQuest Energy Inc., research was compiled from a variety of primary and secondary sources. Primary sources included information from PetroQuest’s historical Annual Reports, Securities and Exchange Commission filings, press releases, earnings calls, investor presentations, and management guidance. Additionally, the Burkenroad Reports PetroQuest analyst team gained valuable secondary information from equity analysts’ reports, oil and gas industry reports, and from a meeting on November 9, 2014, with Hank Corder. Mr. Corder has years of invaluable experience in the E&P industry with companies such as Global Hunter Securities, Sterne Agee & Leach, and Southcoast Capital L.L.C.. Mr. Corder was well acquainted with PetroQuest and provided insight on many of the team’s unanswered questions.
Mr. Corder shared his experiences with PetroQuest and was able to highlight different trends in industry and Company operations. The most revealing insight regarded PetroQuest’s current hedging position in the futures exchange. The fact that PetroQuest is only hedged for the next six months baffled Mr. Corder. He stated a company of PetroQuest’s size, especially during periods of extreme commodity price uncertainty, should be significantly hedged to reduce any price risks. Because of the Company’s lack of hedging, Mr. Corder recommended that we conduct a sensitivity analysis for future commodity price changes to value the Company going forward.
Per Mr. Corder’s advice, we conducted a sensitivity analysis between crude oil prices and our PV‐10 valuation. By decreasing oil prices to a level of $75 a barrel, our valuation for PetroQuest fell by 10%. Furthermore, the PV‐10 model does not consider all expenses incurred throughout production. Additionally, depressed oil prices could have an even more significant impact on the actual share price.
PetroQuest Energy Inc. (PQ) BURKENROAD REPORTS (www.burkenroad.org) November 7, 2014
25
ANOTHER WAY TO LOOK AT IT
ALTMAN Z‐SCORE
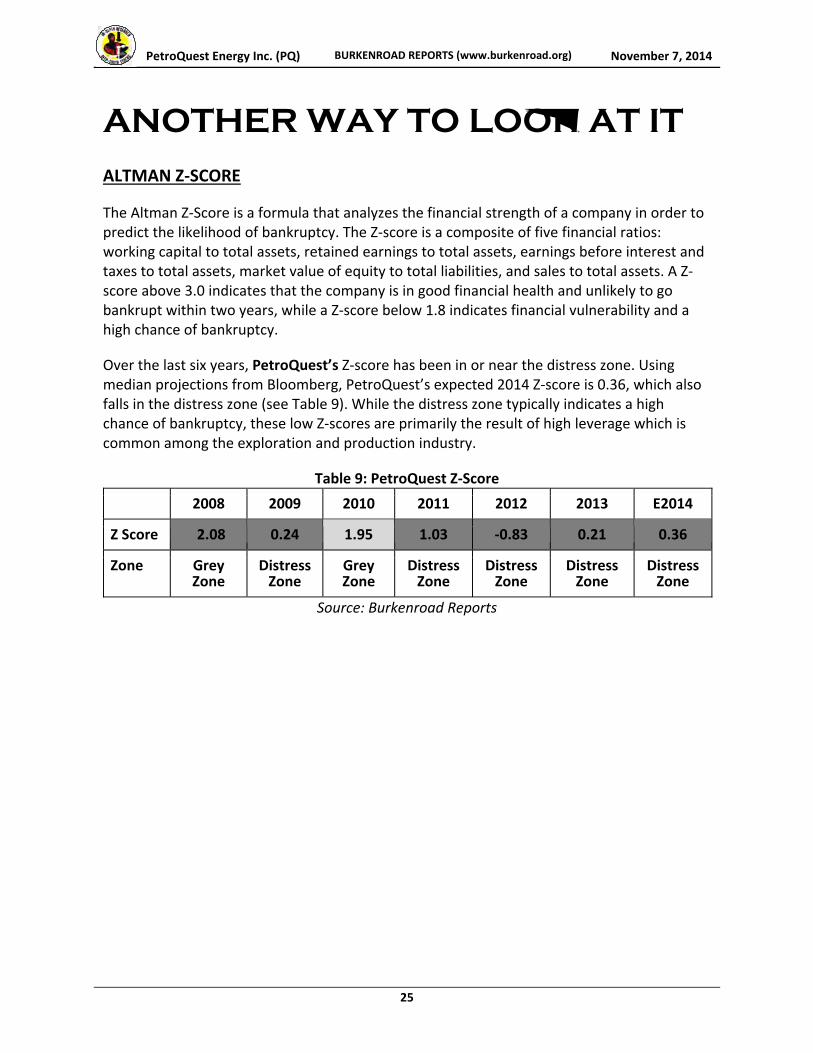
The Altman Z‐Score is a formula that analyzes the financial strength of a company in order to predict the likelihood of bankruptcy. The Z‐score is a composite of five financial ratios: working capital to total assets, retained earnings to total assets, earnings before interest and taxes to total assets, market value of equity to total liabilities, and sales to total assets. A Z‐score above 3.0 indicates that the company is in good financial health and unlikely to go bankrupt within two years, while a Z‐score below 1.8 indicates financial vulnerability and a high chance of bankruptcy.
Over the last six years, PetroQuest’s Z‐score has been in or near the distress zone. Using median projections from Bloomberg, PetroQuest’s expected 2014 Z‐score is 0.36, which also falls in the distress zone (see Table 9). While the distress zone typically indicates a high chance of bankruptcy, these low Z‐scores are primarily the result of high leverage which is common among the exploration and production industry.
Table 9: PetroQuest Z‐Score
2008 2009 2010 2011 2012 2013 E2014
Z Score 2.08 0.24 1.95 1.03 ‐0.83 0.21 0.36
Zone Grey Zone
Distress Zone
Grey Zone
Distress Zone
Distress Zone
Distress Zone
Distress Zone
Source: Burkenroad Reports

PetroQuest Energy Inc. (PQ) BURKENROAD REPORTS (www.burkenroad.org) November 7, 2014
26
PETER LYNCH EARNINGS MULTIPLE VALUATION
Peter Lynch is regarded as the most successful mutual fund manager of all time, having posted an average annual return of 29.2% in his portfolios over 13 years. In his book One Up On Wall Street, Lynch explains the charting tool he used (later deemed the “Peter Lynch Chart”) in order to determine whether a stock was undervalued and thus should be bought.
The chart overlaps a stock’s price with its “earnings line,” a value equal to 15 times the earnings per share. If a stock trades below its earnings line, Lynch would buy the equity because he believed it to be undervalued. Likewise, if the price rose above the earnings line, Lynch would sell.
Figure 7 shows the price of PetroQuest compared with its earnings line. At the current level, the price of the stock is well below the earnings line, and thus Peter Lynch would consider buying into the Company.
Figure 7: Earnings Line Versus Stock Price
Source: Bloomberg
PetroQuest Energy Inc. (PQ) BURKENROAD REPORTS (www.burkenroad.org) November 7, 2014
27
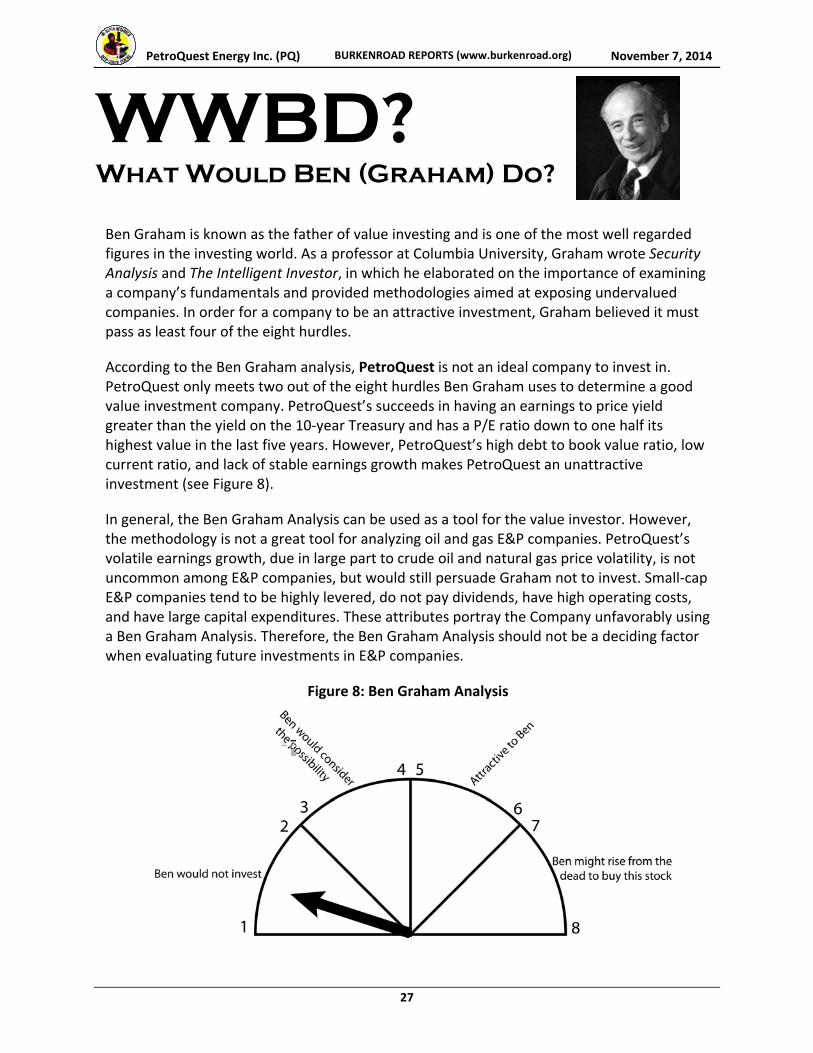
WWBD? What Would Ben (Graham) Do?
Ben Graham is known as the father of value investing and is one of the most well regarded figures in the investing world. As a professor at Columbia University, Graham wrote Security Analysis and The Intelligent Investor, in which he elaborated on the importance of examining a company’s fundamentals and provided methodologies aimed at exposing undervalued companies. In order for a company to be an attractive investment, Graham believed it must pass as least four of the eight hurdles.
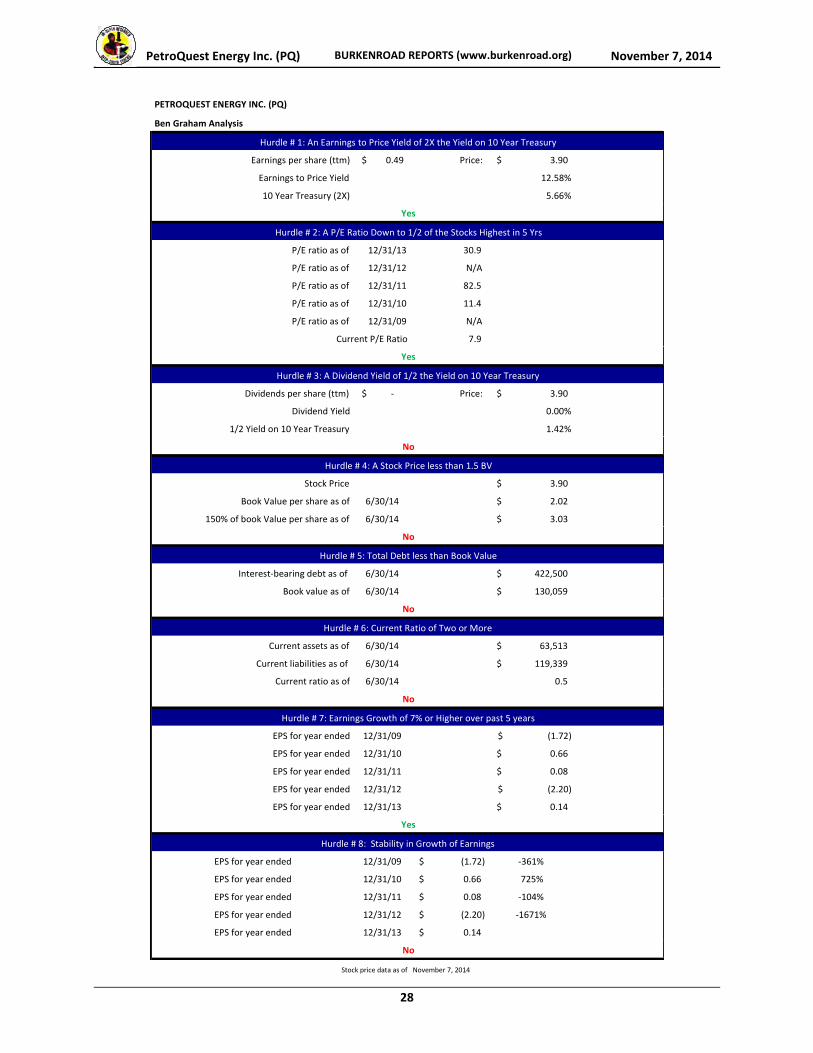
According to the Ben Graham analysis, PetroQuest is not an ideal company to invest in. PetroQuest only meets two out of the eight hurdles Ben Graham uses to determine a good value investment company. PetroQuest’s succeeds in having an earnings to price yield greater than the yield on the 10‐year Treasury and has a P/E ratio down to one half its highest value in the last five years. However, PetroQuest’s high debt to book value ratio, low current ratio, and lack of stable earnings growth makes PetroQuest an unattractive investment (see Figure 8).
In general, the Ben Graham Analysis can be used as a tool for the value investor. However, the methodology is not a great tool for analyzing oil and gas E&P companies. PetroQuest’s volatile earnings growth, due in large part to crude oil and natural gas price volatility, is not uncommon among E&P companies, but would still persuade Graham not to invest. Small‐cap E&P companies tend to be highly levered, do not pay dividends, have high operating costs, and have large capital expenditures. These attributes portray the Company unfavorably using a Ben Graham Analysis. Therefore, the Ben Graham Analysis should not be a deciding factor when evaluating future investments in E&P companies.
Figure 8: Ben Graham Analysis
PetroQuest Energy Inc. (PQ) BURKENROAD REPORTS (www.burkenroad.org) November 7, 2014
28
Earnings per share (ttm) 0.49$ Price: 3.90$
Earnings to Price Yield 12.58%
10 Year Treasury (2X) 5.66%
P/E ratio as of 12/31/13 30.9
P/E ratio as of 12/31/12 N/A
P/E ratio as of 12/31/11 82.5
P/E ratio as of 12/31/10 11.4
P/E ratio as of 12/31/09 N/A
Current P/E Ratio 7.9
Dividends per share (ttm) ‐$ Price: 3.90$
Dividend Yield 0.00%
1/2 Yield on 10 Year Treasury 1.42%
Stock Price 3.90$
Book Value per share as of 6/30/14 2.02$
150% of book Value per share as of 6/30/14 3.03$
Interest‐bearing debt as of 6/30/14 422,500$
Book value as of 6/30/14 130,059$
Current assets as of 6/30/14 63,513$
Current liabilities as of 6/30/14 119,339$
Current ratio as of 6/30/14 0.5
EPS for year ended 12/31/09 (1.72)$
EPS for year ended 12/31/10 0.66$
EPS for year ended 12/31/11 0.08$
EPS for year ended 12/31/12 (2.20)$
EPS for year ended 12/31/13 0.14$
EPS for year ended 12/31/09 (1.72)$ ‐361%
EPS for year ended 12/31/10 0.66$ 725%
EPS for year ended 12/31/11 0.08$ ‐104%
EPS for year ended 12/31/12 (2.20)$ ‐1671%
EPS for year ended 12/31/13 0.14$
Stock price data as of November 7, 2014
Yes
PETROQUEST ENERGY INC. (PQ)
Ben Graham Analysis
Hurdle # 1: An Earnings to Price Yield of 2X the Yield on 10 Year Treasury
Yes
Hurdle # 2: A P/E Ratio Down to 1/2 of the Stocks Highest in 5 Yrs
Yes
Hurdle # 8: Stability in Growth of Earnings
No
Hurdle # 3: A Dividend Yield of 1/2 the Yield on 10 Year Treasury
No
Hurdle # 4: A Stock Price less than 1.5 BV
No
Hurdle # 5: Total Debt less than Book Value
No
Hurdle # 6: Current Ratio of Two or More
No
Hurdle # 7: Earnings Growth of 7% or Higher over past 5 years

PetroQuest En
ergy Inc. (PQ)
BURKEN
ROAD REP
ORTS (www.burken
road
.org)
November 7, 2014
29
PETROQUEST EN
ERGY INC. (PQ)
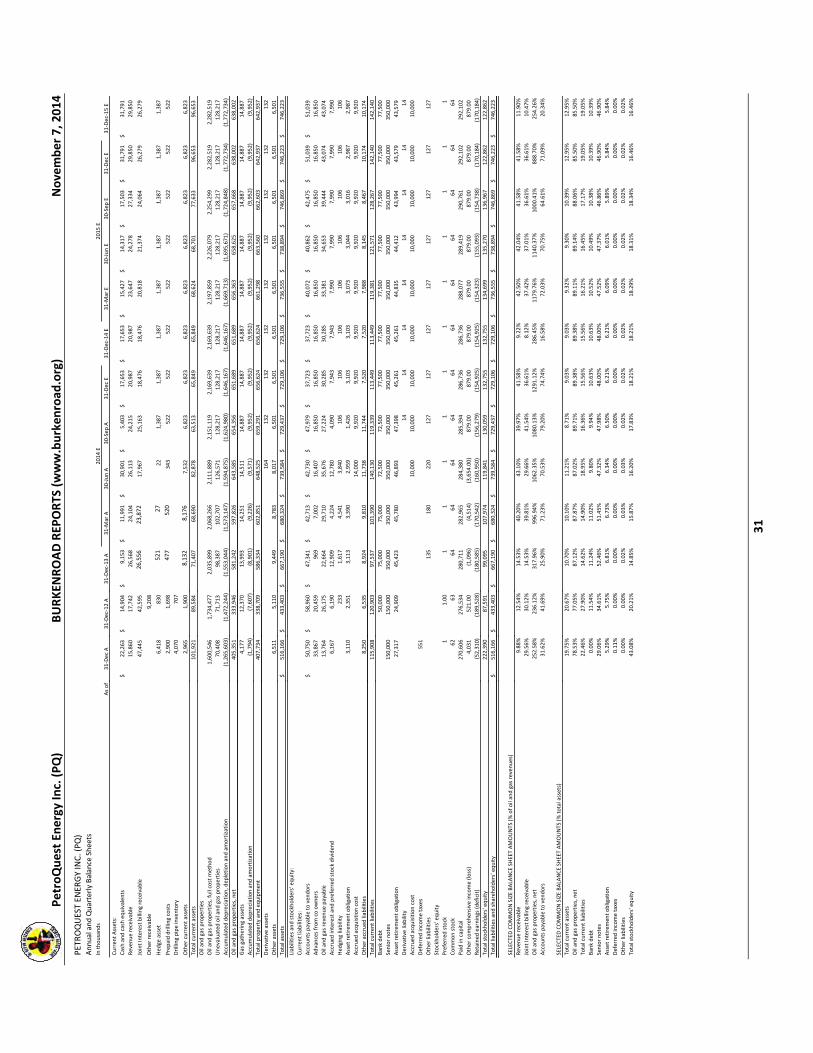
Annual
and Quarterly Earnings
In th
ousands
For the period ended
Revenues:
Oil and gas
sales
Gas
gathering revenue and other
income
Total revenues
Expen
ses:
Lease operating expen
ses
Production ta
xes
Dep
reciation, dep
letion and amortization
Ceiling test
write
down
2011 A
160,486
$
214
160,700
38,57
1
3,100
58,24
3
18,90
7
2012 A
141,433
$
158
141,591
38,890
885
60,689
137,100
2013 A
31‐M
ar A
30‐Jun A
30‐Sep A
31‐Dec
E2014 E
31‐M
ar E
30‐Jun E
30‐Sep
E31‐Dec
E2015 E
182,804
$
59,966
$
60
,581
$
56,486
$
50,475
$
227,508
$
55,635
$
57,755
$
65,740
$
71,791
$
250,921
$
66
182,870
59,966
60,581
56,486
50,475
227,508
55,635
57,755
65,740
71,791
250,921
43,743
12,258
12,168
13,019
11,653
49,098
12,950
14,277
16,047
26,337
69,612
3,950
1,477
1,492
1,709
1,589
6,267
1,766
1,947
2,188
3,591
9,493
71,445
20,428
21,702
22,294
21,187
85,611
23,546
25,958
29,177
47,886
126,567
2015
E2014 E
Gen
eral and administrative expen
ses
Accretion of a
sset retiremen
t obligation
Interest
expen
se
Total expen
ses
20,43
6
2,049
9,648
150,954
22,957
2,07
8
9,80
8
272,407
26,512
6,242
6,467
6,319
6,156
25,184
6,785
7,044
8,018
8,756
30,602
1,753
791
708
724
739
2,962
732
725
718
712
2,887
21,886
7,636
7,380
7,050
7,140
29,206
7,182
7,182
7,182
7,182
28,728
169,289
48,832
49,917
51,115
48,463
198,327
52,962
57,133
63,331
94,464
267,889
Other
income (e
xpen
se)
Derivative expense
Net income (loss) b
efore
income taxes
Income tax expense
(ben
efit)
Net income (loss)
Preferred
dividen
ds
Net income (loss) available
to common shareholders
Earnings
(loss) p
er common share
Basic
Adjustmen
t for w
ritedown
Adjustmen
t for legal
settlemen
t
Adjustmen
t for e
arly
extinguishment o
f deb
t
Adjusted
basic
Diluted
Adjustmen
t for w
ritedown
Adjustmen
t for legal
settlemen
t
Adjustmen
t for e
arly
extinguishment o
f deb
t
Adjusted
diluted
Average
shares
outstanding
Average
shares
outstanding assuming dilution
PRODUCTION
SUMMARY
Gas
revenues
Oil revenues
1,008
8,738
(1,810)
10,548
$
5,139
5,409
$
0.08
$
0.31
$
0.39
$
0.08
$
0.30
$
0.38
$
61,93
7
62,32
5
100,420
60,06
4
606
(233)
(130,443)
1,63
6
(132,079)
$
5,13
9
(137,218)
$
(2.20)
$
2.20
$
(0.00)
$
(2.20)
$
(2.20)
$
62,459
62,459
84,797
56,636
588
189
215
198
198
800
198
198
198
198
792
233
1,982
1,982
127
127
14,402
11,323
10,879
5,569
4,192
31,963
2,999
820
2,607
(22,475)
(16,049)
320
‐
‐
(389)
1,551
1,162
1,110
303
965
(8,316)
(5,938)
14,082
$
11,323
$
10
,879
$
5,958
$
2,64
1$
30,801
$
1,889
$
517
$
1,642
$
(14,159
)$
(10,111)
$
5,139
1,280
1,287
1,287
1,287
5,141
1,287
1,287
1,287
1,287
5,148
8,943
$
10,043
$
9,592
$
4,671
$
1,35
4$
25,660
$
602
$
(770)
$
355
$
(15,446
)$
(15,259)
$
0.14
$
0.15
$
0.15
$
0.07
$
0.02
$
0.40
$
0.01
$
(0.01)
$
0.01
$
(0.24)
$
(0.24)
$
0.14
$
0.15
$
0.15
$
0.07
$
0.02
$
0.40
$
0.01
$
(0.01)
$
0.01
$
(0.24)
$
(0.24)
$
0.14
$
0.15
$
0.15
$
0.07
$
0.02
$
0.40
$
0.01
$
(0.01)
$
0.01
$
(0.24)
$
(0.24)
$
0.14
$
0.15
$
0.15
$
0.07
$
0.02
$
0.40
$
0.01
$
(0.01)
$
0.01
$
(0.24)
$
(0.24)
$
63,054
63,846
64,103
64,265
64,267
64,150
64,211
64,185
64,203
64,200
64,206
63,208
63,902
64,167
64,352
64,331
64,214
64,275
64,249
64,267
64,264
64,270
112,328
35,826
37,113
29,110
36,787
138,836
43,549
46,564
52,901
57,780
200,793
70,476
24,141
23,468
27,376
13,687
88,672
12,086
11,191
12,839
14,010
50,127
Production: gas
(MMcf)
Produciton: N
GL (M
boe)
Production: o
il (M
Bbls)
Production in
equivalent u
nits (M
Mcfe)
Production per
day
in equivalen
t units (m
mcfe)
chan
ges
YY changes
% of o
il production
% of gas
production
26,74
9
572
30,18
1
83
‐2
.48%
11.37%
88.63%
30,833
521
33,957
93
12.51%
9.20%
90.80%
33,980
8,315
9,354
10,550
7,573
35,793
8,177
9,028
10,257
11,037
38,499
320
320
457
529
575
1,991
3,552
681
242
230
170
184
826
142
130
147
160
578
38,066
9,769
10,736
11,570
10,593
40,749
11,773
12,979
14,589
23,943
41,969
104
109
117.97
125.77
115.15
112
131
144
162
266
115
‐4.42%
9.89%
7.78%
‐8.44%
11.14%
10.24%
12.40%
64.12%
12.10%
18.33%
23.64%
6.11%
3.64%
7.05%
20.51%
20.90%
26.08%
126.02%
2.99%
10.73%
14.88%
12.87%
8.82%
28.52%
12.16%
30.54%
30.44%
29.69%
53.91%
8.27%
89.27%
85.12%
87.13%
91.18%
71.48%
87.84%
69.46%
69.56%
70.31%
46.09%
91.73%
Average
price
of o
il (M
Bbl)
Average
price
of gas
(Mcfe)
Dep
letion ra
te
Lease operating cost
per
equivalen
t unit
Production ta
x/revenues
105.01
$
3.75
$
1.93
$
1.28
$
1.93%
108.79
$
2.75
$
1.79
$
1.15
$
0.63%
103.49
$
99.64
$
10
1.94
$
161.02
$
74.59
$
107.35
$
85.21
$
86
.08
$
87.57
$
87.64
$
86
.68
$
3.31
$
4.31
$
3.97
$
2.76
$
4.86
$
3.88
$
5.33
$
5.16
$
5.16
$
5.24
$
5.22
$
0.57
$
2.09
$
2.02
$
1.93
$
2.00
$
2.10
$
2.00
$
2.00
$
2.00
$
2.00
$
3.02
$
0.33
$
1.25
$
1.13
$
1.13
$
1.10
$
1.20
$
1.10
$
1.10
$
1.10
$
1.10
$
1.66
$
0.11%
2.46%
2.46%
2.82%
3.15%
2.75%
3.17%
3.37%
3.33%
5.00%
3.78%

PetroQuest En
ergy Inc. (PQ)
BURKEN
ROAD REP
ORTS (www.burken
road
.org)
November 7, 2014
30
PETROQUEST EN
ERGY INC. (PQ)
Annual
and Quarterly Earnings
For the period ended
SELECTED
COMMON‐SIZE AMOUNTS
2011 A
2012 A
2013 A
31‐M
ar A
30‐Jun A
30‐Sep A
31‐Dec
E2014 E
31‐M
ar E
30‐Jun E
30‐Sep
E31‐Dec
E2015 E
2015
E2014 E
Expen
ses:
Lease operating expen
ses
Production ta
xes
Dep
reciation, dep
letion and amortization
Gen
eral and administrative expen
ses
Net income (loss) b
efore
income taxes
Income tax expense
Net income (loss)
YEAR TO
YEA
R CHANGE
Oil and gas
sales
Lease operating expen
ses
Production ta
xes
Dep
reciation, dep
letion and amortization
Gen
eral and administrative expen
ses
24.03%
1.93%
36.29%
12.73%
5.44%
‐20.71%
6.57%
‐10.36%
‐1.13%
‐36.95%
‐1.83%
‐4.24%
27.50%
0.63%
42.91%
16.23%
‐92.23%
‐1.25%
‐93.39%
‐11.87%
0.83%
‐71.45%
4.20%
12.34%
6.86%
20.44%
20.09%
21.49%
23.09%
21.58%
23.28%
24.72%
24.41%
36.69%
27.74%
0.11%
2.46%
2.46%
2.82%
3.15%
2.75%
3.17%
3.37%
3.33%
5.00%
3.78%
11.80%
34.07%
35.82%
36.80%
41.97%
37.63%
42.32%
44.95%
44.38%
66.70%
50.44%
14.50%
10.41%
10.67%
10.43%
12.20%
11.07%
12.20%
12.20%
12.20%
12.20%
12.20%
7.88%
18.88%
17.96%
9.19%
8.31%
14.05%
5.39%
1.42%
3.97%
‐31.31%
‐6.40%
2.22%
0.00%
0.00%
‐6.99%
37.00%
3.64%
37.00%
37.00%
37.00%
37.00%
37.00%
7.70%
18.88%
17.96%
9.83%
5.23%
13.54%
3.40%
0.89%
2.50%
‐19.72%
‐4.03%
29.25%
66.68%
59.11%
9.00%
6.23%
24.45%
‐7.22%
‐4.66%
8.52%
42.23%
10.29%
‐67.77%
26.12%
37.69%
2.90%
‐7.04%
291.69%
5.65%
17.33%
23.26%
126.02%
41.78%
‐78.19%
43.68%
0.74%
36.94%
723.32%
3147.15%
19.56%
30.49%
28.04%
126.02%
51.47%
‐64.47%
58.71%
49.30%
‐0.81%
‐1.74%
297.03%
15.26%
19.61%
30.87%
126.02%
47.84%
15.49%
32.36%
1.83%
‐30.80%
‐2.49%
‐5.01%
8.70%
8.92%
26.88%
42.23%
21.52%
PetroQuest En
ergy Inc. (PQ)
BURKEN
ROAD REP
ORTS (www.burken
road
.org)
November 7, 2014
31
PETROQUEST EN
ERGY INC. (PQ)
Annual
and Quarterly Balance
Sheets
In th
ousands
As of
Current A
ssets:
Cash and cash equivalents
Revenue receivable
Joint Interest
billing receivable
Other
receivable
Hed
ge asset
Prepaid drilling costs
Drilling pipe inventory
Other
current a
ssets
Total current a
ssets
Oil and gas
properties
Oil and gas
properties,
full cost
method
Unevaluated
oil and gas
properties
Accumulated dep
reciation, dep
letion and amortization
Oil and gas
properties,
net
31‐Dec
A
22,263
$
15,86
0
47,44
5
6,418
2,900
4,070
2,965
101,921
1,600,546
70,40
8
(1,265,603)
405,351
31‐Dec‐12 A
14,904
$
17,742
42,595
9,208
830
1,
698
707
1,
900
89,584
1,734,477
71,713
(1,472,244)
333,946
31‐Dec‐13 A
31‐M
ar A
30‐Jun A
30‐Sep A
31‐Dec
E31‐Dec‐14 E
31‐M
ar E
30‐Jun E
30‐Sep
E31‐Dec
E31‐Dec‐15 E
9,153
$
11,991
$
30
,901
$
5,403
$
17,653
$
17,653
$
15,427
$
14,317
$
17,503
$
31,791
$
31,791
$
26,568
24,104
26,113
24,215
20,987
20,987
23,647
24,278
27,334
29,850
29,850
26,556
23,872
17,967
25,163
18,476
18,476
20,818
21,374
24,064
26,279
26,279
521
27
22
1,387
1,387
1,387
1,387
1,387
1,387
1,387
1,387
477
520
343
522
522
522
522
522
522
522
522
8,132
8,176
7,532
6,823
6,823
6,823
6,823
6,823
6,823
6,823
6,823
71,407
68,690
82,878
63,513
65,849
65,849
68,624
68,701
77,633
96,653
96,653
2,035,899
2,068,266
2,111,889
2,151,119
2,169,639
2,169,639
2,197,859
2,226,079
2,254,299
2,282,519
2,282,519
98,387
102
,707
126,571
128,217
128
,217
128,217
128,217
128,217
128,217
128,217
128,217
(1,553
,044)
(1,573,147)
(1,594,875)
(1,624
,980)
(1,646,167)
(1,646,167)
(1,669,713)
(1,695,671)
(1,724,848)
(1,772,734)
(1,772,734)
581,242
597
,826
643,585
654,356
651
,689
651,689
656,363
658,625
657,668
638,002
638,002
2015
E2014 E
Gas
gathering assets
Accumulated dep
reciation and amortization
Total property and equipmen
t
4,177
(1,794)
407,734
12,370
(7,607)
338,709
13,993
14,251
14,511
14,887
14,887
14,887
14,887
14,887
14,887
14,887
14,887
(8,901)
(9,226)
(9,571
)
(9,952)
(9,952)
(9,952
)
(9,952)
(9,952)
(9,952)
(9,952)
(9,952)
586,334
602,851
648,52
5
659,291
656,624
656,624
661,298
663,560
662,603
64
2,937
642,937
Derivative assets
Other
assets
Total assets
Liabilities
and stockholders'
equity:
Current liabilities:
Accounts
payable
to ven
dors
Advances from
co owners
Oil and gas
revenue payable
Accrued interest
and preferred
stock
dividen
d
Hed
ging liability
Asset retiremen
t obligation
Accrued acquistion cost
Other
accrued
liabilities
6,511
516,166
$
50,750
$
33,86
7
13,76
4
6,167
3,110
8,250
5,11
0
433,403
$
58,960
$
20,459
26,175
6,190
233
2,351
6,535
164
132
132
132
132
132
132
132
132
9,449
8,783
8,017
6,501
6,501
6,501
6,501
6,501
6,501
6,501
6,501
667,190
$
680,324
$
739,58
4$
729,437
$
729,106
$
729,106
$
736,555
$
738,894
$
746,869
$
746,223
$
746,223
$
47,341
$
42,713
$
42
,730
$
47,979
$
37,723
$
37,723
$
40,072
$
40,862
$
42,475
$
51,039
$
51,039
$
969
7,002
16,407
16,850
16,850
16,850
16,850
16,850
16,850
16,850
16,850
22,664
29,710
35,676
27,224
30,285
30,285
33,381
34,653
39,444
43,074
43,074
12,909
4,224
12,780
4,090
7,943
7,943
7,990
7,990
7,990
7,990
7,990
1,617
4,541
3,840
106
106
106
106
106
106
106
106
3,113
3,390
2,959
1,426
3,103
3,103
3,073
3,044
3,016
2,987
2,987
14,000
9,920
9,920
9,920
9,920
9,920
9,920
9,920
9,920
8,924
9,810
11,738
11,744
7,520
7,520
7,988
8,145
8,467
10,174
10,174
Total current liabilities
Bank deb
t
Senior n
otes
Asset retiremen
t obligation
Derivative liability
Accrued acquisition cost
Deferred income taxes
Other
liabilities
115,908
150,000
27,31
7
551
120,903
50,000
150,000
24,909
97,537
101
,390
140,130
119,339
113
,449
113,449
119,381
121,571
128,267
142,140
142,140
75,000
75,000
72,500
72,500
77,500
77,500
77,500
77,500
77,500
77,500
77,500
350,000
350
,000
350,000
350,000
350
,000
350,000
350,000
350,000
350,000
350,000
350,000
45,423
45,780
46,893
47,398
45,261
45,261
44,835
44,412
43,994
43,579
43,579
14
14
14
14
14
14
14
14
10,000
10,000
10,000
10,000
10,000
10,000
10,000
10,000
10,000
135
180
220
127
127
127
127
127
127
127
127
Stockholders'
equity
Preferred
stock
Common stock
Paid in
capital
Other
comprehen
sive
income (loss)
1
62
270,606
4,031
1.00
63
276,534
521.00
1
1
1
1
1
1
1
1
1
1
1
64
64
64
64
64
64
64
64
64
64
64
280,711
282
,965
284,380
285,394
286
,736
286,736
288,077
289,419
290,761
292,102
292,102
(1,096)
(4,514)
(3,654.00)
879.00
879.00
879.00
879.00
879.00
879.00
879.00
879.00
Retained earnings
(deficit)
Total stockholders'
equity
Total liabilities
and shareh
olders'
equity
(52,310)
222,390
516,166
$
(189,52
8)
87,591
433,403
$
(180,585)
(170,542)
(160,950)
(156,279)
(154,925)
(154,925)
(154,323)
(155,093)
(154,738)
(170,184)
(170,184)
99,095
107
,974
119,841
130,059
132
,755
132,755
134,699
135,270
136,967
122,862
122,862
667,190
$
680,324
$
739,58
4$
729,437
$
729,106
$
729,106
$
736,555
$
738,894
$
746,869
$
746,223
$
746,223
$
SELECTED
COMMON
SIZE BALANCE SH
EET AMOUNTS
(% of o
il and gas
revenues)
Revenue receivable
Joint Interest
billing receivable
Oil and gas
properties,
net
Accounts
payable
to ven
dors
SELECTED
COMMON
SIZE BALANCE SH
EET AMOUNTS
(% to
tal assets)
Total current a
ssets
Oil and gas
properties,
net
9.88%
29.56%
252.58%
31.62%
19.75%
78.53%
12.54%
30.12%
236.12%
41.69%
20.67%
77.05%
14.53%
40.20%
43.10%
39.97%
41.58%
9.22%
42.50%
42.04%
41.58%
41.58%
11.90%
14.53%
39.81%
29.66%
41.54%
36.61%
8.12%
37.42%
37.01%
36.61%
36.61%
10.47%
317.96%
996.94%
1062.35%
1080.13%
1291.12%
286.45%
1179.76%
1140.37%
1000.41%
888.70%
254
.26%
25.90%
71.23%
70.53%
79.20%
74.74%
16.58%
72.03%
70.75%
64.61%
71.09%
20.34%
10.70%
10.10%
11.21%
8.71%
9.03%
9.03%
9.32%
9.30%
10.39%
12.95%
12.95%
87.12%
87.87%
87.02%
89.71%
89.38%
89.38%
89.11%
89.14%
88.06%
85.50%
85.50%
Total current liabilities
Bank deb
t
Senior n
otes
Asset retiremen
t obligation
Deferred income taxes
Other
liabilities
Total stockholders'
equity
22.46%
0.00%
29.06%
5.29%
0.11%
0.00%
43.08%
27.90%
11.54%
34.61%
5.75%
0.00%
0.00%
20.21%
14.62%
14.90%
18.95%
16.36%
15.56%
15.56%
16.21%
16.45%
17.17%
19.05%
19.05%
11.24%
11.02%
9.80%
9.94%
10.63%
10.63%
10.52%
10.49%
10.38%
10.39%
10.39%
52.46%
51.45%
47.32%
47.98%
48.00%
48.00%
47.52%
47.37%
46.86%
46.90%
46.90%
6.81%
6.73%
6.34%
6.50%
6.21%
6.21%
6.09%
6.01%
5.89%
5.84%
5.84%
0.00%
0.00%
0.00%
0.00%
0.00%
0.00%
0.00%
0.00%
0.00%
0.00%
0.00%
0.02%
0.03%
0.03%
0.02%
0.02%
0.02%
0.02%
0.02%
0.02%
0.02%
0.02%
14.85%
15.87%
16.20%
17.83%
18.21%
18.21%
18.29%
18.31%
18.34%
16.46%
16.46%
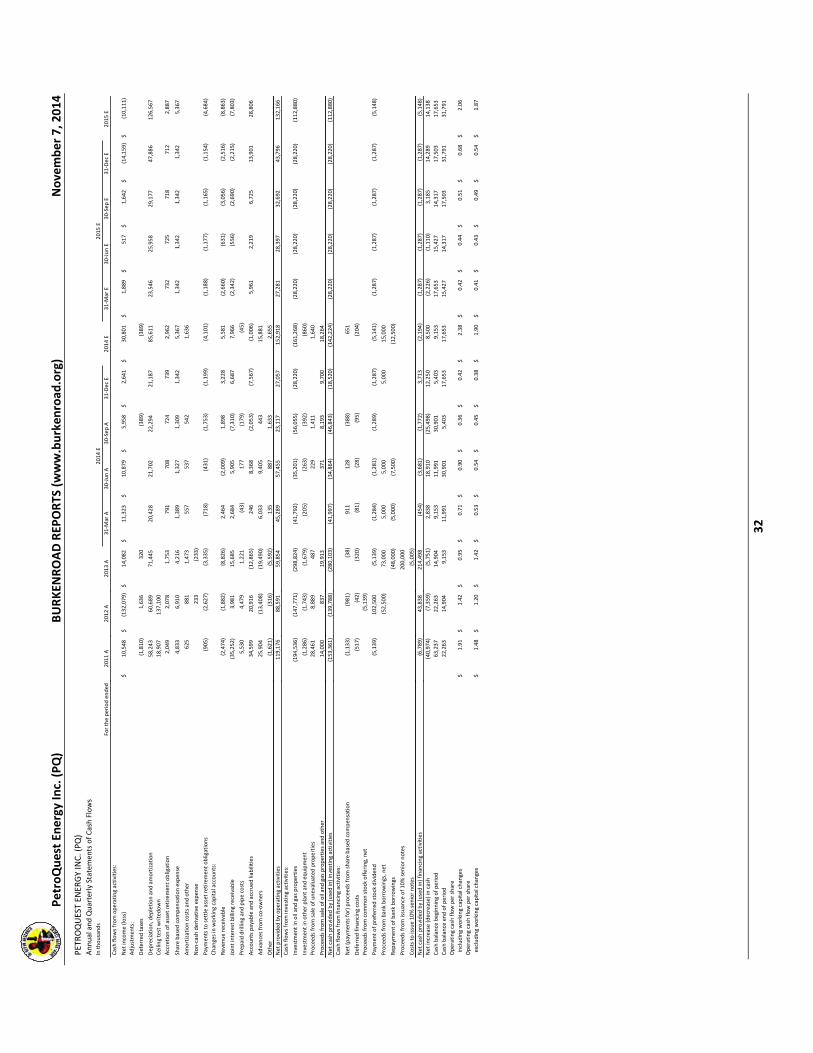
PetroQuest En
ergy Inc. (PQ)
BURKEN
ROAD REP
ORTS (www.burken
road
.org)
November 7, 2014
32
PETROQUEST EN
ERGY INC. (PQ)
Annual
and Quarterly Statemen
ts of C
ash Flows
In th
ousands
For the period ended
Cash flows from
operating activities:
Net income (loss)
Adjustmen
ts:
Deferred ta
xes
Dep
reciation, dep
letion and amortization
Ceiling test
writedown
2011 A 10,548
$
(1,810)
58,24
3
18,90
7
2012 A
(132,079)
$
1,63
6
6
0,689
137,100
2013 A
31‐M
ar A
30‐Jun A
30‐Sep A
31‐Dec
E2014 E
31‐M
ar E
30‐Jun E
30‐Sep
E31‐Dec
E2015 E
14,082
$
11,323
$
10
,879
$
5,958
$
2,64
1$
30,801
$
1,889
$
517
$
1,642
$
(14,159
)$
(10,111)
$
320
(389)
(389)
71,445
20,428
21,702
22,294
21,187
85,611
23,546
25,958
29,177
47,886
126,567
2015
E2014 E
Accretion of a
sset retiremen
t obligation
2,049
2,07
8
1,753
791
708
724
739
2,962
732
725
718
712
2,887
Share based
compen
sation expen
se
Amortization costs and other
Non‐cash derivative
expen
se
Paymen
ts to
settle
asset
retiremen
t obligations
4,833
625
(905)
6,91
0
881
233
(2,627)
4,216
1,389
1,327
1,309
1,342
5,367
1,342
1,342
1,342
1,342
5,367
1,473
557
537
542
1,636
(233
)
(3,335)
(718)
(431)
(1,753)
(1,199)
(4,101
)
(1,188)
(1,177)
(1,165)
(1,154)
(4,684)
Changes in
working capital
accounts:
Revenue receivable
Joint interest
billing receivab
le
Prepaid drilling and pipe costs
Accounts
payable
and accrued liabilities
Advances from
co‐owners
Other
(2,474)
(35,252)
5,530
34,59
9
25,90
4
(1,621)
(1,882)
3,98
1
4,47
9
2
0,916
(13,408)
(316)
(8,826)
2,464
(2,009
)
1,898
3,228
5,581
(2,660)
(631)
(3,056)
(2,516)
(8,863)
15,685
2,684
5,905
(7,310)
6,687
7,966
(2,342)
(556)
(2,690)
(2,215)
(7,803)
1,221
(43)
177
(179)
(45)
(12,865)
246
8,368
(2,053)
(7,567)
(1,006
)
5,961
2,219
6,725
13,901
28,806
(19,490)
6,033
9,405
443
15,881
(5,592)
135
887
1,633
2,655
Net p
rovided
by operating activities
Cash flows from
investing activities:
Investmen
t in oil and gas
properties
Investmen
t in other p
lant a
nd equipmen
t
119,176
(1
94,536)
(1,286)
88,591
(1
47,771)
(1,743)
59,854
45,289
57,455
23,117
27,057
152,918
27,281
28,397
32,692
43,796
132,166
(298,824)
(41,792
)
(35,201)
(56,055)
(28,220
)
(161,268)
(28,220)
(28,220)
(28,220)
(28,220)
(112,880)
(1,679)
(205)
(263)
(392)
(860)
Proceed
s from
sale of u
nevaluated
properties
Proceed
s from
sale of o
il and gas
properties
and other
28,46
1
14,00
0
8,88
9
837
487
229
1,411
1,640
19,913
371
8,193
9,700
18,264
Net cash provided
by (used in) investing activities
Cash flows from
financing activities:
Net (payments
for)
proceed
s from
share based
compen
sation
Deferred financing costs
Proceed
s from
common stock
offering,
net
Paymen
t of p
referred stock
dividen
d
Proceed
s from
bank borrowings, net
Rep
aymen
t of b
ank borrowings
(153,361)
(1,133)
(517)
(5,139)
(139,788)
(981)
(42)
(5,139)
102,500
(52,500)
(280,103)
(41,997
)
(34,864)
(46,843)
(18,520
)
(142,224)
(28,220)
(28,220)
(28,220)
(28,220)
(112,880)
(38)
911
128
(388)
651
(320
)
(81)
(28)
(95)
(204)
(5,139)
(1,284)
(1,281
)
(1,289)
(1,287)
(5,141
)
(1,287)
(1,287)
(1,287)
(1,287)
(5,148)
73,000
5,000
5,000
5,000
15,000
(48,000)
(5,000)
(7,500
)
(12,500)
Proceed
s from
issuance
of 1
0%
senior n
otes
Costs to
issue 10
% senior n
otes
200,000
(5,005)
Net cash provided
by (used in) financing activities
Net increase
(decrease)
in cash
Cash balance
beginning of p
eriod
Cash balance
end of p
eriod
(6,789)
(40,974)
63,23
7
22,26
3
43,838
(7,359)
22,263
14,904
214,498
(454)
(3,681
)
(1,772)
3,713
(2,194
)
(1,287)
(1,287)
(1,287)
(1,287)
(5,148)
(5,751)
2,838
18,910
(25,498)
12,250
8,500
(2,226)
(1,110)
3,185
14,289
14,138
14,904
9,153
11,991
30,901
5,403
9,153
17,653
15,427
14,317
17,503
17,653
9,153
11,991
30,901
5,403
17,653
17,653
15,427
14,317
17,503
31,791
31,791
Operating cash
flow
per
share
including working capital
changes
Operating cash
flow
per
share
excluding working capital
changes
1.91
$
1.48
$
1.42
$
1.20
$
0.95
$
0.71
$
0.90
$
0.36
$
0.42
$
2.38
$
0.42
$
0.44
$
0.51
$
0.68
$
2.06
$
1.42
$
0.53
$
0.54
$
0.45
$
0.38
$
1.90
$
0.41
$
0.43
$
0.49
$
0.54
$
1.87
$

PetroQuest En
ergy Inc. (PQ)
BURKEN
ROAD REP
ORTS (www.burken
road
.org)
November 7, 2014
33
PETROQUEST EN
ERGY INC. (PQ)
Ratios
For the period ended
Productivity Ratios
Receivables turnover
2011 A
14.95
2012 A
8.42
2013 A
31‐M
ar A
30‐Jun A
30‐Sep A
31‐Dec E
2014 E
31‐M
ar E
30‐Jun E
30‐Sep
E31‐Dec
E2015 E
8.25
2.37
2.41
2.41
2.23
9.57
2.49
2.41
2.55
2.51
9.87
2015 E
2014 E
Working capital
turnover
5.27
‐6.24
‐6.36
‐2.04
‐1.35
‐1.07
‐0.98
‐6.17
‐1.13
‐1.11
‐1.27
‐1.49
‐5.39
Net fixed
asset
turnover
0.0865
0.0919
0.0832
0.0166
0.0173
0.0178
0.0162
0.0661
0.0180
0.0197
0.0222
0.0370
0.0651
Gross
fixed asset turnover
0.086
0.092
0.083
0.017
0.017
0.018
0.016
0.066
0.018
0.020
0.022
0.037
0.065
Gross
fixed asset turnover
0.10
0.08
0.09
0.03
0.03
0.03
0.02
0.10
0.02
0.02
0.03
0.03
0.11
Total asset
turnover
0.34
0.30
0.33
0.09
0.09
0.08
0.07
0.33
0.08
0.08
0.09
0.10
0.34
# of d
ays Sales in
A/R
36
46
53
36
39
37
38
34
38
38
38
38
43
# of d
ays Cost
of Sales in
A/P
81
109
57
68
79
65
76
61
76
76
76
76
89
Liquidity Measures
Current ratio
0.88
0.74
0.73
0.68
0.59
0.53
0.58
0.58
0.57
0.57
0.61
0.68
0.68
Quick ratio
0.74
0.62
0.64
0.59
0.54
0.46
0.50
0.50
0.50
0.49
0.54
0.62
0.62
Cash flow
from
operations ratio
1.03
0.73
0.61
0.45
0.41
0.19
0.24
1.35
0.23
0.23
0.25
0.31
0.93
Working capital
‐13,987
‐31,319
‐26,130
‐32,700
‐57,252
‐55,826
‐47,600
‐47,600
‐50,757
‐52,870
‐50,634
‐45,487
‐45,487
Financial
Risk (Leverage) R
atios
Total debt/equity ratio
0.52
1.38
0.99
0.94
1.17
0.92
0.86
0.86
0.89
0.90
0.94
1.16
1.16
Debt/eq
uity ratio (e
xcluding deferred ta
xes)
1.52
2.38
1.99
1.94
2.17
1.92
1.86
1.86
1.89
1.90
1.94
2.16
2.16
Total LT debt/equity ratio
0.00
0.00
0.00
0.00
0.00
0.00
0.00
0.00
0.00
0.00
0.00
0.00
0.00
LT debt/eq
uity (excluding deferred ta
xes)
0.00
0.00
0.00
0.00
0.00
0.00
0.00
0.00
0.00
0.00
0.00
0.00
0.00
Interest
coverage
ratio (E
arnings
= EBIT)
1.91
‐12.30
1.66
2.48
2.47
1.79
1.59
2.09
1.42
1.11
1.36
‐2.13
0.44
Interest
coverage
ratio (E
arnings
= EBI)
2.09
‐12.47
1.64
2.48
2.47
1.85
1.37
2.05
1.26
1.07
1.23
‐0.97
0.65
Total debt ratio
0.22
0.28
0.15
0.15
0.19
0.16
0.16
0.16
0.16
0.16
0.17
0.19
0.19
Debt ratio
(excuding deferred
taxes)
0.22
0.28
0.15
0.15
0.19
0.16
0.16
0.16
0.16
0.16
0.17
0.19
0.19
Profitability/Valuation M
easures
Gross
profit m
argin
37.74%
28.97%
81.24%
43.03%
41.63%
38.89%
31.79%
38.03%
31.23%
26.96%
27.88%
‐8.39%
18.03%
Operating profit m
argin
37.74%
28.97%
81.24%
43.03%
41.63%
38.89%
31.79%
38.03%
31.23%
26.96%
27.88%
‐8.39%
18.03%
Return
on assets
2.25%
‐27.82%
2.56%
1.68%
1.53%
0.81%
0.36%
4.41%
0.26%
0.07%
0.22%
‐1.90%
‐1.37%
Return
on equity
4.95%
‐85.22%
15.09%
10.94%
9.55%
4.77%
2.01%
26.57%
1.41%
0.38%
1.21%
‐10.90%
‐7.91%
EBITDA
margin
47.75%
‐42.38%
58.93%
65.68%
65.96%
57.63%
64.43%
64.52%
60.62%
58.80%
59.27%
45.40%
55.49%
EBITDA/Assets
16.34%
‐12.63%
19.58%
5.85%
5.63%
4.75%
4.46%
21.02%
4.60%
4.60%
5.25%
4.37%
18.88%

THIS PAGE LEFT INTENTIONALLY BLANK

BURKENROADREPORTSRATINGSYSTEMMARKETOUTPERFORM:Thisratingindicatesthatwebelieveforcesareinplacethatwouldenablethiscompany'sstocktoproducereturnsinexcessofthestockmarketaveragesoverthenext12months.MARKETPERFORM:Thisratingindicatesthatwebelievetheinvestmentreturnsfromthiscompany'sstockwillbeinlinewiththoseproducedbythestockmarketaveragesoverthenext12months.MARKETUNDERPERFORM:Thisratingindicatesthatwhilethisinvestmentmayhavepositiveattributes,webelieveaninvestmentinthiscompanywillproducesubparreturnsoverthenext12months.BURKENROADREPORTSCALCULATIONS
CPFSiscalculatedusingoperatingcashflowsexcludingworkingcapitalchanges. AllamountsareasofthedateofthereportasreportedbyBloombergorYahooFinanceunless
otherwisenoted.BetasarecollectedfromBloomberg. Enterprisevalueisbasedontheequitymarketcapasofthereportdate,adjustedforlong‐
termdebt,cash,&short‐terminvestmentsreportedonthemostrecentquarterlyreportdate. 12‐monthStockPerformanceiscalculatedusinganendingpriceasofthereportdate.
Thestockperformanceincludesthe12‐monthdividendyield.
2014‐2015COVERAGEUNIVERSEAmerisafeInc.(AMSF)BristowGroupInc.(BRS)TheFirstBancshares(FBMS)CalIonPetroleumCompany(CPE)Cal‐MaineFoodsInc.(CALM)CarboCeramicsInc.(CRR)CashAmericaInternationalInc.(CSH)Conn'sInc.(CONN)CrownCraftsInc.(CRWS)CyberonicsIncorporated(CYBX)DenburyResourcesInc.(DNR)EastGroupPropertiesInc.(EGP)EraGroupInc.(ERA)EvolutionPetroleumCorp.(EPM)Globalstar(GSAT)GulfIslandFabricationInc.(GIFI)HibbettSports(HIBB)HornbeckOffshoreServicesInc.(HOS)IBERIABANKCorp.(IBKC)IONGeophysicalCorp.(IO)
KeyEnergyServices(KEG)MarineProductsCorp.(MPX)MidSouthBancorpInc.(MSL)NewparkResourcesInc.(NR)PetroQuestEnergyInc.(PQ)PopeyesLouisianaKitchen(PLKI)PoolCorporation(POOL)PowellIndustriesInc.(POWL)RollinsIncorporated(ROL)RPCIncorporated(RES)Ruth’sHospitalityGroupInc.(RUTH)SandersonFarmsInc.(SAFM)SEACORHoldingsInc.(CKH)SharpsComplianceInc.(SMED)StoneEnergyCorp.(SGY)SunocoLP(SUN)SuperiorEnergyServicesInc.(SPN)TeamIncorporated(TISI)VaalcoEnergyInc.(EGY)WillbrosGroupInc.(WG)
PETERRICCHIUTIDirectorofResearchFounderofBurkenroadReportsPeter.Ricchiuti@tulane.eduANTHONYWOODSeniorDirectorofAccountingAwood11@tulane.edu
JERRYDICOLODAVIDDOWTYELLIOTTEDWARDSAssociateDirectorsofResearch
BURKENROADREPORTSTulaneUniversityNewOrleans,LA70118‐5669(504)862‐8489(504)865‐5430Fax
To receive complete reports on any of the companies we follow, contact:Peter Ricchiuti, Founder & Director of Research
Tulane UniversityFreeman School of BusinessBURKENROAD REPORTS
Phone: (504) 862-8489Fax: (504) 865-5430
E-mail: [email protected] visit our web site at www.BURKENROAD.org
Printed on Recycled Paper
Named in honor of William B. Burkenroad Jr., an alumnus and a longtime supporter of Tulane’s business school, and funded through contributions from his family and friends, BURKENROAD REPORTS is a nationally recognized program, publishing objective, investment research reports on public companies in our region. Students at Tulane University’s Freeman School of Business prepare these reports.Alumni of the BURKENROAD REPORTS program are employed at a number of highly respected financial institutions including:ABN AMRO Bank · Aegis Value Fund · Invesco/AIM Capital Management · Alpha Omega Capital Partners · American General Investment Management · Ameriprise Financial · Atlas Capital · Banc of America Securities · Bank of Montreal · Bancomer · Barclays Capital · Barings PLC · Bearing Point · Bessemer Trust · Black Gold Capital· Bloomberg · Brookfield Asset Management · Brown Brothers Harriman Capital · Blackrock Financial Management · Boston Consulting Group · Buckingham Research · California Board of Regents · Cambridge Associates· Canaccord Genuity · Cantor Fitzgerald · Chaffe & Associates · Citadel Investment Group · Citibank · Citigroup Private Bank · City National Bank · Cornerstone Resources · Credit Suisse · D. A. Davidson & Co. · Deutsche Banc · Duquesne Capital Management · Equitas Capital Advisors· Factset Research · Financial Models · First Albany · Fiduciary Trust · Fitch Investors Services · Forex Trading · Franklin Templeton · Friedman Billings Ramsay · Fulcrum Global Partners · Gintel Asset Management · Global Hunter Securities · Goldman Sachs · Grosever Funds · Gruntal & Co. · Guggenheim Securities , LLC · Hancock Investment Services · Healthcare Markets Group · Capital One Southcoast · Howard Weil Labouisse Friedrichs · IBERIABANK Capital Markets · J.P. Morgan Securities · Janney Montgomery Scott · Jefferies & Co. · Johnson Rice & Co. · KBC Financial · KDI Capital Partners · Key Investments · Keystone Investments · Legacy Capital · Liberty Mutual · Lowenhaupt Global Advisors · Mackay Shields · Manulife/John Hancock Investments · Marsh & McLennan · Mercer Partners · Merrill Lynch · Miramar Asset Management · Moodys Investor Services · Morgan Keegan · Morgan Stanley · New York Stock Exchange · Perkins Wolf McDonnell · Piper Jaffray & Co. · Professional Advisory Services · Quarterdeck Investment Services · RBC · Raymond James · Restoration Capital · Rice Voelker, LLC · Royal Bank of Scotland· Sandler O'Neill & Partners · Sanford Bernstein & Co. · Scotia Capital · Scottrade · Second City Trading LLC · Sequent Energy · Sidoti & Co · Simmons & Co. · Southwest Securities · Stephens & Co. · Sterne Agee · Stewart Capital LLC · Stifel Nicolaus · Sun-Trust Capital Markets · Susquehanna Investment Group · Thomas Weisel Partners · TD Waterhouse Securities · Texas Employee Retirement System · Texas Teachers Retirement System · ThirtyNorth Investments · Thornburg Investment Management · Tivoli Partners · Tudor Pickering & Co. · Tulane University Endowment Fund · Turner Investment Partners · UBS · Value Line Investments · Vaughan Nelson Investment Management · Wells Fargo Capital Management · Whitney National Bank · William Blair & Co. · Zephyr Management