survivorship of ultamet hip metal-on-metal articulation in national joint replacement...
TRANSCRIPT
1
SURVIVORSHIP OF ULTAMET® HIP METAL-ON-METAL ARTICULATION IN NATIONAL JOINT REPLACEMENT REGISTRIESPamela L. Plouhar, PhD, Vice President Worldwide Clinical Affairs | DePuy Synthes Companies of Johnson & Johnson, Rodrigo Diaz, MD, Medical Director | DePuy Synthes Joint Reconstruction*, Paul Voorhorst, MS, MBA, VP, WW Clinical Research | DePuy Synthes Joint Reconstruction
Implant selection, patient characteristics, and surgical technique during primary THA may have a direct impact on the procedure’s outcome. The impact of variables that affect hip survival is multi-factorial and still emerging.
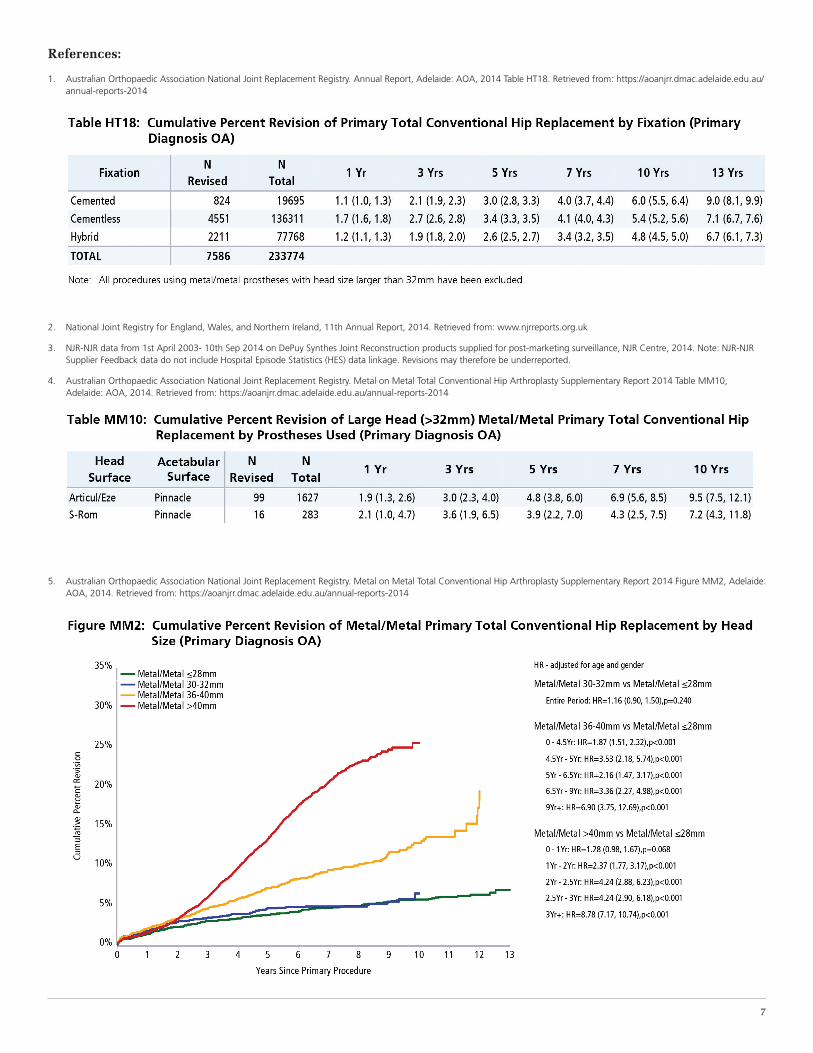
National joint registries provide valuable information on the revi-sion rates/survivorship estimates of newer and older implants alike. Typically they include large cohorts with contributions from all surgeons, irrespective of experience level, as well as variations in standard of care and hospital processes. These data sources include the Australian Orthopaedic Association National Joint Replacement Registry (AOANJRR) and the National Joint Registry for England, Wales, and Northern Ireland (NJR). Different hip systems may be combined into a single broad category (hip replacement) for evalu-ation. Primary total hip replacement is a well-established and effi-cacious procedure, as demonstrated by the 2014 AOANJRR (Table HT18 shown on page 7) and 2014 NJR (Table 3.7) annual reports which observed 7-year cementless THA cumulative percent revi-sion rates‡ of 4.1% (95% CI: 4.0% - 4.3%)† and 5.50% (95% CI: 5.35% - 5.66%), respectively.1,2 The 10-year cementless THA cumu-lative percent revision rates were 5.4% (95% CI: 5.2% - 5.6%)*,1 and 7.68% (95% CI: 7.34% - 8.03%).2
To evaluate the effect of different variables on device perfor-mance more carefully, it is useful to look at data available for spe-cific product configurations. To that end, this paper examines the performance of various Metal-on-Metal articulations in which the ULTAMET® Acetabular Liner has been used.
Australian Orthopaedic Association National Joint Replacement Registry Data for ULTAMET Hip Metal-on-Metal
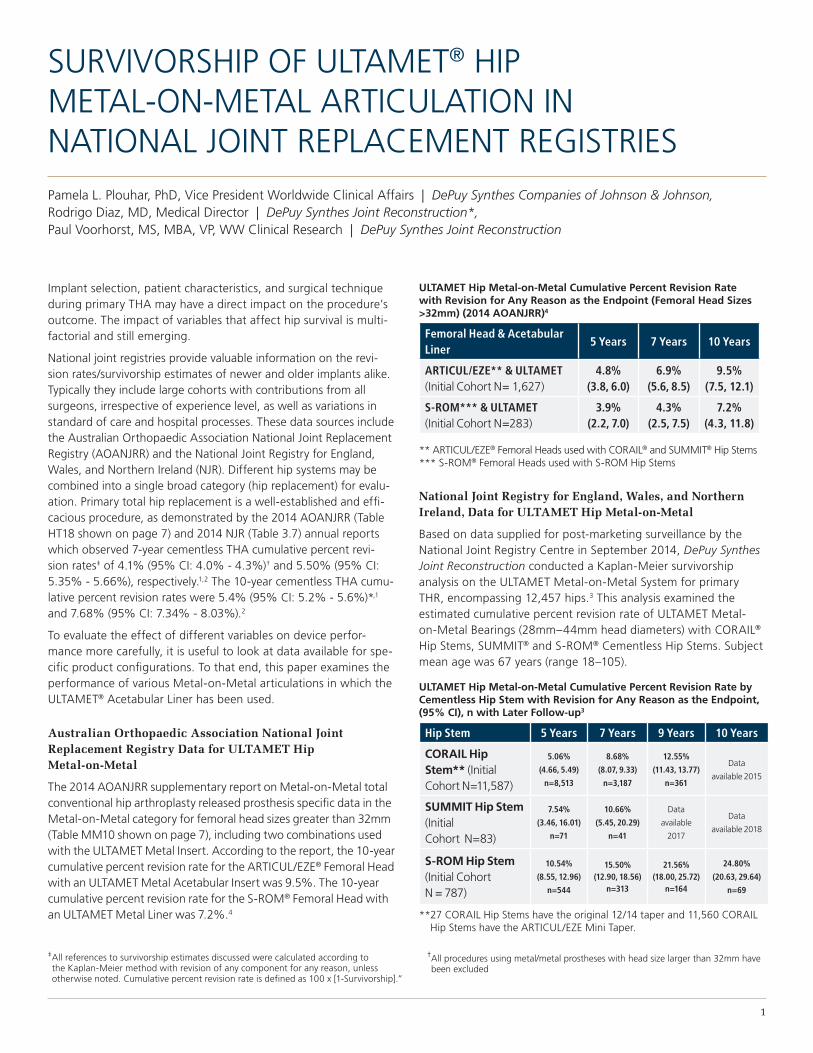
The 2014 AOANJRR supplementary report on Metal-on-Metal total conventional hip arthroplasty released prosthesis specific data in the Metal-on-Metal category for femoral head sizes greater than 32mm (Table MM10 shown on page 7), including two combinations used with the ULTAMET Metal Insert. According to the report, the 10-year cumulative percent revision rate for the ARTICUL/EZE® Femoral Head with an ULTAMET Metal Acetabular Insert was 9.5%. The 10-year cumulative percent revision rate for the S-ROM® Femoral Head with an ULTAMET Metal Liner was 7.2%.4
ULTAMET Hip Metal-on-Metal Cumulative Percent Revision Rate with Revision for Any Reason as the Endpoint (Femoral Head Sizes >32mm) (2014 AOANJRR)4
Femoral Head & Acetabular Liner
5 Years 7 Years 10 Years
ARTICUL/EZE** & ULTAMET (Initial Cohort N= 1,627)
4.8% (3.8, 6.0)
6.9% (5.6, 8.5)
9.5% (7.5, 12.1)
S-ROM*** & ULTAMET (Initial Cohort N=283)
3.9% (2.2, 7.0)
4.3% (2.5, 7.5)
7.2% (4.3, 11.8)
** ARTICUL/EZE® Femoral Heads used with CORAIL® and SUMMIT® Hip Stems*** S-ROM® Femoral Heads used with S-ROM Hip Stems
National Joint Registry for England, Wales, and Northern Ireland, Data for ULTAMET Hip Metal-on-Metal
Based on data supplied for post-marketing surveillance by the National Joint Registry Centre in September 2014, DePuy Synthes Joint Reconstruction conducted a Kaplan-Meier survivorship analysis on the ULTAMET Metal-on-Metal System for primary THR, encompassing 12,457 hips.3 This analysis examined the estimated cumulative percent revision rate of ULTAMET Metal-on-Metal Bearings (28mm–44mm head diameters) with CORAIL® Hip Stems, SUMMIT® and S-ROM® Cementless Hip Stems. Subject mean age was 67 years (range 18–105).
ULTAMET Hip Metal-on-Metal Cumulative Percent Revision Rate by Cementless Hip Stem with Revision for Any Reason as the Endpoint, (95% CI), n with Later Follow-up3
Hip Stem 5 Years 7 Years 9 Years 10 Years
CORAIL Hip Stem** (Initial Cohort N=11,587)
5.06%
(4.66, 5.49)
n=8,513
8.68%
(8.07, 9.33)
n=3,187
12.55%
(11.43, 13.77)
n=361
Data
available 2015
SUMMIT Hip Stem (Initial Cohort N=83)
7.54%
(3.46, 16.01)
n=71
10.66%
(5.45, 20.29)
n=41
Data
available
2017
Data
available 2018
S-ROM Hip Stem (Initial Cohort N = 787)
10.54%
(8.55, 12.96)
n=544
15.50%(12.90, 18.56)
n=313
21.56%(18.00, 25.72)
n=164
24.80%
(20.63, 29.64)
n=69
** 27 CORAIL Hip Stems have the original 12/14 taper and 11,560 CORAIL Hip Stems have the ARTICUL/EZE Mini Taper.
† All procedures using metal/metal prostheses with head size larger than 32mm have been excluded
‡ All references to survivorship estimates discussed were calculated according to the Kaplan-Meier method with revision of any component for any reason, unless otherwise noted. Cumulative percent revision rate is defined as 100 x [1-Survivorship].”
2
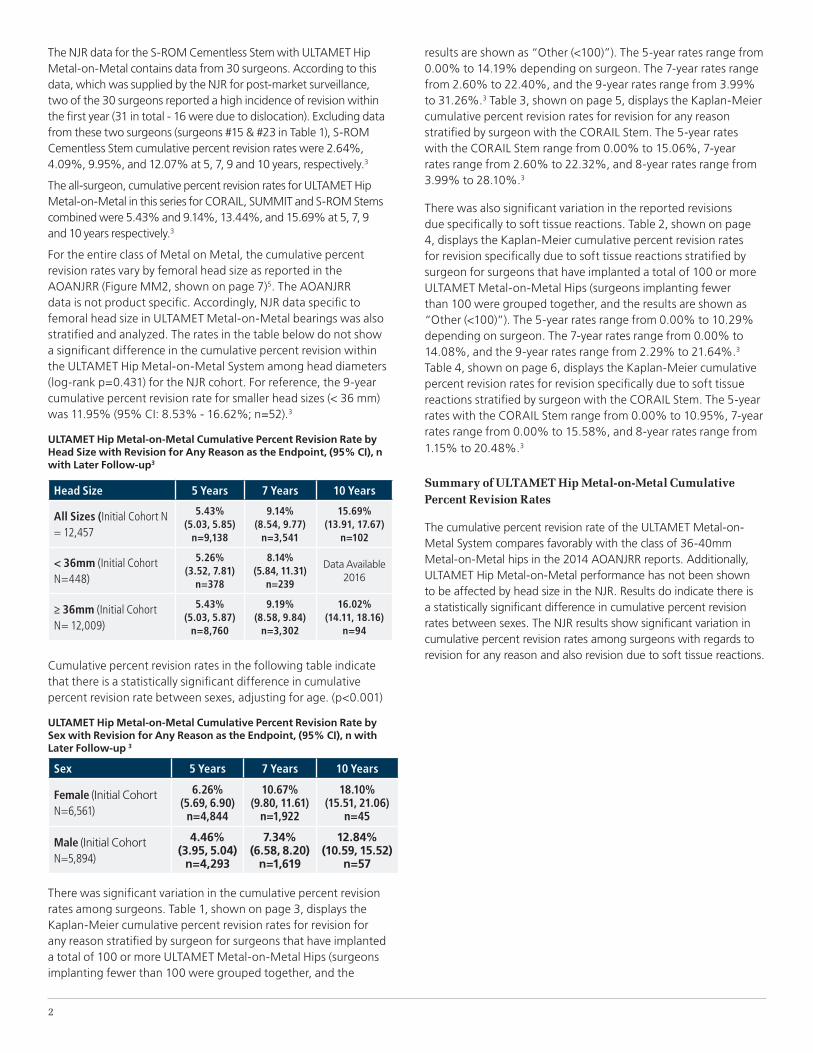
The NJR data for the S-ROM Cementless Stem with ULTAMET Hip Metal-on-Metal contains data from 30 surgeons. According to this data, which was supplied by the NJR for post-market surveillance, two of the 30 surgeons reported a high incidence of revision within the first year (31 in total - 16 were due to dislocation). Excluding data from these two surgeons (surgeons #15 & #23 in Table 1), S-ROM Cementless Stem cumulative percent revision rates were 2.64%, 4.09%, 9.95%, and 12.07% at 5, 7, 9 and 10 years, respectively.3
The all-surgeon, cumulative percent revision rates for ULTAMET Hip Metal-on-Metal in this series for CORAIL, SUMMIT and S-ROM Stems combined were 5.43% and 9.14%, 13.44%, and 15.69% at 5, 7, 9 and 10 years respectively.3
For the entire class of Metal on Metal, the cumulative percent revision rates vary by femoral head size as reported in the AOANJRR (Figure MM2, shown on page 7)5. The AOANJRR data is not product specific. Accordingly, NJR data specific to femoral head size in ULTAMET Metal-on-Metal bearings was also stratified and analyzed. The rates in the table below do not show a significant difference in the cumulative percent revision within the ULTAMET Hip Metal-on-Metal System among head diameters (log-rank p=0.431) for the NJR cohort. For reference, the 9-year cumulative percent revision rate for smaller head sizes (< 36 mm) was 11.95% (95% CI: 8.53% - 16.62%; n=52).3
ULTAMET Hip Metal-on-Metal Cumulative Percent Revision Rate by Head Size with Revision for Any Reason as the Endpoint, (95% CI), n with Later Follow-up3
Head Size 5 Years 7 Years 10 Years
All Sizes (Initial Cohort N = 12,457
5.43% (5.03, 5.85)
n=9,138
9.14% (8.54, 9.77)
n=3,541
15.69% (13.91, 17.67)
n=102
< 36mm (Initial Cohort N=448)
5.26% (3.52, 7.81)
n=378
8.14% (5.84, 11.31)
n=239
Data Available 2016
≥ 36mm (Initial Cohort N= 12,009)
5.43% (5.03, 5.87)
n=8,760
9.19% (8.58, 9.84)
n=3,302
16.02% (14.11, 18.16)
n=94
Cumulative percent revision rates in the following table indicate that there is a statistically significant difference in cumulative percent revision rate between sexes, adjusting for age. (p<0.001)
ULTAMET Hip Metal-on-Metal Cumulative Percent Revision Rate by Sex with Revision for Any Reason as the Endpoint, (95% CI), n with Later Follow-up 3
Sex 5 Years 7 Years 10 Years
Female (Initial Cohort N=6,561)
6.26%(5.69, 6.90)
n=4,844
10.67%(9.80, 11.61)
n=1,922
18.10%(15.51, 21.06)
n=45
Male (Initial Cohort N=5,894)
4.46%(3.95, 5.04)
n=4,293
7.34%(6.58, 8.20)
n=1,619
12.84%(10.59, 15.52)
n=57
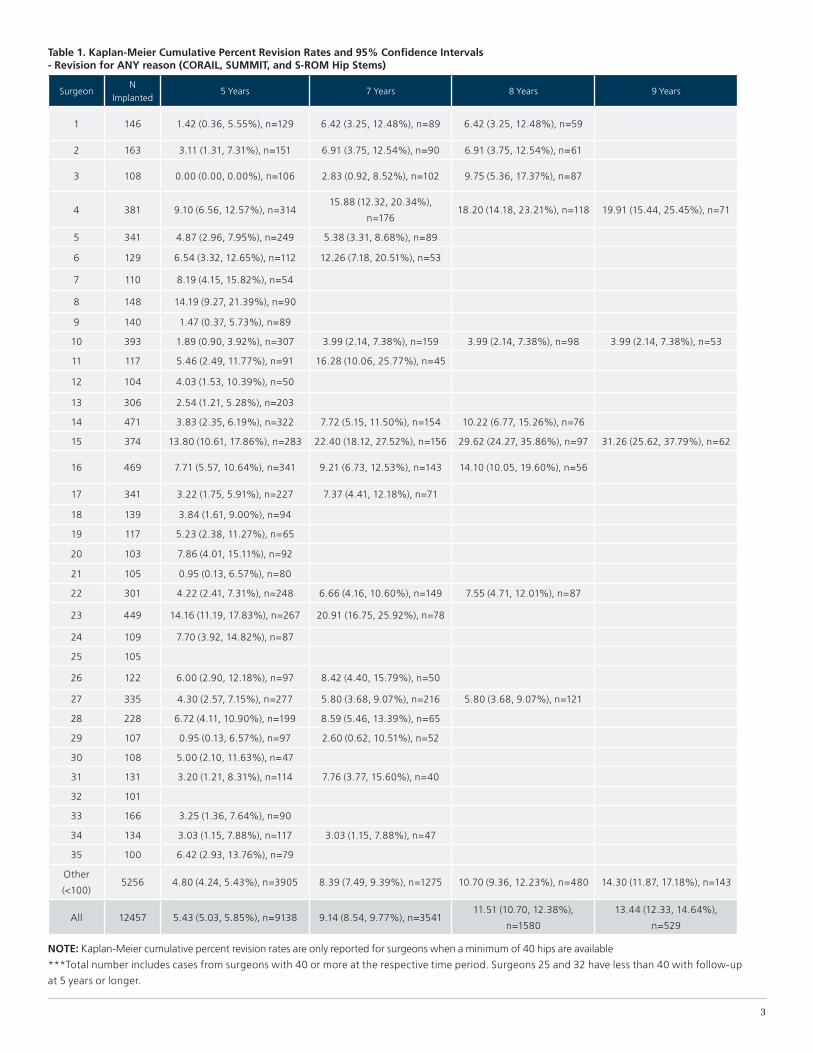
There was significant variation in the cumulative percent revision rates among surgeons. Table 1, shown on page 3, displays the Kaplan-Meier cumulative percent revision rates for revision for any reason stratified by surgeon for surgeons that have implanted a total of 100 or more ULTAMET Metal-on-Metal Hips (surgeons implanting fewer than 100 were grouped together, and the
results are shown as “Other (<100)”). The 5-year rates range from 0.00% to 14.19% depending on surgeon. The 7-year rates range from 2.60% to 22.40%, and the 9-year rates range from 3.99% to 31.26%.3 Table 3, shown on page 5, displays the Kaplan-Meier cumulative percent revision rates for revision for any reason stratified by surgeon with the CORAIL Stem. The 5-year rates with the CORAIL Stem range from 0.00% to 15.06%, 7-year rates range from 2.60% to 22.32%, and 8-year rates range from 3.99% to 28.10%.3
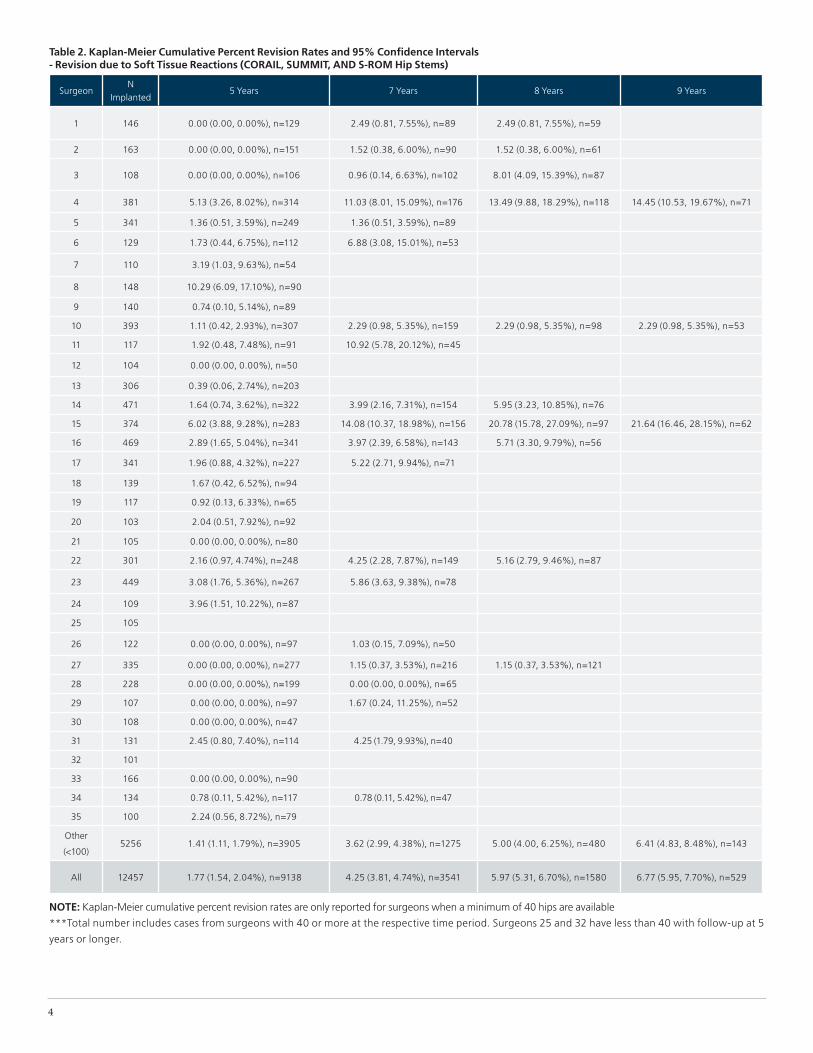
There was also significant variation in the reported revisions due specifically to soft tissue reactions. Table 2, shown on page 4, displays the Kaplan-Meier cumulative percent revision rates for revision specifically due to soft tissue reactions stratified by surgeon for surgeons that have implanted a total of 100 or more ULTAMET Metal-on-Metal Hips (surgeons implanting fewer than 100 were grouped together, and the results are shown as “Other (<100)”). The 5-year rates range from 0.00% to 10.29% depending on surgeon. The 7-year rates range from 0.00% to 14.08%, and the 9-year rates range from 2.29% to 21.64%.3
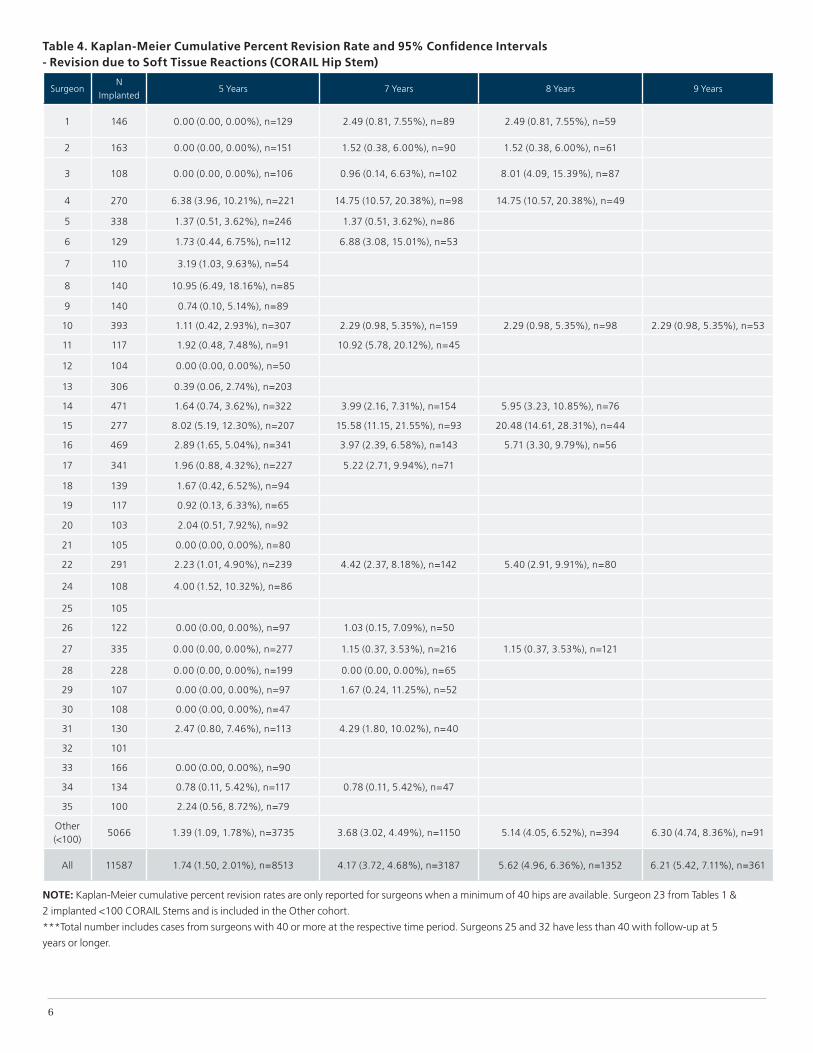
Table 4, shown on page 6, displays the Kaplan-Meier cumulative percent revision rates for revision specifically due to soft tissue reactions stratified by surgeon with the CORAIL Stem. The 5-year rates with the CORAIL Stem range from 0.00% to 10.95%, 7-year rates range from 0.00% to 15.58%, and 8-year rates range from 1.15% to 20.48%.3
Summary of ULTAMET Hip Metal-on-Metal Cumulative Percent Revision Rates
The cumulative percent revision rate of the ULTAMET Metal-on-Metal System compares favorably with the class of 36-40mm Metal-on-Metal hips in the 2014 AOANJRR reports. Additionally, ULTAMET Hip Metal-on-Metal performance has not been shown to be affected by head size in the NJR. Results do indicate there is a statistically significant difference in cumulative percent revision rates between sexes. The NJR results show significant variation in cumulative percent revision rates among surgeons with regards to revision for any reason and also revision due to soft tissue reactions.
3
Table 1. Kaplan-Meier Cumulative Percent Revision Rates and 95% Confidence Intervals - Revision for ANY reason (CORAIL, SUMMIT, and S-ROM Hip Stems)
SurgeonN
Implanted5 Years 7 Years 8 Years 9 Years
1 146 1.42 (0.36, 5.55%), n=129 6.42 (3.25, 12.48%), n=89 6.42 (3.25, 12.48%), n=59
2 163 3.11 (1.31, 7.31%), n=151 6.91 (3.75, 12.54%), n=90 6.91 (3.75, 12.54%), n=61
3 108 0.00 (0.00, 0.00%), n=106 2.83 (0.92, 8.52%), n=102 9.75 (5.36, 17.37%), n=87
4 381 9.10 (6.56, 12.57%), n=31415.88 (12.32, 20.34%),
n=17618.20 (14.18, 23.21%), n=118 19.91 (15.44, 25.45%), n=71
5 341 4.87 (2.96, 7.95%), n=249 5.38 (3.31, 8.68%), n=89
6 129 6.54 (3.32, 12.65%), n=112 12.26 (7.18, 20.51%), n=53
7 110 8.19 (4.15, 15.82%), n=54
8 148 14.19 (9.27, 21.39%), n=90
9 140 1.47 (0.37, 5.73%), n=89
10 393 1.89 (0.90, 3.92%), n=307 3.99 (2.14, 7.38%), n=159 3.99 (2.14, 7.38%), n=98 3.99 (2.14, 7.38%), n=53
11 117 5.46 (2.49, 11.77%), n=91 16.28 (10.06, 25.77%), n=45
12 104 4.03 (1.53, 10.39%), n=50
13 306 2.54 (1.21, 5.28%), n=203
14 471 3.83 (2.35, 6.19%), n=322 7.72 (5.15, 11.50%), n=154 10.22 (6.77, 15.26%), n=76
15 374 13.80 (10.61, 17.86%), n=283 22.40 (18.12, 27.52%), n=156 29.62 (24.27, 35.86%), n=97 31.26 (25.62, 37.79%), n=62
16 469 7.71 (5.57, 10.64%), n=341 9.21 (6.73, 12.53%), n=143 14.10 (10.05, 19.60%), n=56
17 341 3.22 (1.75, 5.91%), n=227 7.37 (4.41, 12.18%), n=71
18 139 3.84 (1.61, 9.00%), n=94
19 117 5.23 (2.38, 11.27%), n=65
20 103 7.86 (4.01, 15.11%), n=92
21 105 0.95 (0.13, 6.57%), n=80
22 301 4.22 (2.41, 7.31%), n=248 6.66 (4.16, 10.60%), n=149 7.55 (4.71, 12.01%), n=87
23 449 14.16 (11.19, 17.83%), n=267 20.91 (16.75, 25.92%), n=78
24 109 7.70 (3.92, 14.82%), n=87
25 105
26 122 6.00 (2.90, 12.18%), n=97 8.42 (4.40, 15.79%), n=50
27 335 4.30 (2.57, 7.15%), n=277 5.80 (3.68, 9.07%), n=216 5.80 (3.68, 9.07%), n=121
28 228 6.72 (4.11, 10.90%), n=199 8.59 (5.46, 13.39%), n=65
29 107 0.95 (0.13, 6.57%), n=97 2.60 (0.62, 10.51%), n=52
30 108 5.00 (2.10, 11.63%), n=47
31 131 3.20 (1.21, 8.31%), n=114 7.76 (3.77, 15.60%), n=40
32 101
33 166 3.25 (1.36, 7.64%), n=90
34 134 3.03 (1.15, 7.88%), n=117 3.03 (1.15, 7.88%), n=47
35 100 6.42 (2.93, 13.76%), n=79
Other
(<100)5256 4.80 (4.24, 5.43%), n=3905 8.39 (7.49, 9.39%), n=1275 10.70 (9.36, 12.23%), n=480 14.30 (11.87, 17.18%), n=143
All 12457 5.43 (5.03, 5.85%), n=9138 9.14 (8.54, 9.77%), n=354111.51 (10.70, 12.38%),
n=1580
13.44 (12.33, 14.64%),
n=529
NOTE: Kaplan-Meier cumulative percent revision rates are only reported for surgeons when a minimum of 40 hips are available
***Total number includes cases from surgeons with 40 or more at the respective time period. Surgeons 25 and 32 have less than 40 with follow-up
at 5 years or longer.
4
Table 2. Kaplan-Meier Cumulative Percent Revision Rates and 95% Confidence Intervals - Revision due to Soft Tissue Reactions (CORAIL, SUMMIT, AND S-ROM Hip Stems)
SurgeonN
Implanted5 Years 7 Years 8 Years 9 Years
1 146 0.00 (0.00, 0.00%), n=129 2.49 (0.81, 7.55%), n=89 2.49 (0.81, 7.55%), n=59
2 163 0.00 (0.00, 0.00%), n=151 1.52 (0.38, 6.00%), n=90 1.52 (0.38, 6.00%), n=61
3 108 0.00 (0.00, 0.00%), n=106 0.96 (0.14, 6.63%), n=102 8.01 (4.09, 15.39%), n=87
4 381 5.13 (3.26, 8.02%), n=314 11.03 (8.01, 15.09%), n=176 13.49 (9.88, 18.29%), n=118 14.45 (10.53, 19.67%), n=71
5 341 1.36 (0.51, 3.59%), n=249 1.36 (0.51, 3.59%), n=89
6 129 1.73 (0.44, 6.75%), n=112 6.88 (3.08, 15.01%), n=53
7 110 3.19 (1.03, 9.63%), n=54
8 148 10.29 (6.09, 17.10%), n=90
9 140 0.74 (0.10, 5.14%), n=89
10 393 1.11 (0.42, 2.93%), n=307 2.29 (0.98, 5.35%), n=159 2.29 (0.98, 5.35%), n=98 2.29 (0.98, 5.35%), n=53
11 117 1.92 (0.48, 7.48%), n=91 10.92 (5.78, 20.12%), n=45
12 104 0.00 (0.00, 0.00%), n=50
13 306 0.39 (0.06, 2.74%), n=203
14 471 1.64 (0.74, 3.62%), n=322 3.99 (2.16, 7.31%), n=154 5.95 (3.23, 10.85%), n=76
15 374 6.02 (3.88, 9.28%), n=283 14.08 (10.37, 18.98%), n=156 20.78 (15.78, 27.09%), n=97 21.64 (16.46, 28.15%), n=62
16 469 2.89 (1.65, 5.04%), n=341 3.97 (2.39, 6.58%), n=143 5.71 (3.30, 9.79%), n=56
17 341 1.96 (0.88, 4.32%), n=227 5.22 (2.71, 9.94%), n=71
18 139 1.67 (0.42, 6.52%), n=94
19 117 0.92 (0.13, 6.33%), n=65
20 103 2.04 (0.51, 7.92%), n=92
21 105 0.00 (0.00, 0.00%), n=80
22 301 2.16 (0.97, 4.74%), n=248 4.25 (2.28, 7.87%), n=149 5.16 (2.79, 9.46%), n=87
23 449 3.08 (1.76, 5.36%), n=267 5.86 (3.63, 9.38%), n=78
24 109 3.96 (1.51, 10.22%), n=87
25 105
26 122 0.00 (0.00, 0.00%), n=97 1.03 (0.15, 7.09%), n=50
27 335 0.00 (0.00, 0.00%), n=277 1.15 (0.37, 3.53%), n=216 1.15 (0.37, 3.53%), n=121
28 228 0.00 (0.00, 0.00%), n=199 0.00 (0.00, 0.00%), n=65
29 107 0.00 (0.00, 0.00%), n=97 1.67 (0.24, 11.25%), n=52
30 108 0.00 (0.00, 0.00%), n=47
31 131 2.45 (0.80, 7.40%), n=114 4.25 (1.79, 9.93%), n=40
32 101
33 166 0.00 (0.00, 0.00%), n=90
34 134 0.78 (0.11, 5.42%), n=117 0.78 (0.11, 5.42%), n=47
35 100 2.24 (0.56, 8.72%), n=79
Other
(<100)5256 1.41 (1.11, 1.79%), n=3905 3.62 (2.99, 4.38%), n=1275 5.00 (4.00, 6.25%), n=480 6.41 (4.83, 8.48%), n=143
All 12457 1.77 (1.54, 2.04%), n=9138 4.25 (3.81, 4.74%), n=3541 5.97 (5.31, 6.70%), n=1580 6.77 (5.95, 7.70%), n=529
NOTE: Kaplan-Meier cumulative percent revision rates are only reported for surgeons when a minimum of 40 hips are available
***Total number includes cases from surgeons with 40 or more at the respective time period. Surgeons 25 and 32 have less than 40 with follow-up at 5
years or longer.

5
Table 3. Kaplan-Meier Cumulative Percent Revision Rates and 95% Confidence Intervals - Revision for ANY Reason (CORAIL Hip Stem)
SurgeonN
Implanted5 Years 7 Years 8 Years 9 Years
1 146 1.42 (0.36, 5.55%), n=129 6.42 (3.25, 12.48%), n=89 6.42 (3.25, 12.48%), n=59
2 163 3.11 (1.31, 7.31%), n=151 6.91 (3.75, 12.54%), n=90 6.91 (3.75, 12.54%), n=61
3 108 0.00 (0.00, 0.00%), n=106 2.83 (0.92, 8.52%), n=102 9.75 (5.36, 17.37%), n=87
4 270 11.14 (7.88, 15.64%), n=221 20.44 (15.63, 26.48%), n=98 20.44 (15.63, 26.48%), n=49
5 338 4.91 (2.99, 8.03%), n=246 5.44 (3.35, 8.77%), n=86
6 129 6.54 (3.32, 12.65%), n=112 12.26 (7.18, 20.51%), n=53
7 110 8.19 (4.15, 15.82%), n=54
8 140 15.06 (9.86, 22.65%), n=85
9 140 1.47 (0.37, 5.73%), n=89
10 393 1.89 (0.90, 3.92%), n=307 3.99 (2.14, 7.38%), n=159 3.99 (2.14, 7.38%), n=98 3.99 (2.14, 7.38%), n=53
11 117 5.46 (2.49, 11.77%), n=91 16.28 (10.06, 25.77%), n=45
12 104 4.03 (1.53, 10.39%), n=50
13 306 2.54 (1.21, 5.28%), n=203
14 471 3.83 (2.35, 6.19%), n=322 7.72 (5.15, 11.50%), n=154 10.22 (6.77, 15.26%), n=76
15 277 13.94 (10.25, 18.81%), n=207 22.32 (17.35, 28.47%), n=93 28.10 (21.67, 35.95%), n=44
16 469 7.71 (5.57, 10.64%), n=341 9.21 (6.73, 12.53%), n=143 14.10 (10.05, 19.60%), n=56
17 341 3.22 (1.75, 5.91%), n=227 7.37 (4.41, 12.18%), n=71
18 139 3.84 (1.61, 9.00%), n=94
19 117 5.23 (2.38, 11.27%), n=65
20 103 7.86 (4.01, 15.11%), n=92
21 105 0.95 (0.13, 6.57%), n=80
22 291 4.36 (2.50, 7.55%), n=239 6.91 (4.31, 10.99%), n=142 7.86 (4.89, 12.52%), n=80
24 108 7.77 (3.96, 14.95%), n=86
25 105
26 122 6.00 (2.90, 12.18%), n=97 8.42 (4.40, 15.79%), n=50
27 335 4.30 (2.57, 7.15%), n=277 5.80 (3.68, 9.07%), n=216 5.80 (3.68, 9.07%), n=121
28 228 6.72 (4.11, 10.90%), n=199 8.59 (5.46, 13.39%), n=65
29 107 0.95 (0.13, 6.57%), n=97 2.60 (0.62, 10.51%), n=52
30 108 5.00 (2.10, 11.63%), n=47
31 130 3.23 (1.22, 8.38%), n=113 7.84 (3.81, 15.79%), n=40
32 101
33 166 3.25 (1.36, 7.64%), n=90
34 134 3.03 (1.15, 7.88%), n=117 3.03 (1.15, 7.88%), n=47
35 100 6.42 (2.93, 13.76%), n=79
Other
(<100)5066 4.82 (4.24, 5.46%), n=3735 8.51 (7.58, 9.55%), n=1150 10.93 (9.47, 12.61%), n=394 14.36 (11.80, 17.43%), n=91
All 11587 5.06 (4.66, 5.49%), n=8513 8.68 (8.07, 9.33%), n=3187 10.82 (9.99, 11.71%), n=1352 12.55 (11.43, 13.77%), n=361
NOTE: Kaplan-Meier cumulative percent revision rates are only reported for surgeons when a minimum of 40 hips are available. Surgeon 23 from Tables 1 &
2 implanted <100 CORAIL Stems and is included in the Other cohort.
***Total number includes cases from surgeons with 40 or more at the respective time period. Surgeons 25 and 32 have less than 40 with follow-up at 5
years or longer.
6
Table 4. Kaplan-Meier Cumulative Percent Revision Rate and 95% Confidence Intervals - Revision due to Soft Tissue Reactions (CORAIL Hip Stem)
SurgeonN
Implanted5 Years 7 Years 8 Years 9 Years
1 146 0.00 (0.00, 0.00%), n=129 2.49 (0.81, 7.55%), n=89 2.49 (0.81, 7.55%), n=59
2 163 0.00 (0.00, 0.00%), n=151 1.52 (0.38, 6.00%), n=90 1.52 (0.38, 6.00%), n=61
3 108 0.00 (0.00, 0.00%), n=106 0.96 (0.14, 6.63%), n=102 8.01 (4.09, 15.39%), n=87
4 270 6.38 (3.96, 10.21%), n=221 14.75 (10.57, 20.38%), n=98 14.75 (10.57, 20.38%), n=49
5 338 1.37 (0.51, 3.62%), n=246 1.37 (0.51, 3.62%), n=86
6 129 1.73 (0.44, 6.75%), n=112 6.88 (3.08, 15.01%), n=53
7 110 3.19 (1.03, 9.63%), n=54
8 140 10.95 (6.49, 18.16%), n=85
9 140 0.74 (0.10, 5.14%), n=89
10 393 1.11 (0.42, 2.93%), n=307 2.29 (0.98, 5.35%), n=159 2.29 (0.98, 5.35%), n=98 2.29 (0.98, 5.35%), n=53
11 117 1.92 (0.48, 7.48%), n=91 10.92 (5.78, 20.12%), n=45
12 104 0.00 (0.00, 0.00%), n=50
13 306 0.39 (0.06, 2.74%), n=203
14 471 1.64 (0.74, 3.62%), n=322 3.99 (2.16, 7.31%), n=154 5.95 (3.23, 10.85%), n=76
15 277 8.02 (5.19, 12.30%), n=207 15.58 (11.15, 21.55%), n=93 20.48 (14.61, 28.31%), n=44
16 469 2.89 (1.65, 5.04%), n=341 3.97 (2.39, 6.58%), n=143 5.71 (3.30, 9.79%), n=56
17 341 1.96 (0.88, 4.32%), n=227 5.22 (2.71, 9.94%), n=71
18 139 1.67 (0.42, 6.52%), n=94
19 117 0.92 (0.13, 6.33%), n=65
20 103 2.04 (0.51, 7.92%), n=92
21 105 0.00 (0.00, 0.00%), n=80
22 291 2.23 (1.01, 4.90%), n=239 4.42 (2.37, 8.18%), n=142 5.40 (2.91, 9.91%), n=80
24 108 4.00 (1.52, 10.32%), n=86
25 105
26 122 0.00 (0.00, 0.00%), n=97 1.03 (0.15, 7.09%), n=50
27 335 0.00 (0.00, 0.00%), n=277 1.15 (0.37, 3.53%), n=216 1.15 (0.37, 3.53%), n=121
28 228 0.00 (0.00, 0.00%), n=199 0.00 (0.00, 0.00%), n=65
29 107 0.00 (0.00, 0.00%), n=97 1.67 (0.24, 11.25%), n=52
30 108 0.00 (0.00, 0.00%), n=47
31 130 2.47 (0.80, 7.46%), n=113 4.29 (1.80, 10.02%), n=40
32 101
33 166 0.00 (0.00, 0.00%), n=90
34 134 0.78 (0.11, 5.42%), n=117 0.78 (0.11, 5.42%), n=47
35 100 2.24 (0.56, 8.72%), n=79
Other (<100)
5066 1.39 (1.09, 1.78%), n=3735 3.68 (3.02, 4.49%), n=1150 5.14 (4.05, 6.52%), n=394 6.30 (4.74, 8.36%), n=91
All 11587 1.74 (1.50, 2.01%), n=8513 4.17 (3.72, 4.68%), n=3187 5.62 (4.96, 6.36%), n=1352 6.21 (5.42, 7.11%), n=361
NOTE: Kaplan-Meier cumulative percent revision rates are only reported for surgeons when a minimum of 40 hips are available. Surgeon 23 from Tables 1 &
2 implanted <100 CORAIL Stems and is included in the Other cohort.
***Total number includes cases from surgeons with 40 or more at the respective time period. Surgeons 25 and 32 have less than 40 with follow-up at 5
years or longer.
7
References:
1. Australian Orthopaedic Association National Joint Replacement Registry. Annual Report, Adelaide: AOA, 2014 Table HT18. Retrieved from: https://aoanjrr.dmac.adelaide.edu.au/annual-reports-2014
2. National Joint Registry for England, Wales, and Northern Ireland, 11th Annual Report, 2014. Retrieved from: www.njrreports.org.uk
3. NJR-NJR data from 1st April 2003- 10th Sep 2014 on DePuy Synthes Joint Reconstruction products supplied for post-marketing surveillance, NJR Centre, 2014. Note: NJR-NJR Supplier Feedback data do not include Hospital Episode Statistics (HES) data linkage. Revisions may therefore be underreported.
4. Australian Orthopaedic Association National Joint Replacement Registry. Metal on Metal Total Conventional Hip Arthroplasty Supplementary Report 2014 Table MM10, Adelaide: AOA, 2014. Retrieved from: https://aoanjrr.dmac.adelaide.edu.au/annual-reports-2014
5. Australian Orthopaedic Association National Joint Replacement Registry. Metal on Metal Total Conventional Hip Arthroplasty Supplementary Report 2014 Figure MM2, Adelaide: AOA, 2014. Retrieved from: https://aoanjrr.dmac.adelaide.edu.au/annual-reports-2014

*DePuy Synthes Joint Reconstruction is a division of DePuy Orthopaedics, Inc.
© DePuy Synthes 2015. All rights reserved. DSUS/JRC/1014/0530 04/15
DePuy Orthopaedics, Inc.700 Orthopaedic DriveWarsaw, IN 46582USATel: +1(800) 366-8143 Fax: +1(800) 669-2530
DePuy International, Ltd.St Anthony’s RoadLeeds LS11 8DTEnglandTel: +44 (0) 113 270 0461Fax: +44 (0) 113 272 4101
depuysynthes.com