survive and prosper in a #digital world - amca · survive and prosper in a #digital world. ... •...
TRANSCRIPT

Cogital Confidential © 2015-2917 DO NOT SHARE
Survive and Prosper
in a #digital world

Cogital Confidential © 2015-2917 DO NOT SHARE
Cogital Confidential © 2015-2917 DO NOT SHARE

Cogital Confidential © 2015-2917 DO NOT SHARE

Cogital Confidential © 2015-2917 DO NOT SHARE

Cogital Confidential © 2015-2917 DO NOT SHARE
Deal with AmbiguityWhat has changed with technology
What does a winning #digital transformation strategy looks like
Data is the oil of the 21st century
Digital Maturity
Digital Agility

Cogital Confidential © 2015-2917 DO NOT SHARE
19861991
19962008

Cogital Confidential © 2015-2917 DO NOT SHARE
Digital Transformation LeadershipIncubation

Cogital Confidential © 2015-2917 DO NOT SHARE
what has changed with technology?

Cogital Confidential © 2015-2917 DO NOT SHARE
digitalclockspeed
in 1 minute….

Cogital Confidential © 2015-2917 DO NOT SHARE

Cogital Confidential © 2015-2917 DO NOT SHARE

Cogital Confidential © 2015-2917 DO NOT SHARE
the number of transistors in a dense integrated circuit doubles approximately every two years
4th Industrial Revolution is powered by Moore’s law
Gordon Moore – co- Founder Intel - 1965

Cogital Confidential © 2015-2917 DO NOT SHARE
We don’t understand exponential

Cogital Confidential © 2015-2917 DO NOT SHARE

Cogital Confidential © 2015-2917 DO NOT SHARE

Cogital Confidential © 2015-2917 DO NOT SHARE
1966 : Science Fiction 2017 : Billion of Users (2.32)

Cogital Confidential © 2015-2917 DO NOT SHARE
AB

Cogital Confidential © 2015-2917 DO NOT SHARE
area of overinflatedhype
area of geniusforecast
Hype Vector

Cogital Confidential © 2015-2917 DO NOT SHARE
Fail fast

Cogital Confidential © 2015-2917 DO NOT SHARE

Cogital Confidential © 2015-2917 DO NOT SHARE
201520051995
22
Market capitalization in bn. DollarSource: “DIE WELT KOMPAKT”, edition from 05.11.2015
87
90
69
71
104
70
68
69
107
136
Industrial Bank Japan
Royal Dutch Petrol.
Roche
Nippon Telegraph
Altria Group
ExxonMobil
Merck & Co
Toyota Motor
Coca-Cola
General Elec.
401
357
274
250
241
235
230
188
184
182
Time Warner
BP
General Elec.
Johnson & J.
ExxonMobil
Wal-Mart
Pfizer
Royal Dutch Shell
Citigroup
676
504
425
356
341
297
295
291
283
282
General Elec.
Wells Fargo
Johnson & J.
ExxonMobil
Berkshire
Cogital Confidential © 2015-2917 DO NOT SHARE

Cogital Confidential © 2015-2917 DO NOT SHARE
Deal with AmbiguityWhat has changed with technology
What does a winning #digital transformation strategy looks like
Data is the oil of the 21st century
Digital Maturity
Digital Agility

Cogital Confidential © 2015-2917 DO NOT SHARE
what is a good strategy?

Cogital Confidential © 2015-2917 DO NOT SHARE
Digital transformation strategy
© Cogital AECO Digital Transformation Framework© MIT Sloan: Digital Transformation Framework
TransformExcite
Digitise Leverage
Innovate how we deliver
Inno
vate
wha
twe
deliv
er

Cogital Confidential © 2015-2917 DO NOT SHARE
Digital transformation strategy
© Cogital AECO Digital Transformation Framework© MIT Sloan: Digital Transformation Framework
+26%-11%
-24% +9%
Innovate how we deliver
Inno
vate
wha
twe
deliv
er Leverage strategies drive profit growth
Transform strategies reward the risk capital

Cogital Confidential © 2015-2917 DO NOT SHARE
Digital transformation strategy
Leverage to Survive • Lean methodology• ROI driven investments• Robust delivery
Transform to Prosper• Incubate & test• Business model change may be
required© Cogital AECO Digital Transformation Framework© MIT Sloan: Digital Transformation Framework
THRIVEDIE HAPPY
DIE SURVIVE
Innovate how we deliver
Inno
vate
wha
twe
deliv
er
efficiency
value

Cogital Confidential © 2015-2917 DO NOT SHARE
(anyway does this apply to construction?)

Cogital Confidential © 2015-2917 DO NOT SHARE

Cogital Confidential © 2015-2917 DO NOT SHARE
PwC 2016 Global Industry 4.0 Survey conclusively shows that digitization will become a ‘qualifier to compete’
Interviewed companies across all industries expect to
more than double theirlevel of digitization by 2020.
Digitization is at the heart of strategic and research agenda
33% 72%+39%
High level of digitization today
High level of digitization in 5 years
Early movers are set to outpace their competitors
Early movers are almost3 x more successful
in combining high revenue increases with significant gains in cost
reduction.
Digitization drives quantum leaps in performance
The E&C industry expects cost reduction of 3.4%*).
Furthermore additional digital revenues of 2.9%*) are
expected from digitizing the product & service portfolio.
Companies of the E&C industry plan to invest 5.0%*) of their
annual revenue in digitization.
*) per annum until 2020
Focus on E&C industry
31
% of companies achieving >30% increased revenue and >30% reduced costs simultaneously by 2020
10%All
companies
27%First movers
196
Cost reductionRe
venu
e gr
owth
>30%
<30%
>30%<30%
PwC’s Capital Projects & Infrastructure Digital Services 32
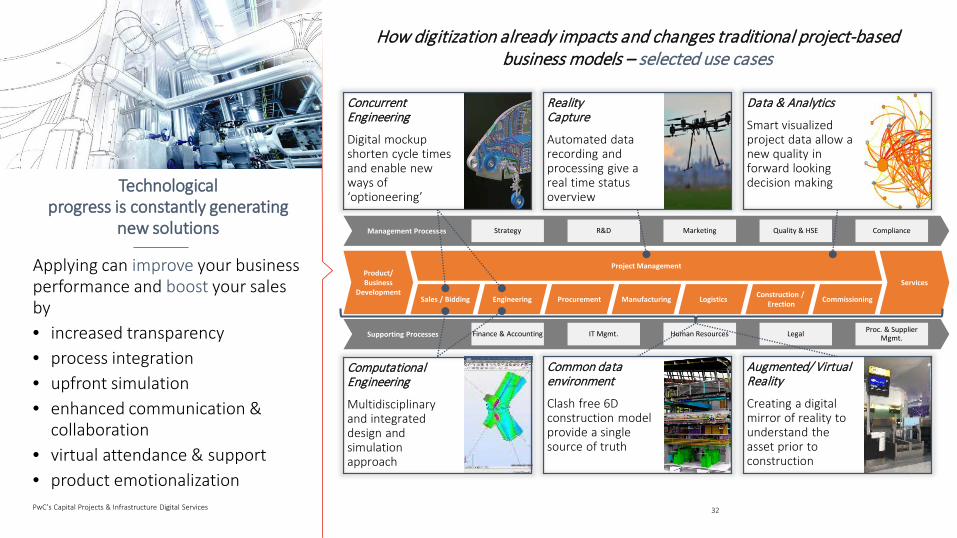
Technologicalprogress is constantly generating
new solutions
Applying can improve your business performance and boost your sales by • increased transparency• process integration• upfront simulation• enhanced communication &
collaboration• virtual attendance & support• product emotionalization
How digitization already impacts and changes traditional project-based business models – selected use cases
Services
Engineering CommissioningProcurement Manufacturing Logistics Construction /ErectionSales / Bidding
Supporting Processes
Project Management
Management Processes
Finance & Accounting
Marketing
Human Resources
Compliance
Legal Proc. & Supplier Mgmt.
Quality & HSE
IT Mgmt.
Strategy R&D
Product/ Business
Development
Computational Engineering
Multidisciplinary and integrated design and simulation approach
Augmented/ Virtual Reality
Creating a digital mirror of reality to understand the asset prior to construction
ConcurrentEngineering
Digital mockup shorten cycle times and enable new ways of ‘optioneering’
RealityCapture
Automated data recording and processing give a real time status overview
Common data environment
Clash free 6D construction model provide a single source of truth
Data & Analytics
Smart visualized project data allow a new quality in forward looking decision making

Cogital Confidential © 2015-2917 DO NOT SHARE
Our industry is a prime candidate for technology investment
The maturity of projects face great challenges or even fail on their set targets*)
71% of projects are over budget
of projects fail against key objectives86%
45% of projects delayed by 6 months or more
60% of projects fail at technology advances
37% cite contractual disputes as key challenge
The E&C industry’s productivity improvement did stagnate over the past 20 years
productivity gap in E&C
industryOpportunity to gain
Fear to loose
Digitisation Strategy Digital Transformation Strategy

Cogital Confidential © 2015-2917 DO NOT SHARE
What is the story with data?

Cogital Confidential © 2015-2917 DO NOT SHARE

PwC’s Capital Projects & Infrastructure Digital Services 36
ClaimMgmt.
Construc-tion
HSSE
ChangeMgmt.
Tendering Logistics Commis-sioning
QA
Scheduling
ResourcePlanning
Procure-ment
Legal
BusinessPlanning
ProgressTracking
Engineering
HR Mgmt.
Financing
Sales
Manufac-turing
RiskMgmt.
Digitization of functions & processes increasing data density
71% of projects are over budget
of projects fail against key objectives86%
45% of projects delayed by 6 months or more
60% of projects fail at technology advances
37% cite contractual disputes as key challenge
Fear to looseThe Digitization Strategy
Opportunity to gain
Fear to loose

PwC’s Capital Projects & Infrastructure Digital Services 37
Technological progress open opportunities to utilize your data
basis and… Bid better
Contract better
Build &maintain better
…to add value to your scope of the project:
Comprehensive understanding of asset and possible options
Validated technology and design simulation
Transparent scope and division of work
Clarified interfaces and sequences
Shortened processing times with reduced cycles
Accelerated construction with reliable end date
Avoided clashes and delays
Reduced claims and contractual disputes
Emotionalized, engaged stakeholders
Stable margins, reduced riskNew ways to monetize your data asset
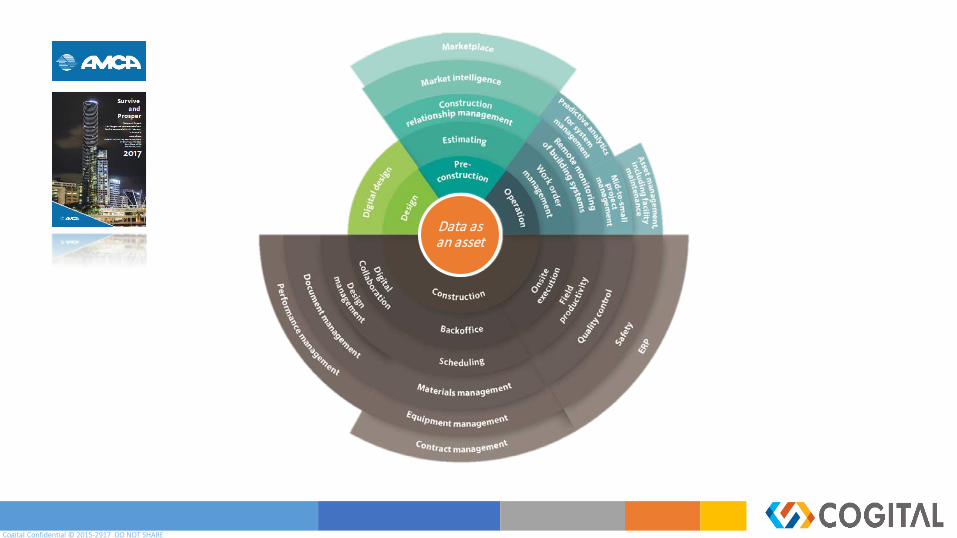
Data as an asset
Cogital Confidential © 2015-2917 DO NOT SHARE
Data as an asset

Cogital Confidential © 2015-2917 DO NOT SHARE
The information patterns of the construction industry in comparison to other industries
Manufacturing
Construction
Software
Financial Service
Media & Entertainment
Individual company
Individual external company
Connection from internal or external user
Thickness represents frequency of connection

Cogital Confidential © 2015-2917 DO NOT SHARE
ClientDesign Team
Design
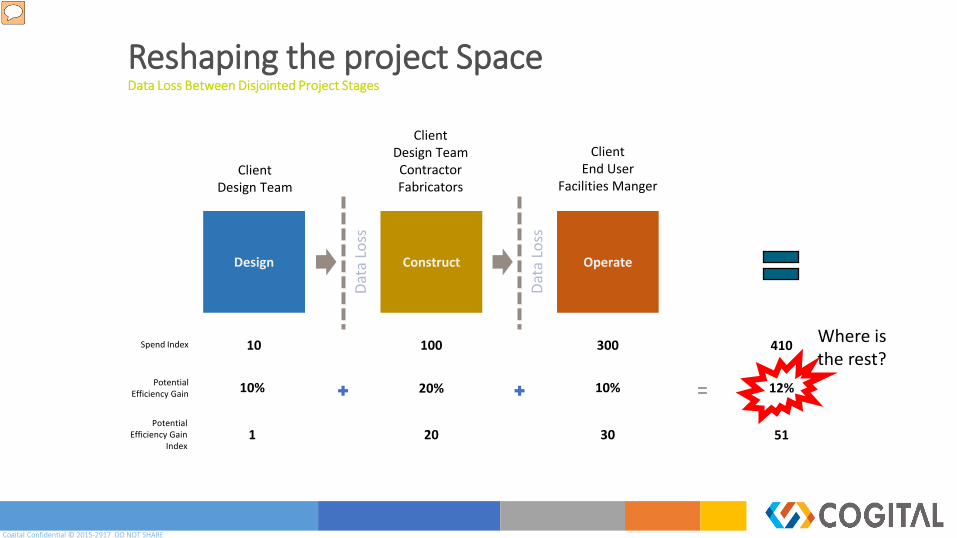
Reshaping the project SpaceData Loss Between Disjointed Project Stages
Construct Operate
ClientDesign TeamContractorFabricators
ClientEnd User
Facilities Manger
Data
Los
s
Data
Los
s
Cogital Confidential © 2015-2917 DO NOT SHARE
ClientDesign Team
Design
Reshaping the project SpaceData Loss Between Disjointed Project Stages
Construct Operate
ClientDesign TeamContractorFabricators
ClientEnd User
Facilities Manger
Spend Index 10 100 300
Potential Efficiency Gain 10% 20% 10%
Potential Efficiency Gain
Index20 30
Data
Los
s
Data
Los
s
410
12%
51
Where is the rest?
1

Cogital Confidential © 2015-2917 DO NOT SHARE
ClientDesign Team
Design Construct Operate
ClientDesign TeamContractorFabricators
ClientEnd User
Facilities Manger
Project Data Exchange Eco System
Mod
el E
volu
tion
Mod
el E
volu
tion
Reshaping the project SpaceHarvesting Data to Improve Design and close the Loop

Cogital Confidential © 2015-2917 DO NOT SHARE
ClientDesign Team
Design
Reshaping the project SpaceHarvesting Data to Improve Design and close the Loop
Construct Operate
ClientDesign TeamContractorFabricators
ClientEnd User
Facilities Manger
Operate
Operate
Operate
Operate
Construct
Construct
Construct
Construct
Design
Design
Design
Design
Precedent Data
Project Data Exchange Eco System
Mod
el E
volu
tion
Mod
el E
volu
tion
Outcomes

Cogital Confidential © 2015-2917 DO NOT SHARE
ClientDesign Team
Design
Reshaping the project SpaceHarvesting Data to Improve Design and close the Loop
Construct Operate
ClientDesign TeamContractorFabricators
ClientEnd User
Facilities Manger
Operate
Operate
Operate
Operate
Construct
Construct
Construct
Construct
Design
Design
Design
Design
Precedent Data
Project Data Exchange Eco System
Mod
el E
volu
tion
Mod
el E
volu
tion
OutcomesDevelop

Cogital Confidential © 2015-2917 DO NOT SHARE
DATA LAKE
ClientDesign Team
Design
Reshaping the project SpaceHarvesting Data to Improve Design and close the Loop
Construct Operate
ClientDesign TeamContractorFabricators
ClientEnd User
Facilities Manger
Operate
Operate
Operate
Operate
Construct
Construct
Construct
Construct
Design
Design
Design
Design
Precedent Data
Project Data Exchange Eco System
Mod
el E
volu
tion
Mod
el E
volu
tion
OutcomesDevelop

Cogital Confidential © 2015-2917 DO NOT SHARE
1. Initialise PREDIX data platform and dashboards
2. Track Temp, Humidity, CO2, Light, Noise.
3. Derive Insights
Day in life monitoring
Cogital Confidential © 2015-2917 DO NOT SHARE
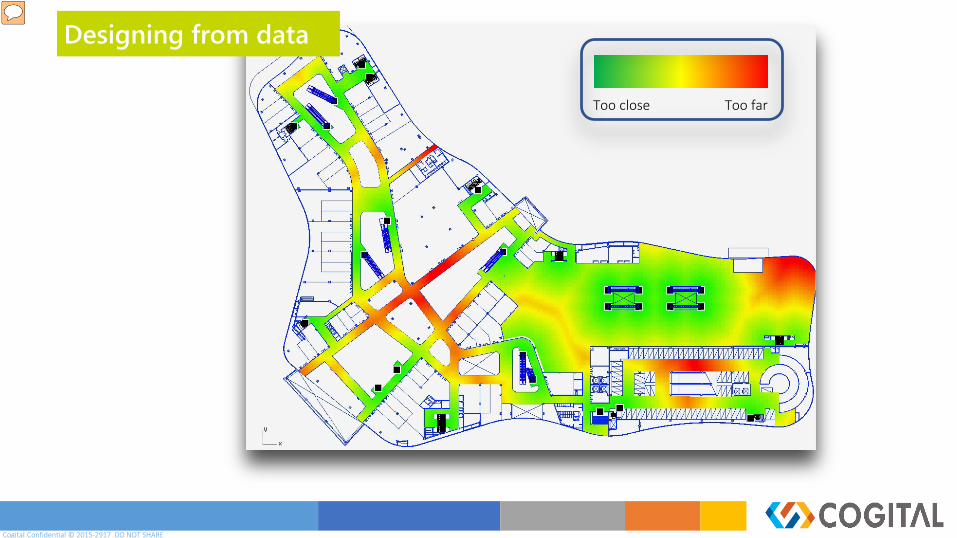
Too close Too far
Designing from data

Cogital Confidential © 2015-2917 DO NOT SHARE
Measuring the workplace performance, and supercharging it

Cogital Confidential © 2015-2917 DO NOT SHARE

Cogital Confidential © 2015-2917 DO NOT SHARE
Track meeting room data
WeWork App167,000
members
Cogital Confidential © 2015-2917 DO NOT SHARE
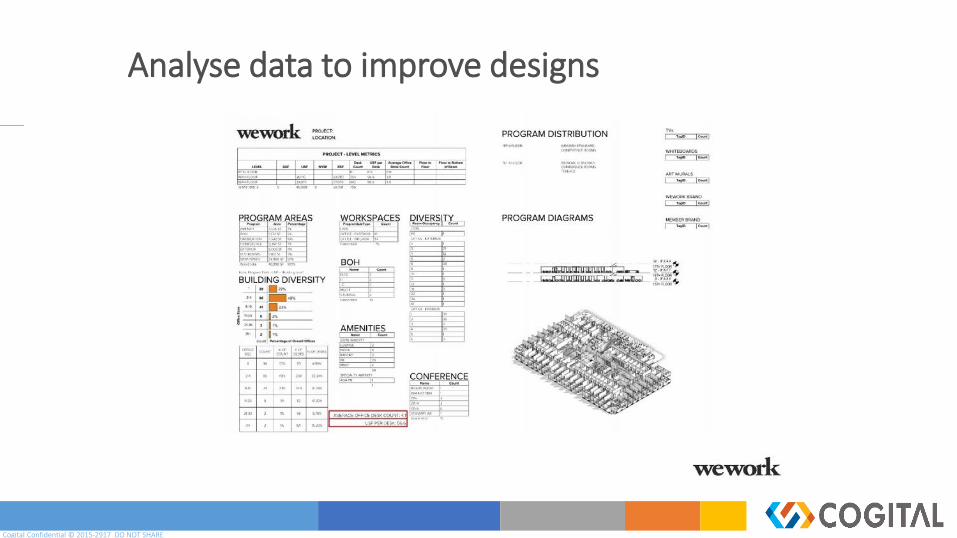
Analyse data to improve designs

Cogital Confidential © 2015-2917 DO NOT SHARE
Use data and designs to train Machine Learning systems
WeWork App167,000
members
Cogital Confidential © 2015-2917 DO NOT SHARE
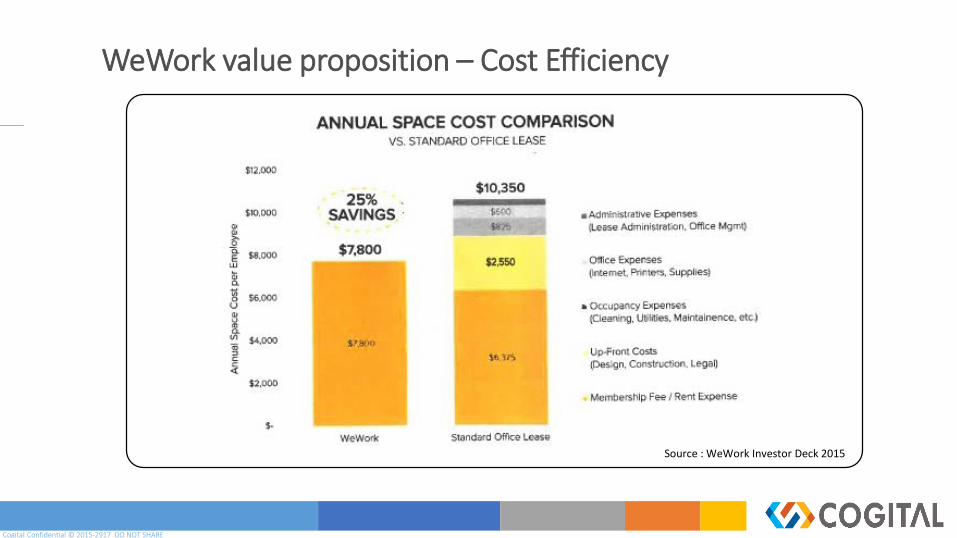
WeWork value proposition – Cost Efficiency
Source : WeWork Investor Deck 2015

Cogital Confidential © 2015-2917 DO NOT SHARE
Design up to fabrication, then procure

Cogital Confidential © 2015-2917 DO NOT SHARE
WeWork has acquired venture-backed Fieldlens

Cogital Confidential © 2015-2917 DO NOT SHARE
WeWork creates new enterprise division

Cogital Confidential © 2015-2917 DO NOT SHARE

Cogital Confidential © 2015-2917 DO NOT SHARE
Deal with AmbiguityWhat has changed with technology
What does a winning #digital transformation strategy looks like
Data is the oil of the 21st century
Digital Maturity
Digital Agility

Cogital Confidential © 2015-2917 DO NOT SHARE
Erkrather Straße 401, factorycampus40231 Düsseldorf, Germany
Tel: +49 172 300 28 60Email: [email protected]
Web: www.cogital.tech
BUILDING A SMART FUTURE, TOGETHER