survey report spajanje - cevesceves.org.rs/wp-content/uploads/2015/05/ceves-survey-report.pdf ·...
TRANSCRIPT

1
SURVEY REPORT
Survey Report for CEVES’s project “Serbia’s real sector performance: Exhibited competitiveness by Size, Industry and Regions”
- Funded by USAID Sustainable Local Development Project (SLDP) -

2
Table of Contents 1. EXECUTIVE SUMMARY ........................................................................................................... 7 2. INTRODUCTION ......................................................................................................................... 8 3. METHODOLOGY ...................................................................................................................... 10 3.1. Survey Execution ............................................................................................................ 10 3.2. Sample Population, Sampling Procedure, and Strata Definition ............... 10 3.3. Sources of Bias and External Validity .................................................................... 13 3.4. Sources of Bias and Internal Validity .................................................................... 13
4. RESPONDENT PROFILES .................................................................................................... 14 4.1. Company Profiles ........................................................................................................... 14 4.2. Survey Respondent Profiles ...................................................................................... 18
5. OWNERSHIP STRUCTURE .................................................................................................. 18 5.1. Motivation ......................................................................................................................... 18 5.2. Key Findings ..................................................................................................................... 19
6. MANAGEMENT ........................................................................................................................ 22 6.1. Motivation ......................................................................................................................... 22 6.2. Key Findings ..................................................................................................................... 23 6.3. Training and Education ............................................................................................... 23 6.4. Management Decision-‐Making ................................................................................. 25 6.5. Financial Management ................................................................................................. 26 6.6. Liquidity Constraints .................................................................................................... 26 6.7. State Inspections ............................................................................................................ 28
7. ECONOMIC ACTIVITY ........................................................................................................... 28 7.1. Motivation ......................................................................................................................... 28 7.2. Main Findings .................................................................................................................. 29 7.3. Product/Service Classification ................................................................................. 29 7.4. Product/Service Importance .................................................................................... 31
8. COMPETITION ......................................................................................................................... 32 8.1. Motivation ......................................................................................................................... 32 8.2. Main Findings .................................................................................................................. 32 8.3. Competition in the Marketplace .............................................................................. 33 8.4. Marketing Expenditures ............................................................................................. 35 8.5. Internationally Recognized Certification ............................................................. 35 8.6. Membership in Business Associations .................................................................. 36

3
9. SUPPLIERS ................................................................................................................................ 38 9.1. Motivation ......................................................................................................................... 38 9.1. Key Findings ..................................................................................................................... 38 9.2. Sources of Raw Materials ........................................................................................... 38 9.3. Sub-‐Contracting .............................................................................................................. 41
10. BUYERS AND MARKETS .................................................................................................. 42 10.1. Motivation ..................................................................................................................... 42 10.2. Key Findings ................................................................................................................ 42 10.3. Source of Sales Revenue by Geography ........................................................... 43 10.4. Concentration and Profile of Domestic Sales Revenue ............................. 45
11. EXPORT ................................................................................................................................... 47 11.1. Motivation ..................................................................................................................... 47 11.2. Key Findings ................................................................................................................ 47 11.3. Basic Composition ..................................................................................................... 47 11.4. Exporters ....................................................................................................................... 48 11.4.1. Foreign Buyers ................................................................................................... 49 11.4.2. Market Diversification .................................................................................... 49 11.4.3. Product Diversification .................................................................................. 50 11.4.4. Competences and Barriers ........................................................................... 50
11.5. Non-‐Exporters ............................................................................................................ 52 12. ACCESS TO FINANCE ........................................................................................................ 53 12.1. Motivation ..................................................................................................................... 53 12.2. Key Findings ................................................................................................................ 53 12.3. Overall Financing ....................................................................................................... 54 12.4. Access to Commercial Bank Financing ............................................................. 55 12.5. Firms That Borrow ................................................................................................... 56 12.6. Firms That Do Not Borrow .................................................................................... 57
13. CRISIS AND INNOVATION .............................................................................................. 58 13.1. Motivation ..................................................................................................................... 58 13.2. Key Findings ................................................................................................................ 58 13.3. Firms That Innovated .............................................................................................. 59 13.4. Firms That Did Not Innovate ................................................................................ 60
14. INVESTING ............................................................................................................................ 60 14.1. Motivation ..................................................................................................................... 60 14.2. Key Findings ................................................................................................................ 61 14.3. Sudden Increases in Demand ............................................................................... 61

4
14.4. Aspirations and Expectations for Future Growth ....................................... 62 14.5. Barriers to Growth .................................................................................................... 63 14.6. Potential Employment ............................................................................................. 64 14.7. Expected Trends in Income ................................................................................... 65
15. CONCLUSION ........................................................................................................................ 68 16. REFERENCES ........................................................................................................................ 69 17. ANNEX ..................................................................................................................................... 70 _Toc399156783
5
CONTENT OF TABLES AND GRAPHS Table 3.1. Distribution by economic activity of business entities, 2012 ................. 11 Table 3.2. Distribution by region, 2012 ................................................................................. 12 Table 3.3. Distribution by size of business entities, 2012 .............................................. 12 Table 3.4. Distribution by performance of business entities, 2012 ........................... 13 Graph 4.1. Companies Surveyed, by Industry ...................................................................... 15 Table 4.1. The top ten most commonly identified industries ....................................... 15 Graph 4.2. Regions of surveyed companies .......................................................................... 16 Graph 4.3. Companies surveyed by size ................................................................................. 16 Table 4.2. Company size figures ................................................................................................ 17 Graph 44. Breakdown of successful / not successful companies ................................ 17 Graph 4.5. Position of respondents .......................................................................................... 18 Graph 5.1. Number of owners .................................................................................................... 19 Graph 5.2. Ownership structure by legal status of owner .............................................. 20 Graph 5.3. Ownership share of the largest owner in companies with multiple owners .................................................................................................................................................. 21 Graph 5.4. Presence of founders in ownership structure ............................................... 22 Graph 6.1. Number of new employees hired in 2013 without previous experience .................................................................................................................................................................. 24 Graph 6.2. Company training in 2013 ..................................................................................... 24 Graph 6.3. Decision-‐making authority regarding new products, services or capacities ............................................................................................................................................. 25 Graph 6.4. Decision-‐making authority regarding additional debt .............................. 25 Graph 6.5. Financial analyses in enterprise ......................................................................... 26 Graph 6.6. Average number of days to receive payment from buyers ..................... 27 Graph 6.7. Average number of days to disburse payment for goods and services .................................................................................................................................................................. 27 Graph 6.8. Percentage of companies visited by inspection in past year .................. 28 Graph 7.1. Sector overlap: registered versus response ................................................... 29 Graph 7.2. Sector in which the main product/service can be classified .................. 30 Graph 7.3. Sector in which the main product/service can be classified .................. 30 Graph 7.4. Percent of revenue from sales from operating activities ......................... 31 Graph 7.5. Percent of revenue from sales from operating activities ......................... 31 Graph 8.1. How companies evaluate their competition .................................................. 33 Table 8.1. Competition in industry ........................................................................................... 34 Graph 8.2. Product differentiation of surveyed companies ........................................... 34 Graph 8.3. Percentage of sales revenue spent on marketing ........................................ 35 Graph 8.4. Percentage of firms with internationally-‐recognized certificate .......... 36 Graph 8.5. Certificates owned by the companies ............................................................... 36 Graph 8.6. Association membership of surveyed companies ....................................... 36 Graph 8.7. Type of association membership ........................................................................ 37 Graph 8.8. Reason for not joining associations ................................................................... 37 Graph 9.1. Breakdown of where Serbian manufacturers source raw materials .. 39 Graph 9.2. Percentage of raw material imported from abroad .................................... 39 Graph 9.3. Which industries import their raw materials? ............................................. 40 Graph 9.4. Why Serbian companies import raw materials from abroad ................. 40 Graph 9.5. Percent of raw materials produced by company ......................................... 41 Graph 9.6. Percentage of operating revenue from outsourcing / sub-‐contracting .................................................................................................................................................................. 41

6
Graph 9.7. Percentage of expenses spent on outsourcing / sub-‐contracting ........ 42 Graph 10.1. Sources of sales revenue by location .............................................................. 43 Graph 10.2 Percentage of sales realized in home municipality ................................... 44 Graph 10.3. Percentage of sales realized in Belgrade ...................................................... 44 Graph 10.4. Percentage of sales realized elsewhere in Serbia ..................................... 45 Graph 10.5. Percentage of sales realized through exports ............................................ 45 Graph 10.6. Sources of sales revenue on domestic market, % ..................................... 46 Graph 10.7. Percent of domestic sales accounted for by single largest customer 46 Graph 11.1. Share of companies: exporters vs. non-‐exporter ...................................... 48 Graph 11.2. Continuity in exporting of companies ............................................................ 48 Graph 11.3. Forms of cooperation with foreign buyers .................................................. 49 Graph 11.4. What makes company competitive on foreign markets? ...................... 50 Graph 11.5. Barriers to exporting ............................................................................................. 51 Graph 11.6. Export financing with loans ............................................................................... 52 Graph 11.7. Reasons behind termination of export activities ...................................... 52 Graph 12.1. The most important modes of financing by size of enterprise ........... 54 Graph 12.2. Access to commercial bank financing (%) ................................................... 55 Graph 12.3. bank loans usage by size of enterprise .......................................................... 55 Graph 12.4. Structure of bank products by type ................................................................ 56 Graph 12.5. Response to question, “are you generally interested in taking a bank loan for financing of your business?” ...................................................................................... 57 Graph 13.2. Firms that did not innovate ................................................................................ 60 Graph 14.1. Company capability to meet sudden increases in demand .................. 61 Graph 14.2. What are your expectations regarding expansion of your business operations? ......................................................................................................................................... 62 Graph 14.3. External problems or barriers .......................................................................... 63 Graph 14.4. Problems/Barriers according to firm size ................................................... 64 Graph 14.5. Do you expect to hire more staff in the next 12 months, regardless of the type of contract with them? ................................................................................................. 64 Graph 14.6. Do you expect to hire more staff in the next 12 months, regardless of the type of contract with them? ................................................................................................ 65 Graph 14.7. "Yes, we need __employees:" Number of employees expected to be hired in the next 12 months ........................................................................................................ 65 Graph 14.8. How do you expect your income to change in the next 12 months? 65 Graph 14.9. How do you expect your income to change in the next 12 months? 66 Graph 14.10. Enterprise income to rise ................................................................................. 67 Graph 14.11. Enterprise income to fall ................................................................................... 67

7
1. EXECUTIVE SUMMARY CEVES is an independent think-and-do-tank devoted to advancing Serbia’s economic recovery, democratic consolidation, and convergence with the European Union through evidence-based policy advocacy, and by mobilizing stakeholders and the public to engage in institution-building, and civic or concrete project initiatives. This goal of this survey was to assess the key factors underlying the performance of enterprises in Serbia. It covers ten general topic areas of private sector operations in attempt to broadly identify and assess what firms do, how they are structured and run, whom they interact with and how, and what their expectations are for the future. In line with CEVES’ belief that exports must be the primary mechanism underpinning Serbia’s economic growth, the survey focuses only on tradable sectors. It also hones in relatively more on three areas CEVES considers to be particularly important determinants of company success or failure: corporate governance, financial management and access to finance, and exports.
In the realm of corporate governance, the survey revealed that company ownership and decision-making authority tend to be concentrated in few people. Around three quarters of companies only have one owner; moreover, single individuals tend to hold ownership stakes greater than 50% in businesses with multiple individuals in the ownership structure. 90% of companies are also family-owned. Given the prevalence of concentration of ownership, it almost naturally follows that decision-making authority also lies in the hands of few individuals. Owners are most often the only individuals involved in important operational decisions such as capital investments and taking on additional credit. They are also normally the only ones involved in the regular financial management of the company.
In terms of financing, most companies rely mainly on themselves and eschew financing from commercial banks, even in spite of evidence to suggest that businesses have reason for seeking credit. Most enterprises rely on only one source of financing - internal financing - which is also the most used source of financing in the vast majority of companies. Domestic bank loans were identified as one of the three most important sources of financing by 27% of companies. Even though over half of firms have used bank loans at some point, only around one third do so currently. Most indicated that they not need loans, but would reconsider if certain factors were to change. Given Serbian firms’ tendency innovate and invest (most did so even during the crisis), desire to expand operations (nearly two thirds stated a desire to develop their business in the future), and identification of financing as a problem (it was cited as the most common obstacle to expansion of operations), it would seem that there is indeed demand for increased access to finance.
Survey evidence broadly suggests that there is potential for Serbian companies to raise export performance. Bearing in mind that this survey covered businesses in tradable sectors only, on the surface it appears low that around three quarters of companies surveyed do not export currently. Moreover, nearly all of those that do not export note that they never have exported, and just under three quarters of non-exporters do not believe that they will begin doing so in the next year. It is then perhaps unsurprising that exports on average accounted for only 9% of company sales. Encouragingly, companies that do export tend to do so for continuous periods of time. Most cite the quality of their product as their main competitive edge on foreign markets, while firms most often pointed to trouble in finding appropriate buyers as the biggest obstacle to greater exports.

8
2. INTRODUCTION The USAID Sustainable Local Development Project (SLDP) is a five-year program designed to improve the capacity of Serbian municipal governments, business advocacy groups, and civil society organizations in creating and implementing policies, procedures, and projects that will contribute to area-based economic development and good governance. As part of its engagement on this initiative, CEVES seeks to provide a knowledge foundation that can be used to identify industries with the greatest potential to deliver benefits to growth, and hence that deserve to be the subject of further investigation and research and potential policy interventions.
This survey serves to ultimately complement sector-level information derived from quantitative data analysis of export competitiveness and industry performance with firm-level insight into the determinants of company success or failure. By combining findings from both analyses, CEVES will be able to provide a comprehensive final report and information base that will enable local and national policymakers, the expert community, and the public to improve intervention design and identify the most worthwhile partners and beneficiaries.
The goal of this survey is to assess the key factors underlying the performance of enterprises in tradable industries in Serbia. Broadly, it covers a range of topics related to private sector operations: companies’ economic activities and ownership structures, competition, suppliers, buyers and markets (both domestic and foreign), management functions, performance during the crisis, access to finance, and investment. However, in line with CEVES’ mission and its other analyses for the SLDP project, it places relatively greater focus and emphasis on export performance, financial management and access to finance, and corporate governance. Much of the information derived herein also aligns with other areas CEVES believes are of great importance for private sector development in Serbia such as SME development and entrepreneurship.
The following is a short overview of results presented by chapter:
• Company ownership structures in Serbia tend to be very concentrated. Most firms are family owned and usually have one sole owner. When multiple owners are present, one usually hold an ownership stake that is at least 50% of the total. The presence of foreign ownership is relatively rare, but tends to have a large stake in companies when present.
• Following from this, it is almost intuitive that management responsibilities are also typically focused on one individual. Indeed, it is usually the owner that is responsible for financial management and making important decisions such as capital investment or taking on additional debt. There is also evidence to suggest that financial management is not carried out regularly enough. Given the current status of youth unemployment in Serbia, it is discouraging to note that 85% of companies in the past year did not hire workers without experience, and those that did hired very few such employees.
• It is not uncommon in Serbia to hear anecdotal evidence suggesting that there is a mismatch between companies’ registered business activity and what it is they are actually engaged in. Research found that nearly 13% of companies mainly are not involved in the field of their registered activity, while an additional 8.5% of companies’ actual and registered activities overlapped to a certain degree. Firms’ self-identified primary activities accounted for over 90% of revenues in nearly two thirds of all firms surveyed.

9
• Running somewhat counter to popular belief about market structure in Serbia, nearly all companies (94%) noted belonging to sectors with high degrees of competition; very few believe they operate in industries characterized by oligopoly or monopoly. This contrasts the findings of the recently-released Global Competitiveness Report 2014-2015, in which Serbia ranks in the 128th out of 144 in terms of intensity of domestic competition (WEF, P.329). Most companies believe that said competition was healthy, but a sizeable portion also believed their competitors engaged in illegitimate or illegal behavior. While there are many ways for companies to differentiate themselves from the competition, they generally do not do so by spending on marketing, acquiring internationally recognized certificates, or joining business associations.
• Serbian manufacturers primarily source their raw materials from other domestic suppliers. When forced to turn to exports, it is usually because there is a lack of appropriate or adequately-priced raw materials on the domestic market.
• An analysis of markets and buyers reveals that Serbian companies on the whole mainly sell their goods and services within the same municipality or city in which they are located. A mere 9% of overall sales revenue is generated by exports. However, it is encouraging to note that Serbian companies generally do not overly rely on one or a few customers for their revenue.
• Even though this survey covered only companies in tradable sectors, only 26.3% of business generate any exports. When they do, it is most often through direct sales and, in a little more than half of cases, to only one buyer. Most companies that do not currently export have never exported and do not believe they will begin doing so in the next 12 months.
• On the whole, Serbian firms mainly rely on retained earnings for financing. The second most used form of financing were commercial bank loans. The number one reason for not wanting to take out additional financing was a lack of a need for it, although many firms did indicate that they would indeed consider doing so were certain circumstances to change.
• This survey also examined the measures respondent companies took in response to the crisis. Just over half (52%) of companies did undertake innovative activities in the past five years; the most common undertaking in this sense was the development of new or considerably upgraded products or services, and many invested in new technologies or in broaching new markets as well.
• A closer look at companies’ investment plans reveals that the majority of companies wish to expand their businesses, but face barriers in doing so. The four most commonly cited obstacles were, in descending order: financing growth, limited demand, rising input costs, and increased competition. Businesses are also skeptical about employment and income prospects. Only slightly over one quarter of companies surveyed expect to hire more workers in the next year. Most firms expect income to remain roughly the same in the following year, but a greater percentage of businesses indicated believing that their profits would decrease than increase.

10
3. METHODOLOGY
3.1. Survey Execution
The survey included a sample of 1,062 face-to-face (F2F) interviews carried out over a period of 36 days from July 3rd to August 7th, 2014. 121 surveyors visited the company representatives in-person and recorded all answers to questions on paper. Interviews were carried out in Serbian. Most questions were associated with “multiple choice” answers, but there were open-ended questions as well. IPSOS Strategic Marketing, in consultation with the Center for Advanced Economic Studies (CEVES), was responsible for the execution of the survey as well as the input and delivery of the data.
In total, there were 115 questions; however, respondents answered far fewer questions given that the survey also involved “branching.” The average interview time was 40 minutes. In slightly over 72% of interviews, the interviewer noted that that they believed that the respondent found the interview entirely clear, and an additional 25.6% indicated thinking that the respondent found the survey mainly clear; in 2.1% of instances interviewers noted that the interviewees found the survey unclear. The questions covered a range of subject areas CEVES considers of primary importance to private sector operations in Serbia (see Annex 1 for the actual survey).
The final data was unified, verified, and inputted into the SPSS program. The data was subsequently weighted in order to make it representative of the entire population of companies in what CEVES defines as tradable sectors Serbia. The final version of the data was delivered in both Serbian and English.
3.2. Sample Population, Sampling Procedure, and Strata Definition
The sample frame included 26,644 active companies and entrepreneurs that formally submitted financial statements to the Serbian Business Registers Agency in 2012 and are headquartered in the Republic of Serbia. Given CEVES’ emphasis on private sector development and export promotion as key levers of growth, this survey only covered tradable sectors and excluded companies in which the state had a significant ownership state. It also excluded registered entrepreneurs that did not submit formal financial statements in 2012. In summary, it therefore excluded businesses that met any of the following criteria:
• Businesses in the retail sector and other services not categorized as intellectual services (e.g. business services, ICT services)
• Firms in which the state held at least a 25% ownership stake • Public companies • Cooperatives and cooperative unions • Registered entrepreneurs that did not submit financial statements in 2012 • Companies whose balance sheets were not considered reliable

11
In creating sample strata, CEVES wished to create a sample of companies representative of the population of companies in Serbia. It therefore created a one-stage stratified random sample based on:
• Companies’ sector of economic activity: agriculture, food processing, light industry, heavy industry, and intellectual services.
• Region in which businesses are registered: Belgrade, Vojvodina, Šumadija and West Serbia, and South and East Serbia.
• Company size: small, medium, and large. • Business performance: successful and unsuccessful.
Ideally, the size of each subsample should be proportional to size of subpopulation it represents. In other words, the structure of each of the subsamples defined should be representative for the entire universe within each of these variables.
However, besides being representative, each of these subsamples has to be large enough to provide reliable data for the subpopulations they represent. The reliability of the data on the level of subsample therefore depends on each sample size therein. It is thus crucial to design a sample consisting of enough companies in each of the 14 subsamples described above. This is why the number of companies in certain categories is increased and reduced in others relative to their overall representation. These are subsequently weighted in order to have the data be representative of the entire national population.
Therefore, the final allocation included 120 strata: 5 categories of business activity x 4 categories of region x 3 categories of company size x 2 categories of business performance. The following sections describe the sample categories and the percentage targets defined for each:
Economic activity of business entities: In order to have a reliable number of companies in each of the categories, the number of companies in agriculture and extraction and food processing was increased, while number of companies in the Intellectual services category was reduced.
Table 3.1. Distribution by economic activity of business entities, 2012 Economic Activity Population Target
N %
Agriculture 2,461 9.2 12.8 Food processing 3,010 11.3 15.7 Light manufacturing 4,739 17.8 17.8 Heavy manufacturing 7,658 28.7 28.7 Intellectual services 8,776 32.9 25 Total 26,644 100% 100% Region: The following allocations were used for regional distribution of companies
12
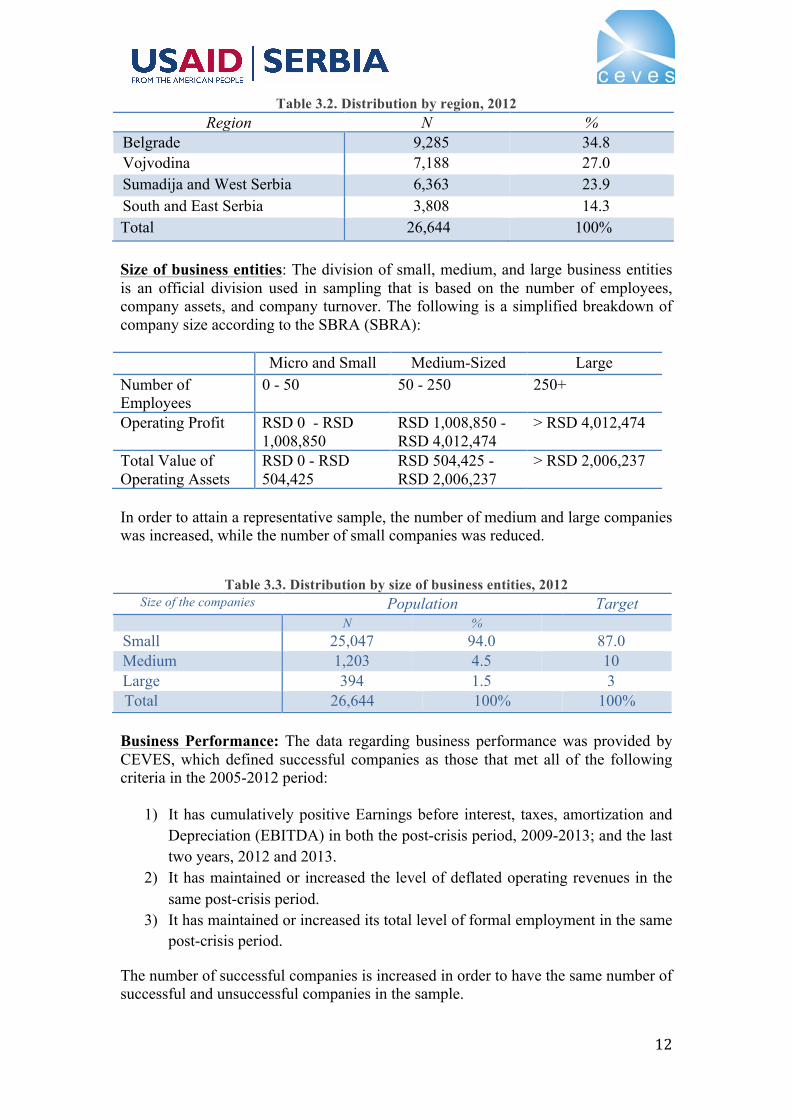
Table 3.2. Distribution by region, 2012 Region N %
Belgrade 9,285 34.8 Vojvodina 7,188 27.0 Sumadija and West Serbia 6,363 23.9 South and East Serbia 3,808 14.3 Total 26,644 100% Size of business entities: The division of small, medium, and large business entities is an official division used in sampling that is based on the number of employees, company assets, and company turnover. The following is a simplified breakdown of company size according to the SBRA (SBRA): Micro and Small Medium-Sized Large Number of Employees
0 - 50 50 - 250 250+
Operating Profit RSD 0 - RSD 1,008,850
RSD 1,008,850 - RSD 4,012,474
> RSD 4,012,474
Total Value of Operating Assets
RSD 0 - RSD 504,425
RSD 504,425 - RSD 2,006,237
> RSD 2,006,237
In order to attain a representative sample, the number of medium and large companies was increased, while the number of small companies was reduced.
Table 3.3. Distribution by size of business entities, 2012 Size of the companies Population Target
N % Small 25,047 94.0 87.0 Medium 1,203 4.5 10 Large 394 1.5 3 Total 26,644 100% 100% Business Performance: The data regarding business performance was provided by CEVES, which defined successful companies as those that met all of the following criteria in the 2005-2012 period:
1) It has cumulatively positive Earnings before interest, taxes, amortization and Depreciation (EBITDA) in both the post-crisis period, 2009-2013; and the last two years, 2012 and 2013.
2) It has maintained or increased the level of deflated operating revenues in the same post-crisis period.
3) It has maintained or increased its total level of formal employment in the same post-crisis period.
The number of successful companies is increased in order to have the same number of successful and unsuccessful companies in the sample.
13
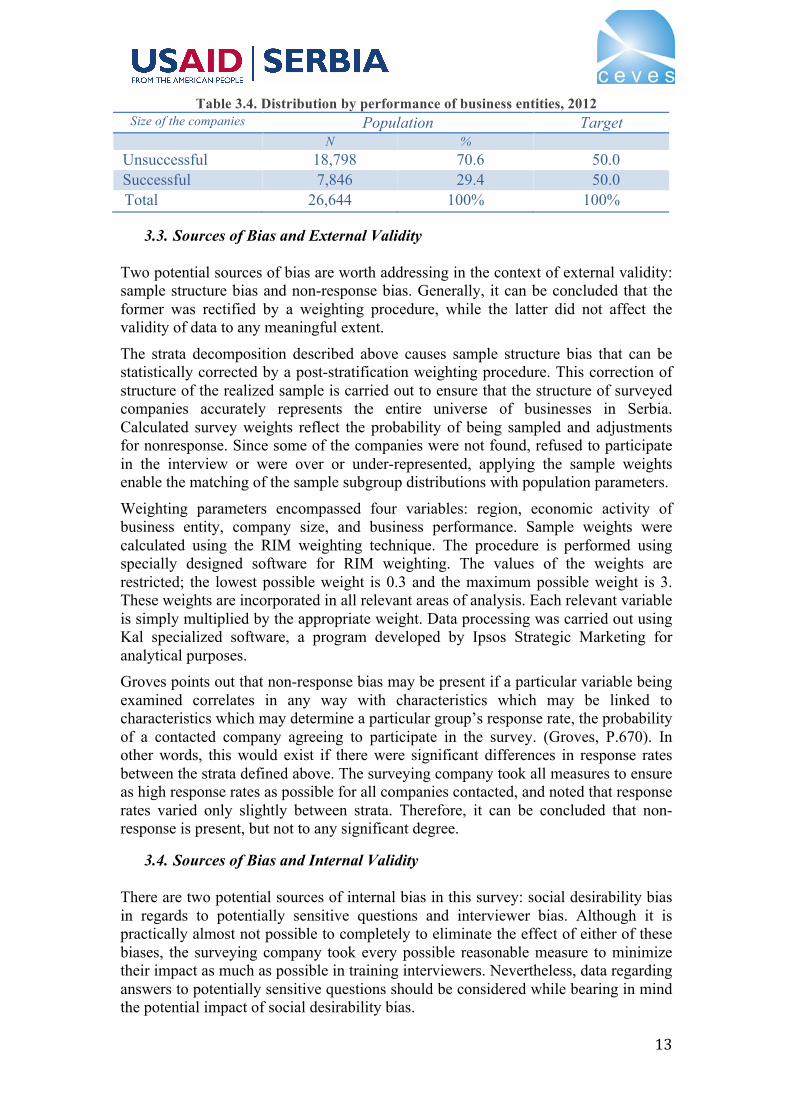
Table 3.4. Distribution by performance of business entities, 2012 Size of the companies Population Target
N % Unsuccessful 18,798 70.6 50.0 Successful 7,846 29.4 50.0 Total 26,644 100% 100%
3.3. Sources of Bias and External Validity Two potential sources of bias are worth addressing in the context of external validity: sample structure bias and non-response bias. Generally, it can be concluded that the former was rectified by a weighting procedure, while the latter did not affect the validity of data to any meaningful extent.
The strata decomposition described above causes sample structure bias that can be statistically corrected by a post-stratification weighting procedure. This correction of structure of the realized sample is carried out to ensure that the structure of surveyed companies accurately represents the entire universe of businesses in Serbia. Calculated survey weights reflect the probability of being sampled and adjustments for nonresponse. Since some of the companies were not found, refused to participate in the interview or were over or under-represented, applying the sample weights enable the matching of the sample subgroup distributions with population parameters.
Weighting parameters encompassed four variables: region, economic activity of business entity, company size, and business performance. Sample weights were calculated using the RIM weighting technique. The procedure is performed using specially designed software for RIM weighting. The values of the weights are restricted; the lowest possible weight is 0.3 and the maximum possible weight is 3. These weights are incorporated in all relevant areas of analysis. Each relevant variable is simply multiplied by the appropriate weight. Data processing was carried out using Kal specialized software, a program developed by Ipsos Strategic Marketing for analytical purposes. Groves points out that non-response bias may be present if a particular variable being examined correlates in any way with characteristics which may be linked to characteristics which may determine a particular group’s response rate, the probability of a contacted company agreeing to participate in the survey. (Groves, P.670). In other words, this would exist if there were significant differences in response rates between the strata defined above. The surveying company took all measures to ensure as high response rates as possible for all companies contacted, and noted that response rates varied only slightly between strata. Therefore, it can be concluded that non-response is present, but not to any significant degree.
3.4. Sources of Bias and Internal Validity
There are two potential sources of internal bias in this survey: social desirability bias in regards to potentially sensitive questions and interviewer bias. Although it is practically almost not possible to completely to eliminate the effect of either of these biases, the surveying company took every possible reasonable measure to minimize their impact as much as possible in training interviewers. Nevertheless, data regarding answers to potentially sensitive questions should be considered while bearing in mind the potential impact of social desirability bias.

14
Bimer and Lyberg define social desirability bias as the “tendency in face-to-face surveys for the respondents to be more concerned about how they are viewed by the interviewee than in providing accurate answers.” This is most likely to occur in the context of sensitive questions (Biemer and Lyberg, P.190) The survey did contain questions that could be perceived as sensitive and to which respondents may not give entirely truthful responses in order to maintain a degree of social desirability in the view of the surveyor. These included questions regarding the informal employment of workers and instances when the company’s bank account may have been frozen, among others.
Present in all F2F interviewing is the possibility of interviewer bias. In describing interviewer bias, Bimer and Lyberg note that, “Each interviewer has his or her own set of behaviors, work procedures, question-delivery and question-wording techniques…because of these differing interviewing styles, the inter-viewers as a collective contribute correlated interviewer error to the total survey error.” (Biemer and Lyberg, P.190). The optimal method for minimizing this form of bias is to train interviewers to conduct the interview as uniformly as possible (ibid). Given that the survey executing company trained all interviewers, it can be concluded that both interviewer bias and social desirability bias were reduced to the greatest extent possible (B92).
4. RESPONDENT PROFILES
The following section provides an overview of the entire sample population. It will provide broad, basic information about the companies surveyed as well as their individual representatives interviewed.
4.1. Company Profiles
Enterprises were broadly grouped into five types of sectors: agriculture, food processing, light industry, heavy industry, and intellectual services. In terms of the sectors of the companies, those classified as being in heavy industry were the most prevalent followed in decreasing order by intellectual services, light industry, manufacturing, and agriculture.

15
9.2% 11.2%
17.8%
28.7%
33.0% Agriculture
Food Processing
Light industry
Heavy industry
Intellectual services
Graph 4.1. Companies Surveyed, by Industry
Companies were also asked to provide a more specific breakdown classification of their business activity. The top ten most commonly identified industries are listed in the following table:
Table 4.1. The top ten most commonly identified industries
In terms of regional distribution, the surveyed companies were located in – in decreasing order – the Belgrade region, Vojvodina, Šumadija and Western Serbia, and Southern and Eastern Serbia.
Field Number of Companies
Percent of Total
Accounting, bookkeeping, and auditing 93 8.7% Business Consulting Services 84 7.9% Growing of Wheat (aside from Rice), Legumes, and Oilseeds
40 3.8%
Engineering Fields and Technical Consulting 38 3.5% Manufacture of Bread, Baked Goods, and Cakes 34 3.2% Other Printing 33 3.1% Computer Programming 29 2.7% Technical Testing and Analysis 22 2.1% Manufacture of Other Clothes 19 1.8% Veterinary 18 1.7%

16
Graph 4.2. Regions of surveyed companies
In terms of company size, it is not surprising that the majority of companies surveyed were either small enterprises or entrepreneurs, given that relatively smaller businesses make up the majority of Serbian companies. In fact, it is worth bearing in mind that the sample purposefully included more large companies than the average proportion in Serbia in order to have a sample representative of these firms as well.
Graph 4.3. Companies surveyed by size
In terms of number of employees, the average respondent company indicated that it employed 15.2 workers either on a formal or an informal basis at the time it was surveyed. Table 4.2 provides an overview of company employment figures.
27.2%
23.9% 13.9%
35.0% Vojvodina (289)
Šumadija and Western Serbia (254)
Southern and Eastern Serbia (148)
Belgrade (372)
94.6%
4.1% 1.3%
Small Enterprises and Entrepreneurs
Medium-‐sized Enterprises
Large Enterprises

17
Table 4.2. Company size figures Mode 3 Minimum 1 25th Percentile 3 Median 5 Mean 15.2 75th Percentile 10 90th Percentile 29.1 Maximum 1000
When examining the overall performance of companies, it is important to note that just under half of the companies surveyed are what CEVES defines as successful. The following graph provides a breakdown of surveyed companies that are and are not considered successful:
Graph 4.4. Breakdown of successful / not successful companies
The average annual income in 2012 of all companies surveyed was RSD 84,263.
70.3%
29.7%
Not Successful
Successful

18
4.2. Survey Respondent Profiles
Given the wide-ranging, in-depth nature of the questions, it was most appropriate to interview respondents from high-level company management.
Graph 4.5. Position of respondents
68.7% of the respondents interviewed were male, while 31.3% were female. The average age of respondents was 48.8 years, and the average educational level attained of respondents was some form of tertiary education. Slightly fewer than 62% of respondents cited that they completed either a four-year faculty or two-year college as their highest level of education.
5. OWNERSHIP STRUCTURE
5.1. Motivation Ownership structure is one of the key factors of company’s performance. Although ownership structure itself cannot be used as a direct indicator of company profitability, productivity, growth or access to finance, various characteristics of ownership structure may be revealed to be determinants of the value of these performance indicators. Ownership structure is defined by the distribution of equity with regard to votes and capital and the identity of the equity owners. These structures are of major importance in corporate governance because they determine the incentives of managers and, thereby, the economic efficiency of the corporations they manage (Jensen and Meckling, 1976). The relationship between ownership structure and performance has been the subject of important debates in the corporate finance literature. One theory suggests that an inverse relationship should exist between the diffuseness of ownership and performance, i.e., ownership concentration should have a positive effect on firm value and performance. However, other theories offer an alternative view, positing that ownership structures ought to be influenced by the profit-maximizing interests of shareholders. As a consequence, there should be no systematic association between
49.1%
30.9%
5.3% 1.0% 10.8% 2.9%
Owner
Chief Executive Ofkicer (CEO)
Chief Financial Ofkicer (CFO)
Director of Managing Board (Board of Directors)
Assistant Director

19
76%
17% 3% 4%
One Owner
Two Owners
Three Owners
Four and More Owners
ownership structure and performance. Yet, empirical studies have found conflicting results (H. Demsetz, B. Villalongar, Journal of Corporate Finance 7, 2001, 209–233). Also, in transition economies, such as Serbia, the presence of foreign owner(s) may improve management skills, know-how and technology (Maria Maher and Hans Christiansen, P. 15). Other characteristics of ownership structure such as the relationship between owners, the participation of a state in the ownership structure, and motivation for business start-up also affect firm performance. For the purpose of this report, main characteristics of ownership structure of Serbian firms will be presented, while the relationship between structure and performance will not be studied in greater depth. However, CEVES, in its further activities will conduct empirical research in order to determine which characteristics of ownership structure have the strongest impact on business result in Serbia’s economy.
5.2. Key Findings Ownership structure in Serbia’s economy is very concentrated. Three fourths of firms have only one owner, while the most common ownership structure at firms with several owners features one owner holding the largest single share of the company, which itself is usually 50% of the total value or greater. Domestic owners are dominant in the ownership structures of surveyed firms. The presence of foreign persons, foreign legal entities and state in ownership structures is rare, but tends to be higher when a company has several owners. 90% of companies are family-owned. In most companies the founders of the company are still the only owners. Three fourths of surveyed companies have one owner, while the remaining 25% of companies have multiple owners. It is interesting to note that exactly half of joint stock companies have only one owner. This is somewhat of a paradox because the main advantages of joint stock companies, such as fund raising and capital injections are derived from the number of persons contributing to capital.
Graph 5.1. Number of owners
Domestic owners are dominant in the ownership structures of surveyed firms. Nine out of every ten companies (91%) have domestic private individuals as the sole owner

20
or one of the owners. In addition, 7% of companies stated that domestic, private legal entities are present in the ownership structure.
Graph 5.2. Ownership structure by legal status of owner
The presence of foreign persons, foreign legal entities and the state in ownership structures is rare, but tends to be higher when a company has several owners. Foreign citizens own only 1% of companies that have only one owner. However, 6.5% of companies with multiple owners have at least one foreign person in their ownership structure. Similar trends are also observed regarding the presence of foreign and domestic legal entities and the state, while the presence of domestic private individuals is very constant regardless of whether the company has one or more owners. When focusing on companies with several owners, we observe that ownership is still moderately concentrated, as is shown in graph 5.3:
0% 20% 40% 60% 80% 100%
Foreign citizens
State (any form)
Foreign legal entities
Domestic private legal entities
Domestic citizens
1.0%
1.2%
1.7%
4.7%
91.5%
6.4%
3.9%
4.7%
11.6%
91.3%
% of Companies
Legal status of owner
Companies with Several Owners Companies with One Owner

21
0.0 5.0 10.0 15.0 20.0 25.0 30.0 35.0 40.0 45.0 50.0
10 20 30 40 50 60 70 80 90 100
% of Com
panies
Ownership Share of the Largest Owner
Graph 5.3. Ownership share of the largest owner in companies with multiple owners
The most common ownership structure features an owner holding the largest single share of the company which is usually 50% of the total value or greater, while the average ownership stake of the owner with largest share is 53%. In 82% of companies, the owner with the largest ownership share has a stake of 50% or more of the company’s ownership structure. It is interesting to notice that, when there are foreign owners in a company, they almost always control the lions’ share of the enterprise. The majority of companies that have several owners are family-owned. Family-owned enterprises are companies in which members of one family between them hold more than 50% ownership. In addition, all companies with only one owner are also considered family-owned. Hence, family-owned firms account for nearly 90% of the total number of companies. In most companies (83%), the founders of the company remain the only owners. In 13% of companies, the founders are no longer owners. The ownership structure of the remaining 4% of companies comprises both the founders and new owners. The majority of new owners (43%) bought a share of enterprise; 37% of new owners inherited a share in enterprise through family or friendly; 19% of new owners were also previously employed in the enterprises of which they now have ownership stakes.

22
Graph 5.4. Presence of founders in ownership structure
6. MANAGEMENT
6.1. Motivation This section analyzes who and how decisions are made relating to hiring, training, key decision-making, and financial planning in order to later determine to what degree these crucial aspects of company operations determine company success. These are perhaps some of the most important characteristics of businesses and factors that may best determine company performance. This will be explored in greater detail in the final report. Higher education and training are important for countries that want to advance along the value chain. Indeed, the global economy requires countries to possess skilled workers ready to adapt to the always-changing needs of global production (WEF, P.7). This section therefore begins by analyzing the educational level of employees it Serbia. It next examines the emphasis placed on relevant industry experience as a criterion for hiring workers and, relatedly, how often companies train their employees. Having access to human resources with appropriate skills is obviously important for company success, but – in an economy characterized by high youth unemployment - it is also important to see to what extent companies are employing workers without previous experience. It next looks at where decision-making authority rests regarding taking on new debt and embarking on new investments in new technologies, processes, products, and services. This can be important in helping to determine whom to target potential management development education, a potential key to unlocking growth in SMEs, an integral part of the Serbian economy (Papulova & Mokros, P.4). This section examines how companies manage their finances by analyzing who is responsible for financial management, how often companies carry out basic financial projections, and how long it takes businesses to receive and disburse payment for goods and services purchased. Adequate financial management and planning are natural cornerstones of long-term business growth. Conversely, poor financial management is often cited as one of the main hindrances to SME growth (Jindrichovska, P.79) and can become
83.1%
3.8% 13.1%
Founders are still the only owners
Founders are still the owners, but there are also other owners

23
especially problematic as an SME begins to achieve considerable growth (McMahon, P.10). It is also important to analyze liquidity in the context of SMEs, as liquidity constraints can be a particularly strong inhibitor of SME growth (Olivera & Fortunato, 142). Lastly, this section looks at how often Serbian companies are subject to state inspections.
6.2. Key Findings In an economic environment characterized by low growth and high unemployment, it is not surprising that companies are generally reluctant to hire workers without experience. 85% of companies did not hire workers without previous relevant industry experience in 2013 and, when they did, they usually hired 3 or fewer such workers. Less than half of all companies considered training to be necessary and only 30% organized some form of it over the course of 2013. Company decision-making regarding important decisions such as investments in new products and processes and undertaking additional debt usually rests solely with the owner. Business owners in Serbia are also usually the ones who take responsibility for managing finances. However, there is evidence to suggest that finances are not managed frequently enough; around one third of companies surveyed noted that they did not prepare cash flow analyses on at least a quarterly basis. It also appears that a considerable proportion of businesses have difficulty receiving and disbursing payment for goods and services rendered. One fifth of companies noted that they needed to wait an average of 90 days before receiving payment, while one in ten companies stated needing at least 60 days on average to disburse funds for purchases. Finally, companies in the agriculture and food processing sectors are more likely to be visited by state inspections than are those in intellectual services, heavy industry, or light industry.
6.3. Training and Education On average, employees with at least a graduate-level education accounted for one third of all company employees. However, this fraction falls to just under one quarter when looking at the total number of workers with graduate-level education levels or higher as a gross percentage of the total number of employees of all companies surveyed. In other words, larger companies employ lower percentages of workers with at least a graduate level of education. With unemployment particularly pronounced among Serbia’s inexperienced youth, it is interesting to examine to what degree companies employ workers without previous experience. Broadly, surveyed companies hired very few workers without work experience in 2013. 85% of companies indicated that they did not hire any at all, while 15% noted that they had. In this latter group, almost half indicated employing just one new employee, and more than three quarters employed three or fewer workers without previous experience in 2013.

24
Graph 6.1. Number of new employees hired in 2013 without previous experience
Note: n = 158 Companies may be reluctant to hired inexperienced staff, but are they ready to train their employees in order to make up for skills gaps? Most companies (60.5%) believed that their employees did not need training in 2013. Of those that did, most were able to afford the training and to divide it fairly evenly between low and high-level staff.
Graph 6.2. Company training in 2013
49.1%
22.8%
7.8%
20.3%
1 New Employee
2 New Employees
3 New Employees
4 or More Employees
5.8%
8.3%
15.7%
9.7%
60.5% 70.2%
Yes; training primarily oriented towards management & high-‐position staff
Yes; training primarily oriented to lower-‐position staff
Yes; training was oriented towards all staff
No; company not in kinancial situation to organize training, but we considered it necessary
No; did not consider the training necessary

25
6.4. Management Decision-Making Many businesses in Serbia are to some degree family owned or directed. Indeed, nearly 45% of surveyed businesses noted that at least one family member of the owner is in the formal management of the company. In two thirds of cases regarding additional debt or investments in new technologies, capacities, products, or services, only the owner makes the decisions. Only in one third of instances do other members of company management have any role in making such decisions, and in most of these cases the ultimate authority remains with the owner.
Graph 6.3. Decision-making authority regarding new products, services or capacities
Note: Sample only includes companies that indicating making investments in production or development of new products/services.
Graph 6.4. Decision-making authority regarding additional debt
Note: Sample only includes companies that undertake debt.
66.0%
26.4%
6.3% 1.3% The owner only
The owner after consulting the enterprise management and the kinancial manager
The enterprise management and the kinancial manager after consulting the owner
The enterprise management and the kinancial manager
68.6%
24.6%
5.1% 1.7% The owner only
The owner after consulting the enterprise management and the kinancial manager
The enterprise management and the kinancial manager after consulting the owner
The enterprise management and the kinancial manager

26
6.5. Financial Management Financial management is a necessary activity in the everyday functioning and management of companies. Our survey first asks whether Serbian companies carry out rudimentary financial planning by preparing cash flow statements at least once in every three months. Slightly over two-thirds of companies indicated having done so, while just under one third did not. Graph 6.5 shows that, in most instances, it was the owner himself/herself who carried out such financial analyses. Other company leadership and accounting departments undertook this responsibility less often. Unsurprisingly, the proportion of companies that had the financial director and/or accounting carry out this kind of activity increased as the size of the company increased.
Graph 6.5. Financial analyses in enterprise
6.6. Liquidity Constraints Liquidity has been known to be a persistent problem for Serbian companies. In fact, the current Minister of the Economy, Zeljko Sertic, noted as recently as in August, 2014 that one in every five companies and one in every ten entrepreneurs are faced with liquidity problems (B92). In practice, this can be reflected in not only the time it takes for a company to gain receivables from customers and clients, but also in the time it can take to transmit payables to stakeholders it owes funds to. The median amount of time it takes for a company to receive payment for goods and/or services it has provided is 35 days. However, it can be seen from graph 6.6 below that almost one fifth of companies have to wait on average at least 90 days before receiving payment for their goods or services.
60.7% 19.5%
19.8% Enterprise Owner
Financial Director
Accountant / Accounting Department

27
0 10 20 30 40 50 60 70 80 90 100
0 3 7 14 21 30 40 55 66 80 98 120 160 210 365 2000
Total Percentage of Com
panies
Average Number of Days to Receive Payment
0
10
20
30
40
50
60
70
80
90
100
Total Percentage of Com
panies
Average Number of Days to Disburse Payment
Graph 6.6. Average number of days to receive payment from buyers
It is also helpful to look at how long it takes companies to disburse funds for their payables. 75.4% percent of businesses claim that they make payments for goods and services within 30 days of their purchase, while only 10% state they need at least 60 days on average to transmit payment. The possibility of social desirability bias affecting responses should be taken into account when considering this data.
Graph 6.7. Average number of days to disburse payment for goods and services
28
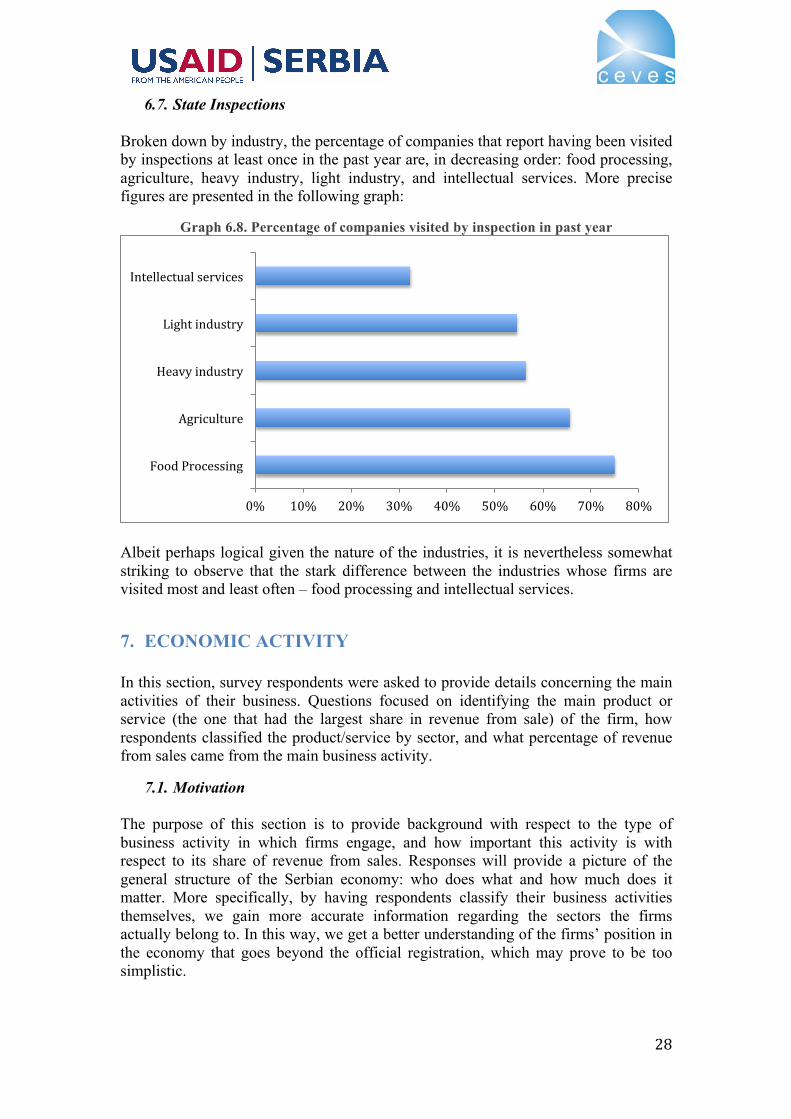
6.7. State Inspections Broken down by industry, the percentage of companies that report having been visited by inspections at least once in the past year are, in decreasing order: food processing, agriculture, heavy industry, light industry, and intellectual services. More precise figures are presented in the following graph:
Graph 6.8. Percentage of companies visited by inspection in past year
Albeit perhaps logical given the nature of the industries, it is nevertheless somewhat striking to observe that the stark difference between the industries whose firms are visited most and least often – food processing and intellectual services.
7. ECONOMIC ACTIVITY In this section, survey respondents were asked to provide details concerning the main activities of their business. Questions focused on identifying the main product or service (the one that had the largest share in revenue from sale) of the firm, how respondents classified the product/service by sector, and what percentage of revenue from sales came from the main business activity.
7.1. Motivation The purpose of this section is to provide background with respect to the type of business activity in which firms engage, and how important this activity is with respect to its share of revenue from sales. Responses will provide a picture of the general structure of the Serbian economy: who does what and how much does it matter. More specifically, by having respondents classify their business activities themselves, we gain more accurate information regarding the sectors the firms actually belong to. In this way, we get a better understanding of the firms’ position in the economy that goes beyond the official registration, which may prove to be too simplistic.
0% 10% 20% 30% 40% 50% 60% 70% 80%
Food Processing
Agriculture
Heavy industry
Light industry
Intellectual services

29
12.71%
78.63%
8.57%
Discrepancy No discrepancy No discrepancy, but not exactly the same activity
Identifying these basic characteristics is necessary for decision makers to formulate effective policies and strategies. We must know the type of activity the majority of firms engage in and how much they rely on this activity to provide adequate recommendations.
7.2. Main Findings We were interested in uncovering whether there was a discrepancy in the way businesses classified their own activities and the sector within which they were officially registered. Interestingly enough, there was a decent amount of discrepancy: 78.63% overlapped (no discrepancy), while 12.71% did not. In addition, 8.5% overlapped to a certain degree, but the activities were not exactly the same. With respect to the respondents’ classification of their activities, the majority of firms classified themselves as production oriented (42.7%) and service oriented (41.8%). The majority of large firms (69.2%) are production-oriented, while the percentage of small firms that are production and service oriented is about equal: 41.7% and 43.3%, respectively. In order to gage the important of the firms’ main activity, we were interested in uncovering the activities’ share in revenue from sales. For the vast majority of firms (64.6%), the activity constituted a share between 91 and 100 percent.
7.3. Product/Service Classification Interestingly enough, there was quite a bit of discrepancy between the respondents’ classification of their business activities and the sectors within which they were officially registered. Of the total number of responses, 78.63% overlapped (no discrepancy), while 12.71% did not. In addition, 8.5% overlapped to a certain degree, but the activities were not exactly the same.
Graph 7.1. Sector overlap: registered versus response
Firms were asked to classify their main product or service into the sector that most appropriately classifies the activity. In doing so, we obtained a more nuanced understanding of the firms’ activities that is not captured in the official sector classification within which the enterprises are registered.

30
The majority of firms classified their firms as production oriented and service oriented, with a fairly even split at 42.7% and 41.8%, respectively. Of the total number of respondents, 8.8% engaged in trade, 4.6% belong to the agricultural sector and 1.2% engage in construction. The 10% involved in trade and construction is particularly interesting considering these categories were not included in the official classification of firms into sectors.
Graph 7.2. Sector in which the main product/service can be classified
Categorizing the responses according to the size of the firm yielded unsurprising results. Regardless of size, the majority of firms are production oriented. In addition, the majority of large firms are production-oriented, while small firms engage in production and rendering of services equally.
Graph 7.3. Sector in which the main product/service can be classified
42.7%
41.8%
8.8%
4.6%
1.2%
0% 5% 10% 15% 20% 25% 30% 35% 40% 45%
The enterprise is production-‐oriented
The enterprise renders services
The enterprise is engaged in trade
The enterprise belongs to agricultural sector
The enterprise is engaged in construction
Percentage
Sector
0% 10% 20% 30% 40% 50% 60% 70% 80%
The enterprise is production-‐oriented
The enterprise renders services
The enterprise is engaged in trade
The enterprise belongs to agricultural sector
The enterprise is engaged in construction
Small enterprises and entrepreneurs Medium enterprises Large enterprises

31
7.4. Product/Service Importance In order to understand the importance of the firm’s main activities, we were interested in the share of revenue from sales that that activity has for the firm. Responses revealed that firms’ activities were quite concentrated in terms of the value they contribute to revenue from sales. The vast majority of respondents (64.6%) stated that the activity’s share of revenue from sales was between 91 and 100 percent. Of the remainder, 13.4% cited a share between 76 and 90 percent, followed by 12.7% that cited a share between 51 and 75 percent.
Graph 7.4. Percent of revenue from sales from operating activities
In order to get a better understanding of the distribution of firms, we were interested in categorizing the responses according to firm size. It is not surprising that a significant number of all three types of firms fell within the highest interval. However, medium-sized enterprises varied more in their responses.
Graph 7.5. Percent of revenue from sales from operating activities
2.3 5.7
12.7
13.4
Up to 25% 26 -‐ 50% 51 -‐ 75% 76 -‐ 90% 91 -‐ 100%
0%
10%
20%
30%
40%
50%
60%
70%
80%
Up to 25% 26 -‐ 50% 51 -‐ 75% 76 -‐ 90% 91 -‐ 100%
Small enterprises l entrepreneurs Medium enterprises Large enterprises

32
The top 4 secondary activities that were most frequently cited as generating the remainder of revenue from sales were, in descending order: (1) wholesale retail and trade; repair of motor vehicles and motorcycles, (2) other service activities, (3) repair and installation of machinery and equipment, and (4) agriculture, forestry, and mining.
8. COMPETITION
8.1. Motivation This section of the survey sought to uncover how companies differentiate and view not only themselves, but also the products and services they produce and render from those of the competition. It then aims to uncover some of mechanisms underlying potential competitive advantage such as marketing, possession of internationally recognized certification, and membership in associations. Product and service differentiation are important elements of competitiveness and can, by extension, help solidify or enhance a given company’s position on the market vis-à-vis its competition. Differentiation can also be beneficial for clients and consumers, unless the new product or service in some way promotes oligopolistic or monopolistic practices (FTC). Marketing can, in many cases, serve as one method to promote product differentiation and, by extension, provide a competitive edge (Brander and Spencer, P.3). Similarly, possessing internationally recognized certification such as ISO can also signal quality to potential customers and help enterprises become part of global supply chains (Urbanovicius). Another method of potentially gaining an advantage is by joining a business association. Business associations can offer their members a number of services to assist operations such as, but not limited to: business registration, export assistance, help with financial and tax literacy, increased bargaining power, and access to knowledge. On a wider theoretical level, business associations promote the diffusion of technology and serve as a better link between the public and private sectors, enabling policymakers to better target policy (Hall and Soskice, 26).
8.2. Main Findings The vast majority of companies surveyed (94%) believe they operate in industries with relatively strong degrees of competition, while only a few note that their sectors are characterized by oligopolistic or monopolistic business practices. Many believe that the competition in their fields is healthy, but a significant percentage of those surveyed believe their competitors engage in illegitimate/illegal activity (42% vs. 28%). This latter trend is most pronounced in light industry, the only sector where a greater number of respondents believed that their competition was unfair than fair. Generally, Serbian businesses spend little on marketing, do not hold internationally recognized certificates, and are not members of business associations. Survey respondents indicated that they spend relatively little on marketing activities. Indeed, 35% of firms noted that they do not invest any operating revenue in marketing activities, while an additional 57% noted that they spend less than 10% of operating revenues on marketing. Furthermore, just under one-third of companies hold

33
internationally recognized certificates; the largest portion of these is some variety of ISO certification. Finally, only one quarter of companies surveyed reported belonging to some kind of business association. Most of those that did belong to such groups did so on the basis of their field.
8.3. Competition in the Marketplace
Graph 8.1. How companies evaluate their competition
94% of firms surveyed believe they operate in industries with strong degrees of competition. The greatest proportion of companies (41.9%) indicated that the competition on the domestic market is strong, but healthy and not characterized by illegitimate or illegal activity. Conversely, 28% of enterprises noted that their competition was healthy, but subject to illegitimate or illegal activity.
4.2% 24.3%
41.9%
28.0%
1.2% 0.5%
We do not have any competition; no other enterprises in domestic market produce products / render similar services (44)
We have competitors, but our product/service is highly differentiated in the eyes of our buyers (258)
We have a lot of competitors; the competition is very strong, but healthy (444)
We have a lot of competitors, but the competition is unfair, some enterprises are privileged or engage in illegitimate/illegal activities (297)
One or several enterprises control this industry; there is a monopoly / oligopoly (13)
We do not operate on the domestic market (5)

34
Table 8.1. Competition in industry % of Industry No competition; no
other enterprises in domestic
market produce products / render similar services
Have competitors,
product/service is highly
differentiated in eyes of buyers
Have a lot of competitors; competition strong, but
healthy
Have a lot of competitors, but
competition unfair, some
enterprises are privileged or
engage in illegitimate/illeg
al activities
There is a monopoly /
oligopoly in our industry
Agriculture 4.10% 19.4% 44.9% 29.6% 2.0% Food processing 0.80% 29.4% 44.5% 22.7% 2.5% Light industry 3.20% 27.7% 31.9% 34.6% 2.1% Heavy manufacturing
5.60% 26.1% 40.5% 26.8% 0.3%
Intellectual services 4.60% 20.6% 46.6% 26.9% 0.9% Overall 4.10% 24.3% 41.8% 28.0% 1.2%
Table 8.1 highlights that companies in most sectors surveyed generally feel that their industries are characterized by strong competition, but only in light industry did more did firms feel that their competition was unfair than fair (34.6% vs. 31.9%). Very few companies across all industries believed that their sectors were characterized by monopoly or oligopoly.
Graph 8.2. Product differentiation of surveyed companies
Note: Respondents were allowed to select two of the presented options as well as to write in their own response under an “other” option.
47.8%
61.5%
5.7%
7.4% 9.5%
11.3% 1.0%
More affordable price of products /services (496)
Higher quality of products / services (637)
Recognizable advertisement, design and packaging (59)
Channels of distribution and availability of the products /services (77)
Post-‐sale support services (usage assistance, contacts with buyers (99)
Offer doesn’t differ signikicantly from competition; main characteristics are very similar (118) Other (11)

35
Taking a closer look at what it is that differentiates Serbian tradables, results show that well over half of companies surveyed believe that the higher quality of products and services sets them apart from others. Slightly under half of companies point to the relative affordability of their products/services as a competitive advantage.
8.4. Marketing Expenditures A noticeably small fraction of companies (5.7%) noted that recognizable advertisement, design, and packaging do not contribute to product differentiation that may give them a competitive edge. The next graph, which examines expenditures on marketing, may provide an explanation why:
Graph 8.3. Percentage of sales revenue spent on marketing
Note: Excludes companies refusing to answer and companies that indicated spending 100% of revenues on advertising and marketing. The evidence from the survey very clearly indicates that Serbian companies spend relatively little on marketing activities such as advertising, promotion, and branding. 91.6% of enterprises of surveyed indicate spending less than 10% of their sales revenue on these kinds of activities.
8.5. Internationally Recognized Certification Another method of differentiating one’s offer from that of the competition is to hold certification from a reputable accreditation body. The ISO certificate, for example, can bolster competitiveness by showing companies how to improve managerial functions and boost efficiency. It can also serve to highlight a holder company as a suitable potential partner of customers and supply chain collaborators. Looking abroad, possessing an ISO certificate can help companies integrate into global supply chains (Urbonavicius). However, only a relatively low percentage of companies surveyed – just over 30% - possesses an internationally recognized certification of quality for its products, services, production processes, or service processes.
34.5%
57.1%
6.0% 1.2%
0.3% 1.1%
0% (359)
Between 0% and 10% (594) Between 11% and 25% (62) Between 26% and 50% (12)

36
Graph 8.4. Percentage of firms with internationally-recognized certificate
In terms of the type of certification possessed, Serbian companies indicated that the most held certificates were some form of an ISO certificate. Indeed, 44.3% of companies with certificates noted that they held some form of ISO certification.
Graph 8.5. Certificates owned by the companies
8.6. Membership in Business Associations In the context of competition, it may be valuable to evaluate whether Serbian companies join associations and, if so, which ones. Most companies surveyed are not part of any business associations, as is shown in graph 8.6.
Graph 8.6. Association membership of surveyed companies
31.2%
68.8%
Has certikicate (325)
Does not have certikicate (717)
0 20 40 60 80 100 120 140 160
Any ISO certikicate
ISO 14001
ISO 9001-‐2008
ISO Standard (unspecikied)
HACCP
ISO Standard 9001
144
11
16
31
60
73
23.5%
76.5%
In association (241)
Not in association (783)

37
The majority of companies that were in associations were so on the basis of their industry, while around a quarter were members of associations based on some form of geographical or territorial belonging.
Graph 8.7. Type of association membership
Given the high number of companies not in associations, it would be prudent to more closely examine why businesses do not participate in these groups which can offer a number of benefits for their members. A cursory analysis of evidence seems to suggest that associations could do more to raise awareness of companies’ eligibility and of the potential advantages of membership. Just over half of those not in associations note that they simply are not interested in joining and kind of association. Just under half of companies point out that they have not heard of any relevant associations or are under the impression that there are no associations for them to join. However, given the extensive network of regional chambers of commerce in Serbia, it seems unlikely that there are no associations to join for just under 49% (381) of companies surveyed.
Graph 8.8. Reason for not joining associations
63.1% 24.1%
9.1% 3.7%
On branch/guild level (152)
On territorial/geographical level (58)
With suppliers and/or distributors (22)
Other (9)
50.8%
0.5%
15.6%
33.1%
Not interested (398)
Do not meet criteria (4)
Have not heard of any relevant associations (122)

38
9. SUPPLIERS
9.1. Motivation It is necessary to take a closer examination of suppliers in order to gain a holistic picture of where and how Serbian companies source their materials. Taking a more in-depth look at input costs, this section first examines from whom and from where Serbian manufacturers source their raw materials. It subsequently analyzes what percentage of all companies’ service or manufacturing input is outsourced. Analyzing suppliers and inputs may be useful for two reasons: First, identifying at what points in the supply chain Serbian companies encounter the greatest obstacles in securing appropriate materials at competitive prices may help to reduce costs which may ultimately be passed on to clients and customers both at home and abroad. Second, it may also reveal areas where domestic supply is not meeting domestic demand, enabling Serbian companies to move into niches currently occupied by foreign competitors. On the country-level, a potential expansion of the domestic supplier base may increase employment, improve the trade balance by substituting imports, and develop the industrial base for multiple industries. Meanwhile, on the firm-level, enhanced quality of the domestic supply base allows buyers to become more competitive and better compete in the global market (Krause & Ellram, P.22).
9.1. Key Findings A close look at manufacturing industries in Serbia reveals that most companies source the majority of their raw materials from other private companies in Serbia. Around 35% of all manufacturers import some of their raw materials from abroad. Companies in light or heavy industry are more likely to import than those in agriculture or food processing. Most importers of raw materials point to a lack of adequate or competitively-priced products as the most common reason for importing. A relatively small portion of Serbian companies noted supplying their own raw materials. Firms in intellectual services noted receiving the highest percentage of any their revenue from outsourcing, while surveyed businesses across all sectors noted that they spend relatively small proportions of overall expenses themselves on outsourcing to other companies.
9.2. Sources of Raw Materials The analysis first hones in on where Serbian manufacturers source their raw materials from: other private companies in Serbia, state-owned or public enterprises, imports from abroad, or materials produced by the company itself. It should be noted that only companies in the high-level, aggregate manufacturing sectors were surveyed in the questions relating to raw materials. The following pie chart takes shows the mean percentage sourced for each of the aforementioned categories for all businesses in the agriculture, food processing, light industry, and heavy industry sectors:
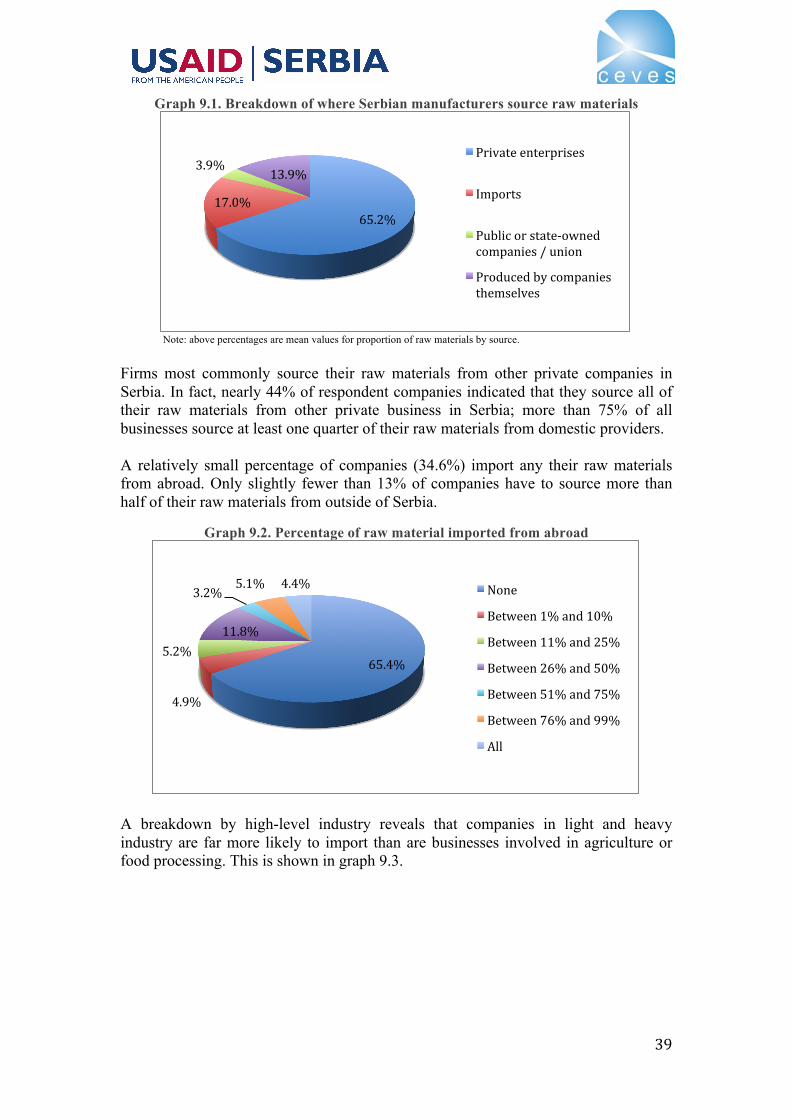
39
Graph 9.1. Breakdown of where Serbian manufacturers source raw materials
Note: above percentages are mean values for proportion of raw materials by source. Firms most commonly source their raw materials from other private companies in Serbia. In fact, nearly 44% of respondent companies indicated that they source all of their raw materials from other private business in Serbia; more than 75% of all businesses source at least one quarter of their raw materials from domestic providers. A relatively small percentage of companies (34.6%) import any their raw materials from abroad. Only slightly fewer than 13% of companies have to source more than half of their raw materials from outside of Serbia.
Graph 9.2. Percentage of raw material imported from abroad
A breakdown by high-level industry reveals that companies in light and heavy industry are far more likely to import than are businesses involved in agriculture or food processing. This is shown in graph 9.3.
65.2% 17.0%
3.9% 13.9%
Private enterprises
Imports
Public or state-‐owned companies / union
Produced by companies themselves
65.4%
4.9%
5.2% 11.8%
3.2% 5.1% 4.4% None
Between 1% and 10%
Between 11% and 25%
Between 26% and 50%
Between 51% and 75%
Between 76% and 99%
All

40
Graph 9.3. Which industries import their raw materials?
Note: Percentage of companies indicating importing at least 1% of raw materials It is interesting to examine why Serbian manufacturers have to look abroad in order to source their raw materials. The most common reason given was that imported raw materials simply do not exist in Serbia, while the second most common explanation given was that foreign suppliers are relatively more price competitive. In a subsequent study, it would be worth exploring which particular sectors are characterized by greater raw material imports in order to identify potential industries earlier along the value chain for whom there may have customers ready in waiting.
Graph 9.4. Why Serbian companies import raw materials from abroad
The survey also examined to what degree Serbian manufacturers source their raw materials from public or state-owned enterprises. A relatively small percentage – 14.8% - sources any of their raw materials from these suppliers at all.
0.0% 5.0% 10.0% 15.0% 20.0% 25.0% 30.0% 35.0% 40.0% 45.0%
Agriculture Food Processing
Light Industry Heavy Industry
15.3% 16.8%
40.0% 44.7%
37.5%
3.2%
32.4%
4.2% 7.6%
1.0%
There are no enterprises in Serbia supplying these raw materials (83)
There is no difference, as the conditions and quality of products are the same between domestic and foreign suppliers (7)
The quality-‐price ratio is better with foreign suppliers (71)
Better payment conditions (9)
Foreign suppliers are more trustworthy and/or professional (17)
Other
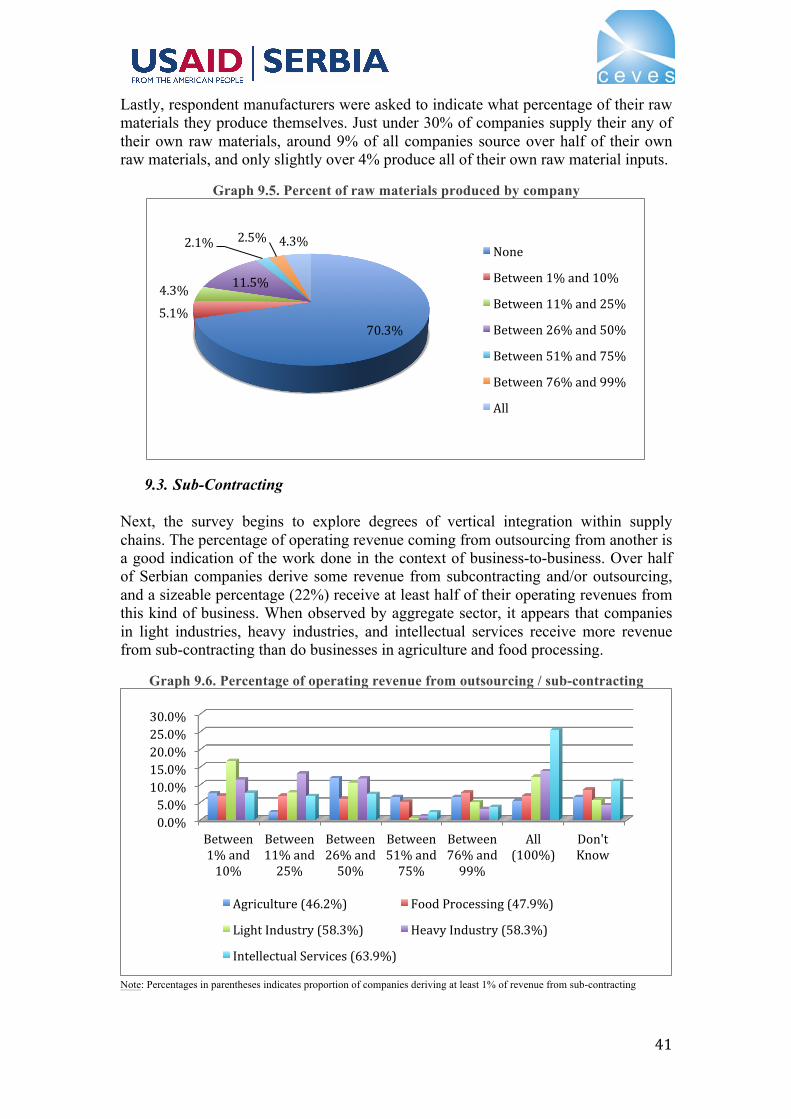
41
Lastly, respondent manufacturers were asked to indicate what percentage of their raw materials they produce themselves. Just under 30% of companies supply their any of their own raw materials, around 9% of all companies source over half of their own raw materials, and only slightly over 4% produce all of their own raw material inputs.
Graph 9.5. Percent of raw materials produced by company
9.3. Sub-Contracting Next, the survey begins to explore degrees of vertical integration within supply chains. The percentage of operating revenue coming from outsourcing from another is a good indication of the work done in the context of business-to-business. Over half of Serbian companies derive some revenue from subcontracting and/or outsourcing, and a sizeable percentage (22%) receive at least half of their operating revenues from this kind of business. When observed by aggregate sector, it appears that companies in light industries, heavy industries, and intellectual services receive more revenue from sub-contracting than do businesses in agriculture and food processing.
Graph 9.6. Percentage of operating revenue from outsourcing / sub-contracting
Note: Percentages in parentheses indicates proportion of companies deriving at least 1% of revenue from sub-contracting
70.3% 5.1%
4.3% 11.5%
2.1% 2.5% 4.3% None
Between 1% and 10%
Between 11% and 25%
Between 26% and 50%
Between 51% and 75%
Between 76% and 99%
All
0.0% 5.0% 10.0% 15.0% 20.0% 25.0% 30.0%
Between 1% and 10%
Between 11% and 25%
Between 26% and 50%
Between 51% and 75%
Between 76% and 99%
All (100%)
Don't Know
Agriculture (46.2%) Food Processing (47.9%)
Light Industry (58.3%) Heavy Industry (58.3%)
Intellectual Services (63.9%)

42
Finally, this section also looked at what portion of overall operating expenses companies had to spend on outsourcing their work to subcontractors.
Graph 9.7. Percentage of expenses spent on outsourcing / sub-contracting
Overall, significantly less than half of companies (42%) outsource some part of their work to subcontractors. When businesses do outsource, it accounts for a relatively small part of their overall expenses; costs related to outsourcing and sub-contracting account for more than half of all expenses for only around 1% of companies surveyed.
10. BUYERS AND MARKETS
10.1. Motivation Although one of the primary focuses of this analysis is to more thoroughly examine exports from Serbia, it is also important to know where and to whom Serbian companies sell their products and services at home. Analyzing where on the domestic market businesses generate their sales can provide information on the reach of company products and services. Complementing this, a survey of the profile of the final customers or consumers provides insight into just how thriving the business sector is in Serbia and how dependent the private sector is on the state. Finally, it is also useful to examine the proportion large customers account for in overall sales, as this helps to provide a picture of how dependent the fortunes of Serbian companies are on particular customers. Generally, it is preferable and more sustainable for a business to have as diverse a customer a base as possible.
10.2. Key Findings On the whole, Serbian companies appear to sell mainly within the same municipality in which they are located. Indeed, just about one fifth of all respondents noted that all of their sales revenue is generated in the municipality in which they are registered. However, approximately the same fraction of respondents noted that they realize none of their sales revenue in their home municipality. On average, Belgrade and parts of Serbia aside from Belgrade and the home municipality each account for about 24% of total sales revenue across all companies, while only 9% of total sales come from
57.6% 20.2%
8.8%
5.5% 0.7%
0.2%
7.0% None (0%)
Between 1% and 10%
Between 11% and 25%
Between 26% and 50%
Between 51% and 75%
Between 76% and 99%
Don't Know

43
exports. Around one quarter of all respondents indicated generating any sales from exports at all, a discouraging figure given that the sample only looked at companies in tradable sectors. Generally, Serbian companies do not overly rely on large customers to generate for their sales revenue.
10.3. Source of Sales Revenue by Geography Respondents were asked to cite the proportions of their sales revenue by geography and to specify by category: home municipality, Belgrade, remainder of Serbia (aside from Belgrade and home municipality), and exports. It is important to note that companies in Belgrade were asked to consider their municipality as the particular intra-city municipality.
Graph 10.1. Sources of sales revenue by location
The majority of Serbian companies’ sales are generated in their home municipalities. 19.5% of companies indicated that all of their sales revenues is generated in the same municipality as the one where they are based, while slightly less (18.7%) noted they realize none of their sales revenues in their municipality. Otherwise, there was a fairly even distribution among companies and the proportion of sales realized within and outside of home municipalities. The average percentage of sales realized in the same municipality across all companies was 44%.
43.8%
23.6%
23.9%
8.8%
Home municipality
Belgrade
Elsewhere in Serbia
Exports

44
Graph 10.2 Percentage of sales realized in home municipality
Note: For enterprises registered in Belgrade, the municipality was considered the intra-city municipality in which the company was registered.
40% of companies noted they do not sell at all in Belgrade, while around half of all respondents indicated that they realize 10% or less of their total revenue from sales in Belgrade. This is perhaps surprising given the overall weight of the Belgrade economy. The average sales percentage of all companies surveyed was 24%.
Graph 10.3. Percentage of sales realized in Belgrade
Note: For enterprises registered in Belgrade, sales in Belgrade were considered those realized in intra-city municipalities aside from the one in which the company is itself registered. The results for sales in other parts of Serbia are similar to those for sales in the capital city. 42% of companies did not sell at all to other parts of Serbia. The mean percentage of sales across all companies surveyed was 24%.
0
5
10
15
20
25
0 1-‐10 11-‐20 21-‐30 31-‐40 41-‐50 51-‐60 61-‐70 71-‐80 81-‐90 91-‐99 100
Percent of Total Respondents
% of Total Sales Realized in Home Municipality
0
5
10
15
20
25
30
35
40
0 1-‐10 11-‐20 21-‐30 31-‐40 41-‐50 51-‐60 61-‐70 71-‐80 81-‐90 91-‐99 100 Percent of Total Respondents
% of Total Sales Realized in Belgrade Region

45
Graph 10.4. Percentage of sales realized elsewhere in Serbia
Note: Elsewhere in Serbia refers to all municipalities other than those based in Belgrade and those in which the company is registered. Few companies in Serbia export and, when they do, only relatively small percentages of total sales are gained from exports abroad. Slightly over 75% of respondents noted that their firms do not realize any sales from exports. The mean across all companies for percentage of sales realized abroad was slightly below 9%. Only 1.6% of all companies achieve all of their sales revenue from exports abroad.
Graph 10.5. Percentage of sales realized through exports
Note: Elsewhere in Serbia refers to all municipalities other than those based in Belgrade and those in which the company is registered.
10.4. Concentration and Profile of Domestic Sales Revenue Given the dominance of domestic sales as a proportion of overall revenue, it is logical to proceed to an examination of the profiles of final customers on the domestic market. The following graph groups customers in Serbia into one of three categories - citizens/consumers, private companies, and public/state-owned companies – and looks to whom Serbian companies sell their goods and services:
0
5
10
15
20
25
30
35
0 1-‐10 11-‐20 21-‐30 31-‐40 41-‐50 51-‐60 61-‐70 71-‐80 81-‐90 91-‐99 100
% of All Respondents
% of Total Sales Realized Elsewhere in Serbia
0
5
10
15
20
25
30
35
0 1-‐10 11-‐20 21-‐30 31-‐40 41-‐50 51-‐60 61-‐70 71-‐80 81-‐90 91-‐99 100
% of All Respondents
% of Total Sales Realized Elsewhere in Serbia

46
Graph 10.6. Sources of sales revenue on domestic market, %
It is also useful to look at the diversity of Serbian companies’ customer bases. Generally speaking, it is preferable for a company to have as diverse a customer base as possible so as to minimize sales risk in case demand from large clients should decrease. The following graph looks at the percentage of total sales accounted for by respondent companies’ single largest customer on the domestic market1:
Graph 10.7. Percent of domestic sales accounted for by single largest customer
The graph indicates that the customer bases of Serbian companies are somewhat diversified, as more than half of companies noted that their single largest customers account for 25% or less of their sales.
1 Note: this was only asked of companies that indicated that citizens/consumers accounted for 50% or less of their total domestic sales.
29.9%
59.0%
10.9%
Citizens / Consumers
Private Companies
Public and State-‐Owned Companies
0.0% 5.0% 10.0% 15.0% 20.0% 25.0% 30.0%

47
11. EXPORT
11.1. Motivation This section of the survey aims to reveal to what extent does entering foreign markets contribute to the success of a company, and ultimately to economic growth. In order to accomplish this, it intends to uncover the factors which affect largely the export performance of companies. Therefore, the comparison of business performance of exporters and non-exporters is required. However, this report presents only descriptive statistics and will not include a thorough data analysis. The focus on exports study further endeavors to uncover the possible patterns of success of companies based on their international performance. Revealing the patterns of exporters’ success includes numerous aspects of export activity including the characteristics of foreign buyers, as well as product and market diversification, which we discuss in following sections. Finally, we uncover how, both competences and barriers to export, could affect the ability of a company to foster export activity.
11.2. Key Findings Generally, the majority of Serbian companies represent non-exporters (73.7%), while exporters represent only 26.3%. Among non-exporters, the vast majority have never exported before (92.7%), while 72.9% do not even plan to start selling abroad in the next 12 months. However, the results from the survey indicate that exporters represent a relatively sustainable group, since they have succeeded in maintaining continuity of export activities without any interruptions (78.3%). Regarding the form of cooperation with foreign buyers, most of the exporters accomplished sales through direct sales (68.4%). Unfortunately, majority of the exporters is dependent on one foreign buyer (54.8%). As a source of international competitiveness, exporters ranked highest in the quality of their product or service (83%). Price efficiency, as the second essential factor of competitiveness, was also pointed out (38%). With respect to the challenges and barriers to exporting, difficulties with finding partners/buyers and opportunities in foreign markets (25.6%) posed the greatest problem.
11.3. Basic Composition The majority of companies, 73.7% of them, represent non-exporters while only 26.3% of companies represent exporters. The highest share of non-exporters can be found among small-sized companies. There seem to be a correlation between the size of the company and exporting: as the company size grows, the ability to sell on foreign markets is improved. As can be noted from the Graph 11.1, 76.4% of the large companies are exporters, while 69.8% of medium and only 23.6% of small companies represent the same group. Since export is greatly dependent on the size of the company, such results is not surprising.

48
Graph 11.1. Share of companies: exporters vs. non-exporter
11.4. Exporters Stability and continuity in exports throughout a long period of time is a meaningful indicator of enterprises’ capacity to sustain growth. Therefore, we were interested to what extent companies are able to export every year, or at least with minimal interruptions (two years in a row at most). The majority of exporters succeeded in maintaining continuity in exporting (78.3%). However, this share varies when we take into account company size. As expected, 90.9% of large companies maintained their level of exports while 90% of medium-sized companies did as well). On the other hand, small businesses are dealing with interruptions in exports to some extent, with 6% of small enterprises facing difficulties in upholding continuity in the long-term.
Graph 11.2. Continuity in exporting of companies
The vast majority of exporters sell products on foreign markets. However, 19.6% of exporters sell services on the foreign markets. The top 5 most frequently exported services are: Consulting (15.4%); Programming (15.3%); Graphic design, printing (8.2%); Machine processing (8%) and IT services (5.1%).
0% 20% 40% 60% 80% 100%
large
medium
small
Exporters
Non-‐exporters
78.3
16.2
5.5 Every year
There were short interruptions (two years in a row most)
There were long interruptions (more than two years in a row)

49
11.4.1. Foreign Buyers Determination of the typology of cooperation with foreign partners is significant in terms of identifying the most common means of entering foreign market and establishing relationships with foreign buyers. Most of the exporters established direct cooperation with foreign buyers (68.4%). On the other hand, one third of exporters have used an intermediary. As graph 11.3 shows, most of the direct sale represent pure direct sale. Some small share of direct sale is carried out through subcontracting (8%), and establishing a representative office abroad (5%).
Graph 11.3. Forms of cooperation with foreign buyers
Reliance on a single foreign buyer can usually be problematic in terms of sustaining sales abroad. Therefore, we were interested in quantifying how often this was the case for exporting firms. Unfortunately, the majority of companies have one buyer that constitutes 30% of exports. Furthermore, one third of total exporters have their export dominantly reliant (over 50% of exports) on one individual buyer (32.7%). Categorizing responses by company size, small-sized companies are more dependent on one foreign buyer. Approximately one third of small enterprises rely heavily on a single buyer (more than 50% of exports), while 18.5% of medium and 9.1% of large enterprises rely on a single buyer to the same degree.
11.4.2. Market Diversification The vast majority of exporters sell their products up to 5 foreign markets (85.4%). Only 6% of exporters succeeded in entering more than 10 markets. If we take a closer look at market diversification, it is evident that most of the companies are oriented towards the region (ex-Yugoslavia and Albania) and EU countries (without ex-Yugoslavia countries). 40.2% of respondents sell the entirety of their exports within the region, while 62.2% sell more than half of their sales to the region. On the other hand, 14.5% of companies located their entire sales in the EU countries and 32.1% sold more than half of their exports to the EU countries. Other region, such as Russia, North America and others, do not represent significant export destinations. When asked to single out one market where firms exported the most, four of top five export destinations were countries from the region. 20.2% of companies appointed Bosnia and Herzegovina as their major market destination, 19.4% named
32% 53%
5% 8% 2% 1%
68%
Indirect
Pure direct sale
Representative ofkice/ branch abroad
Subcontracting (previously contracted sales)

50
Montenegro, 8.1% Macedonia, 7.1% Germany and 5.2% Croatia. On the other hand, if we considering market concentration, it can be noted that the majority of firms concentrate more than half of their export in one particular location. 23.9% of them sell more than 90% of their export to the one country.
11.4.3. Product Diversification In terms of product diversification, results from the survey clearly indicate the presence of concentration in export products. The majority of the companies sell less than five products on foreign markets. Furthermore, 51.2% of exporters sell up to 3 products and even 25.9% of exporters sell only one product.
11.4.4. Competences and Barriers Improving export performance among the exporters requires determining both competences and barriers to export. Enhancing and exploiting competencies leads to further improvement in their overall economic performance. The vast majority of companies underline the quality of their product or service as the essential factor that makes them competitive on foreign markets (83%). On the other hand, 38% of firms consider their efficiency and low price particularly important for their export performance. However, taking a closer look at the company’s size reveals the differences in such priorities. Large firms value price efficiency more relative to small firms. The importance of knowledge about foreign market needs is values more by large firms as well. On the other hand, small firms find product quality significantly more important than a relatively low price.
Graph 11.4. What makes company competitive on foreign markets?
The purpose in examining export barriers is to uncover their relationship to export performance. These barriers differ depending upon the size of the firm and the industry in which operates. Facing these challenges requires both identifying company specific barriers and those affecting all companies. In order to identify the most significant barriers in regard to export, 8 potential barriers were presented to the respondents. The top three barriers, in descending order, are in fact external problems: finding partners/buyers and opportunities in
0% 10% 20% 30% 40% 50% 60% 70% 80% 90%
Financial resources available for investing Other, what?
Business and export plan Sales and distribution channels Working with foreign partners
Knowledge about foreign market needs People and experience Relatively low price
Quality product/service

51
foreign markets (31%); financing and securing export (16%); domestic and/or foreign administration, paperwork and trade regulations (27%). Only 5% of companies classified barriers as an internal problem. These barriers include insufficient capacity in terms of insufficient production volume, in spite of having a competitive product (3%) and insufficiently competitive product/service (indistinctiveness, price, quality, brand, design, after sale services) (2%). However, more than one quarter of respondents (29%) pointed out that they are not faced with any problems when exporting.
Graph 11.5. Barriers to exporting
It is interesting to note that when company size is taken into account, different barrier are identified as the greatest. On the one hand, large companies single out financing and securing export as their major barrier (30.1%). On the other hand, small-sized companies cited finding partners/buyers and opportunities in foreign markets as the highest barrier (31.1%). However, regardless of the small share of small-sized exporting companies in the total sample of small companies (Graph 11.1), the majority stated having no problems with exporting. Even though financing of export was emphasized as a major obstacle to export by large companies, in comparison to the SME sector, they use credit for export financing more often (Graph 11.6). 33% of large firms noted they finance less than 50% of exports through loans. On the other hand, small and medium enterprises are less likely to finance export by loans. Only 2% of small and 10% of medium-sized companies used loans to finance less than 50% of exports. However, the majority of companies in each of the three groups did not use loans to finance exports at all.
0% 5% 10% 15% 20% 25% 30% 35%
Insufkiciently competitive product/service (indistinctiveness, price, quality, brand,
Insufkicient capacity in terms of insufkicient production volume, in spite of having a
Transport
Fear of currency risk/ problems with payment
Financing and securing export
Domestic and/or foreign administration, paperwork and trade regulations
We are not faced with problems when exporting
Finding partners/buyers and opportunities in foreign markets

52
Graph 11.6. Export financing with loans
11.5. Non-Exporters The majority of companies, 73.7%, represent non exporters. Among them, 92.7% have never exported before, while a small percentage (5.7%) have at one point or another engaged in export activities. The following graph presents the potential reasons for terminating export activities, revealing that. 63% of former exporters, apart from having competitive product/services, indicate that finding buyers on foreign markets represented the greatest obstacle. As the previous section mentions, the lack of means for financing export is identified as the second most important barrier for exporting.
Graph 11.7. Reasons behind termination of export activities
In terms of the future plan to start export activities, the vast majority of non-exporters do not even plan to start selling abroad in the next 12 months (72.9%). The remaining third of the companies are working on it successfully while facing few barriers (4.8%), are facing serious barriers (1.8%), or have encounter barriers that disabled further formulation of the plan (6.9%). 13.6% noted that even though export is part of their plan, they do not work on it.
0% 20% 40% 60% 80% 100%
Large enterprises
Medium enterprises
Small enterprises
Yes, more than 50% of export is kinanced with export loans
Yes, less than 50% of export is kinanced with export loans
No, export is not kinanced with export loans
0% 10% 20% 30% 40% 50% 60% 70%
Domestic demand fully meets company
Export is not a part of business plan
Other
No product or service adequate for export
Concern about complicated paperwork
Lack of means for kinancing export
Difkiculties with kinding buyers out of the

53
12. ACCESS TO FINANCE
12.1. Motivation Access to finance is one of the key determinants of successful business start-up, development and growth of enterprises. It is particularly important for SMEs, as they face different challenges with regard to financing compared to large enterprises. Large enterprises have easier access to equity capital markets. This source of financing is not available and accessible to the majority of SMEs. These businesses are more reliant on limited self-financing and bank lending (2013 SMEs’ Access to Finance survey, P.3). In Serbia’s case, increasing SME access to funding is probably the single most important measure that can be offered, other than providing a more stable and entrepreneurship-friendly legal and regulatory environment. Adequately financed SMEs can play an important role in the strategy for creating a competitive and export-oriented economy. These SMEs also contribute to economic development by creating new jobs and expanding the economic base through innovation and learning. Hence, fruitful cooperation between the SME sector and the financial sector, especially banks, is crucially important for achieving and sustaining economic growth.
12.2. Key Findings The majority of firms, especially small ones, relied only on internal financing in their operations. This was the most significant source of financing on the whole. Domestic bank loans are the second most important source of financing, according to 27% of firms. These two sources are dominant in structure of sources of financing of enterprises in Serbian economy. Other sources, such as mother company funds, loans from family and friends and trade loans are also present, but not as significant. More than half of firms have used bank loans, but only one third of companies use this source of financing currently. Most firms do not have any interest in taking out bank loans; the most common given for this is that they feel it is simply not necessary. Although these firms are steadfast in their decision to not use the bank loans for business support, there are circumstances under which they may consider this source of financing after all, such as increase of demand for their products and services and greater availability of resources, in terms of price and quality. The biggest obstacle to increased lending are, in increasing order: high interest rates, inadequate loan duration and interest rate volatility. With regard to firms that use and have used the bank loans, the most used bank product was short-term loans for working capital. On the other hand, firms have mainly used bank loans to invest and acquire long-term assets such as purchasing new machinery and equipment, investing in production processes and purchasing land and buildings. This discrepancy indicates that the maturity structure of financing was inadequate.

54
12.3. Overall Financing Businesses are struggling to obtain enough financing to support their regular operations and further development. The majority of enterprises rely on only one source of financing - primarily internal financing - which is also generally the most frequently used source of financing. Almost all enterprises reported that internal financing was one of the three most important modes of their financing. With respect to size, small firms relied to a greater extent on self-financing than medium-sized enterprises and large companies. A complete overview of the most important modes of financing, by size of enterprise, is available in table below.
Graph 12.1. The most important modes of financing by size of enterprise
60% of firms rely on only one source of financing, while 30% of companies use two sources of financing. Nine out of ten firms that use only one source rely on internal financing. Internal financing refers to self-financing from private savings, retained earnings and sale of assets. Hence, it can be concluded that more than a half firms use internal financing as their only reliable and significant source of financing. Domestic bank loans are the second most frequently used source of financing. With respect to size, 27% of small firms and entrepreneurs stated that this mode of financing is among the three most important. However, 43% of medium-sized and 48% of large enterprises relied on domestic bank loans to a greater extent. Foreign bank loans have been used as a significant mode of financing by 3.5% of firms. It is interesting to notice that, with regard to firm size, foreign bank loans were relatively most often used by medium-sized firms. 12% of medium-sized firms used loans from foreign banks as an important source of financing. Every tenth company is financed by its mother company. Reliance on mother company funds is particularly important for large companies. Every third large firm stated that it uses this source of financing and that it finds it as a very significant one.
0.0 20.0 40.0 60.0 80.0 100.0
Other
Loans of foreign banks
Other sources: state (subsidies, startup, development loans), private investors (investment
Trade loans (deferred payment)
Loans from family/ friends
Mother company funds
Loans of domestic banks
Self-‐kinancing from retained earnings/ personal funds
% of Firms
Source of Financing
Total
Large
Medium
Small

55
12.4. Access to Commercial Bank Financing The majority of companies, 55% of them, have used bank loans in order to support their businesses at least once. However, every third company that has used bank loan in the past no longer uses it. In addition, almost half of firms have never taken a bank loan.
Graph 12.2. Access to commercial bank financing (%)
Every third company currently has a bank loan, of which two thirds (55%) started to use them after the strike of crisis, from 2009 onwards. In addition, 35% of companies that currently have bank loans started using them before the end of 2008 and still continue to use this bank product. Bank loans are most frequently used by large companies; 70% of them use bank loans as a source of business financing. Bank loans are also frequently used by medium-sized enterprises; 60% of medium companies rely on bank financing.
Graph 12.3. bank loans usage by size of enterprise
The discrepancy between the number of firms that use bank loans (35%) and the number of firms that consider those loans as a significant source of financing (27.5%) indicates that not all companies that use bank loans consider this source of financing as very important for their operations. The amount of these loans may be insignificant
45.6
18.4
36.0 Company has never taken a bank loan
Company does not use bank loan anymore
Company is still using a loan
0 10 20 30 40 50 60 70
Enterprises that currently have a bank loan (%)
Size of enterprise
Small enterprises (which also include all entrepreneurs)
Medium-‐sized enterprises
Large enterprises

56
0.0% 10.0% 20.0% 30.0% 40.0% 50.0% 60.0% 70.0%
% of Firms
Type of Used bank Products
Short-‐term loans for working capital Investment loans
Long-‐term loans for working capital Account overdraft
Liquidity loans
Revolving credits
Rekinancing
compared to the other sources of financing, or companies may simply underestimate the importance of this type of financing.
12.5. Firms That Borrow As mentioned in the previous section, more than a half of firms surveyed borrowed funds from banks. The range of used bank products and the frequency of their usage are presented in graph below:
Graph 12.4. Structure of bank products by type
The most used bank products were intended to support working capital, primarily through short term loans. However, firms used banks as source of financing through a wide range of different bank products: 65% of companies used short term bank loans, intended primarily to support working capital. Every third company stated that it has acquired investments loans, while every fourth company has used long-term loans in order to support working capital. Interestingly, often there occurred a mismatch between the maturity structure of loans and what companies actually ended up financing with said loans. Almost half of companies used bank loans to purchase new or repair existing machinery and equipment. Paradoxically, companies often used short-term loans to invest in new long-term assets such as machinery and equipment, investments for which long-term loans are more appropriate. Every third company used loans to invest in production processes, while 14% of loans were used to purchase buildings and land. The majority of these investments in long-term assets were also financed by short-term loans normally intended to support working capital and liquidity.

57
12.6. Firms That Do Not Borrow The majority of companies that have never used a bank loan generally do not intend to rely on bank products in the future. Two-thirds of companies think that they do not even need bank loan, while 15% do not wish to apply for loan given that, in their view, the conditions for talking loans are too strict and unfavorable. Hence, 82% of companies that do not borrow are not interested in applying for a bank loan. Almost every fifth company that did not borrow funds is interested in obtaining a financial injection from a bank. Most of those enterprises still have not formally applied for loans, but believe that they would be able to get a loan if they were to apply. 66% of firms point out that banks informed them that there would not be any significant obstacles to receiving a loan were they to apply for one. When banks did point out potential obstacles, they most often referred to the amount of operating revenue, net profit and the unstable industry of the potential loan applicant. Only 1.4% of companies that have not borrowed were both interested in acquiring bank loan and rejected in that process, while 3% of companies are unsure whether they would be able to get a loan.
Graph 12.5. Response to question, “are you generally interested in taking a bank loan for financing of your business?”
Circumstances that could possibly change the willingness of companies to take a loan are rare. Only one fourth of companies that declared that they do need loans would apply for loan if demand for their products and services suddenly increased. 9% of companies would apply if resources became more available, in terms of better price, quality or adequacy. Still, two-thirds of companies would not apply for loan under any circumstances.
66.6
13.6
9.1 6.5 2.9 1.4
No, I don't need a loan
Yes, it is our plan and we believe that we will get the loan
No, because of unfavorable loan repayment conditions
No, because of strict conditions for taking a loan
Yes, but I don't think/ I don't know whether I can get a loan
58
13. CRISIS AND INNOVATION
13.1. Motivation The strike of the global economic crisis slowed down economic growth considerably and revealed that the Serbia’s economic development achieved since 2000 was unsustainable. Growth ground to a halt once the crutch of inexpensive, freely-available capital and financing dried up. The sudden slowdown of capital inflows drastically reduced domestic demand, decreased output, and led to the depreciation of the dinar. Combined with a sudden drop-off in demand and FDI from the EU, Serbia’s largest economic partner, this increased unemployment considerably. In order to overcome the negative impacts of the crisis as soon as possible and to reignite growth and put operations back on track to prosperity, firms must shift their well-established paradigms. The ability of SMEs to grow depends highly on their potential to invest in restructuring, innovation and qualification. For Schumpeter, behind innovation (i.e. the economic application of technological improvements) lies entrepreneurship. Innovation involves the industrial or commercial use of something new: new goods or services, a new production method, a new market or source of supply, a new form of organization or a new method of financial organization. For Schumpeter, innovation is fraught with difficulties. One of them stems from the need for external financing (Levine, 2005). Innovation is an important determinant of competitiveness. The importance of innovation has been reinforced by a fast development of new technologies (ICTs in particular), which enabled new forms of competition and opened new markets for creation of innovative products (Elena Veselinova, Marija Gogova Samonikov, 2012). Hence, it is necessary to take a closer look at innovative activities that Serbian firms have implemented in order to gain a comprehensive picture of how Serbian firms are dealing with the negative impact of the crisis. This may be useful for two reasons: First, it may help to ascertain to what extent and how Serbian firms have reacted to the negative impacts of the crisis. Second, it may also reveal which modifications proved to be the most effective in helping companies to survive, remain resilient and successfully overcome the anemic economic environment.
13.2. Key Findings The slight majority of firms, 52% of them, have implemented some innovative activities in the past five years. The largest number of innovations was directed towards the development of new or considerably upgraded products. These new products found important places in portfolio of products that companies manufacture and sell. Besides developing new or significantly upgrading existing products, firms were also investing in a new technologies and new geographical markets. Still, 85% of enterprises that have entered new markets obtained more than a half of their income from sales in markets in which they were already established. 49% of companies have not undertaken any innovative activities since 2009. The most frequent reason is that firms considered that there was no need for new products and services on markets.

59
Graph 13.1. Innovative activities of Serbian firms since 2009.
Note: Respondents were able to select as many responses as they felt appropriate.
13.3. Firms That Innovated The largest number of innovations was directed towards development of new or considerably upgraded products. 20% of firms preferred to develop new products within their core business, but 10% of firms also developed new products in economic activity that was completely new for their firm. A slight majority of firms stated that their newly-introduced and developed products represented innovations for the entire market, and not only for their enterprise. The new products developed after the strike of the crisis found the important place in portfolio of products that companies manufacture and sell on markets, according to surveyed enterprises. New products accounted for more than a half of total sales at 42% of enterprises that have developed new products. Portfolio of products of 17% enterprises consisted only from these, new, products. Still, averagely, at 58% of companies, the majority of sales came from previously established products. Besides developing new or significantly upgrading existing products, firms also invested in new technologies, new markets and new systems of marketing, transportation and information activities. 14% of firms invested in new technologies in order to modernize and improve production processes. Entry into new geographical markets was also a frequent activity of firms that innovated in the observed period. 11% of firms started to sell their products on new markets within Serbia, while 9% of firms entered at least one new foreign market. Still, 85% of enterprises that entered a new geographical market obtained more than a half of their income on markets in which they were already established. Only 15% entered into new markets that now account for more than half of their revenue. On average, revenues generated from new markets accounted for around 30% of total revenues.
0% 5% 10% 15% 20% 25% 30% 35% 40% 45% 50%
Firms haven't undertaken any of the New methods of management
New methods of kinancial accounting and New methods of storing, transport and
New methods of marketing or advertising New systems of information or
New foreign market(s) New products within activity that was new
New domestic market(s) New technology used in production
New product within the kirm's core activity
48.7% 2.4% 3.8% 4.9% 5.3% 6.6% 9.2% 10.0% 11.4% 13.6%
20.1%
% of Firms
Type of Innovation

60
13.4. Firms That Did Not Innovate 49% of companies have not undertaken any innovative activities since 2009. 70% of these firms did not even have a wish or intention to modify their business operations and to invest and innovate. The most frequent reason is that firms consider that there is no need for new products and services. Moreover, 27% of firms did not want to take any risks with investing in new products, market or technologies. These firms find innovative activities as risky for their business, as these activities are not essential parts of their business plan. Only one fourth of companies wished to innovate, but insufficient financial resources were the main obstacle.
Graph 13.2. Firms that did not innovate
14. INVESTING In this section of the survey, respondents were asked to answer a few questions regarding future plans for their business. Questions included covered aspirations of the business owners, as well as the problems or barriers preventing them from achieving these goals. Another set of questions conveys the expectations for future business activities taking into account the aforementioned barriers.
14.1. Motivation The purpose of this section of the report is to gain background knowledge of the business climate within which firms operate. Specifically, we are interested in how firms perceive future business operations, including their ambitions and hardships. Through their responses, we may get a better picture of how the current economic situation is influencing firms and what is in store for the future. Moreover, it is important to know what kinds of barriers are standing in the way of growth so as to draw attention to potential obstacles that policymakers and other stakeholders can focus on in order to enable businesses to succeed in the future. This is particularly important for SMEs because they have great potential in driving economic growth
42.1
27.4
25.9
3.1 1.5 There is no need for new products and services in the market
The enterprise didn't want any risks, these activities were not a part of our business strategy
Insufkicient kinancial resources to support these activities

61
through creating new jobs, expanding capabilities through innovation, and engaging in export activities.
14.2. Key Findings With respect to the current capacity of the firms, the key findings suggest a majority of firms (42.2%) would be able to respond to sudden increases in demand without engaging additional resources, while 39.9% stated they could but with the aid of additional factors of production. With respect to future aspirations, a sizeable majority of firms wish to expand their business, but they face many significant barriers. The top 4 barriers in descending order are: financing of growth, limited demand for company products, the growing costs of materials and raw materials, and the strengthening of competition. A small percentage of firms (26.6%) are expecting to hire in the following year and of those that are sure of the number, only wish to hire on the order of 1 to 2 persons. In addition, the majority of firms expected their incomes to remain the same in the following year. More firms expected a decline in income in the following year than did an increase. Of the firms expecting a decline in income, the responses were more pessimistic than those corresponding to firms expecting an increase in income.
14.3. Sudden Increases in Demand Before investigating firms’ ambitions about future expansion, we were interested in the current operating capacity of the businesses. We therefore asked the question: If a company was suddenly to receive a sudden increase in demand from its customers for its services, would it be able to satisfy its clients? 42.4% of respondents indicated they would be able to without engaging additional factors of production, while slightly fewer than 39% noted that they could on the condition that additional manpower and/or machinery was engaged. While it is useful for a company to be able to quickly respond to higher demand, this may also be indicative of unused capacity; on the other hand, a company may be operating right around its capacity, but may perhaps not be able to quickly respond to sudden increases in demand for its service or product.
Graph 14.1. Company capability to meet sudden increases in demand
42.4%
38.7%
10.6% 8.2%
Yes, without engaging additional labor force / machinery / premises
Yes, but would have to engage additional labor force / machinery / premises
No, we would not be able to respond in short term to increase of demand
Don't know

62
14.4. Aspirations and Expectations for Future Growth First and foremost, we wished to know whether owners/managers wanted to expand business operations and have their enterprises grow into bigger companies. We wish to differentiate between ‘opportunity firms,’ those that have a vision and work towards achieving some goal, and ‘necessity firms,’ those that only wish to survive with little ambition in growing or developing further. In doing so, we establish the context within which we may understand how firms are being affected by the economic situation, and how decision-makers should approach growth strategies. As expected, the majority of respondents answered in the affirmative: 64.5% hoped to expand in the future, while 35.5% did not. Although many owners want to expand, the realities they face influence whether they can actually pursue their goals. Therefore, an important follow-up to the previous question is what expectations, in terms of financing, do owners have in making growth possible. Of the firms hoping to expand, 46.6% believed they would not be able to provide adequate financial resources in the near future, while 44.2% believed they could. These values are presented in graphs 14.1 and 14.2.
Graph 14.2. What are your expectations regarding expansion of your business operations?
Other than finances, another reason that could affect an owner’s expectation for growing his/her business is the presence of a formal plan detailing the necessary steps it must follow in order to achieve this goal. In formulating such a plan, the firm becomes much better informed of its capacities and how best to allocate resources. In addition, a formal plan can aid the firm in obtaining external funding from government or sponsors if the need arises (Lange et al, 2007). Respondents were therefore asked whether they had a business plan, formal or informal. The majority stated they did not have one or the other, standing at 44.2%, while 37.6% had an informal plan, and 18.2% had a formal, written plan.
46.6
44.2
8.2
I don't think that I will be able to provide adequate kinancial resources for that in the near future
I think that I will be able to provide adequate kinancial resources for that in the near future
Don't know

63
14.5. Barriers to Growth Revealing respondents’ barriers to growth offers significant insight regarding the possibility of achieving future goals. In order for policy-makers to create effective strategies for firm growth, the greatest obstacles facing owners need to be identified. We listed 7 potential barriers with the additional option of writing in a response under an “other” option. A total of 2 answers could be selected. Graph 14.3 depicts the distribution of responses.
Graph 14.3. External problems or barriers
In descending order, the top 4 reported barriers to growth are: financing of growth (30.8%), limited demand for company products (28.9%), the growing costs of materials and raw materials (20.6%), and strengthening of competition (20.6%). In fact, the two greatest barriers should have slightly higher frequencies if we take into account the written responses. Although only a small portion of respondents had written answers, it is interesting to note that the majority of their answers were directly related to the top two barriers. For example, nearly two thirds of the written responses stated that the current financial situation (an “economic crisis”) and very low consumer disposable income, were the greatest barriers. Moreover, the two are directly related; due to the state of the economy, GDP per capita has decreased, which is often associated with a decrease in purchasing power and demand for many products. If we categorize the frequency of responses according to firm size, the results are not entirely surprising. Both large and small firms most frequently cited the problem of a lack of finances. In addition, large firms most frequently cited no barriers to growth.
6.3%
28.9%
30.8%
18.6%
20.6%
20.6%
9.4%
5.8%
0% 5% 10% 15% 20% 25% 30% 35%
Lack of skilled labor force and staff
Limited demand
Financing of growth
Administrative /legal regulations
Cost of materials
Strengthening of competition
No problems/ barriers for growth
Other
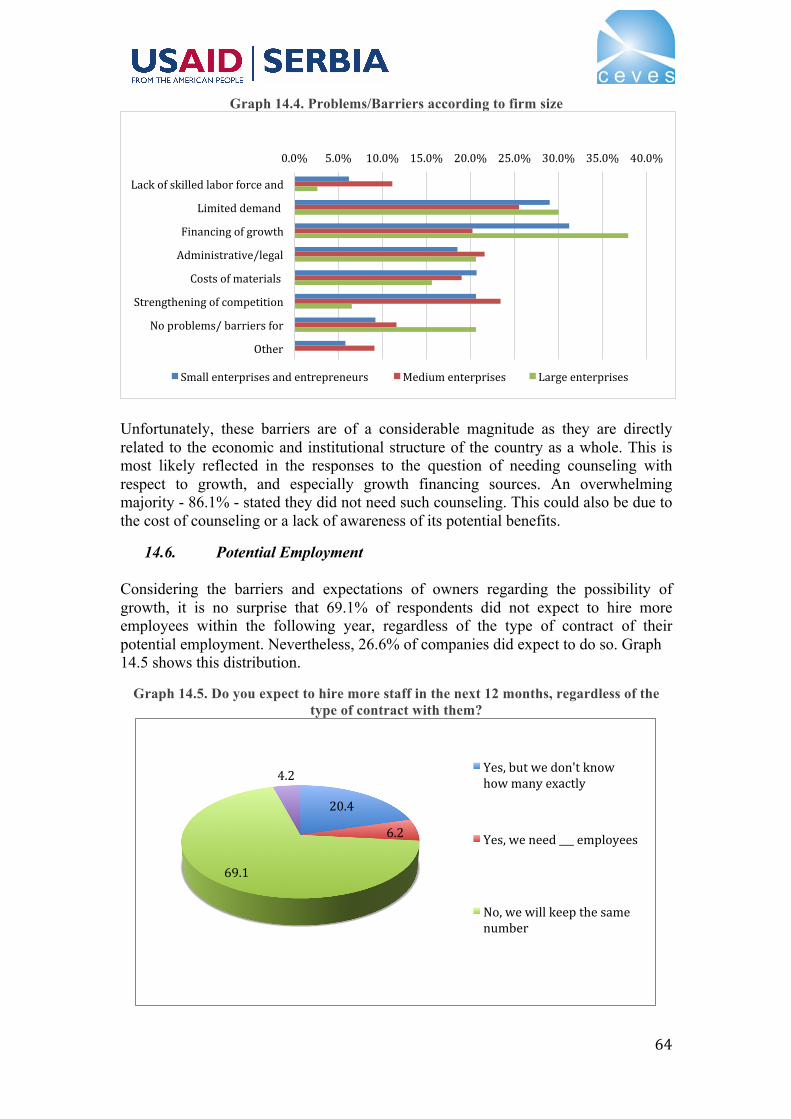
64
Graph 14.4. Problems/Barriers according to firm size
Unfortunately, these barriers are of a considerable magnitude as they are directly related to the economic and institutional structure of the country as a whole. This is most likely reflected in the responses to the question of needing counseling with respect to growth, and especially growth financing sources. An overwhelming majority - 86.1% - stated they did not need such counseling. This could also be due to the cost of counseling or a lack of awareness of its potential benefits.
14.6. Potential Employment Considering the barriers and expectations of owners regarding the possibility of growth, it is no surprise that 69.1% of respondents did not expect to hire more employees within the following year, regardless of the type of contract of their potential employment. Nevertheless, 26.6% of companies did expect to do so. Graph 14.5 shows this distribution.
Graph 14.5. Do you expect to hire more staff in the next 12 months, regardless of the type of contract with them?
0.0% 5.0% 10.0% 15.0% 20.0% 25.0% 30.0% 35.0% 40.0%
Lack of skilled labor force and
Limited demand
Financing of growth
Administrative/legal
Costs of materials
Strengthening of competition
No problems/ barriers for
Other
Small enterprises and entrepreneurs Medium enterprises Large enterprises
20.4
6.2
69.1
4.2 Yes, but we don't know how many exactly
Yes, we need ___ employees
No, we will keep the same number

65
It is also not surprising that larger firms are expecting to higher more employees than both medium and small firms. Graph 14.5 depicts the distribution of responses. Approximately 69.2% of large firms plan to hire while 25.5% and 40.9% of small and medium-sized firms plan to hire, respectively. Of those that were sure of the number they wished to employ, 37.3% would employ 2 more people, while 34.4% would employ one more person. Graph 14.6 depicts these figures.
Graph 14.6. Do you expect to hire more staff in the next 12 months, regardless of the type of contract with them?
Graph 14.7. "Yes, we need __employees:" Number of employees expected to be hired in the next 12 months
14.7. Expected Trends in Income Within the course of the following year, the majority of firms expected their income to stay the same, which accounted for 51.5% of responses, followed by those expecting their income to rise, which accounted for 27.8% of responses. Of the total, 16.6% expected income to fall.
Graph 14.8. How do you expect your income to change in the next 12 months?
Taking into account the size of the firm, it is obvious that the larger the firm, the more optimistic it is that income will rise rather than fall. Graph 14.9 shows the expected
0% 10% 20% 30% 40% 50% 60% 70% 80%
Yes, but we don't know how many exactly
Yes, we need ___ employees
No, we will keep the same number
We will have to reduce the number of employees
Large enterprises Medium enterprises Small enterprises and entrepreneurs
27.8
51.5
16.6 4.1
It will grow It will stay the same
It will fall Don't know
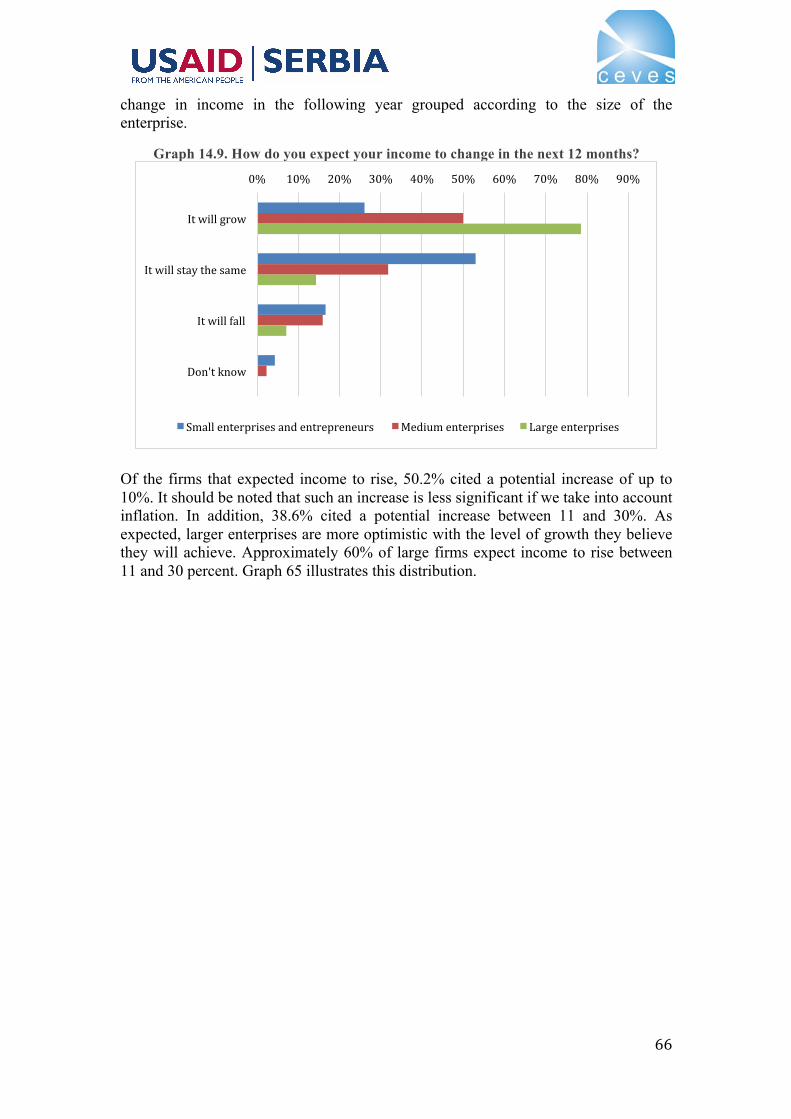
66
change in income in the following year grouped according to the size of the enterprise.
Graph 14.9. How do you expect your income to change in the next 12 months?
Of the firms that expected income to rise, 50.2% cited a potential increase of up to 10%. It should be noted that such an increase is less significant if we take into account inflation. In addition, 38.6% cited a potential increase between 11 and 30%. As expected, larger enterprises are more optimistic with the level of growth they believe they will achieve. Approximately 60% of large firms expect income to rise between 11 and 30 percent. Graph 65 illustrates this distribution.
0% 10% 20% 30% 40% 50% 60% 70% 80% 90%
It will grow
It will stay the same
It will fall
Don't know
Small enterprises and entrepreneurs Medium enterprises Large enterprises

67
Graph 14.10. Enterprise income to rise
Of the firms that expected income to fall, 23.9% cited a potential decrease of up to 10%, while 44.9% cited a potential decrease of between 11 and 30%. These are much bleaker expectations compared to the growth expectations of firms depicted in Graph 14.10 above. In addition, a total of 23.3% expected a fall in income of greater than 30%. This pales in comparison to the 7.2% expecting an increase in income greater than 30%. Small firms were significantly more pessimistic than medium and large firms; nearly double (47.8%) expected a decrease between 11 and 30 percent than those expecting a decrease of up to 10%. Graph 14.11 shows the trend in responses.
Graph 14.11. Enterprise income to fall
0%
10%
20%
30%
40%
50%
60%
70%
Up to 10% 11 -‐ 30% 31% -‐ 50% 51% -‐ 75% 76% -‐ 100% More than 100%
Small enterprises and entrepreneurs Medium enterprises Large enterprises
0%
10%
20%
30%
40%
50%
60%
70%
80%
Up to 10% 11 -‐ 30% 31% -‐ 50% 51% -‐ 75% 76% -‐ 100%
Small enterprises and entrepreneurs Medium enterprises Large enterprises

68
15. CONCLUSION
This high-level results of this survey certainly give reasons to be optimistic and cause for concern. It is heartening to learn that many Serbian companies innovated even during the crisis, that companies in tradable sectors believe they their sectors are not characterized by monopolistic or oligopolistic behavior, and that companies wish to expand (and need financing to do this). In contrast, it is discouraging to learn that a relatively small percentage of companies export, that businesses are reluctant to hire more workers, and that more firms believe their revenues will decrease rather than increase.
Above all, the information presented in this report raises many questions that should draw the attention of policymakers, economic researchers, companies, financial institutions, and numerous other relevant stakeholders. Indeed, it is only in the context of additional research that it becomes possible to use this data to paint a clearer, more nuanced picture of Serbian tradable sectors. In the next and final phase of this project, CEVES will combine the data from this survey with an in-depth quantitative analysis of export competitiveness and industry performance to more precisely identify how the potential determinants of company success or failure examined in this report actually impact firms in tradable industries, the sectors that CEVES believes should serve as the primary engine of economic growth going forward.

69
16. REFERENCES
1. Biemer P, Lyberg L, Wiley-Interscience, “Introduction to Survey Quality”, John Wiley & Sons Publication, University of North Carolina, Chapel Hill
2. Brander J, Spencer B, “Horizontal Product Differentiation in Bertrand and Cournot Duopoly: the Bertrand Paradox Revisited and Comparative Competitiveness”, (May 2014), University of British Columbia, USA
3. Groves R.M, “Nonresponse rates and nonresponse bias in household surveys”, (2006), Public Opinion Quarterly, Vol. 70, No. 5, Special Issue 2006, pp. 646–675, Oxford University, London, UK.
4. Hall P, Soskice D, “An Introduction to Varieties of Capitalism”. 5. Jindrichovska I, “Financial Management in SMEs”, European Research Studies,
(2013), Volume 16, Special Issue on SMEs 2013, University of Finance and Administration, Prague, Czech Republic
6. Krause D, Ellram L, “Critical elements of supplier development - The buying-firm perspective”, (1997), European Journal of Purchasing & Supply Management, Vol. 3, No. 1, pp. 21-31, USA.
7. Lange, J, Mollov A, Pearlmutter M, Singh S, Bygrave W, “Pre-start-up Formal Business Plans and Post-start-up Performance: A Study of 116 New Ventures”, (October 2007), Venture Capital, Vol. 9, No. 4, pp. 237 – 256, Babson College, MA, USA.
8. Oliveira B, Fortunato A, “Firm Growth and Liquidity Constraints: A Dynamic Analysis”, (2006), Small Business Economics, Vol. 27, pp.139–156, Portugal
9. Papulova Z, Mokros M, “Importance Of Managerial Skills And Knowledge In Management For Small Entrepreneurs”, (2007), Comenius University, Bratislava, Slovakia
10. Schwab K, Sala-i-Martín X, World Economic Forum (WEF), “The Global Competitiveness Report 2014–2015”, Geneva, Switzerland.
11. Tanjug, “Sertić: Srbija na novom putu”, B92, 2nd of August 2014, http://www.b92.net/biz/vesti/srbija.php?yyyy=2014&mm=08&dd=02&nav_id=883874
12. Urbonavicius S, “ISO system implementation in small and medium companies from new EU member countries: A tool of managerial and marketing benefits development”, (2005), Research in International Business and Finance 19, pp. 412-426, Vilnius University, Lithuania

70
17. ANNEX
Good morning /day/evening, my name is __________________ . I am working as an interviewer in research agency Ipsos Strategic Marketing which regularly conducts surveys on various topics. I would appreciate if you answered some questions for me. This survey is statistically anonymous, and all obtained data will be presented only as group data, and used only for the purposes of this project. Thank you very much for your time. At the very beginning I would like to present to you the organization and the project which it initiated, in which you will also take part. Centar za Visoke Ekonomske Studije - CEVES (Center for Advanced Economic Studies ) is an independent research-development and activist institute dedicated to improvement of the economic recovery of Serbia. With its activities CEVES tries to influence the creation and adoption of policies to accelerate and expedite the growth of the private sector in Serbia, and thus to create new jobs and increase social welfare. Through the survey that we are currently conducting CEVES tries to understand deeper and more thoroughly the structure and performances of Serbian economy, primarily from the perspective of companies. Your participation in this survey is of exceptional importance, because, by answering our questions honestly, you will allow CEVES to understand better business conditions, and consequently to influence more significantly the creation of a more pleasant business ambiance.
Project: NUMBER OF ENTERPRISES FROM SAMPLE:
ID number of interviewer:
Interview start time
Number of questionnaire :
140399390101
01 Municipality: ______________________ 02 02 Region: 1. Vojvodina
2. Sumadija and Western Serbia 3. Southern and Eastern Serbia 4. Belgrade 03
03 Type of economic activity from the sample: [INT] COPY FROM SAMPLE.
1. Agriculture 2. Manufacturing 3. Light industry 4. Heavy industry 5. Intellectual services 04
04 Size of enterprises from the sample: [INT] COPY FROM SAMPLE.
1. Small enterprises (which also include all entrepreneurs)
2. Medium enterprises 3. Large enterprises 05
05 Level mark from the sample: 1. 1 2. 2 DEM4
DEM4
What is your position in the enterprise? [INT] Multiple responses.
-1- Owner -2- Chief Executive Officer (CEO) -3- Chief Financial Officer (CFO) -4- Director of Managing Board (Board of Directors) -5- Assistant Director -6- Assistant CFO A1 -7- Other End

71
[INT] READ TO RESPONDENT: To start with, I would like you to tell me briefly about the main business of your company, that is, about what it produces or what kind of services it provides.
A Insight [INT] READ TO RESPONDENT: Throughout our interview we will use the term enterprises, which refer both to companies (enterprises), and entrepreneurs.
A1 When did your enterprise start operating its business? By this we mean the year when your enterprise started operating the business effectively, regardless of when it was officially established and registered. [INT] Write down the actual year when the business operations started, regardless of the year of official registration or change of legal form.
__________
_ (year) B1
B Economic activity B1 Which product /service had the largest share in the revenue from
sale that your enterprise realized in 2013? [INT] Write down the name of the product /service. Explain to the respondent that he/she is asked about the type of product/service, not the concrete products – for example, it is sufficient to answer „fabric softener“, without going into the details about the kind of fabric softener or its characteristics. Accentuate to respondents that revenues from sales refer to part of the operating revenue that the enterprise generates from from the sales of its products and services to buyers. Therefore, it does not refer to profit and earnings, but to operating revenue /turnover which the enterprise generates through sale of products and services, before the deduction of costs and taxes.
___________________________________________ (product/service)
B2 B2 Please select the sector in which the main product/service of your
enterprise can be classified most appropriately? [INT] Single response. We are interested in the actual activity that your enterprise is engaged in, regardless of the activity under which your enterprise is officially registered. Read out the answers.
1. The enterprise is production-oriented 2. The enterprise renders services 3. The enterprise is engaged in trade 4. The enterprise belongs to agricultural sector 5. The enterprise is engaged in construction NA (Refusal - do not read out) B3
B3 In which economic activity (subsector) can the main product/service of your enterprise be classified best of all? [INT] Write down.
___________________________________________
___________________________________________ ___________________________________________ B6
B6 Considering the total revenue from sales realized in 2013, what is the share of the mentioned activity of your enterprise? [INT] Write down the exact percentage. Point out to respondent that this doesn’t refer to profit, but to total revenue /turnover from the sales.
__________________ (exact %) [INT] Make sure to classify the given percentage into the proposed categories in the next question (B7). Do not ask B7 again. B7
DK (Don’t know - do not read out) NA (Refusal - do not read out) B7
B7 [INT] If the respondent does not know the exact percentage in the previous question, ask him/her for the closest possible estimate which he/she will classify in one of the following categories: What percentage of revenue from sales, realized in 2013 came from operating the mentioned activities of the enterprise? ANK] Single response. Show card B7.
1. Up to 25% 2. 26 - 50% 3. 51 - 75% 4. 76 - 90% B8 5. 91 - 100% DK (Don’t know - do not read out) NA (Refusal - do not read out) C1
B8 From performing of which activities did the remaining revenue from sales come?
_____________________________ C1

72
[INT] READ TO RESPONDENT: Now we would like to ask you several questions about how you see the competition on the market and industry in which your enterprise operates business .
[INT] Multiple responses (activities). ________________________________________________________________ (Activities)
C Competition C1 How would you evaluate the
competition on domestic market where you operate business as a part of your primary activity? [INT] Single response. Show card C1.
1. We do not have any competition – there are no other enterprises which produce the products of similar kind /render similar services
2. We have competitors, but our product/service is differentiated to a high extent in the eyes of our buyers (our products/services differ from others or they have their loyal buyers /users)
3. We have a lot of competitors –the competition is very strong, but healthy 4. We have a lot of competitors, but the competition is unfair, some enterprises
are privileged or they use illegitimate/illegal activities 5. One or several enterprise control this industry – there is a monopoly /
oligopoly 6. We do not operate business on domestic market C2
C2 What makes your offer of products /services more desirable /attractive in comparison with the competitors’ products or services? [INT] Up to two answers. Show card C2.
1. More affordable price of products /services 2. Higher quality of products / services 3. Recognizable advertisement, design and packaging 4. Channels of distribution and availability of the products /services 5. Post-sale support services (usage assistance, contacts with buyers) 6. Our offer doesn’t differ significantly from the competition, its main
characteristics are very similar 95. Other, please specify:________________________________________ C3
C3 What percentage of total revenue from sales, realized in 2013 did the enterprise invest in advertising, promotion and branding? [INT] Write down.
__________________ (exact %) [INT] Make sure to classify the given percentage into the proposed categories in the next question (C4). Do not ask C4 again. C4
DK (Don’t know - do not read out) NA (Refusal - do not read out) C4
C4 [INT] If the respondent does not know the exact percentage in the previous question, ask him/her for the closest possible estimate which he/she will classify in one of the following categories: What percentage of total revenue from sales, realized in 2013 did the enterprise invest in advertising, promotion and branding? [INT] Single response. Show card C4.
1. Up to 10% 2. 11 - 25% 3. 26 - 50% 4. More than 50% DK (Don’t know - do not read out) NA (Refusal - do not read out)
C5 C5 Does the enterprise currently possess an internationally recognized
certification of quality for its products /services and/or production/service process? [INT] Single response. The question refers to any activity which the enterprise operates, not only the primary/main activity.
1. Yes C6 2. No NA (Refusal - do not read out)
C7 C6 Can you specify up to two, most important certificates for your
enterprise which it possesses? [INT] Write down the name (s).
____________________________________(certificate)
____________________________________(certificate)
NA (Refusal - do not read out) C7

73
[INT] READ TO RESPONDENT: Now we have several questions about your suppliers.
[INT] READ TO RESPONDENT: Similar to the previous segment of conversation, we will ask you several similar questions about your buyers and market(s) on which you operate your business.
C7 Is the enterprise a member of some association or associations? If it is, please specify the type of association (s). [INT] Multiple responses. Show card C7.
1. Yes, on branch/guild level 2. Yes, on territorial /geographical level 3. Yes, we are associated with our suppliers and distributors 4. Yes, other, please specify:
________________________________________________ 5. No, we are not interested in associating 6. No, we did not meet the necessary criteria for association with other
enterprises 7. No, we haven’t heard about any associations 8. No, there are no associations that we could join D1
D Suppliers D1 [INT] If the enterprise is operating in the sector of services skip questions D1 and D2: Who were your main suppliers of
raw materials and other materials in 2013 (please indicate for each supplier his % share in total supply)? [INT] For each row write down %. If the respondent didn’t obtain raw materials from supplier write down ’0%’. Show card D1.
D2
Supplier % of total purchase of raw materials D1a Private enterprises operating in Serbia _________________________ % D1c Imports _________________________ % D1d State-owned/public enterprises /through Union _________________________ % D1e Resources which we ourselves produce _________________________ %
Total 100% D2 [INT] If the enterprise operates in the
sector of services skip questions D1 and D2. If the answer to D1d is bigger than 0% ask this question: Why does the enterprise import raw materials and other materials needed for production? [INT] Multiple responses. Show card D2.
1. We do not have other solution, there are no enterprises on domestic market which offer these raw materials/other materials
2. It doesn’t matter, conditions and quality of products are the same in domestic and foreign companies
3. Better proportion between quality and price 4. Better payment conditions 5. More renowned company, which is more trustworthy / more professional
service 6. Other, please specify:_____________________________________ D3
D3 INT] To be answered by all respondents: What percentage of total operating revenue came from execution of work/part of work that your enterprise performed for other companies (outsourcing activities/ subcontracting)? [INT] Write down the percentage. If the respondent doesn’t know the exact percentage ask him/her to give the closest possible estimate.
_________________ (%)
DK (Don’t know - do not read out) NA (Refusal - do not read out)
D4 D4 [INT] To be answered by all respondents:
What percentage of total operating expenses covers the outsourcing of other companies to perform some work /part of work for your enterprise (outsourcing/subcontracting)? [INT] Write down the percentage. If the respondent doesn’t know the exact percentage ask him/her to give the closest possible estimate.
__________________ (%)
DK (Don’t know - do not read out) NA (Refusal - do not read out)
E1

74
[INT] READ TO RESPONDENT: The following several questions refer to management and decision making in your enterprise.
F Management F1 How many people altogether were included on average in regular
operation of your enterprise in 2013, regardless of type of contract and
F3
E Buyers and markets E1 Considering your revenue from sales in 2013, what percentage was realized by sales of goods and services in the
following territories?[INT] For each row write down %. If the respondent didn’t have revenue from sales in the following territories write down ’0%’.. The question doesn’t refer only to primary activity but to all activities which the enterprise performs. Show card E1.
E2
Territory % of revenue from sales E1a Local – municipality in which the enterprise operates its business
[INT] For enterprises registered in Belgrade local is a smaller unit – municipality in which the enterprise is registered.
_________________________ %
E1b Belgrade [INT] For enterprises registered in Belgrade this includes business operation in all Belgrade municipalities except the one where the enterprise was registered (E1a)
_________________________ %
E1c National level / The rest of Serbia without Belgrade and municipality in which your enterprise operates business
_________________________ %
E1d Exports _________________________ %
Total 100%
E2 Considering the domestic market only, who were the buyers of products/services which your enterprise placed, and what percentage of revenue from sales in 2013 was it (regardless of whether they were end buyers or intermediaries)? [INT] For each row write down %. If the respondent did not have revenue from buyers write down ’0%’. Show card E2.
E3
Buyers of products/services % of revenue from sales on domestic market E2a Citizens/Consumers _________________________ % E2b Private enterprises _________________________ % E2c State and state-owned enterprises _________________________ %
Total 100% E3
[INT] If the answer to E2a is less or equal to 50%): Considering only the domestic market, what was the share of the biggest individual domestic buyer in the revenue from sales in 2013.? [INT] If necessary, explain that the question refers to the share of sales revenue of the biggest among individual buyers on domestic market.
__________________ (exact %)
DK (Don’t know - do not read out) NA (Refusal - do not read out)
E4 E4 If demand for your products/services increased
suddenly, would the enterprise be able to produce the offer which satisfies this demand having in mind the current available resources, labor force and technology? [INT] Single response. Show card E4.
1. Yes, without the engagement of additional labor force /machinery/premises
2. Yes, but we would have to engage additional labor force / machinery/ premises
3. No, we wouldn’t be able to respond in short term to increase of demand
DK (Don’t know - do not read out) F1

75
formality of employment? [INT] Write down the exact number. ____________________(number of people) NA (Refusal - do not read out)
F3 Out of total number of employees that you mentioned, how many were with university education (employees with VII degree of educational attainment – finished faculty)? [INT] Write down the number of people.
__________________ NA (Refusal - do not read out)
F4 F4 Did the enterprise permanently employ the workers in 2013 who do not
have any work experience (novices in their work)? [INT] Single response. 1. Yes F5 2. No F6
F5 How many employees without work experience were employed on permanent basis in 2013? [INT] Write down the number of people.
____________ (number of people) NA (Refusal - do not read out)
F6 F6 Dis your enterprise organize training
for its employees during 2013 in order to improve their skills and knowledge, and what type of training was in question? [INT] Single response. Show card F6.
1. Yes, the training was primarily oriented towards management and highly positioned staff
2. Yes, the training was primarily oriented towards workers /lower positioned staff
3. Yes, the training was oriented towards all staff 4. No, we were not in financial situation to organize training although we
considered it necessary 5. No, we didn’t consider the training necessary F7
F7 Are family members of enterprise owner employed in management of the company /do they officially participate in managing the enterprise? [INT] Single response.
1. Yes 2. No NA (Refusal - do not read out) F8
F8 When a decision significant for the enterprise needs to be made, such as on investing in new technology or new capacities, or production of a new product/rendering new service, it is usually made by: [INT] Single response. Show card F8, F9.
1. The owner only 2. The owner after consulting the enterprise management and the financial
manager 3. The enterprise management and the financial manager, after consulting the
owner 4. The enterprise management and the financial manager 5. We don't invest in new technologies or new capacities 6. Other, please specify: ____________________________ F9
F9 When a decision significant for the enterprise needs to be made, such as a decision on additional debt, it is usually made by: [INT] Single response. Show card F8, F9.
1. The owner only 2. The owner after consulting the enterprise management and the financial
manager 3. The enterprise management and the financial manager, after consulting the
owner 4. The enterprise management and the financial manager 5. We don’t take additional loans 95. Other, please specify: __________________________ F10
F10 Are there detailed financial analyses in the enterprise
and planning of inflow and outflow of funds and of dynamics of payments and disbursements at least quarterly (once in three months)?
1. Yes F11 2. No
NA (Refusal - do not read out) F12
F11 Who conducts financial analysis and plans inflow and outflow of funds and dynamics of payments and disbursements? [INT] Single response.
1. Usually enterprise owner 2. Director, who is not the owner, and who is into finance
(financial director) 3. Accountant or accounting department 4. Other, please
specify:_______________________________ F12 F12 In 2013, how many days on average did it take
you to charge your receivables from buyers? Or how many days did it take you to pay your liabilities to suppliers?
F14a charging receivables from buyers:
________ (number of days) DK (Don’t know - do not read out) NA (Refusal - do not read out) G2

76
[INT] Write down the number of days for both categories. Although this may differ from one consumer to another, ask respondent for his most approximate estimate .
F14b paying liabilities to suppliers:
________ (number of days) DK (Don’t know - do not read out) NA (Refusal - do not read out)
[INT] READ OUT TO RESPONDENT: Now we are going to talk briefly about your enterprise’s business operations after the economic crisis.
G Crisis G2 Would you describe your enterprise’s business results as mainly covered by the trends in
your activity, in terms of revenues and expenditures? [INT]Single response. 1. Yes 2. No G3
G3 Have you undertaken any of the following activities since the beginning of crisis (since 2009.)? [INT] Multiple responses. Show card G3.
3. Developing and placing new or considerably upgraded products/services in the enterprise’s activity
4. Developing and placing new or considerably upgraded products/services in an activity new for the enterprise G5
5. Entering geographically new domestic market 6. Entering geographically new foreign market G7 7. New or considerably upgraded technology used in production process 8. New or considerably upgraded systems and methods of storing, transport and
delivery/ distribution of raw materials, products or services 9. New or considerably upgraded systems and methods of management or
managing human resources 10. New or considerably upgraded systems and methods of marketing or
advertising 11. New or considerably upgraded systems and methods of financial accounting
and planning 12. New or considerably upgraded systems of information or communication
technologies H1 13. We haven’t undertaken any of the listed activities G4
G4 What was the key restriction that prevented the enterprise from performing the listed activities in the past five years? [INT] Single response. Show card G4
14. There is no need for new products and services in the market 15. Insufficient financial resources to support these activities 16. Insufficient ideas/ professionals to carry out the process 17. The enterprise didn’t want any risks, these activities were not a part of our
business strategy 95. Other,
_____________________________________________________________ H1 G5 [INT]If 1 and/or 2 in G3: Was the new and
considerably upgraded product/ service: [INT] Multiple responses. Show card G5.
1. New and considerably upgraded for the very enterprise, as well as for the market (the enterprise introduced innovation before competition)
2. New and considerably upgraded for the very enterprise, but not for the market (the enterprise introduced a new or considerably upgraded product/ service already made available in the market by competition) G6
G6 What are the shares of sale of the following products/ services in your total income from sale in 2013: [INT] Show card G6.
G7
Definition of product/service % of total sale income: G6a New or considerably upgraded product/service, introduced in the past five years
(2009.-2013.), innovation in the market where the enterprise operated. ___________________ %
G6b
New or considerably upgraded product/service, introduced in the past five years (2009.-2013.), innovation for the enterprise only, not for the market.
___________________ %
G6c Products and services not at all or not considerably changed in the past five years

77
(2009-2013) (including resale of products and services bought by the enterprise from other companies, regardless of their innovativeness).
___________________ %
Total 100% G7 [INT]If 3 and/ or 4 in G3 : If the enterprise entered a geographically new market, what are the shares of sale of
products/services in the following markets in the total income from sale in 2013. from:
H1
Market % of total sale income: G7a Geographically new domestic markets ________________________________ % G7b
Geographically new foreign markets ________________________________ %
G7c Current markets from the past period (old) ________________________________ % Total 100%
[INT] READ OUT TO RESPONDENT: We are now going to talk about export activities of your enterprise.
H Export H1 Does your enterprise sell its products/ services in foreign markets, either directly
or indirectly – via mediator? [INT] Single response. 1. Yes H2 2. No H15
H2 In what year did your enterprise start to export its products/ services? [INT] Write down the year.
______________________ (year) H3
H3 From the moment of entering foreign markets till this day, what is the frequency of the enterprise’s export activities? [INT] Single response. Read out the responses.
1. Every year 2. There were short interruptions (two years in a row most) 3. There were long interruptions (more than two years in a row)
H4 H4 Pout of total export in 2013, what are the shares of direct and of indirect export (with an intermediary)?
[INT] Write down the percentage for each category. If respondent never used the option, write down ’0’.
H5
Definition of product/service % of total income: H4a Direct export ________________________ % H4b
Indirect export (with an intermediary) ________________________ %
H5 Thinking about sale on foreign markets only, what was the share of the biggest individual buyer in income from sale realized in foreign markets in 2013.? [INT] Underline that we are asking about the share of the biggest foreign buyer among all foreign buyers.
__________________ (exact %) DK (Don’t know - do not read out) NA (Refusal - do not read out) H6
H6 [INT] If enterprise conducts direct export (if H4a more than 0%): How do you cooperate with foreign buyers that you sell directly to? [INT] Multiple responses. Read out the responses.
1. Pure direct sale 2. Representative office/ branch abroad 3. Subcontracting (previously contracted sales) 4. Outsourcing 5. Other, please specify:_________________________ H7
H7 To how many countries does the enterprise export products/ services?
____________________________ (number of countries) NA (Refusal - do not read out) H8
H8 What percentage of total export of your enterprise in 2013 was export to the following regions? [INT] Write down percentage for each category. If respondent never exported to the given regions, write down ’0’. Card H8.
H9
Market % of total export: H8a Region (ex-Yugoslavia + Albania) __________________ % H8b
EU (without ex-Yugoslavia countries) __________________ %
H8c Russia __________________ %
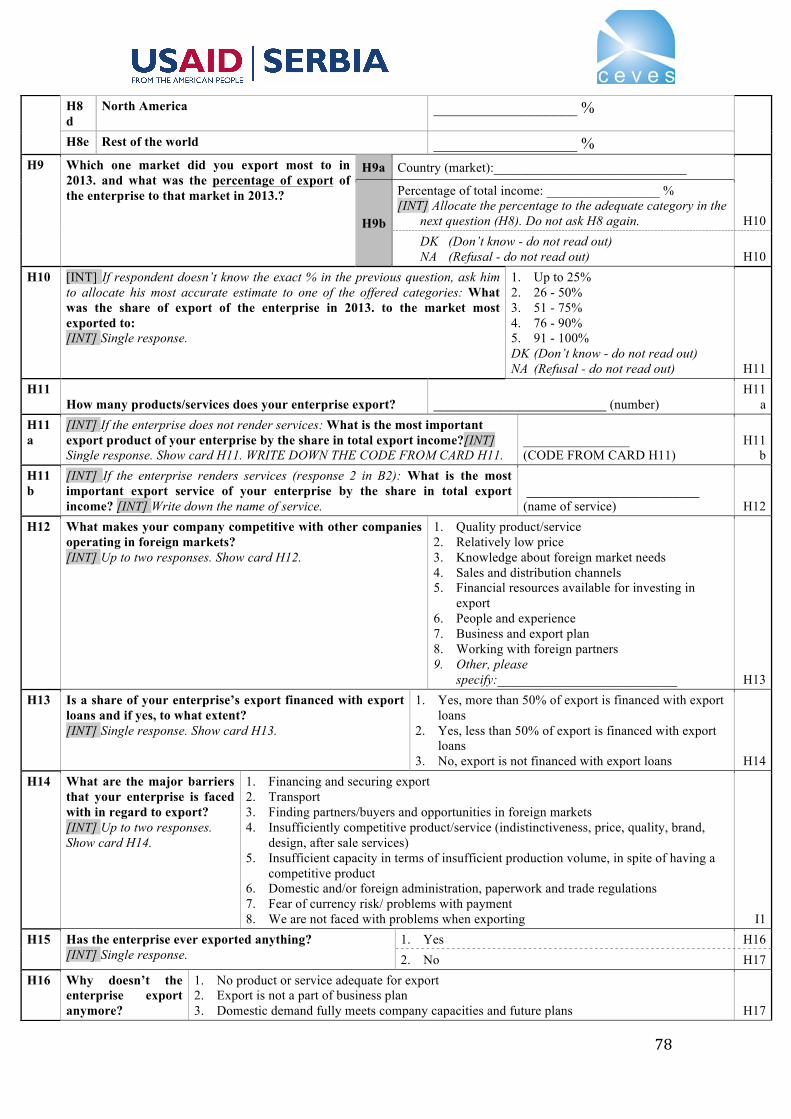
78
H8d
North America __________________ %
H8e Rest of the world __________________ % H9 Which one market did you export most to in
2013. and what was the percentage of export of the enterprise to that market in 2013.?
H9a Country (market):_____________________________
H10 H9b
Percentage of total income: _________________ % [INT] Allocate the percentage to the adequate category in the
next question (H8). Do not ask H8 again. DK (Don’t know - do not read out) NA (Refusal - do not read out) H10
H10 [INT] If respondent doesn’t know the exact % in the previous question, ask him to allocate his most accurate estimate to one of the offered categories: What was the share of export of the enterprise in 2013. to the market most exported to: [INT] Single response.
1. Up to 25% 2. 26 - 50% 3. 51 - 75% 4. 76 - 90% 5. 91 - 100% DK (Don’t know - do not read out) NA (Refusal - do not read out) H11
H11 How many products/services does your enterprise export?
__________________________ (number)
H11a
H11a
[INT] If the enterprise does not render services: What is the most important export product of your enterprise by the share in total export income?[INT] Single response. Show card H11. WRITE DOWN THE CODE FROM CARD H11.
________________ (CODE FROM CARD H11)
H11b
H11b
[INT] If the enterprise renders services (response 2 in B2): What is the most important export service of your enterprise by the share in total export income? [INT] Write down the name of service.
__________________________ (name of service) H12
H12 What makes your company competitive with other companies operating in foreign markets? [INT] Up to two responses. Show card H12.
1. Quality product/service 2. Relatively low price 3. Knowledge about foreign market needs 4. Sales and distribution channels 5. Financial resources available for investing in
export 6. People and experience 7. Business and export plan 8. Working with foreign partners 9. Other, please
specify:___________________________ H13 H13 Is a share of your enterprise’s export financed with export
loans and if yes, to what extent? [INT] Single response. Show card H13.
1. Yes, more than 50% of export is financed with export loans
2. Yes, less than 50% of export is financed with export loans
3. No, export is not financed with export loans H14 H14 What are the major barriers
that your enterprise is faced with in regard to export? [INT] Up to two responses. Show card H14.
1. Financing and securing export 2. Transport 3. Finding partners/buyers and opportunities in foreign markets 4. Insufficiently competitive product/service (indistinctiveness, price, quality, brand,
design, after sale services) 5. Insufficient capacity in terms of insufficient production volume, in spite of having a
competitive product 6. Domestic and/or foreign administration, paperwork and trade regulations 7. Fear of currency risk/ problems with payment 8. We are not faced with problems when exporting I1
H15 Has the enterprise ever exported anything? [INT] Single response.
1. Yes H16 2. No H17
H16 Why doesn’t the enterprise export anymore?
1. No product or service adequate for export 2. Export is not a part of business plan 3. Domestic demand fully meets company capacities and future plans H17

79
[INT] READ OUT TO RESPONDENT: Now we would like to talk about financing of your enterprise. As we have said already – although the questions are not intended to interfere in privacy of your enterprise operations, all responses and information are anonymous and Ipsos Strategic Marketing and CEVES guarantee their anonymity.
[INT] Up to three responses. Show card H16.
4. Difficulties with finding buyers out of the country even besides having a product or service adequate for export
5. Concern about complicated paperwork 6. Lack of means for financing export 7. Other, please specify:________________________________________
H17 Does the enterprise have a plan to initiate and start sale of its products/ services in foreign markets in the next 12 months? [INT] Single response.
1. Yes, we are working on it successfully, but we are faced with serious barriers
2. Yes, we are working on it successfully, but we are faced with some barriers
3. Yes, but barriers disable conducting of this plan at the moment 4. No, it is not planned 5. It is a part of our plan, but we are not working on it currently I1
I Funding I1 What are the most
important modes of financing of your enterprise? [INT] Up to three responses. Show card I1.
1. Self-financing from retained earnings/ personal funds 2. Loans from family/ friends 3. Trade loans (deferred payment) 4. Loans of domestic banks 5. Loans of foreign banks 6. Mother company funds 7. Other sources: state (subsidies, startup, development loans), private investors (investment
funds)...etc. 8. Other, please specify:_________________________________________ 9. NA (Refusal - do not read out) I2
I2 Does your enterprise currently have a bank loan? [INT] Single response.
1. Yes 2. No NA (Refusal - do not read out) I3
I3 Has your enterprise ever taken a bank loan and when? [INT] Multiple responses.
1. Yes, till the end of 2008. 2. Yes, since 2009. 3. No NA (Refusal - do not read out) I4
I4 [INT] If 1 in I2 or 1 or 2 in I3: Which of the following bank loan products have you used? Multiple responses. [INT] Circle single response per line.
I5
Type of loan product I4.1 Yes/No I4a Short-term loans for working capital 4. Yes 5. No NA I4b Long-term loans for working capital 6. Yes 7. No NA I4c Investment loans 8. Yes 9. No NA I4d Liquidity loans 10. Yes 11. No NA I4e Revolving credits 12. Yes 13. No NA I4f Account overdraft 14. Yes 15. No NA I4g Refinancing 16. Yes 17. No NA
I5 [INT] If 1 in I2 or 1 or 2 in I3: What did you mainly use the loans obtained from commercial banks for? [INT] Up to two responses. Show card I5.
18. Purchase of lease of land/ buildings 19. Purchase/ repair of machinery, equipment... 20. Equipping the fleet 21. Refinancing loans 22. Improving liquidity 23. Investing in production process (new technology, standards, branding,
quality) 24. Increase of stocks I8

80
25. Other, please specify: _____________________________________ NA (Refusal - do not read out)
I8 [INT] If 2 in I2 and 3 in I3: Are you generally interested in taking a bank loan for financing of your business? [INT] Single response. Show card I8.
26. Yes, it is our plan and we believe that we will get the loan 27. Yes, but we were refused by the bank 28. Yes, but I don’t think/ I don’t know whether I can get a loan 29. No, because of unfavorable loan repayment conditions 30. No, because of strict conditions for taking a loan I10 31. No, I don’t need a loan I9
I9 If you think that you don’t need a loan currently, would you still apply in a bank if: [INT] Multiple responses. Show card I9.
32. The demand for your products and services was increased in the local and// or foreign markets
33. The resources became more available (raw materials, energy, equipment) meaning better prices, quality or adequacy for your business operations
34. Better offer of adequate staff (cheaper or of better quality) 35. I wouldn’t apply for a loan I12
I10 [INT] If 1 and/ or 2 in I8: What do most common bank remarks refer to when your enterprise applies for a loan? [INT] Up to two responses. Show card I10.
36. Amount of operating revenue 37. Amount of net/ operating profit 38. Debt ratio 39. Inadequate amount of net cash flow (poor
liquidity) 40. Incomplete documents 41. Insufficient collateral 42. Credit history (poor or none) 43. Unstable enterprise’s industry 44. There were no remarks from the bank 45. Other, please
specify:_________________________ I11 I11 Would you take a new loan from banks operating
in Serbia, under the current operating terms of your enterprise, if any of the following elements changed for the better? [INT] Up to two responses. Show card I11.
46. Interest rate 47. Volatility of interest rates 48. Duration of loan 49. Mortgage 50. Amount of annuity 51. Loan currency 52. Help with preparing documents and applying 53. I wouldn’t take a loan (again), regardless of conditions 54. Other, please specify:____________________________ I12
I12 If you were not able to pay your suppliers or employees at the agreed time (lack of payment funds, which you think would last for two months), how would you handle it? [INT] Multiple responses. Show card I12.
55. Borrowing from family/ friends 56. Loan from a local commercial bank 57. Loan from a bank abroad 58. I would ask creditor (suppliers) to wait a while 59. I would ask creditor (employees) to wait a while 60. Other, please specify: ___________________________ I13
I13 How many times did it happen in 2013 that employees waited more than 15 days for their income for the previous month? [INT] Write down the number.
________________________________ (number of times)
Never NA (Refusal - do not read out) I14
I14 Has it ever happened that your enterprise account is blocked? [INT] Single response.
61. Yes, it is blocked currently 62. Yes, it used to be blocked I15 63. No, never NA (Refusal - do not read out) J1
I15 For how many days was your enterprise account blocked the longest? [INT] Write down the number of days.
______________________ (number of days) NA (Refusal - do not read out) J1
J State J1 Has an inspection visited your enterprise in the past 12 months? 64. Yes J2

81
[INT] READ OUT TO RESPONDENT: We are now going to talk about founding of your enterprise and its ownership structure.
[INT] Single response. 65. No NA (Refusal - do not read out) K1
J2 How many times have inspections visited your enterprise? By this we mean total number of visits of all inspections that have visited your enterprise in the past 12 months. [INT] Single response.
_______________________ (number of times) J3
J3 Which inspections have visited your enterprise in the past 12 months? [INT] Multiple responses. WRITE DOWN CODES OF ALL INSPECTIONS THAT VISITED THE ENTERPRISE. Card J3.
66. _______________________ (code) 67. _______________________ (code) 68. _______________________ (code) 69. _______________________ (code) 70. _______________________ (code) 71. _______________________ (code) 72. Other, please
specify:__________________ DK (Don’t know - do not read out) NA (Refusal - do not read out)
K1
K Ownership structure K1 Does your enterprise have one or several owners?
[INT] Single response. 73. One 74. Several K2
K2 Please tell us something about the current owners of the enterprise – their legal status and the number of each? [INT] Single response per line. If a given legal entity is not owner of the enterprise, write down ’0’
K3
K2.1 Enterprise owners K2.2 Number of entities K2a Domestic natural persons K2b Foreign natural persons K2c Domestic private legal entities K2d State (any form) K2e Foreign legal entities
K3 [INT] If 2 in K1. What is the ownership share, in percentages, of the entity with the biggest share? [INT] Write down.
_______________________ (%) [INT] Allocate the percentage to the adequate category in the next question (K4). Do not ask K4 again. K4 DK (Don’t know - do not read out) NA (Refusal - do not read out) K4
K4 [INT] If 2 in K1 and if respondent doesn’t know the exact % in the previous question, ask him to allocate his most accurate estimate to one of the offered categories. What is the ownership share, in percentages, of the entity with the biggest share? [ANK Single response. Show card K4.
1. Up to 25% 2. 26 - 50% 3. 51 - 75% 4. 76 - 90% 5. 91 – 100%
DK (Don’t know - do not read out) NA (Refusal - do not read out) K5
K5 [INT] If ’0’ in K2d: Is the enterprise private from its establishing?[INT] Single response.
1. Yes 2. No
K6 K6 [INT] If 2 in K1. Is the enterprise a family one, or do
members of one family have more than 50% ownership and has it always been like that? [INT] Single response. Show card K6.
3. Yes, the enterprise is a family one today, but it didn’t use to be
4. Yes, the enterprise has always been a family one 5. No
K7

82
K7 [INT] If 2 in K1 and if there are foreign owners, i.e. if there is no ’0’ in K2b and K2e: What is the ownership share of foreign entities? [INT] Write down the percentage.
__________________ (%)
NA (Refusal - do not read out) K8 K8 [INT] All respondents. Is the enterprise founder
among the current owners (or founders if several)?[INT] Single response.
6. Yes, founders are still the only owners 7. Yes, but there are also other owners 8. No K9
K9 [INT]If 2 or 3 in K8: How did the current enterprise owners, who are not founders, obtain their share? [INT] Multiple responses.
9. They inherited a share in enterprise/ enterprise (family/friendly ties with founders)
10. They bought a share of enterprise/ enterprise 11. They used to work in the enterprise 12. Other____________________________________ K10
K10 [INT] If 2 in K9: How long did it take for owners who purchased a share of the enterprise/ enterprise, to have their investment pay off (to return the invested resources)?
_____________________ (months) 99. Not yet DK (Don’t know - do not read out) K11
K11 [INT] If 2 in K9: After purchasing a share of the enterprise/ enterprise by current owners, business volume has: [INT] Single response.
13. Increased considerably 14. Increased somewhat 15. Stayed the same 16. Decreased somewhat 17. Decreased considerably K13
K13 [INT] All respondents. How were the enterprise founders related at the time of starting this business? [INT] Multiple responses. Show card K13.
18. Family ties 19. Friends 20. Expert/ professional 21. Common experience from past projects 22. There was only one enterprise founder 23. Other_______________________________________ K14
K14 [INT] All respondents. What was the main motive that stimulated the founder(s) to start this business and start this enterprise? [INT] Single response.
24. Using a good business opportunity 25. Lack of other, better options 26. Both 27. I wanted to practice that
DK (Don’t know - do not read out) K15 K15 [INT] All respondents. How did the
enterprise finance its first steps, such as foundation, start of business operations and active inclusion in the market? [INT] Show card K15. Multiple responses.
28. Own resources 29. Loan from family/ friends 30. Bank start-up credit for enterprise 31. Bank loan approved for a natural person, used for establishing a
company 32. Trade loan 33. Financial assistance by the state and state institutions 34. Other:______________________________________ K16
K16 [INT] If ’0’ in K2d: At the moment of starting the business, did the enterprise founders have experience and knowledge about the enterprise’s field of activity, which helped them establish the enterprise and start business activities? [INT] Single response per line.
L1
K16a Yes, they attended adequate secondary vocational school 1.Yes 2. No DK (Don’t know - do not read out)
K16b Yes, they attended adequate faculty 1.Yes 2. No DK (Don’t know - do not read out)
K16c Yes, they were mainly self-taught (self-education/Internet) 1.Yes 2. No DK (Don’t know - do not read out)
K16d Yes, they attended training sessions 1.Yes 2. No DK (Don’t know - do not read out)
K16e Yes, they had the same/ similar job in private enterprise in Serbia 1.Yes 2. No DK (Don’t know - do not read out)
K16f Yes, they had the same/ similar job in private enterprise abroad 1.Yes 2. No DK (Don’t know - do not read out)
K16g Yes, they had the same/ similar job in a state enterprise 1.Yes 2. No DK (Don’t know - do not

83
[INT] READ OUT TO RESPONDENT: Finally, I will ask you a few questions about your company's plans for the future.
read out) K16h Yes, it’s a family trade, from generation to generation 1.Yes 2. No DK (Don’t know - do not
read out) K16i They were advised by their family/friends/colleagues/experts... 1.Yes 2. No DK (Don’t know - do not
read out) K16j They had no considerable knowledge or experience about the business
they started 1.Yes 2. No DK (Don’t know - do not
read out)
L Investing L1 Do you wish to expand your business operations and
grow into a bigger company? [INT] Single response.
35. Yes L2 36. No
L3 L2 What are your
expectations regarding expansion of your business operations? [INT] Single response.
37. I don’t think that I will be able to provide adequate financial resources for that in the near future
38. I think that I will be able to provide adequate financial resources for that in the near future DK (Don’t know - do not read out) NA (Refusal - do not read out) L3
L3 Does your enterprise have a (business) development and growth plan, based on predictions of future circumstances and business environment, as well as on analysis of financial data? [INT] Single response.
1. Yes, the plan is formal and written 2. Yes, I do have a plan, but it I snot formal 3. No
L4 L4 Which of the following are the key external
problems/barriers for potential development/ growth of enterprise? [INT] Up to two responses. Show card L4.
4. Lack of skilled labor force and staff 5. Limited demand for company products 6. Financing of growth 7. Administrative and legal regulations 8. Growing costs of materials and raw materials 9. Strengthening of competition 10. We have no problems/ barriers for growth/ development
of enterprise 11. Other ____________________
L5
L5 Do you need counseling in regard to growth and development, and especially with growth financing sources? [INT] Single response.
12. Yes 13. No L6
L6 Do you expect to hire more staff in the next 12 months, regardless of the type of contract with them, and how many? [INT] Single response.
14. Yes, but we don’t know how many exactly 15. Yes, we need ___ employees 16. No, we will keep the same number 17. We will have to reduce the number of employees, given the situation
awaiting us L7 L7 How do you expect your income to change in the next 12
months? [INT] Single response.
18. It will grow L8 19. It will stay the same Dem1 20. It will fall DK (Don’t know - do not read out) L9
L8 For how much will it grow? [INT] Write down.
21. Up to 10% 22. 11 - 30% 23. 31% - 50% 24. 51% - 75%% 25. 76% – 100% 26. More than 100% DK (Don’t know - do not read out) NA (Refusal - do not read out)
Dem1
L9 For how much will it fall? [INT] Write down.
1. Up to 10% 2. 11 - 30%
Dem1
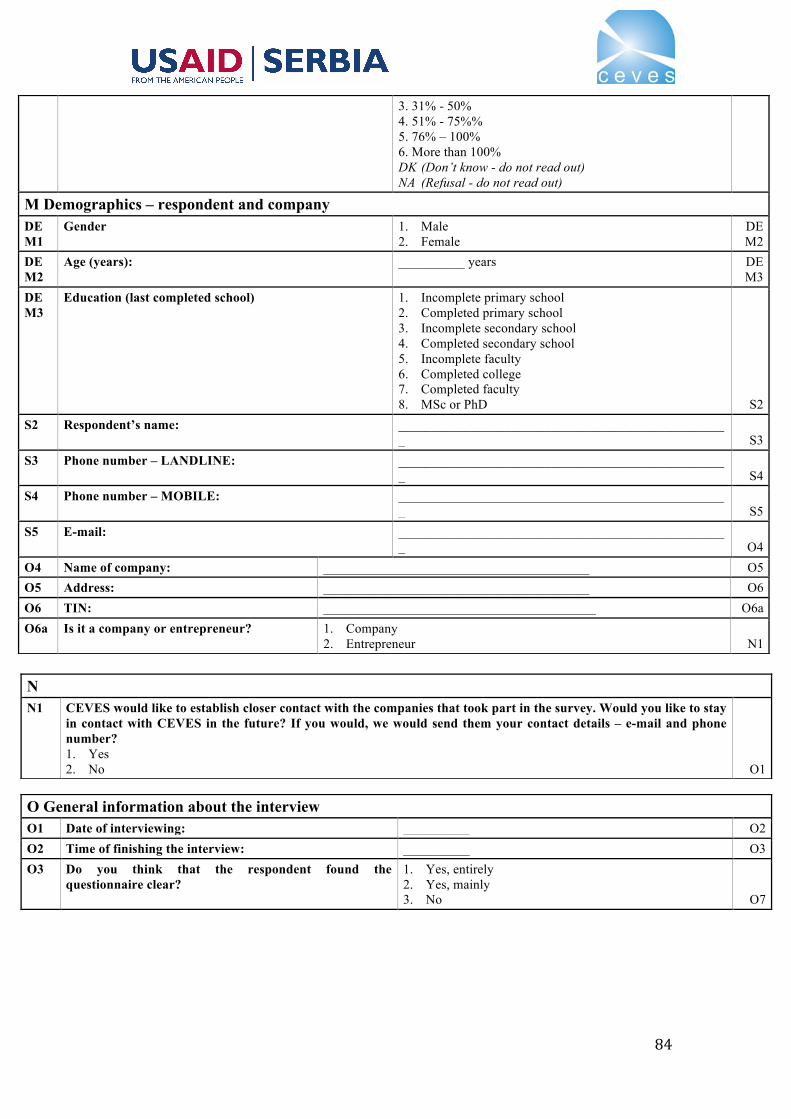
84
3. 31% - 50% 4. 51% - 75%% 5. 76% – 100% 6. More than 100% DK (Don’t know - do not read out) NA (Refusal - do not read out)
M Demographics – respondent and company DEM1
Gender 1. Male 2. Female
DEM2
DEM2
Age (years): __________ years DEM3
DEM3
Education (last completed school) 1. Incomplete primary school 2. Completed primary school 3. Incomplete secondary school 4. Completed secondary school 5. Incomplete faculty 6. Completed college 7. Completed faculty 8. MSc or PhD S2
S2 Respondent’s name: __________________________________________________ S3
S3 Phone number – LANDLINE: __________________________________________________ S4
S4 Phone number – MOBILE: __________________________________________________ S5
S5 E-mail: __________________________________________________ O4
O4 Name of company: ________________________________________ O5 O5 Address: ________________________________________ O6 O6 TIN: _________________________________________ O6a O6a Is it a company or entrepreneur? 1. Company
2. Entrepreneur N1
N N1 CEVES would like to establish closer contact with the companies that took part in the survey. Would you like to stay
in contact with CEVES in the future? If you would, we would send them your contact details – e-mail and phone number? 1. Yes 2. No O1
O General information about the interview O1 Date of interviewing: __________ O2 O2 Time of finishing the interview: __________ O3 O3 Do you think that the respondent found the
questionnaire clear? 1. Yes, entirely 2. Yes, mainly 3. No O7

85
O7 Interviewer’s name: _________________________________________ O8 O8 Interviewer’s ID: _________________________________________ End