survey of the favorable conditions for magnetosonic wave...
TRANSCRIPT

Originally published as:
Kim, K.-C., Shprits, Y. (2018): Survey of the Favorable Conditions for Magnetosonic Wave Excitation. - Journal of Geophysical Research, 123, 1, pp. 400—413.
DOI: http://doi.org/10.1002/2017JA024865
Survey of the Favorable Conditionsfor Magnetosonic Wave ExcitationKyung-Chan Kim1 and Yuri Shprits2,3,4
1Division of Science Education, College of Education, Daegu University, Gyeongsan, Gyeongbuk, South Korea, 2HelmholtzCentre Potsdam, GFZ German Research Centre for Geosciences, Potsdam, Germany, 3Institute of Physics and Astronomy,University of Potsdam, Potsdam, Germany, 4Department of Earth, Planetary, and Space Sciences, University of California,Los Angeles, CA, USA
Abstract The ratio of the proton ring velocity (VR) to the local Alfven speed (VA), in addition to proton ringdistributions, plays a key factor in the excitation of magnetosonic waves at frequencies between the protoncyclotron frequency fcp and the lower hybrid resonance frequency fLHR in the Earth’s magnetosphere. Herewe investigate whether there is a statistically significant relationship between occurrences of proton ringsand magnetosonic waves both outside and inside the plasmapause using particle and wave data from VanAllen Probe-A during the time period of October 2012 to December 2015. We also perform a statistical surveyof the ratio of the ring energy (ER, corresponding to VR) to the Alfven energy (EA, corresponding to VA) todetermine the favorable conditions under which magnetosonic waves in each of two frequency bands(fcp < f ≤ 0.5 fLHR and 0.5 fLHR < f < fLHR) can be excited. The results show that the magnetosonic waves inboth frequency bands occur around the postnoon (12–18 magnetic local time, MLT) sector outside theplasmapause when ER is comparable to or lower than EA, and those in lower-frequency bands (fcp < f ≤ 0.5fLHR) occur around the postnoon sector inside the plasmapause when ER/EA > ~9. However, there is onediscrepancy between occurrences of proton rings and magnetosonic waves in low-frequency bands aroundthe prenoon sector (6–12 MLT) outside the plasmapause, which suggests either that the waves may havepropagated during active time from the postnoon sector after being excited during quiet time, or they mayhave locally excited in the prenoon sector during active time.
1. Introduction
Fast magnetosonic waves (first called equatorial noise by Russell et al., 1970) are whistler-mode electromag-netic emissions observed in the Earth’s magnetosphere occurring in the frequency range between the protoncyclotron frequency (fcp) and the lower hybrid resonance frequency (fLHR). These waves are also named as ionBernstein waves, which are perhaps more appropriate term in theoretical point of view not to be confusedwith the traditional “magnetosonic” mode that exists much below fcp in magnetohydrodynamics theory(Gary et al., 2010). In this manuscript we will simply use phenomenologically described term “magnetosonicwave” common in recent literature. They are usually observed within a few degrees of the magnetic equatorboth outside and inside the plasmasphere and propagate at sufficiently large angles to the ambient mag-netic field (Hrbáčková et al., 2015; Kasahara et al., 1994; Kim & Chen, 2016; Laakso et al., 1990; Ma et al.,2013; Meredith et al., 2008; Russell et al., 1970; Santolík et al., 2002). Recently, much attention has been paidto the properties and spatial distribution of the magnetosonic waves and their possible role in the radiationbelt dynamics contributing to both acceleration and loss of relativistic electrons (e.g., Horne et al., 2007;Shprits, 2016; Shprits et al., 2013). It is generally accepted that a ring distribution of protons with positive gra-dient in the phase space density provides a source of free energy for the excitation of magnetosonic waves,which forms at energies of the order of 10 keV (Balikhin et al., 2015; Boardsen et al., 1992; Chen et al., 2010,2011; Curtis & Wu, 1979; Horne et al., 2000; Ma et al., 2014; Perraut et al., 1982). Theoretical analysis and simu-lations have verified excitation of fast magnetosonic waves (Convery & Gary, 1997; Gary et al., 2010; Liu et al.,2011; Min et al., 2017; Umeda et al., 2007, 2012).
The ratio of the ring energy (ER), corresponding to the peak in the phase space density (PSD), to the Alfvenenergy (EA), corresponding the local Alfven speed that is related to the total plasma density and the back-ground magnetic field intensity, is a key factor controlling the excitation of magnetosonic waves. Horneet al. (2000) suggested that wave growth is possible when the ring velocity (VR) exceeds the Alfven speed(VA) within a factor of 2. Meredith et al. (2008) made the first observational attempt, using particle and
KIM AND SHPRITS SURVEY OF THE FAVORABLE CONDITIONS FOR MAGNETOSONIC WAVE EXCITATION 400
PUBLICATIONSJournal of Geophysical Research: Space Physics
RESEARCH ARTICLE10.1002/2017JA024865
Key Points:• There is a statistically significantrelationship between occurrences ofproton rings andmagnetosonic waves
• We statistically examine how the ratioof the ring energy to the Alfvenenergy affect magnetosonic waveexcitation
• Different values of the ratio forexciting magnetosonic waves outsideand inside the plasmapause are found
Correspondence to:K.-C. Kim,[email protected]
Citation:Kim, K.-C., & Shprits, Y. (2018). Survey ofthe favorable conditions for magneto-sonic wave excitation. Journal ofGeophysical Research: Space Physics, 123,400–413. https://doi.org/10.1002/2017JA024865
Received 8 OCT 2017Accepted 28 DEC 2017Accepted article online 3 JAN 2018Published online 17 JAN 2018
©2018. American Geophysical Union.All Rights Reserved.

wave data from the Combined Release and Radiation Effects Satellite (CRRES), to understand a link betweenproton ring distributions and magnetosonic waves in the frequency band 0.5 fLHR< f< fLHR during geomag-netically active conditions. They found the close coincidence between the magnetic local time (MLT) distri-butions of the observed wave amplitude and proton ring distributions satisfying ER > EA. However, theyalso found the enhanced waves in the dawn sector outside the plasmapause that do not satisfy ER > EA.More recently, Chen et al. (2010) presented, based on ring current ion simulation during the storm mainphase incorporating the Rice Convection Model into Ring Current-Atmospheric Interactions Model, theexcited frequency dependence according to the ratio ER/EA and suggested that the unstable frequency bandof waves inside the plasmapause becomes lower than outside due to an increase in plasma density, leadingto an increase in the ratio ER/EA. Ma et al. (2014) also presented the different values of ER/EA for exciting mag-netosonic waves in three different regions, outside, near, and deep inside the plasmapause, based on a casestudy comparing the Time History of Events and Macroscale Interactions during Substorms observations andwave growth rate estimated using plasma instability analysis.
The goal of this study is to present a comparison of global distributions of proton rings and magnetosonicwaves and to determine critical values of the ratio ER/EA under which magnetosonic waves are likely to beexcited. For this study, we perform a statistical survey of the occurrences of proton ring distributions andmagnetosonic waves both outside and inside the plasmapause using particle and wave data from VanAllen Probe-A during the time period of October 2012 to December 2015, which is in line with the previousstudy of Meredith et al. (2008), but we extend the analysis to lower-frequency bands (fcp < f ≤ 0.5 fLHR) withthe extensive coverage over all MLT sectors from Van Allen Probe-A while they only focused on upper-frequency bands (0.5 fLHR < f < fLHR) with the lack of wave coverage on the dawn sector using CRRES.Previous studies (Chen et al., 2010, 2011; Ma et al., 2014) suggested, based only on specific events, that wavegrowth is possible even if ER is slightly lower than or comparable to EA. However, there has been no statisticalanalysis that examines how the ratio ER/EA affect magnetosonic wave excitation. Thus, in this study, we per-form a statistical survey of the ratio ER/EA and compare it with the distribution of magnetosonic waves sepa-rately in two frequency bands, the low (fcp < f ≤ 0.5fLHR) and high (0.5fLHR < f < fLHR) bands.
The remainder of this paper is organized as follows. The global distributions of energetic protons in terms offlux and PSD both outside and inside the plasmapause under various levels of magnetic activity arepresented in section 2, the relation between occurrences of magnetosonic waves and proton rings ispresented in section 3, the global distributions of the ratio ER/EA and magnetosonic waves separately intwo frequency bands are presented in section 4, and the discussion and conclusions are given in sections 5and 6, respectively.
2. Spatial Distribution of Energetic Protons
The twin Van Allen Probes have operated in a highly elliptical geosynchronous transfer orbit since theirlaunch on 30 August 2012, with an apogee of ~5.8 RE, a perigee of ~700 km, an inclination of ~10°, and a per-iod of ~9 h (Mauk et al., 2012). For this study, we use proton fluxes from the Helium Oxygen Proton Electron(HOPE) plasma spectrometer, a part of the Energetic particle, Composition, and Thermal plasma (ECT) suite(Funsten et al., 2013) on board the Van Allen Probes. The ECT/HOPE provides the proton differential fluxesin the pitch angle range from 0° to 180° with a resolution of ~15° in the energy ranges 1 eV< E< 50 keV with36 logarithmic spaced energy channels.
To understand how energetic particles injected during substorms form an unstable proton ring distribution,we first show in Figure 1 the global distribution of the proton differential flux for a pitch angle of 90°, j⊥, out-side the plasmapause during three levels of geomagnetic activity, measured by AE* (the maximum value ofthe AE index in the previous 3 h) for protons of energy between 527 eV and 20686 eV. Here the average valueof the data collected as a function of L* in steps of 0.2 L* for 2 ≤ L* ≤ 6 and MLT with 1 h intervals during thetime period of October 2012 to December 2015 from Van Allen Probe-A ECT/HOPE is displayed using a loga-rithmic scale regardless of whether the magnetosonic waves occur. The L* parameter used in this study isrelated to the third adiabatic invariant and has physical meaning of the radial distance from the center ofthe Earth to the equatorial crossing points of a drift shell on which particles drift about the Earth if the mag-netic field is adiabatically changed to a dipole (Roederer, 1970). Database for the L* and MLT is taken fromVan Allen Probes-ECT data portal (https://rbsp-ect.lanl.gov/data_pub/rbspa), and we simply assumed
Journal of Geophysical Research: Space Physics 10.1002/2017JA024865
KIM AND SHPRITS SURVEY OF THE FAVORABLE CONDITIONS FOR MAGNETOSONIC WAVE EXCITATION 401

locally mirroring particles at the satellite location in the use of L* using the TS04D (Tsyganenko & Sitnov, 2005)magnetic field model. Only the measurements made within 10° of the magnetic equator were considered,and data in the region L* ≤ 2 were removed due to the possibility of contamination for the protonradiation belt. The plasmapause location is identified using wave spectra from a single electric componentof waves between 10 kHz and 400 kHz from the High-Frequency Receiver (HFR), a part of the Electric andMagnetic Field Instrument Suite and Integrated Science (EMFISIS) instrumentation suite (Kletzing et al.,
Figure 1. Global average proton flux maps for five energy channels outside the plasmapause during different activity levels of AE*. The number of samples in eachpanel is displayed in the small panel. Only the bins with the number of data of >100 were displayed.
Journal of Geophysical Research: Space Physics 10.1002/2017JA024865
KIM AND SHPRITS SURVEY OF THE FAVORABLE CONDITIONS FOR MAGNETOSONIC WAVE EXCITATION 402

2013), when a sudden change in intensity of the electrostatic electron-cyclotron harmonic (ECH) waves,integrated over the frequency range between 2.5 fce (fce is the electron gyrofrequency) and 5.0 fce, isdetected per half orbit, since high intensity of the ECH is usually observed outside the plasmapause(Meredith et al., 2004). In addition, the appearance and disappearance of the whistler mode chorusbetween 0.1fce and 0.8fce and plasmaspheric hiss between 40 Hz and 2 kHz from the Waveform Receiver(WFR), another part of EMFISIS, and a sharp gradient in plasma density, inferred from EMFISIS, are used tomanually modify the plasmapause’s location determined above. An example will be given in Figure 4.
The nightside proton flux for all energies increases with increasing AE* by roughly half an order of magnitudefor each level. During active conditions, particles can penetrate as low as L* = 3, and the flux peak tends toshift from the prenoon sector toward the midnight sector with increasing energy, due to the energy-dependent drift, that is, westward gradient-curvature drift that is dominant for>10 keV and eastward electricfield drift that is dominant for several keV (Korth et al., 1999; Lyons & Williams, 1984). With the accompanyingshift in peak of flux, the region where proton flux for ≥972 keV remains low shifts from the postnoon towardthe prenoon sector with increasing energy regardless of geomagnetic activity (though it is clearly seen foractive conditions), possibly either due to lack of protons that access that region after substorm injection orloss of protons by charge exchange and/or Coulomb collisions (Fok et al., 1995, 1996; Jordanova et al.,1996, 1999).
The global distribution of proton energy fluxes inside the plasmapause is shown in Figure 2, in the same for-mat as Figure 1. Proton fluxes inside the plasmapause are generally lower than those outside the plasma-pause (note the different color scales in Figures 1 and 2) but with no discernable dependence on AE*. Aninteresting feature is that, as shown in Figure 1, the MLT region of the flux dip tends to be around the post-noon sector for low-energy protons (≤ 972 eV) and around the prenoon sector for high-energy protons(> 972 eV).
To examine how such variations in flux are seen in variations in PSD, we converted the proton differential fluxat each measurement into PSD using
f ⊥ ¼ 0:5449·j⊥E
(1)
where f⊥ is the PSD given in m�6 s3, j⊥ is the proton differential flux with 90° pitch angle in units ofcm�2 s�1 sr�1 keV�1, E is the effective energy of the proton energy channel in keV, and 0.5449 is a conversionfactor from j⊥ to f⊥ for protons (Lyons & Williams, 1984).
The average PSD f⊥ variation as a function of energies up to ~50 keV for four MLT sectors (0–6 MLT, 6–12 MLT,12–18 MLT, and 18–24 MLT) and three AE* activities (AE* < 100 for quiet, 100 ≤ AE* ≤ 300 for moderate, andAE*> 300 nT for active) is presented in Figures 3a and 3b, each for outside and inside the plasmapause. Herethe PSD f⊥ at a given energy is estimated by first sorting and averaging the converted PSD f⊥ using equa-tion (1) at each measurement in each 0.2 L* and 1 MLT bin and then averaging all PSDs across all L* in eachMLT sector at a given energy.
A proton ring distribution is present around the postnoon sector (12 ≤MLT< 18, third columns) on both sidesof the plasmapause, having the peak energy of the proton ring at ~10 keV outside the plasmapause and atslightly lower energy inside the plasmapause, with a weak dependence on AE* (though it becomes clearer forlow activity). It is also found in the prenoon sector (6 ≤ MLT < 12) outside the plasmapause with a peakenergy of ~10 keV during quiet time. Note that the less pronounced ring distributions are due to averagingthat might reduce the peak in phase space density. Consequently, we can see from Figures 1–3 that varia-tions in flux around the prenoon and postnoon sectors driven by the energy-dependent drift and loss leadto proton ring distributions in PSD at the energies of ~10 keV, consistent with previous studies (e.g.,Boardsen et al., 1992, Horne et al., 2000, Thomsen et al., 2011).
3. Spatial Distribution of Proton Rings and Magnetosonic Waves
Proton rings with positive gradient in the perpendicular velocity distribution to the magnetic field provide asource of free energy that can excite magnetosonic waves. Here we present the global distributions of theproton rings in velocity space and the magnetosonic waves for both sides of the plasmapause to examinethe relationship between them.
Journal of Geophysical Research: Space Physics 10.1002/2017JA024865
KIM AND SHPRITS SURVEY OF THE FAVORABLE CONDITIONS FOR MAGNETOSONIC WAVE EXCITATION 403

We first introduce the methodology that identifies the proton rings and the magnetosonic wave signals fromVan Allen Probe-A. Proton ring distributions from the perpendicular PSD as a function of energy, f⊥(E),smoothed using a moving average filter for every measurement, are identified using the following condi-tions: (1) the value of f⊥ increases continuously over at least three consecutive energy channels; (2) the f⊥of the peak is larger than 10�15 m�6 s3 (which is comparable to that of Horne et al., 2000); and (3) a cleardip of f⊥, whose f⊥ value is smaller than all other f⊥ values at energies close to the peak energy, exists. The
Figure 2. The same as in Figure 1 but for the case inside the plasmapause.
Journal of Geophysical Research: Space Physics 10.1002/2017JA024865
KIM AND SHPRITS SURVEY OF THE FAVORABLE CONDITIONS FOR MAGNETOSONIC WAVE EXCITATION 404

criteria can be satisfied at multiple peak energies in the energy range of interest (1–50 keV). In such cases, weidentify the peak with the lowest energy as the proton ring. Highly obliquemagnetosonic waves are capturedfrom wave spectra covering the frequency range from 10 Hz up to 12 kHz for all three components of bothmagnetic and electric fields from EMFISIS/WFR when the criteria of wave normal angle of ≥80° and theabsolute value of wave ellipticity of ≤0.2 both sides of the plasmapause (Li et al., 2015; Ma et al., 2016;Němec et al., 2013) using the singular value decomposition method (Santolík et al., 2003) are satisfied. Inthis study, we simply identified highly oblique magnetosonic waves in a conventional way assumingemissions that typically have large wave normal angles close to ~90° and low ellipticity close to 0 (andthus nearly linearly polarized). Note that our database of wave emission might also contain other types ofwaves, mostly kinetic Alfven waves that are right-hand polarized and magnetically compressive waves likemagnetosonic waves (e.g., Moya et al., 2015; Salem et al., 2012) or they might miss zipper-likemagnetosonic waves that have ellipticity higher than 0 (e.g., Li et al., 2017).
An example of the variation in PSD f⊥ observed by Van Allen Probe-A on 13 November 2012 is present inFigure 4a, overlaid with ring energy (black dot), dip energy (white dot), and Alfven energy (blue line). Herethe Alfven energy (EA) is estimated using
EA ¼ 12mpV
2A (2)
where the Alfven speed (VA) is obtained by assuming single-ion (H+) plasma and given by
VA ¼ Bffiffiffiffiffiffiffiffiffiffiffiffiffiffiμ0mpN
p (3)
where μ0 is the vacuum permeability, mp is the proton mass, N is the plasma number density, inferred fromEMFISIS by applying the Neural-network-based Upper hybrid Resonance Determination algorithm(Zhelavskaya et al., 2016), and B is the background magnetic field intensity, taken from measurements fromEMFISIS. Figures 4b–4g show wave spectra of electric field from HFR overlaid with harmonics of fce up to 5.0fce (Figure 4b), wave spectra of magnetic and electric field from WFR (Figures 4c and 4d), wave normal angle(Figure 4e), signed ellipticity (Figure 4f), and wave flag (Figure 4g). In Figures 4c–4f, curves for fce, 0.5fce, 0.1fce,fLHR, 0.5fLHR, and fcp, from top to bottom, are overlaid. The value of fLHR is estimated as
ffiffiffiffiffiffiffiffiffiffiffiffif cpf ce
p. In Figure 4g,
the identified magnetosonic wave signals are indicated by black and red for regions outside and inside theplasmapause, respectively. The vertical black and blue lines indicate, respectively, the plasmapause locationand the perigee time of each orbit.
Based on the criteria above, we identified the proton rings and magnetosonic wave amplitudes, the root-mean square by integrating over the frequency range between fcp and fLHR, during the time period of
Figure 3. The average PSD f⊥ variation for four MLT sectors during three levels of AE* (a) outside and (b) inside theplasmapause.
Journal of Geophysical Research: Space Physics 10.1002/2017JA024865
KIM AND SHPRITS SURVEY OF THE FAVORABLE CONDITIONS FOR MAGNETOSONIC WAVE EXCITATION 405

October 2012 to December 2015. Note that the magnetosonic wave amplitudes in the lower-frequency band(fcp< f ≤ 0.5 fLHR) may be underestimated at L* ≥ 3.6, since the lowest frequency covered by Van Allen ProbesEMFISIS/WFR is 10 Hz. Nevertheless, the occurrence rate and amplitudes of the lower-frequency band areconsiderably higher than those of the higher-frequency band (which will be presented below), and thus itis sufficient to investigate the relationship between the occurrences of proton rings and lower-frequency band.
Figure 5 shows the spatial distribution of (a, b, e and f) proton rings and (c, d, g, and h) magnetosonic waveamplitude over the frequency range between fcp and fLHR with their occurrence rate both (a–d) outside and
Figure 4. An example of the variation in PSD f⊥ and magnetosonic wave signals observed by Van Allen Probe-A on 13 November 2012. (a) Proton PSD perpendicularto the magnetic field as a function of energy measured by HOPE, (b) wave electric intensity spectrograms measured by HFR, (c and d) magnetic and electricwave spectra measured by WFR, (e) wave normal angle (deg), (f) signed ellipticity, and (g) wave flag. The vertical black and blue lines are the plasmapause locationand the perigee time of each orbit, respectively. Also shown in Figure 4a is ring energy (black dot), dip energy (white dot), and Alfven energy (blue line). Harmonics offce up to 5.0 fce in Figure 4b, and fce, 0.5fce, 0.1fce, fLHR, 0.5fLHR, and fcp, from top to bottom, in Figures 4c–4f are denoted as curves.
Journal of Geophysical Research: Space Physics 10.1002/2017JA024865
KIM AND SHPRITS SURVEY OF THE FAVORABLE CONDITIONS FOR MAGNETOSONIC WAVE EXCITATION 406
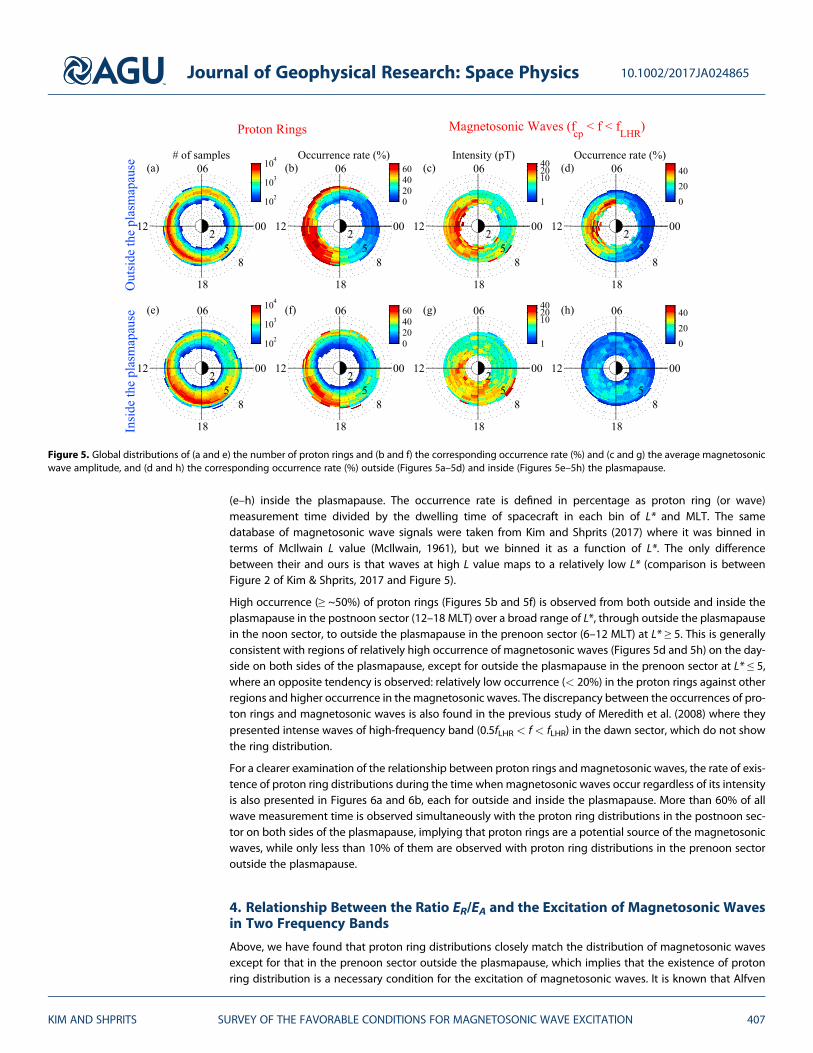
(e–h) inside the plasmapause. The occurrence rate is defined in percentage as proton ring (or wave)measurement time divided by the dwelling time of spacecraft in each bin of L* and MLT. The samedatabase of magnetosonic wave signals were taken from Kim and Shprits (2017) where it was binned interms of McIlwain L value (McIlwain, 1961), but we binned it as a function of L*. The only differencebetween their and ours is that waves at high L value maps to a relatively low L* (comparison is betweenFigure 2 of Kim & Shprits, 2017 and Figure 5).
High occurrence (≥ ~50%) of proton rings (Figures 5b and 5f) is observed from both outside and inside theplasmapause in the postnoon sector (12–18 MLT) over a broad range of L*, through outside the plasmapausein the noon sector, to outside the plasmapause in the prenoon sector (6–12 MLT) at L* ≥ 5. This is generallyconsistent with regions of relatively high occurrence of magnetosonic waves (Figures 5d and 5h) on the day-side on both sides of the plasmapause, except for outside the plasmapause in the prenoon sector at L* ≤ 5,where an opposite tendency is observed: relatively low occurrence (< 20%) in the proton rings against otherregions and higher occurrence in the magnetosonic waves. The discrepancy between the occurrences of pro-ton rings and magnetosonic waves is also found in the previous study of Meredith et al. (2008) where theypresented intense waves of high-frequency band (0.5fLHR < f < fLHR) in the dawn sector, which do not showthe ring distribution.
For a clearer examination of the relationship between proton rings and magnetosonic waves, the rate of exis-tence of proton ring distributions during the time whenmagnetosonic waves occur regardless of its intensityis also presented in Figures 6a and 6b, each for outside and inside the plasmapause. More than 60% of allwave measurement time is observed simultaneously with the proton ring distributions in the postnoon sec-tor on both sides of the plasmapause, implying that proton rings are a potential source of the magnetosonicwaves, while only less than 10% of them are observed with proton ring distributions in the prenoon sectoroutside the plasmapause.
4. Relationship Between the Ratio ER/EA and the Excitation of Magnetosonic Wavesin Two Frequency Bands
Above, we have found that proton ring distributions closely match the distribution of magnetosonic wavesexcept for that in the prenoon sector outside the plasmapause, which implies that the existence of protonring distribution is a necessary condition for the excitation of magnetosonic waves. It is known that Alfven
Figure 5. Global distributions of (a and e) the number of proton rings and (b and f) the corresponding occurrence rate (%) and (c and g) the average magnetosonicwave amplitude, and (d and h) the corresponding occurrence rate (%) outside (Figures 5a–5d) and inside (Figures 5e–5h) the plasmapause.
Journal of Geophysical Research: Space Physics 10.1002/2017JA024865
KIM AND SHPRITS SURVEY OF THE FAVORABLE CONDITIONS FOR MAGNETOSONIC WAVE EXCITATION 407
energy EA is a key factor in controlling the magnetosonic wave growth by changing the ratio ER/EA. In thissection, we investigate how variations in EA affect the magnetosonic wave excitation and determinestatistically critical ratio ER/EA exciting (or inhibiting) magnetosonic waves, separately, for two frequencybands both outside and inside the plasmapause. For this analysis, we separated the magnetosonic wavesover the whole frequency range shown in Figure 5 into two frequency bands: low (fcp < f ≤ 0.5fLHR) andhigh (0.5fLHR < f < fLHR) bands.
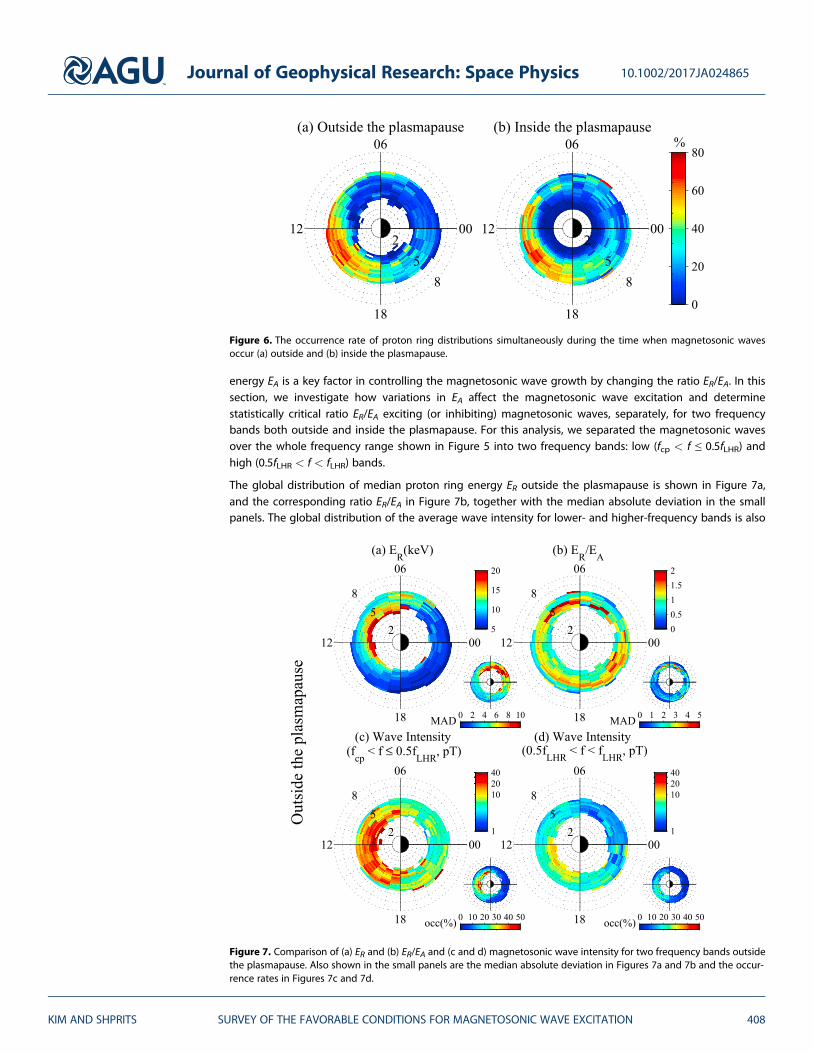
The global distribution of median proton ring energy ER outside the plasmapause is shown in Figure 7a,and the corresponding ratio ER/EA in Figure 7b, together with the median absolute deviation in the smallpanels. The global distribution of the average wave intensity for lower- and higher-frequency bands is also
Figure 6. The occurrence rate of proton ring distributions simultaneously during the time when magnetosonic wavesoccur (a) outside and (b) inside the plasmapause.
Figure 7. Comparison of (a) ER and (b) ER/EA and (c and d) magnetosonic wave intensity for two frequency bands outsidethe plasmapause. Also shown in the small panels are the median absolute deviation in Figures 7a and 7b and the occur-rence rates in Figures 7c and 7d.
Journal of Geophysical Research: Space Physics 10.1002/2017JA024865
KIM AND SHPRITS SURVEY OF THE FAVORABLE CONDITIONS FOR MAGNETOSONIC WAVE EXCITATION 408
presented in Figures 7c and 7d, respectively, together with the corresponding occurrence rates in the smallpanels. One can see by comparing Figure 7c with Figure 5c that occurrences of magnetosonic waves outsidethe plasmapause shown in Figure 5c are mostly attributed to those of lower-frequency bands. The ringenergy ranges from a few to a few tens of keV with the highest values in the 6–14 MLT sector. A relativelylow ratio ER/EA (≤ ~1) with low spreads is present in the region from 21 MLT at L* ≤ 5, through the noon sectorat L* ≤ 5, to 9 MLT at L* ≤ 4.5. In general, the distribution is consistent with that of magnetosonic waves inboth bands, having more similarity with higher-frequency bands, although it is difficult to make a directcomparison between occurrences of magnetosonic waves and the ratio ER/EA in the prenoon sector atL* ≤ 4 due to lack of data for ER/EA. The result is similar to the previous studies (Chen et al., 2010; Ma et al.,2014) where they suggested that proton rings with ER just below EA provide a free energy to excite themagnetosonic waves, especially in high-frequency bands, outside the plasmapause.
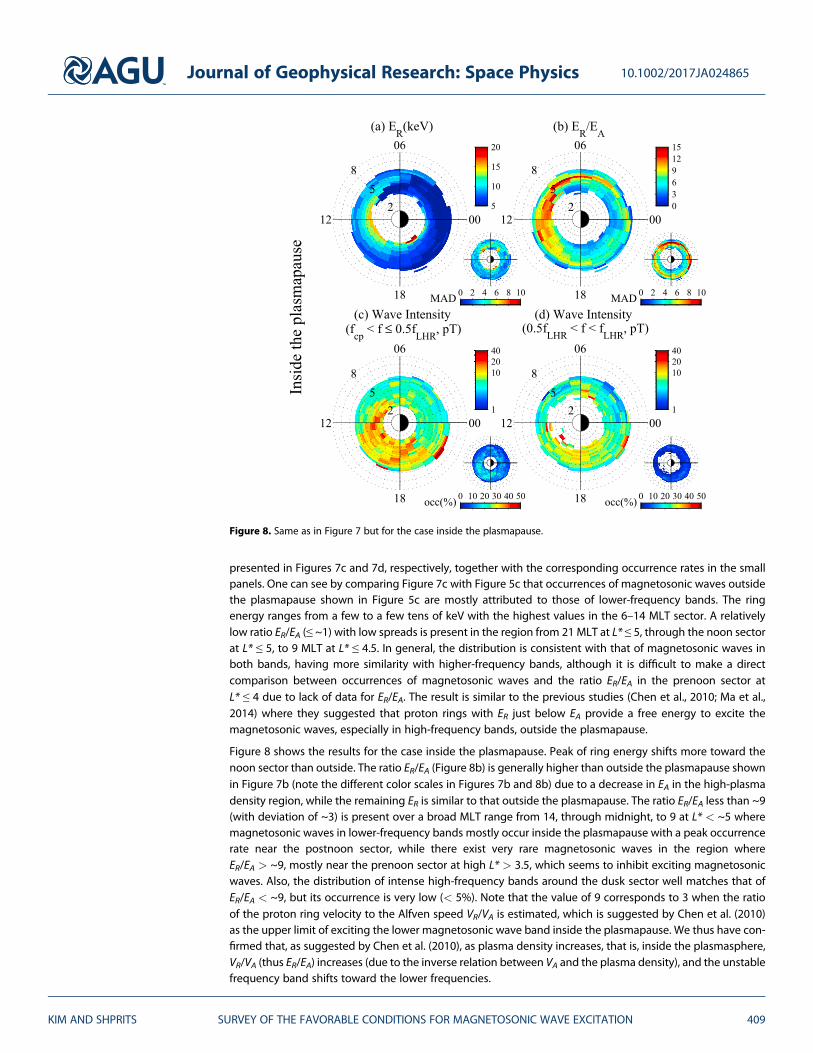
Figure 8 shows the results for the case inside the plasmapause. Peak of ring energy shifts more toward thenoon sector than outside. The ratio ER/EA (Figure 8b) is generally higher than outside the plasmapause shownin Figure 7b (note the different color scales in Figures 7b and 8b) due to a decrease in EA in the high-plasmadensity region, while the remaining ER is similar to that outside the plasmapause. The ratio ER/EA less than ~9(with deviation of ~3) is present over a broad MLT range from 14, through midnight, to 9 at L* < ~5 wheremagnetosonic waves in lower-frequency bands mostly occur inside the plasmapause with a peak occurrencerate near the postnoon sector, while there exist very rare magnetosonic waves in the region whereER/EA > ~9, mostly near the prenoon sector at high L* > 3.5, which seems to inhibit exciting magnetosonicwaves. Also, the distribution of intense high-frequency bands around the dusk sector well matches that ofER/EA < ~9, but its occurrence is very low (< 5%). Note that the value of 9 corresponds to 3 when the ratioof the proton ring velocity to the Alfven speed VR/VA is estimated, which is suggested by Chen et al. (2010)as the upper limit of exciting the lower magnetosonic wave band inside the plasmapause. We thus have con-firmed that, as suggested by Chen et al. (2010), as plasma density increases, that is, inside the plasmasphere,VR/VA (thus ER/EA) increases (due to the inverse relation between VA and the plasma density), and the unstablefrequency band shifts toward the lower frequencies.
Figure 8. Same as in Figure 7 but for the case inside the plasmapause.
Journal of Geophysical Research: Space Physics 10.1002/2017JA024865
KIM AND SHPRITS SURVEY OF THE FAVORABLE CONDITIONS FOR MAGNETOSONIC WAVE EXCITATION 409
5. Discussion
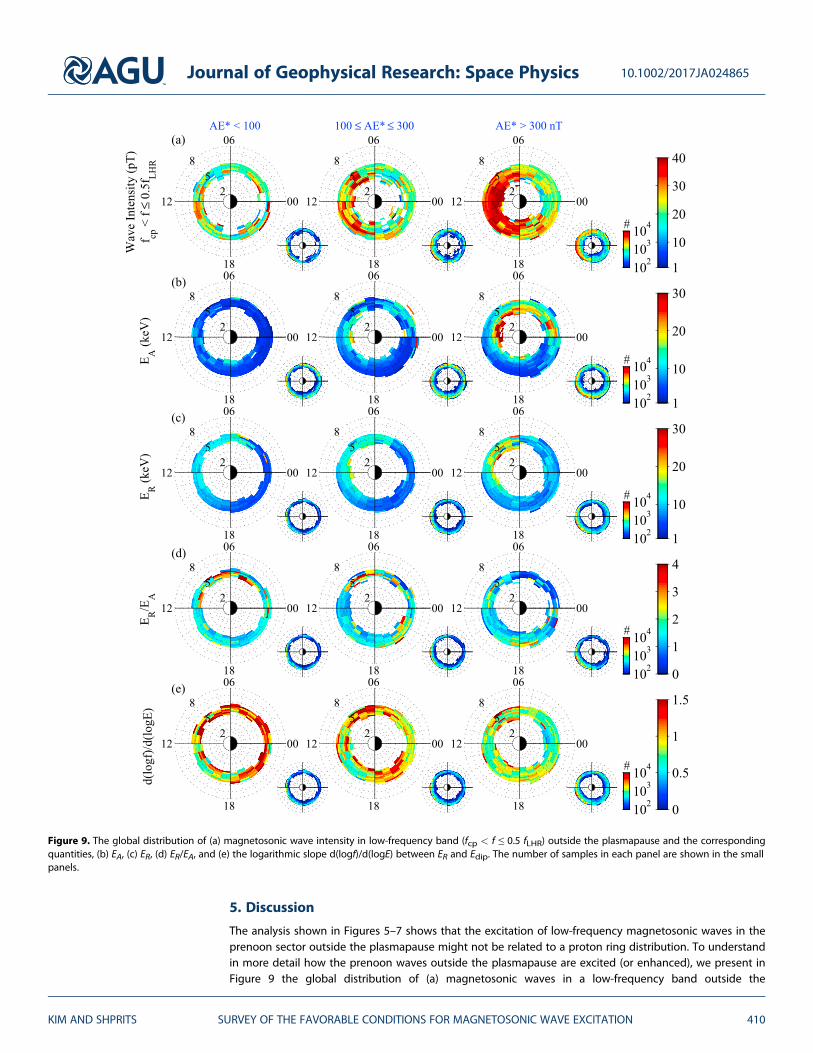
The analysis shown in Figures 5–7 shows that the excitation of low-frequency magnetosonic waves in theprenoon sector outside the plasmapause might not be related to a proton ring distribution. To understandin more detail how the prenoon waves outside the plasmapause are excited (or enhanced), we present inFigure 9 the global distribution of (a) magnetosonic waves in a low-frequency band outside the
Figure 9. The global distribution of (a) magnetosonic wave intensity in low-frequency band (fcp < f ≤ 0.5 fLHR) outside the plasmapause and the correspondingquantities, (b) EA, (c) ER, (d) ER/EA, and (e) the logarithmic slope d(logf)/d(logE) between ER and Edip. The number of samples in each panel are shown in the smallpanels.
Journal of Geophysical Research: Space Physics 10.1002/2017JA024865
KIM AND SHPRITS SURVEY OF THE FAVORABLE CONDITIONS FOR MAGNETOSONIC WAVE EXCITATION 410

plasmapause for three levels of AE*, together with the quantities (b) EA, (c) ER, (d) ER/EA, and (e) the logarithmicslope d(logf)/d(logE) between ER and Edip. As already well known, positive df⊥/dv⊥ at velocities just below VR isassociated with the magnetosonic wave growth (see equation (2) in Horne et al., 2000). Thus, for the presentstudy, df⊥/dE⊥ with respect to E⊥ between ER and Edip is simply adopted as the representative slope requiredfor the excitation of magnetosonic waves, instead of estimating all the slopes for all available energy chan-
nels. It is estimated using the numerical approximation oflog f ⊥;R=f ⊥;dipð Þlog ER=Edipð Þ following Thomsen et al. (2011).
As AE* increases, the magnetosonic wave amplitude in the low-frequency band is considerably enhanced inthe prenoon sector, together with an increase in both EA and ER. However, the EA noticeably increase (mostlydue to decrease in plasma density) while the ER gradually increase, resulting in a generally gradual decreasein ER/EA in the prenoon sector with increasing AE*, which is opposite to the tendency of variation in magne-tosonic wave amplitude. There is also a significant decrease in the positive slopes with AE* activity over awide range of MLT, but they tend to peak around the prenoon sector during active times, which is qualita-tively similar to the previous finding of Thomsen et al. (2011) using ion distributions observed at geosynchro-nous orbit. For the present study, we only focused on relative comparison of the positive slope amongregions and AE* values rather than on pointing out its value, since it is difficult to set a threshold for a signifi-cant positive slope that drives magnetosonic instability unless we calculate the growth rate, which is beyondthe scope of this study (though Thomsen et al., 2011 set it as +0.3 for the slope at any given energy). Theresults suggest that the ratio ER/EA ≤ ~4 (corresponding to VR/VA ~ 2, which is suggested by Horne et al.,2000 and Chen et al., 2010) with relative high positive slopes around the prenoon sector against other regionsat high AE* activity favors the local excitation of magnetosonic waves at low frequencies outside the plasma-pause, although the occurrence rate of proton rings in that region is relatively low compared to other regions,as shown in Figure 5b.
However, we cannot ignore the possibility, due to favorable conditions of high occurrence of proton ringsand ER/EA ≤ ~1 for excitation of magnetosonic waves in the postnoon sector (12–18 MLT), that waves inthe prenoon sector may have propagated azimuthally from the postnoon sector where they were excited.In addition, Kim and Shprits (2017) suggested that magnetosonic waves inside the plasmapause areenhanced around the prenoon sector during active times, and we thus speculate that they may have radiallypropagated out of the plasmasphere through the plasmapause in the prenoon sector (e.g., Xiao et al., 2012).More theoretical analysis and modeling should be done in the future to validate these observational results.In addition, the plasma beta (β) parameter, which is defined as a ratio of the plasma pressure to the magneticpressure, is also known as one of the necessary conditions to diagnose wave instability. Gary et al. (2010)using linear kinetic dispersion theory showed that wave properties change significantly with β and suggestedan appropriate value of β for maximum instability growth rate of ion Bernstein mode waves. Therefore, con-sidering more kinetic properties of the plasma during the observation of fast magnetosonic waves may helpto find the source of the waves, and whether they generated locally or not.
6. Conclusions
We have investigated the relationship between proton rings and magnetosonic waves in two frequencybands, fcp < f ≤ 0.5 fLHR and 0.5 fLHR < f < fLHR using particle and wave data from Van Allen Probe-A duringthe period from October 2012 to December 2015. The global distribution of particle data for protons at dif-ferent energies showed that an unstable proton ring distribution is driven by energy-dependent drift: east-ward gradient-curvature drift for >10 keV and westward E × B drift for a several keV. In addition, the clearstatistical relationship between the proton rings and the magnetosonic waves suggests that proton ringsare a potential source of the magnetosonic waves. We have also found that outside the plasmapause, thelow ER/EA ratio (≤ ~1) favors the excitation of magnetosonic waves in both low- and high-frequency bandsin the postnoon sector (12–18 MLT), and waves in the low-frequency bands are observed in the prenoon sec-tor (6–12 MLT), which is attributed to either that they may be locally excited in the region of a relatively highER/EA ratio (≤ ~4) or they may have originated from the postnoon sector via azimuthal propagation afterbeing excited under the condition of proton rings with low ER/EA (≤ ~1). Meanwhile, inside the plasmapause,a relatively higher ER/EA ratio (but less than ~9) than outside allow for excitation of the low-frequency band(fcp < f ≤ 0.5fLHR) of magnetosonic waves around the postnoon sector, while ER/EA> ~9 inhibits excitation of
Journal of Geophysical Research: Space Physics 10.1002/2017JA024865
KIM AND SHPRITS SURVEY OF THE FAVORABLE CONDITIONS FOR MAGNETOSONIC WAVE EXCITATION 411
the magnetosonic waves. Our statistical results using Van Allen Probe-A are consistent with the previous the-oretical and observational studies.
ReferencesBalikhin, M. A., Shprits, Y. Y., Walker, S. N., Chen, L., Cornilleau-Wehrlin, N., Dandouras, I., … Weiss, B. (2015). Observations of discrete har-
monics emerging from equatorial noise. Nature Physics, 6, 7703. https://doi.org/10.1038/ncomms8703Boardsen, S. A., Gallagher, D. L., Gurnett, D. A., Peterson, W. K., & Green, J. L. (1992). Funnel-shaped, low-frequency equatorial waves. Journal
of Geophysical Research, 97(A10), 14967–14,976. https://doi.org/10.1029/92JA00827Chen, L., Thorne, R. M., Jordanova, V. K., & Horne, R. B. (2010). Global simulation of magnetosonic wave instability in the storm time mag-
netosphere. Journal of Geophysical Research, 115, A11222. https://doi.org/10.1029/2010JA015707Chen, L., Thorne, R. M., Jordanova, V. K., Thomsen, M. F., & Horne, R. B. (2011). Magnetosonic wave instability analysis for proton ring distri-
butions observed by the LANL magnetospheric plasma analyzer. Journal of Geophysical Research, 116, A03223. https://doi.org/10.1029/2010JA016068
Convery, P. D., & Gary, S. P. (1997). Electromagnetic proton cyclotron ring instability: Threshold and saturation. Journal of GeophysicalResearch, 102(A2), 2351–2358. https://doi.org/10.1029/96JA02951
Curtis, S., & Wu, C. (1979). Gyroharmonic emissions induced by energetic ions in the equatorial plasmasphere. Journal of GeophysicalResearch, 84(A6), 2597–2607. https://doi.org/10.1029/JA084iA06p02597
Fok, M.-C., Moore, T. E., Kozyra, J. U., Ho, G. C., & Hamilton, D. C. (1995). Three-dimensional ring current decay model. Journal of GeophysicalResearch, 100(A6), 9619–9632. https://doi.org/10.1029/94JA03029
Fok, M.-C., Moore, T. E., & Greenspan, M. E. (1996). Ring current development during storm main phase. Journal of Geophysical Research,101(A7), 15,311–15,322. https://doi.org/10.1029/96JA01274
Funsten, H. O., Skoug, R. M., Guthrie, A. A., MacDonald, E. A., Baldonado, J. R., Harper, R. W., … Chen, J. (2013). Helium, Oxygen, Proton, andElectron (HOPE) mass spectrometer for the Radiation Belt Storm Probes mission. Space Science Reviews, 179(1-4), 423–484. https://doi.org/10.1007/s11214-013-9968-7
Gary, S. P., Liu, K., Winske, D., & Denton, R. E. (2010). Ion Bernstein instability in the terrestrial magnetosphere: Linear dispersion theory.Journal of Geophysical Research, 115, A12209. https://doi.org/10.1029/2010JA015965
Horne, R. B., Wheeler, G. V., & Alleyne, H. S. C. K. (2000). Proton and electron heating by radially propagating fast magnetosonic waves. Journalof Geophysical Research, 105(A12), 27,597–27,610. https://doi.org/10.1029/2000JA000018
Horne, R. B., Thorne, R. M., Glauert, S. A., Meredith, N. P., Pokhotelov, D., & Santolík, O. (2007). Electron acceleration in the Van Allen radiationbelts by fast magnetosonic waves. Geophysical Research Letters, 34, L17107. https://doi.org/10.1029/2007GL030267
Hrbáčková, Z., Santolík, O., Němec, F., Macúšová, E., & Cornilleau-Wehrlin, N. (2015). Systematic analysis of occurrence of equatorial noiseemissions using 10 years of data from the Cluster mission. Journal of Geophysical Research: Space Physics, 120, 1007–1021. https://doi.org/10.1002/2014JA020268
Jordanova, V. K., Kistler, L. M., Kozyra, J. U., Khazanov, G. V., & Nagy, A. F. (1996). Collisional losses of ring current ions. Journal of GeophysicalResearch, 101(A1), 111–126. https://doi.org/10.1029/95JA02000
Jordanova, V. K., Farrugia, C. J., Quinn, J. M., Torbert, R. B., Borovsky, J. E., Sheldon, R. B., & Peterson, W. K. (1999). Simulation of off-equatorialring current ion spectra measured by polar for a moderate storm at solar minimum. Journal of Geophysical Research, 104(A1), 429–436.https://doi.org/10.1029/98JA02658
Kasahara, Y., Kenmochi, H., & Kimura, I. (1994). Propagation characteristics of the ELF emissions observed by the satellite Akebono in themagnetic equatorial region. Radio Science, 29(4), 751–767. https://doi.org/10.1029/94RS00445
Kim, K.-C., & Chen, L. (2016). Modeling the storm time behavior of the magnetosonic waves using solar wind parameters. Journal ofGeophysical Research: Space Physics, 121, 446–458. https://doi.org/10.1002/2015JA021716
Kim, K.-C., & Shprits, Y. (2017). Dependence of the amplitude of magnetosonic waves on the solar wind and AE index using Van Allen Probes.Journal of Geophysical Research: Space Physics, 122, 6022–6034. https://doi.org/10.1002/2017JA024094
Kletzing, C. A., Kurth, W. S., Acuna, M., MacDowall, R. J., Torbert, R. B., Averkamp, T.,… Tyler, J. (2013). The Electric andMagnetic Field InstrumentSuite and Integrated Science (EMFISIS) on RBSP. Space Science Reviews, 179(1-4), 127–181. https://doi.org/10.1007/s11214-013-9993-6
Korth, H., Thomsen, M. F., Borovsky, J. E., & McComas, D. J. (1999). Plasma sheet access to geosynchronous orbit. Journal of GeophysicalResearch, 104(A11), 25,047–25,061. https://doi.org/10.1029/1999JA900292
Laakso, H., Junginger, H., Roux, A., Schmidt, R., & deVilledary, C. (1990). Magnetosonic waves above fc (H+) at geostationary orbit: GEOS 2results. Journal of Geophysical Research, 95(A7), 10,609–10,621. https://doi.org/10.1029/JA095iA07p10609
Li, W., Ma, Q., Thorne, R. M., Bortnik, J., Kletzing, C. A., Kurth, W. S.,… Nishimura, Y. (2015). Statistical properties of plasmaspheric hiss derivedfrom Van Allen Probes data and their effects on radiation belt electron dynamics. Journal of Geophysical Research: Space Physics, 120,3393–3405. https://doi.org/10.1002/2015JA021048
Li, J., Bortnik, J., Li, W., Ma, Q., Thorne, R. M., Kletzing, C. A., … Russell, C. T. (2017). “Zipper-like” periodic magnetosonic waves: Van AllenProbes, THEMIS, and magnetospheric multiscale observations. Journal of Geophysical Research: Space Physics, 122, 1600–1610. https://doi.org/10.1002/2016JA023536
Liu, K., Gary, S. P., & Winske, D. (2011). Excitation of magnetosonic waves in the terrestrial magnetosphere: Particle-in-cell simulations. Journalof Geophysical Research, 116, A07212. https://doi.org/10.1029/2010JA016372
Lyons, L. R., & Williams, D. J. (1984). Quantitative aspects of magnetospheric physics (pp. 79–86). New York: Springer. https://doi.org/10.1007/978-94-017-2819-5
Ma, Q., Li, W., Thorne, R. M., & Angelopoulos, V. (2013). Global distribution of equatorial magnetosonic waves observed by THEMIS.Geophysical Research Letters, 40, 1895–1901. https://doi.org/10.1002/grl.50434
Ma, Q., Li, W., Chen, L., Thorne, R. M., & Angelopoulos, V. (2014). Magnetosonic wave excitation by ion ring distributions in the Earth’s innermagnetosphere. Journal of Geophysical Research: Space Physics, 119, 844–852. https://doi.org/10.1002/2013JA019591
Ma, Q., Li, W., Thorne, R. M., Bortnik, J., Kletzing, C. A., Kurth, W. S., & Hospodarsky, G. B. (2016). Electron scattering by magnetosonic waves inthe inner magnetosphere. Journal of Geophysical Research: Space Physics, 121, 274–285. https://doi.org/10.1002/2015JA021992
Mauk, B. H., Fox, N. J., Kanekal, S. G., Kessel, R. L., Sibeck, D. G., & Ukhorskiy, A. (2012). Science objectives and rationale for the Radiation BeltStorm Probes mission. Space Science Reviews, 1–15. https://doi.org/10.1007/s11214-012-9908-y
McIlwain, C. E. (1961). Coordinates for mapping the distribution of magnetically trapped particles. Journal of Geophysical Research, 66(11),3681–3691. https://doi.org/10.1029/JZ066i011p03681
Journal of Geophysical Research: Space Physics 10.1002/2017JA024865
KIM AND SHPRITS SURVEY OF THE FAVORABLE CONDITIONS FOR MAGNETOSONIC WAVE EXCITATION 412
AcknowledgmentsThis research was supported by theDaegu University Research grant20160376. We thank the GSFC/SPDFOMNIWeb for the provision of AE indexused in this report. The Van Allen Probedata are available from http://emfisis.physics.uiowa.edu/Flight and fromhttps://rbsp-ect.lanl.gov/data_pub/rbspa. We graciously thank the VanAllen Probes team, especially theEMFISIS and ECT teams. The electronnumber density derived by Neural-network-based Upper hybridResonance Determination algorithm forthe Van Allen Probes is available fromftp://rbm.epss.ucla.edu/ftpdisk1/NURD.

Meredith, N. P., Horne, R. B., Thorne, R. M., Summers, D., & Anderson, R. R. (2004). Substorm dependence of plasmaspheric hiss. Journal ofGeophysical Research, 109(A6), A06209. https://doi.org/10.1029/2004JA010387
Meredith, N. P., Horne, R. B., & Anderson, R. R. (2008). Survey of magnetosonic waves and proton ring distributions in the Earth’s innermagnetosphere. Journal of Geophysical Research, 113(A6), A06213. https://doi.org/10.1029/2007JA012975
Min, K., Liu, K., & Gary, S. P. (2017). Proton velocity ring-driven instabilities and their dependence on the ring speed: Linear theory. Journal ofGeophysical Research: Space Physics, 122, 7891–7906. https://doi.org/10.1002/2017JA023944
Moya, P. S., Pinto, V. A., Viñas, A. F., Sibeck, D. G., Kurth, W. S., Hospodarsky, G. B., & Wygant, J. R. (2015). Weak kinetic Alfvén waves turbulenceduring the 14 November 2012 geomagnetic storm: Van Allen Probes observations. Journal of Geophysical Research: Space Physics, 120(7),5504–5523. https://doi.org/10.1002/2014JA020281
Němec, F., Santolík, O., Pickett, J. S., Hrbáčková, Z., & Cornilleau-Wehrlin, N. (2013). Azimuthal directions of equatorial noise propagationdetermined using 10 years of data from the Cluster spacecraft. Journal of Geophysical Research: Space Physics, 118, 7160–7169. https://doi.org/10.1002/2013JA019373
Perraut, S., Roux, A., Robert, P., Gendrin, R., Sauvaud, J.-A., Bosqued, J.-M., … Korth, A. (1982). A systematic study of ULF waves above FH+from GEOS 1 and 2 measurements and their relationships with proton ring distributions. Journal of Geophysical Research, 87(A8),6219–6236. https://doi.org/10.1029/JA087iA08p06219
Roederer, J. G. (1970). Dynamics of geomagnetically trapped radiation, (pp. 76–79). New York: Springer-Verlag. https://doi.org/10.1007/978-3-642-49300-3
Russell, C. T., Holzer, R. E., & Smith, E. J. (1970). OGO 3 observations of ELF noise in the magnetosphere: 2. The nature of the equatorial noise.Journal of Geophysical Research, 75(4), 755–768. https://doi.org/10.1029/JA075i004p00755
Salem, C. S., Howes, G. G., Sundkvist, D., Bale, S. D., Chaston, C. C., Chen, C. H. K., & Mozer, F. S. (2012). Identification of kinetic Alfvén waveturbulence in the solar wind. The Astrophysical Journal, 745(1), L9. https://doi.org/10.1088/2041-8205/745/1/L9
Santolík, O., Pickett, J. S., Gurnett, D. A., Maksimovic, M., & Cornilleau-Wehrlin, N. (2002). Spatiotemporal variability and propagation ofequatorial noise observed by Cluster. Journal of Geophysical Research, 107(A12), 1495. https://doi.org/10.1029/2001JA009159
Santolík, O., Parrot, M., & Lefeuvre, F. (2003). Singular value decompositionmethods for wave propagation analysis. Radio Science, 38(1), 1010.https://doi.org/10.1029/2000RS002523
Shprits, Y. Y. (2016). Estimation of bounce resonant scattering by fast magnetosonic waves. Geophysical Research Letters, 43(3), 998–1006.https://doi.org/10.1002/2015GL066796
Shprits, Y. Y., Runov, A., & Ni, B. (2013). Gyro-resonant scattering of radiation belt electrons during the solar minimum by fast magnetosonicwaves. Journal of Geophysical Research: Space Physics, 118, 648–652. https://doi.org/10.1002/jgra.50108
Thomsen, M. F., Denton, M. H., Jordanova, V. K., Chen, L., & Thorne, R. M. (2011). Free energy to drive equatorial magnetosonic wave instabilityat geosynchronous orbit. Journal of Geophysical Research, 116(A8), A08220. https://doi.org/10.1029/2011JA016644
Tsyganenko, N. A., & Sitnov, M. I. (2005). Modeling the dynamics of the inner magnetosphere during strong geomagnetic storms. Journal ofGeophysical Research, 110(A3), A03208. https://doi.org/10.1029/2004JA010798
Umeda, T., Ashour-Abdalla, M., Schriver, D., Richard, R. L., & Coroniti, F. V. (2007). Particle-in-cell simulation of Maxwellian ring velocity dis-tribution. Journal of Geophysical Research, 112(A4), A04212. https://doi.org/10.1029/2006JA012124
Umeda, T., Matsukiyo, S., Amano, T., & Miyoshi, Y. (2012). A numerical electromagnetic linear dispersion relation for Maxwellian ring-beamvelocity distributions. Physics of Plasmas, 19(7), 072107. https://doi.org/10.1063/1.4736848
Xiao, F., Zhou, Q., He, Z., & Tang, L. (2012). Three-dimensional ray tracing of fast magnetosonic waves. Journal of Geophysical Research,117(A6), A06208. https://doi.org/10.1029/2012JA017589
Zhelavskaya, I. S., Spasojevic, M., Shprits, Y. Y., & Kurth, W. S. (2016). Automated determination of electron density from electric field mea-surements on the Van Allen Probes spacecraft. Journal of Geophysical Research: Space Physics, 121, 4611–4625. https://doi.org/10.1002/2015JA022132
Journal of Geophysical Research: Space Physics 10.1002/2017JA024865
KIM AND SHPRITS SURVEY OF THE FAVORABLE CONDITIONS FOR MAGNETOSONIC WAVE EXCITATION 413