surface pathway of radioactive plume of tepco fukushima npp1 released 134cs and 137cs
TRANSCRIPT
BGD10, 265–283, 2013
Pathway of plume ofFukushima 137Cs and
134Cs
M. Aoyama et al.
Title Page
Abstract Introduction
Conclusions References
Tables Figures
J I
J I
Back Close
Full Screen / Esc
Printer-friendly Version
Interactive Discussion
Discussion
Paper
|D
iscussionP
aper|
Discussion
Paper
|D
iscussionP
aper|
Biogeosciences Discuss., 10, 265–283, 2013www.biogeosciences-discuss.net/10/265/2013/doi:10.5194/bgd-10-265-2013© Author(s) 2013. CC Attribution 3.0 License.
BiogeosciencesDiscussions
This discussion paper is/has been under review for the journal Biogeosciences (BG).Please refer to the corresponding final paper in BG if available.
Surface pathway of radioactive plume ofTEPCO Fukushima NPP1 released 134Csand 137CsM. Aoyama1, M. Uematsu2, D. Tsumune3, and Y. Hamajima4
1Meteorological Research Institute, Tsukuba, Japan2Ocean Research Institute, University of Tokyo, Tokyo, Japan3Environmental Science Research Laboratory, Central Research Institute of Electric PowerIndustry, Tokyo, Japan4Institute of Nature and Environmental Technology, Kanazawa University, Kanazawa, Japan
Received: 9 November 2012 – Accepted: 17 December 2012 – Published: 8 January 2013
Correspondence to: M. Aoyama ([email protected])
Published by Copernicus Publications on behalf of the European Geosciences Union.
265

BGD10, 265–283, 2013
Pathway of plume ofFukushima 137Cs and
134Cs
M. Aoyama et al.
Title Page
Abstract Introduction
Conclusions References
Tables Figures
J I
J I
Back Close
Full Screen / Esc
Printer-friendly Version
Interactive Discussion
Discussion
Paper
|D
iscussionP
aper|
Discussion
Paper
|D
iscussionP
aper|
Abstract
134Cs and 137Cs were released to the North Pacific Ocean by two major likely pathways,direct discharge from the Fukushima NPP1 accident site and atmospheric depositionoff Honshu Islands of Japan, east and northeast of the site. High density observationsof 134Cs and 137Cs in the surface water were carried out by 17 cruises of cargo ships5
and several research vessel cruises since March 2011 till March 2012. Main body ofradioactive surface plume of which activity was exceed 10 Bqm−3 had been travellingalong 40◦ N, and reached International Date Line on March 2012 one year after theaccident. A feature was that the radioactive plume was confined along 40◦ N when theplume reached International Date Line. A zonal speed of the radioactive plume was10
estimated to be about 8 cms−1 which was consistent with zonal speeds derived byArgo floats and satellite observations at the region.
1 Introduction
On 11 March 2011, an extraordinary earthquake of magnitude 9.0 centred about130 km off the Pacific coast of Japan’s main island, at 38.3◦ N, 142.4◦ E, was followed by15
a huge tsunami with waves reaching up to 40 m height in Iwate region and about 10 m inFukushima region (The-2011-Tohoku-Earthquake-Tsunami-Joint-Survey-Group, 2011;Mori et al., 2011). These events caused the loss of about 16 000 lives, missing of about4000 lives and extensive damage. One of the consequences was a station blackout (to-tal loss of AC electric power) at the Tokyo Electric Power Company (hereafter TEPCO)20
Fukushima Dai-ichi Nuclear Power Plant (hereafter FNPP1). The station blackout de-veloped into a disaster that left three of the six FNPP1 reactors heavily damaged andcaused radionuclides to be discharged into the air and ocean (Chino et al., 2011;Morino et al., 2011; Stohl et al., 2012; Tsumune et al., 2012; Kawamura et al., 2011;Estournel et al., 2012).25
266

BGD10, 265–283, 2013
Pathway of plume ofFukushima 137Cs and
134Cs
M. Aoyama et al.
Title Page
Abstract Introduction
Conclusions References
Tables Figures
J I
J I
Back Close
Full Screen / Esc
Printer-friendly Version
Interactive Discussion
Discussion
Paper
|D
iscussionP
aper|
Discussion
Paper
|D
iscussionP
aper|
134Cs and 137Cs were released to the North Pacific Ocean by two major likely path-ways, direct discharge from the FNPP1 accident site and atmospheric deposition offHonshu Islands of Japan, east and northeast of the site. 134Cs and 137Cs activities inthe surface water in the North Pacific Ocean were already reported (Aoyama et al.,2012a; Honda et al., 2012) and those ranged a few to 1000 Bqm−3 in April–May 2011.5
Distributions of 134Cs and 137Cs activities in the surface water off Honshu and coastalstations around Japan during the period from April 2011 to November 2011 (Inoueet al., 2012a,b; Aoyama et al., 2012a; Buesseler et al., 2011, 2012) were also reportedand discussed.
During the first month of release period, 134Cs and 137Cs activities ratios were very10
close to one (0.99±0.03 for FNPP1 north and south discharge channels) and ex-tremely uniform (Buesseler et al., 2011). The presence of 134Cs is a unique isotopicsignature for tracking these waters and calculating mixing ratios. In the oceans, thebehaviour of caesium is thought to be conservative, i.e. it is soluble (<1 % attachedto marine particles) and is carried primarily with ocean waters and as such has been15
used as a tracer of water mass mixing and transport (Buesseler et al., 2011).Results of observations of 134Cs and 137Cs activities in surface water at Hasaki,
a coastal station 180 km south of the FNPP1 accident site April 2011 to December2011 was presented, and the maximum in radiocaesium activity, around 2000 Bqm−3,at Hasaki was observed in June 2011, representing a delay of two months from the20
corresponding maximum in April 2011 at FNPP1. Directly discharged 134Cs and 137Cswere transported dominantly southward along the coastline of north-eastern Honshu.The reasons for the two-month delay at Hasaki are not yet clear, however clockwisecurrent associated with a warm water eddy of which center located at 36.5◦ N, 141.4◦ Eoff Iwaki between Onahama and Hasaki in mid of May 2011 might prevent southward25
transport of 134Cs and 137Cs released from FNPP1 to Hasaki until the end of May 2011(Aoyama et al., 2012b).
Fukushima-derived 134Cs and 137Cs were detected throughout waters 30–600 kmoffshore, with the highest activities associated with near-shore eddies and the Kuroshio
267

BGD10, 265–283, 2013
Pathway of plume ofFukushima 137Cs and
134Cs
M. Aoyama et al.
Title Page
Abstract Introduction
Conclusions References
Tables Figures
J I
J I
Back Close
Full Screen / Esc
Printer-friendly Version
Interactive Discussion
Discussion
Paper
|D
iscussionP
aper|
Discussion
Paper
|D
iscussionP
aper|
Current acting as a southern boundary for transport in June 2011. They calculate a totalinventory of 1.9–2.1 PBq 137Cs in an ocean area of 150 000 km2 (Buesseler et al.,2012).
However, there is no report of 134Cs and 137Cs activities in the surface water in theNorth Pacific Ocean after June 2011. High density sampling of surface seawater to5
measure 134Cs and 137Cs activities were carried out by 17 cargo ships as VoluntaryObserving Ship (here after VOS) cruises and several research vessel cruises sinceMarch 2011 till March 2012 in the North Pacific Ocean.
In this paper we present the results of our measurements of 134Cs and 137Cs activi-ties in the surface water in sea area both close to the site and the North Pacific Ocean10
based on the monitoring data and on our observation, respectively. We also discussthese behaviours of the radioactive plume in the North Pacific Ocean through March2012.
2 Sampling and measurements
We collected 2 L surface seawater samples at more than 300 stations as shown in15
Fig. S1. The samples were treated by an improved ammonium phosphomolybdate,AMP, procedure developed by one of the authors (Hirose et al., 2005; Aoyama andHirose, 2008). This improvement of AMP procedure realized that the weight yield ofAMP/Cs compound basically exceed 99 % for 2 L samples as well as radiochemicalyield of radiocaesium. And their activities of AMP/Cs compound were measured at the20
Ogoya Underground Facility of the Low Level Radioactivity Laboratory of KanazawaUniversity using high-efficiency, well-type ultra low background Ge-detectors (Hama-jima and Komura, 2004). One example of the best performance at this undergroundfacility was reported that a detection limit of 137Cs is 0.18 mBq for a counting time of10 000 min (Hirose et al., 2005). Therefore, this development permits us to use the25
residue of nuclear weapon tests as useful tracers in oceanography (Aoyama et al.,2011; Povinec et al., 2011; Sanchez-Cabeza et al., 2011) and to measure released
268

BGD10, 265–283, 2013
Pathway of plume ofFukushima 137Cs and
134Cs
M. Aoyama et al.
Title Page
Abstract Introduction
Conclusions References
Tables Figures
J I
J I
Back Close
Full Screen / Esc
Printer-friendly Version
Interactive Discussion
Discussion
Paper
|D
iscussionP
aper|
Discussion
Paper
|D
iscussionP
aper|
134Cs and 137Cs from the FNPP1 in 2 L samples of which activity was less than1 Bqm−3, too.
Because reagents can add trace levels of radioactivity, skewing small volume mea-surements, it is important to know the specific activity of analytes such as 137Cs in thereagents. The 137Cs activity in CsCl was measured to be 0.03 mBqg−1 by using ex-5
tremely low background γ–spectrometry and we neglect this amount of 137Cs becausewe use only 0.26 g as carrier. The 137Cs activity in AMP we used was 0.024 mBqg−1
and we subtract corresponding amount of 137Cs in the AMP used to extract radiocae-sium from the samples because we use 4–6 g for extraction. There is no serious con-tamination of 137Cs from other reagents. For 134Cs contaminations, we did not observe10
any 134Cs contaminations from the reagents.
3 Results
3.1 Trend of 134Cs and 137Cs close to the accident site
In addition to our own data, we compiled monitoring data of the Ministry of Education,Culture, Sports, Science and Technology (hereafter MEXT) and TEPCO to discuss15
about trend of source term at the accident site. The measured 137Cs concentration ina seawater sample near the FNPP1 site reached 68 MBqm−3 on 7 April (Buesseleret al., 2011). An analysis of 137Cs concentrations and 131I/137Cs activity ratios suggestthat major direct release of 137Cs from the FNPP1 reactors occurred for 12 days, from26 March to 6 April 2011 (Tsumune et al., 2012) then it decreased much but it was20
still continuing until July 2011 (Buesseler et al., 2011) and thereafter. During the periodfrom August 2011 to July 2012, the activities of 134Cs and 137Cs at near FNPP1 sitewere kept around 1000–10 000 Bqm−3, which means that direct discharge becomesvery small but still continues until July 2012 as shown in Fig. S2.
269
BGD10, 265–283, 2013
Pathway of plume ofFukushima 137Cs and
134Cs
M. Aoyama et al.
Title Page
Abstract Introduction
Conclusions References
Tables Figures
J I
J I
Back Close
Full Screen / Esc
Printer-friendly Version
Interactive Discussion
Discussion
Paper
|D
iscussionP
aper|
Discussion
Paper
|D
iscussionP
aper|
3.2 In the North Pacific Ocean
Before the FNPP1 accident, 137Cs was already exist which was originated from the nu-clear weapon tests conducted in the late 1950s and in the early 1960s (Aoyama et al.,2011; Aoyama and Hirose, 2008). In the western North Pacific Ocean, 137Cs activityin surface water was 10–100 Bqm−3 in the late 1950s and in the early 1960s, then it5
decreased gradually and the 137Cs activity in surface water decreased to around a fewBqm−3 (Aoyama et al., 2006, 2011). In 1986 Chernobyl accident, however, a contribu-tion of atmospheric deposition of Chernobyl derived 137Cs in the North Pacific Oceanwas around 3 % of total deposition derived from global fallout before 1986 (Aoyamaet al., 1986). Therefore, the effect of Chernobyl accident in the North Pacific Ocean is10
negligible. Before the FNPP1 accident, distribution and inventory of 137Cs which orig-inated from atmospheric weapons tests had been studied in the Pacific Ocean sincethe late 1950s and the 137Cs inventory in the North Pacific Ocean was 290±30 PBqin January 1970 based on 10◦ by 10◦ mesh data of the 137Cs deposition (Aoyamaet al., 2006). In 2003, 137Cs inventory in the North Pacific Ocean was 86 PBq by the15
model study (Tsumune et al., 2011) and 85 PBq by the observation (Aoyama et al.,2012a), then it decreased to 69 PBq in 2011 because due to decay (Aoyama et al.,2012a). In 2000s just before the FNPP1 accident, the 137Cs activity in surface waterwas a few Bqm−3 and showed less change compared with the decreasing trend of137Cs activity we observed before 2000. A horizontal distribution of 137Cs in the 2000s20
in the surface water showed a very homogeneous distribution, but relatively high 137Csactivity regions in surface water were observed in the western part of the subtropicalgyre in both the North Pacific Ocean and the South Pacific Ocean where 137Cs activityexceeded 2 Bqm−3 and 1.5 Bqm−3, respectively (Aoyama et al., 2012a).
After the FNPP1 accident, both 134Cs and 137Cs are observed in a wide area in25
the North Pacific Ocean as shown in Table 1 and Figs. S3–S6. The differences be-tween 134Cs and 137Cs activities observed after the FNPP1 accident were consistentwith pre-existing 137Cs originated from the nuclear weapons tests as described above.
270
BGD10, 265–283, 2013
Pathway of plume ofFukushima 137Cs and
134Cs
M. Aoyama et al.
Title Page
Abstract Introduction
Conclusions References
Tables Figures
J I
J I
Back Close
Full Screen / Esc
Printer-friendly Version
Interactive Discussion
Discussion
Paper
|D
iscussionP
aper|
Discussion
Paper
|D
iscussionP
aper|
It is also clear that 134Cs and 137Cs activities ratios when we take into account thepre-existing 137Cs were close to 1 which is also consistent with observed 134Cs and137Cs activities ratio of 0.99±0.03 at very close to the source region of the FNPP1(Buesseler et al., 2011). These are clear evidences that observed 134Cs and excess137Cs originated from the FNPP1 accident as shown in Table 1. The horizontal distri-5
bution of FNPP1-origin 134Cs in the western North Pacific Ocean except just in front ofthe FNPP1 site showed that the high concentration area located close to the FNPP1accident site which might have received both atmospheric deposition – showing goodconsistency with previous atmospheric transport model study (Honda et al., 2012) –and direct discharge (Tsumune et al., 2012) from the FNPP1 site. We see another high10
concentration area near the International Date Line in April–June 2011 as shown inFig. S3 (upper panel). This high concentration region may be more likely explained byatmospheric deposition because of the transport distance compared to surface current.At the sea area east of the International Date Line north of 40◦ N in the Pacific Oceanin April 2011, 134Cs activity in the surface water less than 12 Bqm−3.15
In July–September 2011, relatively high concentration area for which 134Cs activ-ity exceed 10 Bqm−3 moved eastward and arrived at 165◦ E as shown in Fig. S4. InOctober–December 2011, relatively high concentration area for which 134Cs activityexceed 10 Bqm−3 moved more east and arrived at 172◦ E. along 40◦ N as shown inFig. S5. In January–March 2012, it arrived International Date Line as shown in Fig. S6.20
4 Discussions
The atmospheric deposition occurred mainly in March 2011 (Chino et al., 2011), there-fore, 134Cs and 137Cs activity in surface water derived by atmospheric deposition exceptclose area of the FNPP1 site should decrease by dispersion with time rapidly, whileeastward movement of radioactive plume relatively higher activity exceed 10 Bqm−3
25
was observed as shown in Figs. 1 and S3–S6. The radioactive plume were formedby the atmospheric deposition close to the FNPP1 site and direct discharge. It is
271

BGD10, 265–283, 2013
Pathway of plume ofFukushima 137Cs and
134Cs
M. Aoyama et al.
Title Page
Abstract Introduction
Conclusions References
Tables Figures
J I
J I
Back Close
Full Screen / Esc
Printer-friendly Version
Interactive Discussion
Discussion
Paper
|D
iscussionP
aper|
Discussion
Paper
|D
iscussionP
aper|
interesting to estimate a zonal speed of radioactive plume based on our observations.A feature was that the radioactive plume was confined along 40◦ N when the plumereached International Date Line as stated in Sect. 3.2. The radioactive plume travelled1800 km (from 160◦ E to 178◦ E) for 270 days (9 months) (Fig. 1), therefore an averagezonal speed (u) of the surface radioactive plume was calculated to be about 8 cms−1
5
which was consistent with a speed of reported surface current of 4–16 cms−1 at theregion (Maximenko et al., 2009).
Eleven Argo floats were deployed off Fukushima on 31 March–13 April at 37.001◦ N–37.709◦ N, 141.250◦ E–141.399◦ E after the accident (Argo-Information-Center). Nineof 11 floats were still operational until around January–March 2012, therefore we can10
compare our observations and trajectories of 9 Argo floats. In Figs. S3–S6, positionsof Argo floats at mid time of each three months periods (Table S1) were plotted marked“A”. In April–June 2011, a distribution of Fukushima radioactive plume and positionsof Argo floats showed some discrepancy because the distribution of Fukushima ra-dioactive plume was formed by both combination of atmospheric deposition and di-15
rect discharge as stated in Sect. 3.2. In July–September 2011 positions of Argo floatswere moved more east up to 165◦ E, although observed results were so sparse ra-dioactive plume also moved to east as well as Argo floats as shown in Fig. S4. Threemonths later, both Fukushima radioactive plume and Argo floats moved more eastup to 172◦ E as shown in Fig. S5. Almost one year after the accident, again we ob-20
served that both Fukushima radioactive plume and Argo floats moved more east upto 180◦ E as shown in Fig. S6. A zonal speed, u, based on trajectories of nine Argofloats between May 2011 to August 2011 ranged from 0.1 cms−1 to 15.6 cms−1 with anaverage of 7.8 cms−1 as shown in Table S2. A zonal speed, u, based on trajectoriesof nine Argo floats between August 2011 to November 2011 ranged from −1.9 cms−1
25
to 20.1 cms−1 with an average of 7.7 cms−1 (Table S2). It between November 2011 toFebruary 2012 ranged from −1.7 cms−1 to 16.7 cms−1 with an average of 8.9 cms−1
(Table S2). These zonal speeds by Argo floats showed excellent agreement with zonalspeed of Fuksuhima radioactive plume, about 8 cms−1, derived by our observations.
272
BGD10, 265–283, 2013
Pathway of plume ofFukushima 137Cs and
134Cs
M. Aoyama et al.
Title Page
Abstract Introduction
Conclusions References
Tables Figures
J I
J I
Back Close
Full Screen / Esc
Printer-friendly Version
Interactive Discussion
Discussion
Paper
|D
iscussionP
aper|
Discussion
Paper
|D
iscussionP
aper|
Therefore we can say that deploying Argo floats just after nuclear reactor accidentsnear coast line might be good to trace radioactive plume which moves in the surfacelayer.
We can also assume that Fukushima radioactive plume moved with surface water.Therefore it is also interested to compare between surface current speed by satellite5
observations and actual movement of Fukushima radiocaesium obtained by our ob-servations as stated in Sect. 3.2. We look at surface current observation by satellite(Bonjean and Lagerloef, 2002) along 40◦ N (38◦ N–42◦ N) as shown in Tables S3–1and S3–2. As shown in Tables S3–1 and S3–2, zonal speed during the period fromApril 2011 to March 2012 ranged from 1.5 cms−1 to 7.4 cms−1. The average speed es-10
timated by advection of Fukushima radioactivity was 8 cms−1 in average and this zonalspeed by observation showed good agreement with satellite derived surface current aswell as the zonal speed obtained by movement of Argo floats. It should be also notedthat there exist larger variability in the radioactive plume as shown in Fig. S7. Zonalspeed, u, and meridional speed, v , showed temporal and spatial variation as shown15
in Fig. S7, then resulted positions of Argo floats also showed large variability whichindicates that the movement of radioactive plume varied as well.
5 Conclusions
134Cs and 137Cs were released to the North Pacific Ocean by two pathways, direct dis-charge from the Fukushima NPP1 accident site and atmospheric deposition off Honshu20
Islands of Japan, east and northeast of the site. High density observations of 134Cs and137Cs in the surface water were carried out by 17 VOS cruises and several researchvessel cruises since March 2011 till March 2012. The main body of radioactive surfaceplume of which activity was larger than 10 Bqm−3 had been travelling along 40◦ N, andreached The International Date Line on March 2012 one year after the accident. A fea-25
ture was that the radioactive plume was confined along 40◦ N when the plume reachedThe International Date Line. A zonal speed of the surface plume was estimated to be
273

BGD10, 265–283, 2013
Pathway of plume ofFukushima 137Cs and
134Cs
M. Aoyama et al.
Title Page
Abstract Introduction
Conclusions References
Tables Figures
J I
J I
Back Close
Full Screen / Esc
Printer-friendly Version
Interactive Discussion
Discussion
Paper
|D
iscussionP
aper|
Discussion
Paper
|D
iscussionP
aper|
about 8 cms−1 which was consistent with a zonal speed of surface current at the regionobserved by Argo floats and satellite
Supplementary material related to this article is available online at:http://www.biogeosciences-discuss.net/10/265/2013/bgd-10-265-2013-supplement.pdf.5
Acknowledgements. The authors would like to thank the commercial ship company, captainsand crew of 17 VOS ships for their voluntary work to collect seawater samples. The authorsalso thank Aoi Mori, Yukiko Yoshimura, Tomoko Kudo and Shoko Shimada for their work tocreate database, tables and figures.
References10
Aoyama, M. and Hirose, K.: Radiometric determination of anthropogenic radionuclides in sea-water, in: Analysis of Environmental Radionuclides, First ed., edited by: Pavel, P. P., Radioac-tivity in the Environment, Volume 11, Elsevier, Hungary, 137–162, 2008.
Aoyama, M., Hirose, K., Suzuki, Y., Inoue, H., and Sugimura, Y.: High level radioactive nuclidesin Japan in May, Nature, 321, 819–820, 1986.15
Aoyama, M., Hirose, K., and Igarashi, Y.: Re-construction and updating our understand-ing on the global weapons tests 137Cs fallout, J. Environ. Monitor., 8, 431–438,doi:10.1039/b512601k, 2006.
Aoyama, M., Fukasawa, M., Hirose, K., Hamajima, Y., Kawano, T., Povinec, P. P.,and Sanchez-Cabeza, J. A.: Cross equator transport of 137Cs from North Pacific20
Ocean to South Pacific Ocean (BEAGLE2003 cruises), Prog. Oceanogr., 89, 7–16,doi:10.1016/j.pocean.2010.12.003, 2011.
Aoyama, M., Tsumune, D., and Hamajima, Y.: Distribution of 137Cs and 134Cs in the NorthPacific Ocean: impacts of the TEPCO Fukushima-Daiichi NPP accident, J. Radioanal. Nucl.Ch., 1–5, doi:10.1007/s10967-012-2033-2, 2012a.25
274
BGD10, 265–283, 2013
Pathway of plume ofFukushima 137Cs and
134Cs
M. Aoyama et al.
Title Page
Abstract Introduction
Conclusions References
Tables Figures
J I
J I
Back Close
Full Screen / Esc
Printer-friendly Version
Interactive Discussion
Discussion
Paper
|D
iscussionP
aper|
Discussion
Paper
|D
iscussionP
aper|
Aoyama, M., Tsumune, D., Uematsu, M., Kondo, F., and Hamajima, Y.: Temporal variation of134Cs and 137Cs activities in surface water at stations along the coastline near the FukushimaDai-ichi Nuclear Power Plant accident site, Japan, Geochem. J., 46, 321–325, 2012b.
Bonjean, F. and Lagerloef, G. S. E.: Diagnostic model and analysis of the surface cur-rents in the Tropical Pacific Ocean, J. Phys. Oceanogr., 32, 2938–2954, doi:10.1175/1520-5
0485(2002)032<2938:DMAAOT>2.0.CO;2, 2002.Buesseler, K., Aoyama, M., and Fukasawa, M.: Impacts of the Fukushima nuclear power plants
on marine radioactivity, Environ. Sci. Technol., 45, 9931–9935, doi:10.1021/es202816c,2011.
Buesseler, K. O., Jayne, S. R., Fisher, N. S., Rypina, I. I., Baumann, H., Baumann, Z.,10
Breier, C. F., Douglass, E. M., George, J., and Macdonald, A. M.: Fukushima-derived ra-dionuclides in the ocean and biota off Japan, P. Natl. Acad. Sci. USA, 109, 5984–5988,2012.
Chino, M., Nakayama, H., Nagai, H., Terada, H., Katata, G., and Yamazawa, H.: Preliminaryestimation of release amounts of 131I and 137Cs accidentally discharged from the Fukushima15
Daiichi nuclear power plant into the atmosphere, J. Nucl. Sci. Technol., 48, 1129–1134,2011.
Estournel, C., Bosc, E., Bocquet, M., Ulses, C., Marsaleix, P., Winiarek, V., Osvath, I.,Nguyen, C., Duhaut, T., Lyard, F., Michaud, H., and Auclair, F.: Assessment of theamount of cesium-137 released into the Pacific Ocean after the Fukushima accident and20
analysis of its dispersion in Japanese coastal waters, J. Geophys. Res., 117, C11014,doi:10.1029/2012JC007933, 2012.
Hamajima, Y. and Komura, K.: Background components of Ge detectors in Ogoya undergroundlaboratory, Appl. Radiat. Isotopes, 61, 179–183, doi:10.1016/j.apradiso.2004.03.041, 2004.
Hirose, K., Aoyama, M., Igarashi, Y., and Komura, K.: Ultra-sensitive mass spectrometric and25
other methods applied to environmental problems, J. Radioanal. Nucl. Ch., 263, 349–353,doi:10.1007/s10967-005-0593-0, 2005.
Honda, M. C., Aono, T., Aoyama, M., Hamajima, Y., Kawakami, H., Kitamura, M., Masumoto, Y.,Miyazawa, Y., Takigawa, M., and Saino, T.: Dispersion of artificial caesium-134 and-137 inthe western North Pacific one month after the Fukushima accident, Geochem. J., 46, e1–e9,30
2012.Inoue, M., Kofuji, H., Hamajima, Y., Nagao, S., Yoshida, K., and Yamamoto, M.: 134Cs and
137Cs activities in coastal seawater along Northern Sanriku and Tsugaru Strait, northeastern
275

BGD10, 265–283, 2013
Pathway of plume ofFukushima 137Cs and
134Cs
M. Aoyama et al.
Title Page
Abstract Introduction
Conclusions References
Tables Figures
J I
J I
Back Close
Full Screen / Esc
Printer-friendly Version
Interactive Discussion
Discussion
Paper
|D
iscussionP
aper|
Discussion
Paper
|D
iscussionP
aper|
Japan, after Fukushima Dai-ichi Nuclear Power Plant accident, J. Environ. Radioactiv., 111,116–119, doi:10.1016/j.jenvrad.2011.09.012, 2012a.
Inoue, M., Kofuji, H., Nagao, S., Yamamoto, M., Hamajima, Y., Fujimoto, K., Yoshida, K.,Suzuki, A., Takashiro, H., and Hayakawa, K.: Low levels of 134Cs and 137Cs in surface sea-waters around the Japanese Archipelago after the Fukushima Dai-ichi Nuclear Power Plant5
accident in 2011, Geochem. J., 46, 311–320, 2012b.Kawamura, H., Kobayashi, T., Furuno, A., In, T., Ishikawa, Y., Nakayama, T., Shima, S., and
Awaji, T.: Preliminary numerical experiments on oceanic dispersion of 131I and 137Cs dis-charged into the ocean because of the Fukushima Daiichi nuclear power plant disas-ter, J. Nucl. Sci. Technol., 48, 1349–1356, 2011.10
Maximenko, N., Niiler, P., Centurioni, L., Rio, M.-H., Melnichenko, O., Chambers, D., Zlot-nicki, V., and Galperin, B.: Mean dynamic topography of the ocean derived from satellite anddrifting buoy data using three different techniques, J. Atmos. Ocean. Tech., 26, 1910–1919,doi:10.1175/2009jtecho672.1, 2009.
Mori, N., Takahashi, T., Yasuda, T., and Yanagisawa, H.: Survey of 2011 To-15
hoku earthquake tsunami inundation and run-up, Geophys. Res. Lett., 38, L00G14,doi:10.1029/2011gl049210, 2011.
Morino, Y., Ohara, T., and Nishizawa, M.: Atmospheric behavior, deposition, and budget of ra-dioactive materials from the Fukushima Daiichi nuclear power plant in March 2011, Geophys.Res. Lett., 38, L00G11, doi:10.1029/2011gl048689, 2011.20
Povinec, P. P., Aoyama, M., Fukasawa, M., Hirose, K., Komura, K., Sanchez-Cabeza, J. A.,Gastaud, J., Jeskovsky, M., Levy, I., and Sykora, I.: 137Cs water profiles in the South IndianOcean – an evidence for accumulation of pollutants in the subtropical gyre, Prog. Oceanogr.,89, 17–30, doi:10.1016/j.pocean.2010.12.004, 2011.
Sanchez-Cabeza, J. A., Levy, I., Gastaud, J., Eriksson, M., Osvath, I., Aoyama, M.,25
Povinec, P. P., and Komura, K.: Transport of North Pacific 137Cs labeled waters to the south-eastern Atlantic Ocean, Prog. Oceanogr., 89, 31–37, doi:10.1016/j.pocean.2010.12.005,2011.
Stohl, A., Seibert, P., Wotawa, G., Arnold, D., Burkhart, J. F., Eckhardt, S., Tapia, C., Var-gas, A., and Yasunari, T. J.: Xenon-133 and caesium-137 releases into the atmosphere from30
the Fukushima Dai-ichi nuclear power plant: determination of the source term, atmosphericdispersion, and deposition, Atmos. Chem. Phys., 12, 2313–2343, doi:10.5194/acp-12-2313-2012, 2012.
276
BGD10, 265–283, 2013
Pathway of plume ofFukushima 137Cs and
134Cs
M. Aoyama et al.
Title Page
Abstract Introduction
Conclusions References
Tables Figures
J I
J I
Back Close
Full Screen / Esc
Printer-friendly Version
Interactive Discussion
Discussion
Paper
|D
iscussionP
aper|
Discussion
Paper
|D
iscussionP
aper|
The-2011-Tohoku-Earthquake-Tsunami-Joint-Survey-Group: Nationwide field survey of the2011 off the Pacific coast of Tohoku earthquake Tsunami, J. Jpn. Soc. Civil Eng. B, 67,63–66, 2011.
Tsumune, D., Aoyama, M., Hirose, K., Bryan, F. O., Lindsay, K., and Danabasoglu, G.: Transportof 137Cs to the Southern Hemisphere in an ocean general circulation model, Prog. Oceanogr.,5
89, 38–48, doi:10.1016/j.pocean.2010.12.006, 2011.Tsumune, D., Tsubono, T., Aoyama, M., and Hirose, K.: Distribution of oceanic 137Cs from
the Fukushima Dai-ichi Nuclear Power Plant simulated numerically by a regional oceanmodel, J. Environ. Radioactiv., 111, 100–108, doi:10.1016/j.jenvrad.2011.10.007, 2012.
277

BGD10, 265–283, 2013
Pathway of plume ofFukushima 137Cs and
134Cs
M. Aoyama et al.
Title Page
Abstract Introduction
Conclusions References
Tables Figures
J I
J I
Back Close
Full Screen / Esc
Printer-friendly Version
Interactive Discussion
Discussion
Paper
|D
iscussionP
aper|
Discussion
Paper
|D
iscussionP
aper|
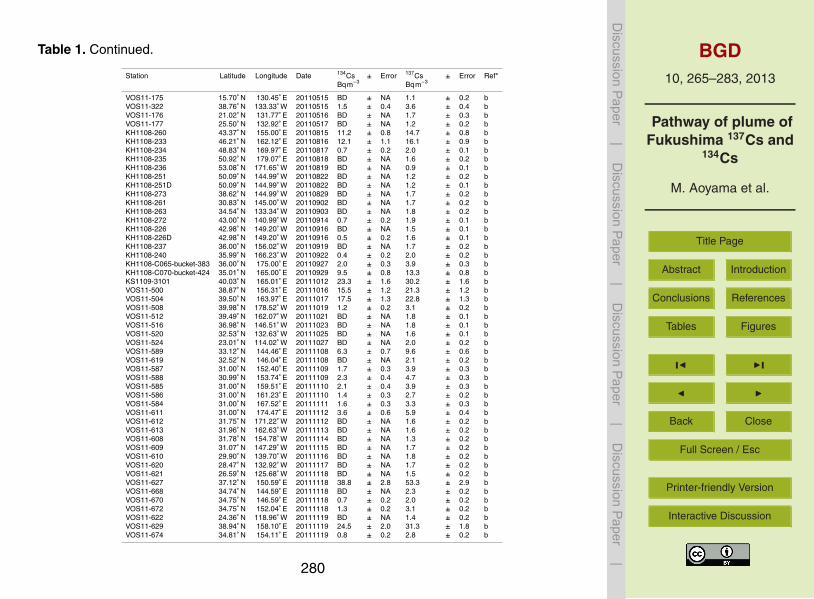
Table 1. 134Cs and 137Cs activity in the surface water in the North Pacific Ocean until March2012.
Station Latitude Longitude Date 134CsBqm−3
± Error 137CsBqm−3
± Error Ref*
VOS11-001 35.68◦ N 143.77◦ E 20110331 507 ± 33 546 ± 28 aVOS11-043 34.95◦ N 143.86◦ E 20110331 132 ± 9 146 ± 8 aVOS11-003 36.60◦ N 147.60◦ E 20110401 1000 ± 70 1080 ± 60 aVOS11-005 37.42◦ N 151.08◦ E 20110401 32.4 ± 2.6 34.7 ± 2.0 bVOS11-044 35.07◦ N 146.44◦ E 20110401 34.0 ± 2.6 36.6 ± 2.1 aVOS11-045 35.29◦ N 151.41◦ E 20110401 33.4 ± 2.7 40.3 ± 2.3 bVOS11-007 38.18◦ N 154.97◦ E 20110402 17.7 ± 1.6 21.3 ± 1.3 bVOS11-009 38.08◦ N 158.58◦ E 20110402 1.9 ± 0.5 3.5 ± 0.4 bVOS11-046 35.12◦ N 154.14◦ E 20110402 9.2 ± 1.0 11.1 ± 0.8 aVOS11-047 34.89◦ N 158.76◦ E 20110402 6.6 ± 0.8 6.5 ± 0.5 aVOS11-048 34.76◦ N 161.27◦ E 20110402 2.6 ± 0.5 3.4 ± 0.4 aVOS11-085 33.85◦ N 141.31◦ E 20110402 BD ± NA 1.6 ± 0.2 aVOS11-011 37.38◦ N 162.40◦ E 20110403 2.0 ± 0.4 3.4 ± 0.3 bVOS11-013 36.67◦ N 166.15◦ E 20110403 2.2 ± 0.4 3.9 ± 0.3 bVOS11-049 34.09◦ N 173.28◦ E 20110403 3.4 ± 0.6 6.1 ± 0.5 aVOS11-086 34.33◦ N 144.68◦ E 20110403 158 ± 11 181 ± 9 aVOS11-087 34.51◦ N 148.40◦ E 20110403 98.4 ± 6.7 117 ± 6 aVOS11-015 35.28◦ N 173.53◦ E 20110404 2.1 ± 0.4 3.8 ± 0.3 bVOS11-050 35.09◦ N 173.38◦ E 20110404 BD ± NA 2.4 ± 0.3 bVOS11-088 34.66◦ N 150.97◦ E 20110404 73.3 ± 5.6 86.8 ± 4.9 bVOS11-089 34.81◦ N 153.51◦ E 20110404 10.2 ± 1.1 12.5 ± 0.8 aVOS11-090 34.98◦ N 156.16◦ E 20110404 2.7 ± 0.7 6.0 ± 0.6 aVOS11-017 35.13◦ N 179.67◦ W 20110405 BD ± NA 2.1 ± 0.2 bVOS11-051 33.85◦ N 179.69◦ E 20110405 BD ± NA 2.0 ± 0.2 bVOS11-091 35.15◦ N 158.93◦ E 20110405 3.3 ± 0.6 7.3 ± 0.6 aVOS11-092 35.32◦ N 161.70◦ E 20110405 3.4 ± 0.6 5.1 ± 0.4 aVOS11-019 34.08◦ N 173.87◦ W 20110406 BD ± NA 1.8 ± 0.2 bVOS11-093 35.66◦ N 167.30◦ E 20110406 3.4 ± 0.6 4.7 ± 0.4 bVOS11-094 35.99◦ N 173.05◦ E 20110406 BD ± NA 2.2 ± 0.2 bVOS11-095 36.35◦ N 178.99◦ E 20110406 BD ± NA 2.2 ± 0.4 aVOS11-021 41.12◦ N 167.75◦ W 20110407 BD ± NA 1.7 ± 0.2 bVOS11-052 33.91◦ N 173.89◦ W 20110407 BD ± NA 1.8 ± 0.2 bVOS11-053 33.96◦ N 168.73◦ W 20110407 BD ± NA 1.5 ± 0.2 bVOS11-096 36.70◦ N 174.98◦ W 20110407 BD ± NA 1.8 ± 0.2 bVOS11-023 42.33◦ N 159.88◦ W 20110408 BD ± NA 1.8 ± 0.2 bVOS11-054 33.86◦ N 161.73◦ W 20110408 1.0 ± 0.3 2.3 ± 0.2 bVOS11-097 36.99◦ N 169.34◦ W 20110408 BD ± NA 1.6 ± 0.2 bVOS11-025 43.00◦ N 151.95◦ W 20110409 BD ± NA 1.7 ± 0.2 bVOS11-055 33.46◦ N 154.15◦ W 20110409 BD ± NA 1.4 ± 0.2 bVOS11-098 36.84◦ N 163.23◦ W 20110409 BD ± NA 1.9 ± 0.2 bVOS11-027 43.62◦ N 143.57◦ W 20110410 BD ± NA 2.2 ± 0.2 bVOS11-056 32.52◦ N 146.59◦ W 20110410 BD ± NA 1.7 ± 0.2 bVOS11-099 36.50◦ N 157.55◦ W 20110410 BD ± NA 2.1 ± 0.2 bVOS11-100 35.88◦ N 151.92◦ W 20110410 BD ± NA 1.7 ± 0.2 bVOS11-125 33.29◦ N 142.20◦ E 20110410 3.1 ± 0.6 3.5 ± 0.4 bVOS11-029 38.18◦ N 134.97◦ W 20110411 BD ± NA 1.4 ± 0.2 bVOS11-057 31.32◦ N 140.20◦ W 20110411 BD ± NA 1.8 ± 0.2 bVOS11-101 34.97◦ N 146.43◦ W 20110411 BD ± NA 1.9 ± 0.2 bVOS11-127 35.36◦ N 147.57◦ E 20110411 2.2 ± 0.6 3.3 ± 0.3 bVOS11-102 33.92◦ N 141.12◦ W 20110412 BD ± NA 1.9 ± 0.2 bVOS11-103 32.50◦ N 135.86◦ W 20110412 BD ± NA 1.6 ± 0.2 bVOS11-129 39.01◦ N 152.70◦ E 20110412 1.8 ± 0.4 3.5 ± 0.3 b
278

BGD10, 265–283, 2013
Pathway of plume ofFukushima 137Cs and
134Cs
M. Aoyama et al.
Title Page
Abstract Introduction
Conclusions References
Tables Figures
J I
J I
Back Close
Full Screen / Esc
Printer-friendly Version
Interactive Discussion
Discussion
Paper
|D
iscussionP
aper|
Discussion
Paper
|D
iscussionP
aper|
Table 1. Continued.
Station Latitude Longitude Date 134CsBqm−3
± Error 137CsBqm−3
± Error Ref*
VOS11-058 28.94◦ N 130.73◦ W 20110413 BD ± NA 1.4 ± 0.2 bVOS11-059 27.66◦ N 126.44◦ W 20110413 BD ± NA 1.9 ± 0.2 bVOS11-104 31.02◦ N 130.83◦ W 20110413 BD ± NA 2.2 ± 0.2 bVOS11-131 42.20◦ N 157.80◦ E 20110413 10.1 ± 1.4 16.7 ± 1.2 bMR1103-02 36.16◦ N 142.03◦ E 20110414 6.0 ± 1.0 9.0 ± 1.0 cMR1103-03 37.09◦ N 142.72◦ E 20110414 109 ± 3 117 ± 4 cMR1103-04 37.86◦ N 143.31◦ E 20110414 273 ± 4 284 ± 5 cVOS11-060 25.42◦ N 120.36◦ W 20110414 BD ± NA 1.5 ± 0.2 bVOS11-105 29.24◦ N 126.05◦ W 20110414 BD ± NA 1.8 ± 0.2 bVOS11-133 44.80◦ N 163.82◦ E 20110414 2.8 ± 0.7 3.1 ± 0.4 bMR1103-05 38.21◦ N 143.79◦ E 20110415 145 ± 4 148 ± 5 cMR1103-06 38.11◦ N 143.08◦ E 20110416 172 ± 4 174 ± 5 cMR1103-07 38.99◦ N 145.78◦ E 20110416 53 ± 2 61 ± 3 cVOS11-137 46.25◦ N 177.01◦ E 20110416 2.3 ± 0.6 2.7 ± 0.4 bVOS11-141 46.23◦ N 169.31◦ W 20110416 2.4 ± 0.5 3.4 ± 0.3 bMR1103-09 40.96◦ N 150.87◦ E 20110417 67 ± 2 72 ± 3 cMR1103-10 41.96◦ N 152.46◦ E 20110417 17 ± 2 19 ± 2 cMR1103-11 42.97◦ N 154.14◦ E 20110417 13 ± 2 14 ± 1 cMR1103-12 43.99◦ N 154.99◦ E 20110417 41 ± 2 43 ± 3 cMR1103-13 44.96◦ N 157.05◦ E 20110418 18 ± 1 21 ± 2 cMR1103-14 45.97◦ N 158.50◦ E 20110418 14 ± 2 16 ± 2 cVOS11-143 46.23◦ N 162.05◦ W 20110418 2.7 ± 0.6 3.0 ± 0.4 bMR1103-15-01 47.00◦ N 160.00◦ E 20110421 8 ± 1 9 ± 1 cMR1103-15-02 47.00◦ N 160.00◦ E 20110421 10 ± 1 7 ± 1 cMR1103-15-11 47.00◦ N 160.00◦ E 20110421 8 ± 1 7 ± 2 cMR1103-15-12 47.00◦ N 160.00◦ E 20110421 5 ± 1 10 ± 1 cVOS11-165 30.07◦ N 131.81◦ E 20110421 BD ± NA 1.7 ± 0.2 bVOS11-166 27.16◦ N 131.24◦ E 20110422 BD ± NA 1.5 ± 0.2 bVOS11-167 24.23◦ N 130.48◦ E 20110422 BD ± NA 1.6 ± 0.3 bMR1103-16 38.08◦ N 146.42◦ E 20110426 48 ± 2 53 ± 2 cMR1103-17 37.00◦ N 146.05◦ E 20110426 67 ± 2 67 ± 2 cMR1103-18 36.02◦ N 145.77◦ E 20110426 5 ± 1 9 ± 1 cMR1103-19 35.00◦ N 145.40◦ E 20110426 4 ± 1 5 ± 1 cMR1103-20 34.04◦ N 145.12◦ E 20110427 9 ± 1 9 ± 1 cMR1103-21 33.02◦ N 144.78◦ E 20110427 13 ± 1 17 ± 1 cMR1103-22 32.47◦ N 144.50◦ E 20110427 56 ± 2 52 ± 2 cMR1103-23 31.03◦ N 144.82◦ E 20110428 6 ± 1 7 ± 1 cMR1103-25-1 30.00◦ N 145.00◦ E 20110428 14 ± 1 18 ± 1 cMR1103-25-2 30.00◦ N 145.00◦ E 20110428 3 ± 1 5 ± 1 cMR1103-24 31.01◦ N 143.74◦ E 20110503 11 ± 1 11 ± 1 cMR1103-28 33.95◦ N 140.25◦ E 20110503 6 ± 1 6 ± 1 cVOS11-147 53.81◦ N 146.08◦ W 20110508 BD ± NA 1.6 ± 0.2 bVOS11-301 36.49◦ N 147.73◦ E 20110509 30.0 ± 2.6 38.1 ± 2.3 bVOS11-310 38.31◦ N 156.66◦ E 20110510 12.7 ± 1.5 14.6 ± 1.1 bVOS11-151 53.41◦ N 178.21◦ W 20110511 BD ± NA 1.2 ± 0.2 bVOS11-307 41.31◦ N 170.45◦ E 20110511 3.2 ± 0.6 5.1 ± 0.5 bVOS11-313 43.66◦ N 170.30◦ W 20110511 3.3 ± 0.6 6.4 ± 0.5 bVOS11-314 43.61◦ N 160.96◦ W 20110512 3.8 ± 0.7 6.8 ± 0.5 bVOS11-317 42.86◦ N 179.62◦ E 20110512 164 ± 11 196 ± 10 bVOS11-319 42.72◦ N 151.12◦ W 20110513 13.5 ± 1.5 13.6 ± 1.1 bVOS11-321 40.97◦ N 141.46◦ W 20110514 7.9 ± 0.9 10.9 ± 0.7 b
279
BGD10, 265–283, 2013
Pathway of plume ofFukushima 137Cs and
134Cs
M. Aoyama et al.
Title Page
Abstract Introduction
Conclusions References
Tables Figures
J I
J I
Back Close
Full Screen / Esc
Printer-friendly Version
Interactive Discussion
Discussion
Paper
|D
iscussionP
aper|
Discussion
Paper
|D
iscussionP
aper|
Table 1. Continued.
Station Latitude Longitude Date 134CsBqm−3
± Error 137CsBqm−3
± Error Ref*
VOS11-175 15.70◦ N 130.45◦ E 20110515 BD ± NA 1.1 ± 0.2 bVOS11-322 38.76◦ N 133.33◦ W 20110515 1.5 ± 0.4 3.6 ± 0.4 bVOS11-176 21.02◦ N 131.77◦ E 20110516 BD ± NA 1.7 ± 0.3 bVOS11-177 25.50◦ N 132.92◦ E 20110517 BD ± NA 1.2 ± 0.2 bKH1108-260 43.37◦ N 155.00◦ E 20110815 11.2 ± 0.8 14.7 ± 0.8 bKH1108-233 46.21◦ N 162.12◦ E 20110816 12.1 ± 1.1 16.1 ± 0.9 bKH1108-234 48.83◦ N 169.97◦ E 20110817 0.7 ± 0.2 2.0 ± 0.1 bKH1108-235 50.92◦ N 179.07◦ E 20110818 BD ± NA 1.6 ± 0.2 bKH1108-236 53.08◦ N 171.65◦ W 20110819 BD ± NA 0.9 ± 0.1 bKH1108-251 50.09◦ N 144.99◦ W 20110822 BD ± NA 1.2 ± 0.2 bKH1108-251D 50.09◦ N 144.99◦ W 20110822 BD ± NA 1.2 ± 0.1 bKH1108-273 38.62◦ N 144.99◦ W 20110829 BD ± NA 1.7 ± 0.2 bKH1108-261 30.83◦ N 145.00◦ W 20110902 BD ± NA 1.7 ± 0.2 bKH1108-263 34.54◦ N 133.34◦ W 20110903 BD ± NA 1.8 ± 0.2 bKH1108-272 43.00◦ N 140.99◦ W 20110914 0.7 ± 0.2 1.9 ± 0.1 bKH1108-226 42.98◦ N 149.20◦ W 20110916 BD ± NA 1.5 ± 0.1 bKH1108-226D 42.98◦ N 149.20◦ W 20110916 0.5 ± 0.2 1.6 ± 0.1 bKH1108-237 36.00◦ N 156.02◦ W 20110919 BD ± NA 1.7 ± 0.2 bKH1108-240 35.99◦ N 166.23◦ W 20110922 0.4 ± 0.2 2.0 ± 0.2 bKH1108-C065-bucket-383 36.00◦ N 175.00◦ E 20110927 2.0 ± 0.3 3.9 ± 0.3 bKH1108-C070-bucket-424 35.01◦ N 165.00◦ E 20110929 9.5 ± 0.8 13.3 ± 0.8 bKS1109-3101 40.03◦ N 165.01◦ E 20111012 23.3 ± 1.6 30.2 ± 1.6 bVOS11-500 38.87◦ N 156.31◦ E 20111016 15.5 ± 1.2 21.3 ± 1.2 bVOS11-504 39.50◦ N 163.97◦ E 20111017 17.5 ± 1.3 22.8 ± 1.3 bVOS11-508 39.98◦ N 178.52◦ W 20111019 1.2 ± 0.2 3.1 ± 0.2 bVOS11-512 39.49◦ N 162.07◦ W 20111021 BD ± NA 1.8 ± 0.1 bVOS11-516 36.98◦ N 146.51◦ W 20111023 BD ± NA 1.8 ± 0.1 bVOS11-520 32.53◦ N 132.63◦ W 20111025 BD ± NA 1.6 ± 0.1 bVOS11-524 23.01◦ N 114.02◦ W 20111027 BD ± NA 2.0 ± 0.2 bVOS11-589 33.12◦ N 144.46◦ E 20111108 6.3 ± 0.7 9.6 ± 0.6 bVOS11-619 32.52◦ N 146.04◦ E 20111108 BD ± NA 2.1 ± 0.2 bVOS11-587 31.00◦ N 152.40◦ E 20111109 1.7 ± 0.3 3.9 ± 0.3 bVOS11-588 30.99◦ N 153.74◦ E 20111109 2.3 ± 0.4 4.7 ± 0.3 bVOS11-585 31.00◦ N 159.51◦ E 20111110 2.1 ± 0.4 3.9 ± 0.3 bVOS11-586 31.00◦ N 161.23◦ E 20111110 1.4 ± 0.3 2.7 ± 0.2 bVOS11-584 31.00◦ N 167.52◦ E 20111111 1.6 ± 0.3 3.3 ± 0.3 bVOS11-611 31.00◦ N 174.47◦ E 20111112 3.6 ± 0.6 5.9 ± 0.4 bVOS11-612 31.75◦ N 171.22◦ W 20111112 BD ± NA 1.6 ± 0.2 bVOS11-613 31.96◦ N 162.63◦ W 20111113 BD ± NA 1.6 ± 0.2 bVOS11-608 31.78◦ N 154.78◦ W 20111114 BD ± NA 1.3 ± 0.2 bVOS11-609 31.07◦ N 147.29◦ W 20111115 BD ± NA 1.7 ± 0.2 bVOS11-610 29.90◦ N 139.70◦ W 20111116 BD ± NA 1.8 ± 0.2 bVOS11-620 28.47◦ N 132.92◦ W 20111117 BD ± NA 1.7 ± 0.2 bVOS11-621 26.59◦ N 125.68◦ W 20111118 BD ± NA 1.5 ± 0.2 bVOS11-627 37.12◦ N 150.59◦ E 20111118 38.8 ± 2.8 53.3 ± 2.9 bVOS11-668 34.74◦ N 144.59◦ E 20111118 BD ± NA 2.3 ± 0.2 bVOS11-670 34.75◦ N 146.59◦ E 20111118 0.7 ± 0.2 2.0 ± 0.2 bVOS11-672 34.75◦ N 152.04◦ E 20111118 1.3 ± 0.2 3.1 ± 0.2 bVOS11-622 24.36◦ N 118.96◦ W 20111119 BD ± NA 1.4 ± 0.2 bVOS11-629 38.94◦ N 158.10◦ E 20111119 24.5 ± 2.0 31.3 ± 1.8 bVOS11-674 34.81◦ N 154.11◦ E 20111119 0.8 ± 0.2 2.8 ± 0.2 b
280

BGD10, 265–283, 2013
Pathway of plume ofFukushima 137Cs and
134Cs
M. Aoyama et al.
Title Page
Abstract Introduction
Conclusions References
Tables Figures
J I
J I
Back Close
Full Screen / Esc
Printer-friendly Version
Interactive Discussion
Discussion
Paper
|D
iscussionP
aper|
Discussion
Paper
|D
iscussionP
aper|
Table 1. Continued.
Station Latitude Longitude Date 134CsBqm−3
± Error 137CsBqm−3
± Error Ref*
VOS11-631 42.07◦ N 172.01◦ E 20111120 31.5 ± 2.5 41.5 ± 2.3 bVOS11-676 35.33◦ N 161.22◦ E 20111120 13.3 ± 1.0 19.6 ± 1.1 bVOS11-678 35.88◦ N 168.70◦ E 20111120 13.5 ± 1.1 19.0 ± 1.1 bVOS11-633 45.64◦ N 171.01◦ W 20111122 1.9 ± 0.3 3.4 ± 0.3 bVOS11-680 36.03◦ N 179.37◦ E 20111122 2.3 ± 0.3 4.6 ± 0.3 bVOS11-682 36.02◦ N 170.75◦ W 20111122 1.7 ± 0.2 4.3 ± 0.3 bVOS11-684 35.78◦ N 163.53◦ W 20111123 0.5 ± 0.2 2.2 ± 0.2 bVOS11-635 48.36◦ N 153.39◦ W 20111124 0.8 ± 0.2 1.5 ± 0.1 bVOS11-686 34.83◦ N 150.78◦ W 20111124 BD ± NA 1.8 ± 0.1 bVOS11-688 34.42◦ N 147.68◦ W 20111125 BD ± NA 1.9 ± 0.2 bVOS11-637 47.91◦ N 135.59◦ W 20111126 BD ± NA 1.3 ± 0.2 bVOS11-690 32.29◦ N 140.64◦ W 20111126 BD ± NA 1.7 ± 0.2 bVOS11-692 30.65◦ N 135.59◦ W 20111126 BD ± NA 1.5 ± 0.1 bVOS11-528 18.82◦ N 128.98◦ W 20111128 BD ± NA 1.6 ± 0.1 bVOS11-694 27.78◦ N 126.78◦ W 20111128 BD ± NA 1.8 ± 0.1 bVOS11-696 25.27◦ N 119.89◦ W 20111129 BD ± NA 1.7 ± 0.1 bVOS11-532 20.00◦ N 143.49◦ W 20111130 BD ± NA 1.9 ± 0.1 bVOS11-698 22.58◦ N 113.60◦ W 20111130 BD ± NA 1.2 ± 0.1 bVOS11-700 19.68◦ N 107.36◦ W 20111201 BD ± NA 1.4 ± 0.1 bVOS11-638 52.44◦ N 141.29◦ W 20111204 BD ± NA 1.3 ± 0.1 bVOS11-536 21.50◦ N 178.69◦ W 20111205 BD ± NA 1.6 ± 0.1 bVOS11-639 53.50◦ N 149.15◦ W 20111205 BD ± NA 1.2 ± 0.1 bVOS11-640 43.63◦ N 148.53◦ E 20111213 BD ± NA 1.4 ± 0.2 bVOS11-646 32.33◦ N 138.03◦ E 20111217 BD ± NA 1.4 ± 0.2 bVOS11-595 31.26◦ N 70.86◦ W 20111218 BD ± NA 1.0 ± 0.2 bVOS11-602 31.62◦ N 62.81◦ W 20111219 BD ± NA 1.0 ± 0.1 bVOS11-603 32.21◦ N 55.02◦ W 20111220 BD ± NA 1.2 ± 0.1 bVOS11-604 32.85◦ N 46.70◦ W 20111221 BD ± NA 1.3 ± 0.1 bVOS11-605 33.45◦ N 38.73◦ W 20111222 BD ± NA 1.1 ± 0.1 bVOS11-606 34.09◦ N 30.34◦ W 20111223 BD ± NA 1.1 ± 0.1 bVOS11-607 34.73◦ N 22.19◦ W 20111224 BD ± NA 1.1 ± 0.1 bVOS11-596 35.43◦ N 12.96◦ W 20111226 BD ± NA 1.2 ± 0.1 bVOS11-702 22.11◦ N 168.54◦ W 20120103 BD ± NA 1.6 ± 0.1 bVOS11-704 22.97◦ N 179.98◦ E 20120105 BD ± NA 1.6 ± 0.2 bVOS11-706 23.83◦ N 169.24◦ E 20120108 BD ± NA 1.5 ± 0.1 bVOS11-708 28.79◦ N 149.73◦ E 20120112 0.9 ± 0.2 2.6 ± 0.2 bVOS11-542 34.45◦ N 130.08◦ E 20120121 BD ± NA 1.7 ± 0.2 bVOS11-543 34.45◦ N 130.08◦ E 20120121 BD ± NA 1.4 ± 0.1 bVOS11-544 32.53◦ N 132.98◦ E 20120122 BD ± NA 1.6 ± 0.2 bVOS11-545 32.53◦ N 132.98◦ E 20120122 BD ± NA 1.3 ± 0.1 bVOS12-710 34.88◦ N 146.52◦ E 20120122 BD ± NA 1.9 ± 0.2 bVOS11-546 33.57◦ N 136.44◦ E 20120123 BD ± NA 1.3 ± 0.1 bVOS11-547 33.57◦ N 136.45◦ E 20120123 BD ± NA 1.4 ± 0.2 bVOS12-716 40.61◦ N 151.98◦ E 20120124 17.4 ± 1.3 26.5 ± 1.4 bVOS12-718 43.12◦ N 153.82◦ E 20120124 3.0 ± 0.4 5.1 ± 0.3 bVOS12-756 32.41◦ N 156.27◦ E 20120126 3.7 ± 0.5 6.6 ± 0.5 bVOS12-763 26.89◦ N 177.94◦ W 20120129 BD ± NA 1.6 ± 0.2 bVOS12-759 27.84◦ N 170.90◦ W 20120130 0.8 ± 0.2 2.1 ± 0.2 bVOS12-762 32.98◦ N 162.94◦ W 20120131 BD ± NA 1.7 ± 0.2 bVOS12-761 33.05◦ N 155.28◦ W 20120201 BD ± NA 1.6 ± 0.2 bVOS12-766 34.26◦ N 146.90◦ W 20120202 BD ± NA 2.0 ± 0.2 b
281

BGD10, 265–283, 2013
Pathway of plume ofFukushima 137Cs and
134Cs
M. Aoyama et al.
Title Page
Abstract Introduction
Conclusions References
Tables Figures
J I
J I
Back Close
Full Screen / Esc
Printer-friendly Version
Interactive Discussion
Discussion
Paper
|D
iscussionP
aper|
Discussion
Paper
|D
iscussionP
aper|
Table 1. Continued.
Station Latitude Longitude Date 134CsBqm−3
± Error 137CsBqm−3
± Error Ref*
VOS12-768 35.16◦ N 139.09◦ W 20120203 BD ± NA 2.2 ± 0.2 bVOS12-724 48.99◦ N 140.82◦ W 20120204 BD ± NA 1.3 ± 0.1 bVOS12-769 36.36◦ N 131.17◦ W 20120204 BD ± NA 1.7 ± 0.2 bVOS12-726 47.53◦ N 131.87◦ W 20120205 BD ± NA 1.4 ± 0.1 bKH1201-EPO006 0.01◦ N 120.00◦ W 20120209 BD ± NA 1.0 ± 0.1 bKH1201-EPO007 0.00◦ N 95.50◦ W 20120210 BD ± NA 1.0 ± 0.1 bKH1201-EPO008 0.01◦ N 100.01◦ W 20120211 BD ± NA 1.1 ± 0.1 bKH1201-EPO009 0.06◦ N 105.00◦ W 20120212 BD ± NA 1.1 ± 0.1 bKH1201-EPO010 0.00◦ N 110.03◦ W 20120213 BD ± NA 1.2 ± 0.1 bKS1202-3326 19.99◦ N 164.98◦ E 20120215 BD ± NA 1.3 ± 0.1 bKS1202-3328 18.00◦ N 164.99◦ E 20120215 BD ± NA 1.2 ± 0.1 bKH1201-EPO011 5.11◦ N 115.05◦ W 20120215 BD ± NA 1.1 ± 0.1 bVOS12-773 26.82◦ N 173.34◦ E 20120217 BD ± NA 2.4 ± 0.3 bKH1201-EPO012 10.29◦ N 148.63◦ W 20120217 BD ± NA 0.8 ± 0.1 bKH1201-EPO013 15.54◦ N 153.13◦ W 20120218 BD ± NA 1.3 ± 0.1 bVOS12-776 27.11◦ N 158.80◦ E 20120219 0.9 ± 0.3 3.2 ± 0.3 bVOS12-778 29.35◦ N 151.75◦ E 20120220 1.4 ± 0.3 3.7 ± 0.3 bVOS12-1028 32.29◦ N 153.33◦ W 20120224 BD ± NA 1.6 ± 0.2 bKH1201-EPO014 24.50◦ N 177.50◦ W 20120226 BD ± NA 1.4 ± 0.1 bVOS12-1044 34.07◦ N 162.63◦ E 20120227 4.2 ± 0.4 7.9 ± 0.4 bVOS12-1085 35.60◦ N 147.09◦ E 20120228 4.3 ± 0.4 8.4 ± 0.5 bKH1201-EPO016 26.38◦ N 174.58◦ W 20120228 BD ± NA 1.8 ± 0.1 bKH1201-EPO17 27.60◦ N 169.73◦ E 20120229 1.0 ± 0.1 2.6 ± 0.1 bVOS12-1047 34.53◦ N 175.90◦ E 20120229 6.0 ± 0.5 9.6 ± 0.5 bVOS12-1089 36.52◦ N 154.17◦ E 20120229 9.2 ± 0.7 16.7 ± 0.9 bVOS12-1093 37.50◦ N 161.82◦ E 20120301 6.8 ± 0.6 11.4 ± 0.6 bKH1201-EPO19 30.11◦ N 159.62◦ E 20120302 1.6 ± 0.1 3.5 ± 0.2 bVOS12-1053 33.42◦ N 163.89◦ W 20120302 BD ± NA 2.1 ± 0.1 bVOS12-1097 39.46◦ N 177.47◦ E 20120302 8.6 ± 0.7 13.6 ± 0.8 bKH1201-EPO20 31.41◦ N 154.28◦ E 20120303 3.4 ± 0.3 6.6 ± 0.4 bKH1201-EPO21 32.49◦ N 149.82◦ E 20120304 1.9 ± 0.2 3.9 ± 0.2 bVOS12-1068 30.09◦ N 148.73◦ W 20120304 BD ± NA 1.7 ± 0.1 bKH1201-EPO22 33.77◦ N 144.39◦ E 20120305 0.6 ± 0.1 2.4 ± 0.1 bVOS12-1101 41.49◦ N 166.02◦ E 20120305 1.2 ± 0.2 3.0 ± 0.2 bVOS12-1070 27.30◦ N 136.36◦ W 20120306 BD ± NA 1.5 ± 0.1 bVOS12-1105 42.12◦ N 149.75◦ E 20120307 BD ± NA 1.6 ± 0.1 bVOS12-1062 23.72◦ N 120.96◦ W 20120308 BD ± NA 1.6 ± 0.2 bVOS12-1109 40.45◦ N 133.84◦ E 20120309 BD ± NA 1.7 ± 0.1 bVOS12-1113 31.92◦ N 136.82◦ W 20120316 BD ± NA 1.6 ± 0.1 bVOS12-1117 32.97◦ N 152.40◦ E 20120318 BD ± NA 1.7 ± 0.1 bVOS12-1119 34.06◦ N 161.83◦ E 20120319 0.8 ± 0.2 2.7 ± 0.2 bVOS12-1123 34.86◦ N 177.27◦ E 20120321 3.4 ± 0.3 5.8 ± 0.3 b
a: Aoyama et al. (2012a)b: this studyc: Honda et al. (2012)
282

BGD10, 265–283, 2013
Pathway of plume ofFukushima 137Cs and
134Cs
M. Aoyama et al.
Title Page
Abstract Introduction
Conclusions References
Tables Figures
J I
J I
Back Close
Full Screen / Esc
Printer-friendly Version
Interactive Discussion
Discussion
Paper
|D
iscussionP
aper|
Discussion
Paper
|D
iscussionP
aper|
Fig. 1. 134Cs (left) and 137Cs (right) activity in the surface water during the period from 11 March2011 (day 0) to 31 July 2012 (day 510).
283