surface hydrology specialist report - erm€¦ · proposed gamsberg zinc mine northern cape, south...
TRANSCRIPT

Annex G.7
Surface Hydrology Specialist Report

PROPOSED GAMSBERG ZINC MINENORTHERN CAPE, SOUTH AFRICA
HYDROLOGICAL IMPACT ASSESSMENT
FINAL REPORT
HHO AFRICA REP 7116 701 8001 REV 2Cape Town April 2013

(ii)
Form QS31-SF8 Rev 2 Page 1of 1
PROPOSED GAMSBERG ZINC MINE
HYDROLOGICAL IMPACT ASSESSMENT
Document Verification Rev Date Prepared by Checked by Approved by Description Status
0 18/02/2013 F de Villiers C Avenant J Gibberd Draft Report Issued Approved
1 18/04/2013 F de Villiers C Avenant J Gibberd Final Report Issued Approved
2 19/04/2013 F de Villiers C Avenant J Gibberd Final Revised Report Issued Approved
Revision Grid Page Change Page Change Page Change
(i) Declaration of Interest added 12 Flood Line Determination added 29 Table 17 revised
(ii) Executive Summary expanded 13 30
(iii) 14 31
(iv) 15 32
(v) 16 33
(vi) 17 Table 11 amended 34
1 18 35
2 19 36
3 20 Graph 7 corrected 37
4 21 38
5 22 39 6 Elaborated on PE/RI 23 40
7 24 41
8 25 Table 14 revised 42
9 26 Table 15 revised 43
10 Flood Line Determination added 27 44
11 Flood Line Determination added 28 Table 16 revised 45

(i)
PROPOSED GAMSBERG ZINC MINE
HYDROLOGICAL IMPACT ASSESSMENT
DECLARATION OF INTEREST_______________________________________________________________________
The author of this report, Fred de Villiers, hereby declares that he is an independent consultantappointed by ERM and has no business, financial, personal or other interest in the activity,application or appeal in respect of which he was appointed other than fair remuneration forwork performed in connection with the activity, application or appeal. There are nocircumstances that compromise the objectivity of the specialist performing such work. Allopinions expressed in this report are his own.
__________________
Fred de Villiers PrEngECSA Registration Number 20040009April 2013

(ii)
EXECUTIVE SUMMARY_______________________________________________________________________
The proposed open pit Gamsberg zinc mine near Aggeneys in the Northern Cape is likely tonecessitate extensive construction and development. This would have a significant impact oncatchment hydrology, as certain characteristics of some of the catchments would undergopermanent change. This report assesses the impact of these changes on surface water resourcesand presents mitigating measures, which, if applied, would reduce the negative impact of theproposed development.
Flood lines have been calculated based on the available LIDAR survey data for the 1% PE (100year RI) design storm event and the flood plain delineated accordingly. However, as this surveydid not cover the northern sub catchment in its entirety, it is not possible to verify whether theproposed tailings dam would be situated outside the flood plain as required by DWA.
Apart from the proposed plant area, which would need to be reconfigured or relocated, allother proposed infrastructure is indicated outside the 100 year flood plain, or more than 100mfrom the centre line of the nearest water course.
It is recommended that, before the tailings dam is finally placed, the topographic survey isextended to include the entire northern sub catchment. Subsequently, revised flood linesshould be determined. Furthermore, it is recommended that the plant area be reconfigured orrelocated to outside the 100 year flood line as required by DWA.
The anticipated key impacts of the project on surface water resources are as follows:Natural water courses would be removed or and alteredReduced peak runoff and discharge volumesReduction in mean annual runoffIncreased sediment yieldIncreased pollutant load
Whilst the study does not consider any of the above aspects to have a major impact on surfacewater resources, the prevailing significance of the impacts are moderate. However, through thesuccessful implementation of the proposed mitigation measures, impact significance may bereduced.

(iii)
GLOSSARY_______________________________________________________________________
BPG Best Practice GuidelinesBMP Best Management PracticesESIA Environmental and Social Impact AssessmentDWA Department of Water AffairsEMP Environmental Management PlanFRD Fine Residue DepositsICOLD International Committee on Large DamsIDF Intensity Duration FrequencyIFC International Finance CorporationIWRM Integrated Water Resource ManagementIWWMP Integrated Water and Waste Management PlanMAE Mean Annual EvaporationMAP Mean Annual PrecipitationMAR Mean Annual RunoffMPRDA Mining and Petroleum Resources Management ActMRD Mine Residue DepositsNWA National Water ActPCD Pollution Control DamsPE Probability of ExceedancePFS Pre feasibility StudyRDF Recommended Design FloodRI Recurrence IntervalRMF Regional Maximum FloodSANCOLD South African Committee on Large DamsSANS South African National StandardSCS Soil Conservation SurveySDF Standard Design FloodSEF Safety Evaluation FloodSUH Synthetic Unit HydrographSWMP Storm Water Management PlanSWMS Storm Water Management SystemTDS Total Dissolved SolidsTSS Total Suspended SolidsWHO World Health OrganisationWRC Water Research CommissionWWTW Waste Water Treatment Works

(iv)
PROPOSED GAMSBERG ZINC MINEHYDROLOGICAL IMPACT ASSESSMENT
CONTENTS PAGE NO
DECLARATION OF INTEREST
EXECUTIVE SUMMARY
GLOSSARY
1 INTRODUCTION 1
2 APPROACH & METHODOLOGY 1
3 CATCHMENT HYDROLOGY 23.1 Catchment Characteristics3.1.1 Area3.1.2 Topography, Soils & Vegetation3.1.3 Catchment Slope3.1.4 Collector Length3.2 Climate, Rainfall & Design Storm3.3 Time of Concentration3.4 Peak Runoff Flow & Volume3.5 Mean Annual Runoff3.6 Regional Maximum Flood3.7 Site Specific Water Resources3.8 Surface Water Quality3.9 Flood Line Determination
4 APPLICABLE POLICIES, LEGISLATION, STANDARDS & GUIDELINES 104.1 National Water Act, 1998 (Act 36 of 1998)4.2 Government Notice No 704, National Water Act, 1998 (Act 36 of 1998)4.3 Dam Safety Regulations (Government Notice R.1560 of 25 July 1986)4.4 Mining and Petroleum Resources Management Act, 2002 (Act 28 of 2002)4.5 Department of Water Affairs Best Practice Guidelines
5 KEY ISSUES & SCENARIOS 145.1 Changes in Catchment Characteristics5.2 Removal or Alteration of Natural Water Courses5.3 Changes in Peak Runoff & Discharge Volumes5.4 Changes in Mean Annual Runoff5.5 Increased Sediment Yield5.6 Increased Pollutant Load

(v)
6 IMPACT ASSESSMENT 196.1 Impact of the Removal and Alteration of Natural Water Courses on
Catchment Response6.2 Impact of Reduced Peak Runoff and Discharge Volumes on Water Courses6.3 Impact of Reduction in Mean Annual Runoff on Downstream Surface Water Resources6.4 Impact of Increased Sediment Yield on Surface Water Quality6.5 Impact of Increased Pollutant Load on Surface Water Quality
7 OPERATIONAL MANAGEMENT PLAN 277.1 Design Phase7.2 Operational Phase7.3 Decommissioning Phase
8 REFERENCES 30
APPENDICES
LIST OF FIGURESFigure 1 Baseline Sub catchment LayoutFigure 2 Pre mitigation Sub catchment LayoutFigure 3 Proposed (post mitigation) Sub catchment LayoutFigure 4 Water profile for Major Watercourse: Northern Sub CatchmentFigure 5 Water profile for Major Watercourse: Northern Sub CatchmentFigure 6 Mining Sector Resource Protection and Waste Management Strategy
LIST OF TABLESTable 1 Catchment Naming ConventionTable 2 Baseline Catchment CharacteristicsTable 3 Monthly Precipitation and Evaporation DataTable 4 Design RainfallTable 5 Rainfall Depths for Durations Shorter than 24 hoursTable 6 Probable Post Development Catchment CharacteristicsTable 7 Baseline Peak Runoff Flows and VolumesTable 8 Calculated Post Development Peak Runoff Flows and VolumesTable 9 Baseline MARTable 10 Anticipated Post Development Reduction in MARTable 11 Proposed Mining InfrastructureTable 12 Impact of the Removal and Alteration of Natural Water Courses on Catchment
HydrologyTable 13 Comparison between Recurrence Interval (RI) & Probability of Exceedance (PE)Table 14 Impact of Reduced Peak Runoff and Discharge Volumes on Water CoursesTable 15 Impact of Reduction in Mean Annual Runoff on Downstream Surface Water
ResourcesTable 16 Impact of Increased Sediment Yield on Surface Water QualityTable 17 Impact of Increased Pollutant Load on Surface Water Quality

(vi)
LIST OF GRAPHSGraph 1 Comparison between Baseline and Post Development 50 year RI Peak FlowsGraph 2 Comparison between Baseline and Post Development 100 year RI Peak FlowsGraph 3 Comparison between Baseline and Post Development Contribution to MARGraph 4 Calculated Peak Flows for the Northern Sub CatchmentGraph 5 Calculated Peak Flows for the Southern Sub CatchmentGraph 6 Calculated Runoff Volumes for the Northern Sub CatchmentGraph 7 Calculated Runoff Volumes for the Southern Sub Catchment
(1)
1.0 INTRODUCTION________________________________________________________________________
The purpose of this report is to describe the impact on catchment hydrology likely to becaused by the proposed open pit Gamsberg zinc mine near Aggeneys in the NorthernCape. This will form part of the current ESIA.
A previous EIA was completed and approved in 2000, but has since expired. An interimbaseline hydrology and surface water quality report was prepared by SRK Consulting inJanuary 2010. This report formed part of the Pre feasibility Study (PFS) and describedthe delineation of water courses and catchment boundaries and the determination ofpeak rainfall intensities and flood volumes.
HHO Africa were appointed by ERM in November 2012 to provide an hydrological impactassessment, which would form part of the ESIA. The impacts of the anticipated changesto the surface water regime were to be quantified and possible mitigation measuresproposed and assessed. This report supersedes the February 2013 draft hydrologicalimpact assessment report.
(2)
2.0 APPROACH & METHODOLOGY________________________________________________________________________
HHO Africa adopted the following approach to the project:
Review Previous StudiesPrevious reports, which were made available, were reviewed and relevant informationutilised.
Site VisitA site visit was conducted in December 2012 in order to make in situ observations andassessments. Local conditions were determined and a broad understanding gained of thecatchment.
Assess Hydrological ImpactThe hydrological impact of the proposed open cast mine was assessed and quantified forall phases of the project, from inception to decommissioning. The following aspects wereaddressed:
The proposed project footprint was assessed and its impact on hydrology determined.Flood peaks and runoff volumes were calculated for the 50 and 100 year recurrenceinterval storm events.The project impact on Mean Annual Runoff (MAR) was determined.Surface water quality issues were identified and qualified.Flood lines were determined for the 100 year recurrence interval storm event.
Hydrological Impact ReportCompile a hydrological impact report containing inter alia:
Identification and mapping of sensitive areas, affected receptors and areas ofinfluenceDirect, indirect, irreversible and cumulative impact of anticipated activities on surfacewater resourcesCompliance with legal and policy framework, including IFC Performance Standards forEnvironmental and Social Sustainability (2012)Recommendation of mitigating and monitoring measuresEvaluation and assessment of residual (post mitigation) impacts
Operational Management PlanDevelop guidelines towards an operational management plan for activities in and aroundsurface water features.

(3)
3.0 HYDROLOGICAL DETERMINANTS________________________________________________________________________
3.1 Catchment Characteristics
3.1.1 AreaSituated in the Orange River basin, the mine is located at the watershed between twoquaternary catchments, being D81G and D82C. The latter is an endoreic catchment,which means that it is an interior drainage basin that does not drain to the sea. TheGamsberg inselberg is situated within quaternary catchment D81G, which drains in anortherly direction towards the Orange River some 35km away. A third quaternarycatchment, D82A was identified in the 2010 baseline report, but being remote from anyanticipated mine infrastructure, was not considered in this report.
The baseline surface water assessment identified 11 sub catchments totaling roughly750 km2. Of these, only two are of particular interest to this study, being affected byproposed mine infrastructure. These are sub catchments 4 and 9a. Table 1 compares thebaseline catchment nomenclature with that adopted for this report. As the otherbaseline sub catchments are unaffected by proposed mining infrastructure, they werenot assessed for this impact assessment.
For the baseline assessment, no ineffective areas were identified. Runoff was thereforedeemed to be generated by the entire sub catchment, and calculated accordingly. Thefull development scenario, however, introduced ineffective areas that had a significantimpact on peak flows and volumes. Figure 1 illustrates the baseline sub catchmentlayout.
Baseline Hydrology Impact AssessmentSub Catchment
NoArea (km2) Quaternary
CatchmentSub Catchment
NameArea (km2)
1 108.2 D82C2 65.9 D82C3 52.8 D82C4 31.1 D82C North 38.75 0.97 D81G6 53.7 D81G7 272.7 D81G8 21.6 D81G9a 13.4 D81G South 13.19b 1.03 D81G10 125.7 D82A
Total 747.1 53.5Table 1: Catchment Naming Convention

(4)
Being situated at the watershed between two quaternary catchments, surface waterrunoff emanating from the mine leasing area affects downstream catchments. Inparticular, the likely reduction in Mean Annual Runoff (MAR) is an importantconsideration in determining the mine’s impact on local surface water resources.
3.1.2 Topography, Soils & VegetationIn terms of topography, the two sub catchments are relatively disparate. The northerncatchment, which significantly larger than the southern inselberg catchment, is generallyflat with an average slope of 1.5%. By comparison, the average catchment slope of theinselberg catchment is approximately 12%. This catchment discharges through a narrowkloof with steep, high rocky sides.
Both catchments are characterized by loose rocks, coarse sands and gravels and aresparsely planted. The Water Research Commission (WRC) Surface Water Resources ofSouth Africa 1990, developed by DC Midgley, WV Pitman and BJ Middleton, describe thelocal soils as being moderately deep and sandy. The hydrological soil group could beclassified as Group A, implying low runoff potential and high infiltration rates due to thevery permeable nature of the soil. The Erodibility Index, which describes expectedsediment yield, is 10 designating medium erodibility.
Vegetal cover could be classified as Category D, which in hydrological terms denotesbare surface with negligible vegetation. This implies that very little surface water wouldbe retained by plants, resulting in a higher runoff coefficient.
3.1.3 Catchment SlopeThe slope of a catchment is a very important characteristic in the determination of floodpeaks. Steep slopes cause water to run faster and to shorten the critical duration offlood inducing storms, thus leading to the use of higher rainfall intensities in the runoffformulae. On steep slopes the vegetation is generally less dense, soil layers areshallower, and there are fewer depressions, all of which cause water to run off morerapidly. The result is that infiltration is reduced and flood peaks are consequently evenhigher. The average catchment slope (SA) for the two catchments under considerationare presented in Table 2 below.
Main watercourse slopes (SL) were determined using the 10/85 method developed bythe US Geological Survey. This method has been found to yield accurate results forrelatively small catchments such as these. Table 2 reveals these values.
SubCatchment
Ae (km2) L (km) LC (km) SL (m/m) SA (m/m) TC (h) TL (h)
North 38.7 11.0 6.5 0.0075 0.0155 4.6 2.1South 13.1 6.4 3.1 0.0198 0.1172 1.8 1.1
Table 2: Baseline Catchment Characteristics
(5)
3.1.4 Collector LengthThe longest watercourse (L) is defined as the route that will be followed by a waterparticle taking the longest time to reach the catchment outlet from a point on thecatchment boundary. This distance consists of both the natural channel and overlandflow and, along with the slope of the watercourse, determines the time of concentrationfor the catchment. The lengths of the two main surface water collectors are given inTable 2 above.
The centre of gravity of each sub catchment area was calculated. This information wasused to determine the centre of gravity catchment length (LC), which is the distance fromthe catchment outlet to the point on the longest collector opposite the centre of gravityof the catchment area. This was used to calculate the catchment lag time (TL) for bothsub catchments as presented in Table 2.
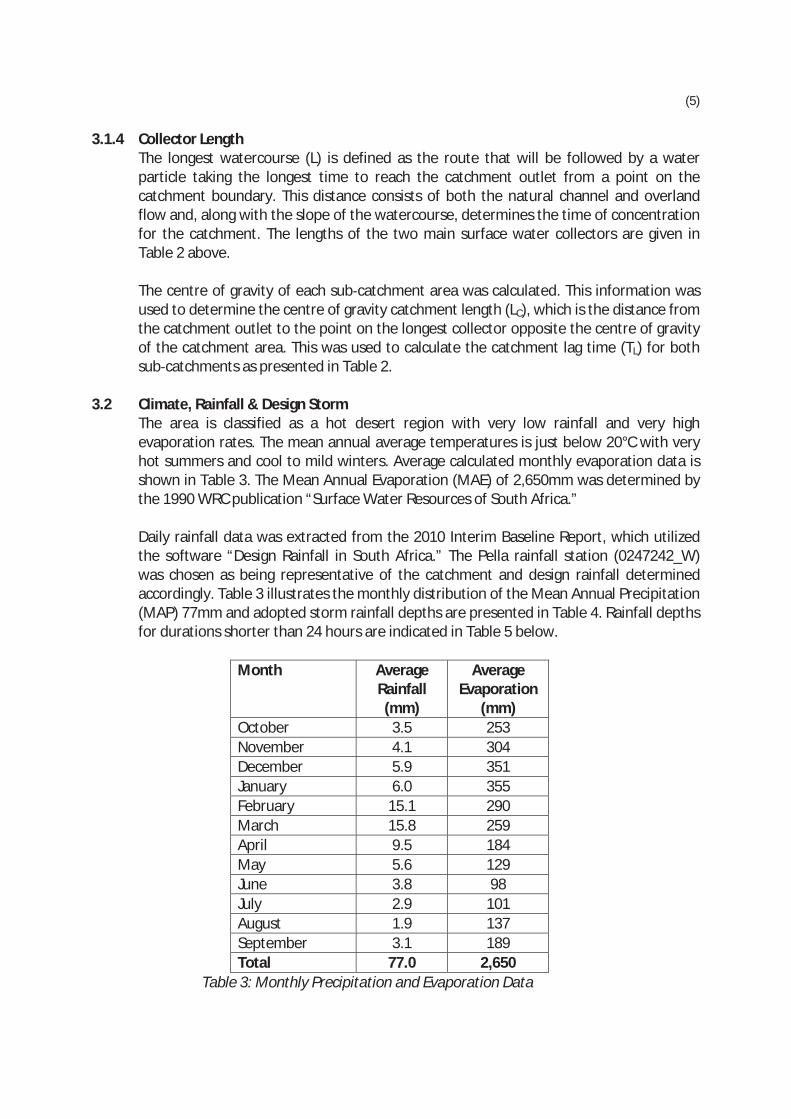
3.2 Climate, Rainfall & Design StormThe area is classified as a hot desert region with very low rainfall and very highevaporation rates. The mean annual average temperatures is just below 20°C with veryhot summers and cool to mild winters. Average calculated monthly evaporation data isshown in Table 3. The Mean Annual Evaporation (MAE) of 2,650mm was determined bythe 1990 WRC publication “Surface Water Resources of South Africa.”
Daily rainfall data was extracted from the 2010 Interim Baseline Report, which utilizedthe software “Design Rainfall in South Africa.” The Pella rainfall station (0247242_W)was chosen as being representative of the catchment and design rainfall determinedaccordingly. Table 3 illustrates the monthly distribution of the Mean Annual Precipitation(MAP) 77mm and adopted storm rainfall depths are presented in Table 4. Rainfall depthsfor durations shorter than 24 hours are indicated in Table 5 below.
Month AverageRainfall(mm)
AverageEvaporation
(mm)October 3.5 253November 4.1 304December 5.9 351January 6.0 355February 15.1 290March 15.8 259April 9.5 184May 5.6 129June 3.8 98July 2.9 101August 1.9 137September 3.1 189Total 77.0 2,650
Table 3: Monthly Precipitation and Evaporation Data

(6)
Duration Return Period (years)(days) 2 5 10 20 50 100 200
1 20.5 34.8 46.3 59.1 78.9 96.5 116.72 23.2 39.8 53.4 68.8 92.9 114.6 139.93 24.2 41.9 56.7 74.0 101.4 126.6 156.64 24.6 42.4 57.3 74.5 102.0 127.2 157.05 24.9 42.9 57.9 75.0 102.2 126.9 156.16 25.6 44.0 59.2 76.4 103.6 128.1 156.97 26.3 45.0 60.3 77.6 104.6 128.9 157.2
Table 4: Design Rainfall (mm)(Source: 2010 Interim Baseline Report)
DurationReturn Period (years)
2 5 10 20 50 100 2005 minutes 4.8 8.1 10.8 13.8 18.4 22.5 27.310 minutes 6.9 11.7 15.6 20.0 26.6 32.6 39.415 minutes 8.6 14.6 19.4 24.8 33.1 40.4 48.930 minutes 10.4 17.6 23.4 30.0 40.0 48.9 59.245 minutes 11.6 19.7 26.2 33.5 44.7 54.6 66.1
1 hour 12.6 21.3 28.4 36.2 48.4 59.1 71.51.5 hour 14.1 23.8 31.7 40.5 54.1 66.1 80.02 hour 15.2 25.8 34.3 43.8 58.5 71.5 86.54 hour 17.2 29.1 38.7 49.4 66.0 80.7 97.66 hour 18.4 31.2 41.5 53.0 70.8 86.6 104.78 hour 19.4 32.8 43.6 55.8 74.4 91.0 110.110 hour 20.1 34.1 45.4 58.0 77.4 94.6 114.512 hour 20.8 35.2 46.8 59.8 79.9 97.7 118.216 hour 21.8 37.0 49.2 62.9 84.0 102.7 124.220 hour 22.7 38.5 51.2 65.4 87.3 106.7 129.124 hour 23.4 39.7 52.8 67.5 90.1 110.2 133.3
Table 5: Rainfall Depths for Durations Shorter than 24 hours (mm)(Source: 2010 Interim Baseline Report)
The commonly used “return period,” or Recurrence Interval (RI), requires furtherexplanation. In hydrological terms, the more accurate term is Probability of Exceedance(PE). The PE denotes the statistical probability of a certain flood magnitude beingexceeded. By contrast, the RI suggests a flood that recurs with certain regularity. Table14 below shows the correlation between these terms. As can be seen, the 1 year RI floodhas a PE of 100%, which means that there is a 100% probability in any given year that aflood with that magnitude will occur. Similarly, there is only a 1% probability that the100 year RI flood will be exceeded in any given year. This distinction is important whenassessing the impact of storm flows. By way of extreme example, a 100% PE storm eventwould be less threatening than a 1% PE storm event. These storm events are vastlydifferent and have vastly disparate outcomes. In the case of the 100% PE storm, theflood peak and volume is beneficial to the ecosystem, while typically the 1% PE storm is

(7)
potentially threatening to downstream infrastructure and communities. Clearly, in termsof impact, a reduction in small PE storms would be seen as a positive impact, whilst areduction in large PE storms would have negative consequences. It should, however, bestated that downstream of the proposed development there are no communities orsignificant infrastructure.
3.3 Time of ConcentrationThe time that a water particle requires to travel from the furthest point in the catchmentto the outlet is known as the time of concentration. In the case of extreme events it isassumed that the storm duration is similar to the time of concentration. The time ofconcentration can consist of natural stream flow and overland flow components.
Table 2 illustrates the baseline catchment characteristics that affect the time ofconcentration. It is anticipated that the proposed mining infrastructure will affect thenature of the sub catchments and alter the rainfall runoff response. Anticipatedchanges are presented in Table 6 below. It should be noted that the effective catchmentareas are significantly reduced due to the assumed capture, retention and reuse ofrainfall within the designated “dirty” areas. These include the open pit, the waste rockstockpiles, the processing plant, tailings dam, pollution control and return water dams.A further change in the southern sub catchment involves the curtailing of the baselinewatercourse due to the location of the proposed open pit, which would traverse itsupper reaches. Figure 2 illustrates the pre mitigation sub catchment layout.
SubCatchment
Ae (km2) L (km) LC (km) SL (m/m) SA (m/m) TC (h) TL (h)
North 35.4 11.0 6.5 0.0075 0.0155 4.6 2.1
South 9.0 5.3 2.8 0.0236 0.1172 1.7 1.0
Table 6: Probable Post Development Catchment Characteristics
3.4 Peak Runoff Flow & VolumeCalculated storm peak flows were determined using the Rational, SDF and SUHdeterministic methods and results compared to the empirical RMF method. Peak runoffvolumes were calculated assuming a simple triangular hydrograph. Table 7 illustrates thecalculated baseline peak runoff flows and volumes for the two sub catchments for the50 and 100 year recurrence interval storm events.
Sub Catchment Q50 (m3/s) Q100 (m3/s) V50 (X106m3) V100 (X106m3)
North 50.5 61.7 1.25 1.53South 33.1 48.8 0.32 0.47
Table 7: Baseline Peak Runoff Flows and Volumes
Table 8 demonstrates the likely effect of the proposed development on peak flows andrunoff volumes for the proposed post mitigation (Figure 3) layout. The slightly lowerpost mitigation flows are largely attributable to the reduction in effective catchmentarea due to the construction of the tailings dam, the return water dam, pollution controldams, processing plant, the open pit itself and the waste rock stockpiles. In terms of the

(8)
DWA Best Practice Guidelines (BPG), it was assumed that runoff from the designated“dirty” areas would be captured and reused, or attenuated, treated and released.
Peak flow results for both the baseline and post development scenarios are graphicallydepicted for the 50 year and 100 year Recurrence Interval (RI) storm events in Graphs 1and 2 respectively.
Sub Catchment Q50 (m3/s) Q100 (m3/s) V50 (X106m3) V100 (X106m3)
North 46.2 56.5 1.15 1.40South 23.5 34.6 0.22 0.32
Table 8: Calculated Post Development Peak Runoff Flows and Volumes
Graph 1: Comparison between Baseline and Post Development 50 year RI Peak Flows
Graph 2: Comparison between Baseline and Post Development 100 year RI Peak Flows
0.0
10.0
20.0
30.0
40.0
50.0
60.0
Baseline Post Development
Flow
Peak
,Q(m
3 /s)
Scenario
50 Year RI Peak Flow
Northern Catchment
Southern Catchment
0.0
10.0
20.0
30.0
40.0
50.0
60.0
70.0
Baseline Post Development
Flow
Peak
,Q(m
3 /s)
Scenario
100 Year RI Peak Flow
Northern Catchment
Southern Catchment

(9)
3.5 Mean Annual RunoffGiven the desert climate, characterized by low Mean Annual Precipitation (MAP), highevaporation and high infiltration rates, the watercourses are ephemeral in nature andcompletely dry for much of the year. Consequently, the quaternary catchments withinwhich the study area is situated are known to have very low Mean Annual Runoff (MAR)values. These have been published in the 1990 WRC publication “Surface WaterResources of South Africa” and MAR values for the two sub catchments underconsideration were calculated by the weighted area method. Table 9 illustrates thebaseline MAR in the context of the quaternary catchments, whilst Table 10 presents theanticipated reduction in MAR as a consequence of the development. However, it shouldbe noted that there are no known downstream users of surface water given theunreliable nature of this resource.
SubCatchment
QuaternaryCatchment
QuaternaryCatchmentArea (km2)
QuaternaryCatchment
MAR (X103 m3)
Baseline SubCatchment
MAR (X103 m3)
SubCatchment
Contributionto MAR (%)
North D82C 3,996 800 7.74 1.0%South D81G 2,007 900 5.87 0.7%
Table 9: Baseline MAR
SubCatchment
Post DevelopmentSub CatchmentMAR (X103 m3)
Reduction inSub Catchment
MAR (%)
Sub CatchmentContribution to
MAR (%)North 7.09 8% 0.8%South 4.05 31% 0.4%
Table 10: Anticipated Post Development Reduction in MAR
Graph 3: Comparison between Baseline and Post Development Contribution to MAR
0.0%
0.2%
0.4%
0.6%
0.8%
1.0%
1.2%
North South
Cont
ribu
tion
toM
AR
(%)
Sub Catchment
Sub Catchment Contribution to MAR
Baseline
Post Development

(10)
3.6 Regional Maximum FloodOne of the likely effects of global climate change is an increase in large storm events.Whilst almost impossible to predict the magnitude of extreme rainfall events, theDirectorate of Water Affairs published a study in 1980 entitled “Maximum Flood PeakDischarges in South Africa: An Empirical Approach.” This study by Z Kovacs analysed theapproximately 300 highest flood peaks recorded in South Africa between 1894 and 1979.This information was processed using the Francou Rodier relationship to determine localRegional Maximum Flood (RMF) curves. The RMF for the northern sub catchment wascalculated to be roughly 133 m3/s, while the southern catchment RMF would beapproximately 99 m3/s. The impact of the RMF was not considered in this report as it isdealt with in the climate change impact study.
3.7 Site Specific Water ResourcesA significant fresh water spring is situated on the east side of the inselberg. However,this spring is located outside the study area and consequently has no bearing on thissurface water hydrology impact assessment. No evidence of other springs or fountainscould be found during the site visit.
3.8 Surface Water QualityA water quality baseline assessment was undertaken by SRK Consulting in 2010. Theirfindings are replicated below. Recommendations for monitoring during the constructionand operational phases of the development are made in Section 7 of this report.
The baseline water quality study found that water emanating as springs from theGamsberg Inselberg is fit for domestic use and livestock watering, according to the SouthAfrican National Standard (SANS) for drinking water quality (SANS 241:2006) and theDepartment of Water Affairs Guidelines for Livestock Watering (DWAF, 1996).
The study recommended that springs emerging from the Inselberg should be adequatelyprotected and canalized to prevent contamination.
3.9 Flood Line Determination3.9.1 Assumptions
HydrologyHydrological calculations were undertaken for both the northern and southern subcatchments as described. The 1% probability of exceedance, or 100 year RecurrenceInterval (RI) flood peaks and volumes were calculated using a number of differentdeterministic methods, being the SDF, Rational Method, SUH, SDF and RMF. Flood peakswere calculated for a number of return periods for both the baseline (ie predevelopment) and post development scenarios.
The baseline 100 year RI flood peak is of particular significance in that this flood isdetermines the flood plain, which in terms of the Water Act may not be impinged uponby any mining development. Flood lines were accordingly determined for this flood. Thevalues of Q100 used for the flood line assessment were 61.7 m3/s and 48.8 m3/srespectively for the northern and southern sub catchments.

(11)
An assumption employed in modeling this flood was that the flood peak accumulatesalong the length of the watercourse(s), such that the full flood value is reached at thedownstream discharge point, whilst the flood value at the upstream extremity is zero. Alinear progression was assumed.
Topographic SurveyA topographic LIDAR survey with a contour interval of 1m was provided by the client.Although the surveyed data did not extend across the entire northern sub catchment, itdid sufficiently cover the southern area where most of the mining activities will becentred. Consequently, flood lines could not be accurately determined for the upstreamreaches of the northern sub catchment watercourses.
It should be noted that 1m contour interval is deemed coarse in the case of the northernsub catchment, which is flat. Furthermore, the ephemeral watercourses traversing thenorthern sub catchment are poorly defined. These factors imply a wide flood plain likelyto meander.
Catchment characteristics, such as collector gradient and catchment slope weredetermined from the LIDAR survey for the southern (inselberg) sub catchment. In thecase of the northern sub catchment, these values were determined from 1:50,000topographic maps obtained from the Surveyor General’s office. Whilst wholly adequatefor hydrology, the contour interval of 20m is not sufficient for the determination of floodlines.
3.9.2 MethodologyThe LIDAR survey described above was converted into a Digital Terrain Model (DTM)using Civil Designer 6.5 software. River transects were extracted from the DTM andimported into HEC RAS 4.1.0. A number of river reaches were specified for the northernsub catchment, given its tributaries.
Manning’s n value was assumed to be 0.035 for the main channel and overbanks. Steadystate flow was assumed and upstream and downstream boundary conditions stipulatedas normal flow depth. Not surprisingly, the flow in the northern watercourses was foundto be sub critical. The main inselberg water course through the kloof was naturally fasterflowing and flow was predominantly super critical. The model calculated severalhydraulic jumps, which would be expected given the steepness and irregularity of thekloof. Figure 4 illustrates the water profile for the main southern sub catchmentwatercourse, whist Figure 5 shows the water profile for the major watercourse drainingthe northern sub catchment.
3.9.3 Conclusions & RecommendationsGiven the inherent limitations of the LIDAR survey, the flood lines are deemed toreasonably accurate. It is unfortunate that the existing survey does not cover the area ofthe critical tailings facility. Before the final placement of the tailings dam, it would beprudent to extend the survey to include this area and to determine revised flood lines.

(12)
All Mine Residue Deposits (MRD), Pollution Control Dams (PCD) and mininginfrastructure and should be placed outside the designated 100 year RI flood plain, andmore than 100m away from any watercourse as stipulated by the Department of WaterAffairs.
Figure 4: Water profile for Southern Sub Catchment
Figure 5: Water profile for Major Watercourse: Northern Sub Catchment
0 1000 2000 3000 4000 5000 6000 7000900
920
940
960
980
1000
1020
1040
1060
1080
Gamsberg South Plan: 7116 04/03/2013
Main Channel Distance (m)
Elev
atio
n (m
)
Legend
EG PF 1
Crit PF 1
WS PF 1
Ground
South Major 1
0 1000 2000 3000 4000 5000865
870
875
880
885
890
895
900
Gamsberg Plan: 7116 02/03/2013
Main Channel Distance (m)
Elev
atio
n (m
)
Legend
EG PF 1
WS PF 1
Crit PF 1
Ground
North Major 1

(13)
4.0 APPLICABLE POLICIES, LEGISLATION, STANDARDS & GUIDELINES________________________________________________________________________
Water management at mines is controlled by the National Water Act (NWA), 1998 (Act36 of 1998), which is the primary statute providing the legal basis for water managementin South Africa and has to ensure ecological integrity, economic growth and social equitywhen managing and using water. Use of water for mining and related activities is alsoregulated through regulations that were updated after the promulgation of the NWA(Government Notice No. GN704 dated 4 June 1999).
4.1 National Water Act, 1998 (Act 36 of 1998)The following chapters of the NWA are of particular importance:
Chapter 3, Part 4 states that anyone who owns, occupies, controls or uses land isdeemed responsible for taking measures to prevent pollution of water resources.Chapter 4 deals with water use regulation.Chapter 12 deals with water management in terms of dam safety.Section 19 deals with water management at mines in terms of pollution preventionand control.Section 21 states the water uses requiring authorization. The following particular usesare typically relevant for mining projects:
o 21 (a): Abstraction (water supply)o 21 (b): Storage (raw and potable water reservoirs)o 21 (c): Impeding or diverting the flow of water in a watercourseo 21 (f): Discharging waste or water containing waste into a water resource
through a pipe, canal, sewer or other conduito 21 (g): Disposing of waste in a manner which may detrimentally impact on a
water resourceo 21 (i): Altering the bed, banks, course or characteristics of a watercourse.
Section 26 (1) provides for the development of regulations requiring monitoring,measurement and recording as well as the effects to be achieved throughmanagement practices prior to discharge or disposal.
The NWA introduced the concept of Integrated Water Resource Management (IWRM),comprising all aspects of the water resource, including water quality, water quantity andthe aquatic ecosystem quality. The IWRM approach provides for both resource directedand source directed measures. Resource directed measures aim to protect and managethe receiving environment, whilst source directed measures aim to control the impactsat source.
This report focuses on the following source directed measures:Identification of pollution sources and suggestions to implement pollution preventionmeasuresWater reuseWater treatment
(14)
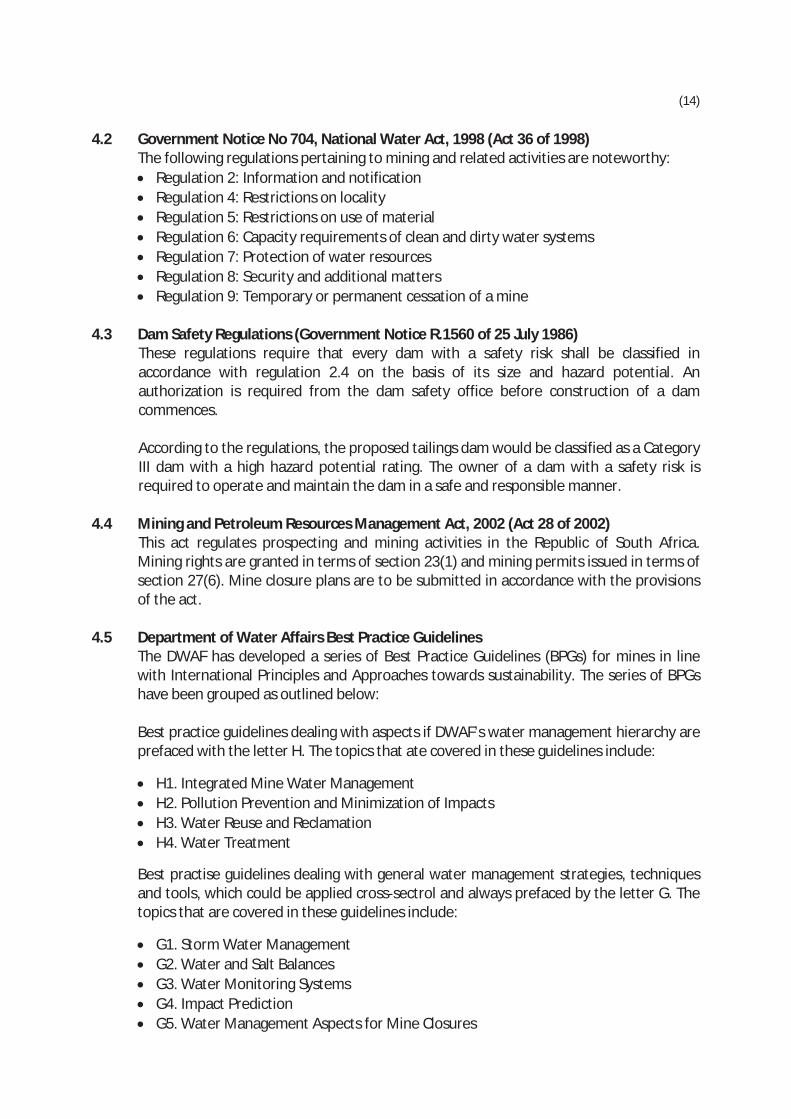
4.2 Government Notice No 704, National Water Act, 1998 (Act 36 of 1998)The following regulations pertaining to mining and related activities are noteworthy:
Regulation 2: Information and notificationRegulation 4: Restrictions on localityRegulation 5: Restrictions on use of materialRegulation 6: Capacity requirements of clean and dirty water systemsRegulation 7: Protection of water resourcesRegulation 8: Security and additional mattersRegulation 9: Temporary or permanent cessation of a mine
4.3 Dam Safety Regulations (Government Notice R.1560 of 25 July 1986)These regulations require that every dam with a safety risk shall be classified inaccordance with regulation 2.4 on the basis of its size and hazard potential. Anauthorization is required from the dam safety office before construction of a damcommences.
According to the regulations, the proposed tailings dam would be classified as a CategoryIII dam with a high hazard potential rating. The owner of a dam with a safety risk isrequired to operate and maintain the dam in a safe and responsible manner.
4.4 Mining and Petroleum Resources Management Act, 2002 (Act 28 of 2002)This act regulates prospecting and mining activities in the Republic of South Africa.Mining rights are granted in terms of section 23(1) and mining permits issued in terms ofsection 27(6). Mine closure plans are to be submitted in accordance with the provisionsof the act.
4.5 Department of Water Affairs Best Practice GuidelinesThe DWAF has developed a series of Best Practice Guidelines (BPGs) for mines in linewith International Principles and Approaches towards sustainability. The series of BPGshave been grouped as outlined below:
Best practice guidelines dealing with aspects if DWAF’s water management hierarchy areprefaced with the letter H. The topics that ate covered in these guidelines include:
H1. Integrated Mine Water ManagementH2. Pollution Prevention and Minimization of ImpactsH3. Water Reuse and ReclamationH4. Water Treatment
Best practise guidelines dealing with general water management strategies, techniquesand tools, which could be applied cross sectrol and always prefaced by the letter G. Thetopics that are covered in these guidelines include:
G1. Storm Water ManagementG2. Water and Salt BalancesG3. Water Monitoring SystemsG4. Impact PredictionG5. Water Management Aspects for Mine Closures
(15)
Best practise guidelines dealing with specific mining activities or aspects and alwaysprefaced by the letter A. These guidelines address the prevention and management ofimpacts from:
A1. Small Scale MiningA2. Water Management for Mine Residue DepositsA3. Water Management in Hydrometallurgical PlantsA4. Pollution Control DamsA5. Water Management for Opencast MinesA6. Water Management for Underground Mines
The development of the guidelines is an inclusive consultative process that incorporatesthe input from a wide range if experts, including specialists within and outside themining industry and government. The process of identifying which BPGs to prepare, whoshould participate in the preparation and consultative processes, and the approval of theBPGs was managed by a Project Steering Committee (PSC) with representation by keyrole players.
The BPGs will perform the following functions within the hierarchy of decision making:
Utilization by the mining sector as input for compiling water use authorizationapplications (and other legally required documents such as EMPs, EIAs, closure plans,etc.) and for drafting authorization conditions.Serve as a uniform basis for negotiations through the licensing process prescribed bythe NWA.Used specifically by DWAF personnel as a basis for negotiation with the miningindustry, and likewise by the mining industry as a guideline as to what the DWAFconsiders as best practice in resource protection and waste management.Inform Interest and Affected Parties on good practice at mines.
Figure 6 represents a schematic diagram of the mining sector resource protection andwaste management strategy.

(16)
Figure 6: Mining Sector Resource Protection and Waste Management Strategy

(17)
5.0 KEY ISSUES & SCENARIOS________________________________________________________________________
From a hydrological perspective, the following key issues have been identified. Theseissues are discussed below, while their impact and possible mitigating measures arediscussed in the following chapter.
5.1 Changes in Catchment CharacteristicsThe catchment characteristics of both sub catchments would be altered by the proposeddevelopment. Table 11 provides a list of proposed mining infrastructure affecting surfacewater hydrology. Infrastructure has been classified as “dirty” or “clean” in terms of theDWA Best Practice Guidelines (BPG). Every effort must be made to keep “clean” areasclean and to collect and contain runoff from “dirty” areas.
Surface water runoff from clean areas should be discharged directly to naturalwatercourses and not contained or contaminated. Clean storm water should only becontained if the volume of the runoff poses a risk, if the water cannot be discharged towatercourses by gravitation, for attenuation purposes, or when the clean area is smalland located within a large dirty area. Given the proposed layout and natural topography,there is no need for attenuation of clean storm water for this project.
Surface water runoff from dirty areas should be collected and contained in order toensure that the following objectives are met:
Minimisation of contaminated areas and reuse of dirty water (wherever possible)Prevention of overflows and minimisation of seepage losses from storage facilities(such as polluted dams)Prevention of further deterioration of water qualitySeparation of dirty water in terms of degree of contamination (very dirty watershould be kept separate from moderately dirty water)
DescriptionArea (ha) Ineffective
Area (ha)Dirty orCleanNorth South Total
Tailings Dam 280 280 280 DIRTY
Processing Plant 45 45 DIRTY
Open Pit 50 280 330 330 DIRTY
Contractors' Camp 32 CLEAN
Haul Roads ±35 ±20 55 MOD
Workshop 2 2 DIRTY
Explosives Magazine 2 2 CLEAN
Waste Rock Dump 490 490 DIRTY
Table 11: Proposed Mining Infrastructure

(18)
Certain infrastructure, such as the open pit, processing plant, workshops, tailings andreturn water dam would cause an increase in hydrologically ineffective areas. Beingdirty, surface water emanating from these areas would be captured and treated as closeto source as possible. Consequently, the calculated flood peak values and MAR woulddecrease as shown in Tables 8 and 10 respectively.
5.2 Removal or Alteration of Natural Water CoursesFigure 1 illustrates the baseline sub catchment layout, showing the sub catchmentboundaries, natural contours, watercourses and ecologically sensitive areas. Figure 2demonstrates the proposed pre mitigation layout, which shows the anticipated impacton certain natural water courses. The impact of this change on surface water hydrologyfollows in Section 6.1 of this report.
The proposed open pit would require the curtailment of the longest watercourse in thesouthern catchment. Ordinarily this would indicate a decrease in the time ofconcentration. However, the circular shape of this catchment, its mountainous characterand the number of ephemeral watercourses have resulted in only a marginal change intime of concentration and other catchment characteristics. A comparison between Table2 (baseline) and Table 6 (post development) reveals remarkably similar characteristics.
Ephemeral watercourses in the northern catchment would not require removal oralteration.
5.3 Changes in Peak Runoff & Discharge VolumesThe calculation of baseline and anticipated post mitigation peak runoff flows andvolumes are presented in Section 3.4 of this report. This section assesses the key issuesassociated with these changes, whilst the impact on surface water hydrology follows inSection 6.2 of this report.
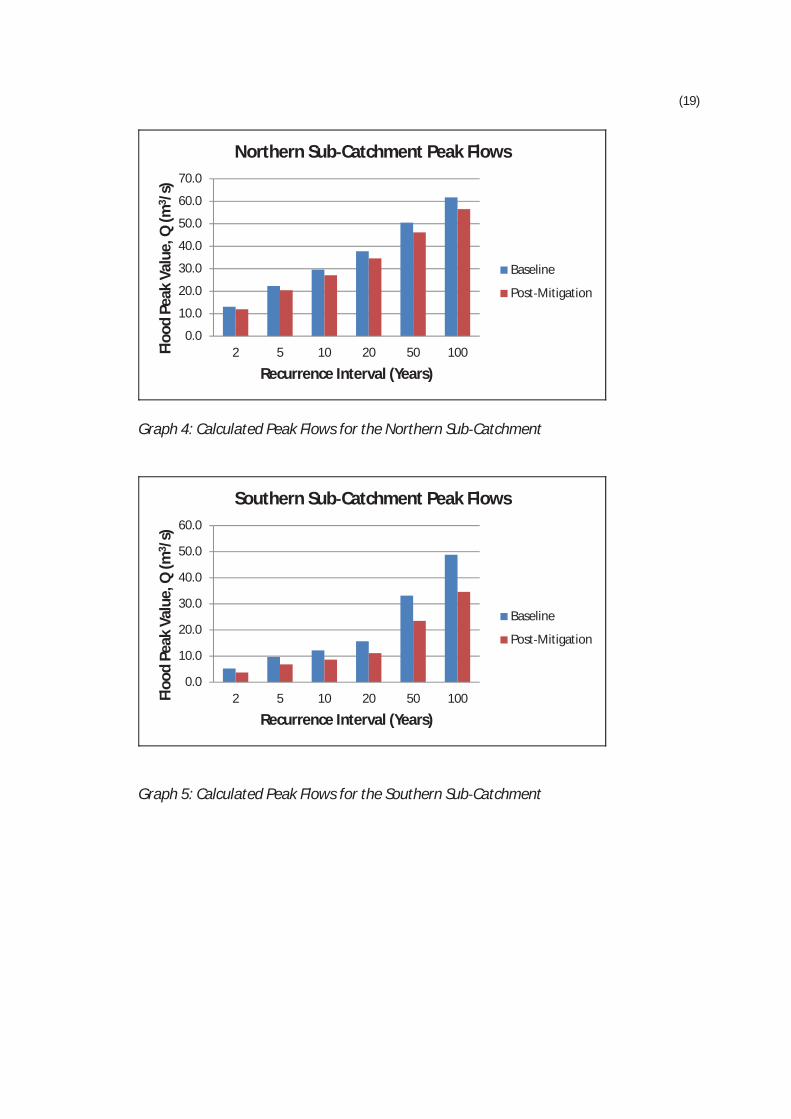
Graphs 4, 5, 6 and 7 below graphically illustrate the net effect of changes in the subcatchments on peak storm flows and runoff volumes. It is clear that the northern subcatchment is not as severely impacted than the southern sub catchment, and acomparison between the baseline and post mitigation values reveal an average netdecrease of roughly 8.5% in both peak flow and volume. The expected decrease in peakflow and volume is approximately 18% for the southern sub catchment.
(19)
Graph 4: Calculated Peak Flows for the Northern Sub Catchment
Graph 5: Calculated Peak Flows for the Southern Sub Catchment
0.0
10.0
20.0
30.0
40.0
50.0
60.0
70.0
2 5 10 20 50 100Floo
dPe
akVa
lue,
Q(m
3 /s)
Recurrence Interval (Years)
Northern Sub Catchment Peak Flows
Baseline
Post Mitigation
0.0
10.0
20.0
30.0
40.0
50.0
60.0
2 5 10 20 50 100Floo
dPe
akVa
lue,
Q(m
3 /s)
Recurrence Interval (Years)
Southern Sub Catchment Peak Flows
Baseline
Post Mitigation

(20)
Graph 6: Calculated Runoff Volumes for the Northern Sub Catchment
Graph 7: Calculated Runoff Volumes for the Southern Sub Catchment
5.4 Changes in Mean Annual RunoffIt is clear from the MAR values in Tables 9 and 10 that the proposed miningdevelopment would significantly affect the southern (Inselberg) sub catchment. Inparticular, the ecologically sensitive kloof would be impacted by the anticipatedreduction in MAR as illustrated in Graph 3. The impact of this change on surface waterhydrology follows in Section 6.3 of this report.
Post development MAR would be 4,050 m3 per annum if surface runoff from the northwestern ridge is allowed to enter the pit. This quantity of surface water would exit viathe kloof. This implies that an estimated 1,820 m3 of surface water would enter the pitannually. The reduction in MAR for the quaternary catchment would be in the order of
0.000.200.400.600.801.001.201.401.601.80
2 5 10 20 50 100Runo
ffVo
lum
e,V
(X10
m6 )
Recurrence Interval (Years)
Northern Sub Catchment Runoff Volume
Baseline
Post Mitigation
0.00
0.10
0.20
0.30
0.40
0.50
2 5 10 20 50 100
Runo
ffV
olum
e,V
(X10
m6)
Recurrence Interval (Years)
Southern Sub Catchment Runoff Volume
Baseline
Post Mitigation

(21)
0.2%, which would be negligible. However, the reduction in MAR for the Inselberg subcatchment itself would be about 31%.
Should surface runoff from the north western ridge be diverted away from the pittowards the kloof, the post development MAR leaving the Inselberg catchment via thekloof would be approximately 4,520 m3 per annum. This would represent a 23%reduction in sub catchment MAR, but only a 0.2% reduction in quaternary catchmentMAR. Surface water entering the pit annually would amount to roughly 1,350 m3.
Technically it would be very difficult to divert surface water runoff from the northwestern ridge towards the kloof without causing extensive ecological damage to thatpart of the sub catchment. This risk of damage would negate any benefits thisintervention may hope to achieve. Accordingly, it would be preferable for this small areato be allowed to enter the pit. The above findings verify that there certainly would be nonoticeable impact on the larger quaternary catchment. Similarly, the local impact on thekloof would be only marginally worse (31% reduction in MAR as opposed to 23%).
5.5 Increased Sediment YieldNotwithstanding the arid, sparsely planted terrain, the proposed mine infrastructurewould require removal of vegetation and the stripping of topsoil. This would increase theerosion potential of the sub catchments and subsequently result in increased sedimentdeposition in water courses. Furthermore, the construction of haul roads, and generalmining activities such as blasting, loading and hauling would increase the quantity ofairborne dust. This dust would settle on the ground surface where it would present anadditional source of sediment during rain events. The impact of this change on surfacewater hydrology follows in Section 6.4 of this report.
5.6 Increase in Pollutant LoadThe proposed construction of a Waste Water Treatment Works (WWTW) wouldinevitably increase the risk of surface water resources being contaminated by untreatedsewage. This contamination could be caused by insufficient maintenance of the WWTW,or as a consequence of blocked sewer mains or manholes. Furthermore, raw seweragespillages could occur in the event of power outages affecting foul sewer pump stationsor the WWTW.
By their very nature, metallurgical processes are dirty and a potential major source ofpollutants. Whilst the proposed mining infrastructure has been classified as either“clean” or “dirty,” it is imperative that surface water runoff from the dirty areas wecaptured and adequately treated. Wherever possible, treated water should be reused inthe mining process.
Hydrocarbons, such as oils and petroleum fuels, represent a potential threat to surfacewater quality. As such, the potential impact of accidental spillages should be assessedand mitigated. The impact of the expected increase in pollutant load on surface waterresources follows in Section 6.5 of this report.

(22)
6.0 IMPACT ASSESSMENT________________________________________________________________________
This section provides a description of the potential impacts the proposed Project mayhave on surface water hydrology. The key receptors or resources considered are the subcatchments and watercourses affected by the proposed development.
6.1 Impact of the Removal and Alteration of Natural Water Courses on CatchmentResponse
The key issues related to this impact were described in Section 5.2. The findings of theimpact assessment are presented below and tabulated in Table 12.
Impact AssessmentAs the proposed open pit covers a significant portion of the southern catchment it isinevitable that certain existing water courses that collect and convey surface waterrunoff from the western section of this catchment would be removed or altered. Certainof the minor water courses would be permanently removed by the proposed miningoperation, while the longest collector, which governs catchment response, would becurtailed. However, it has been demonstrated that the post mitigation hydrologicalresponse of the southern catchment is similar to that of the baseline scenario. Theanticipated decrease in time of concentration is negligible.
The significance is therefore considered to be MODERATE during the construction andoperational phases of the project. The degree of confidence in this assessment is HIGH.
Mitigation MeasuresWhere mining infrastructure, such as haul roads, are required across naturalwatercourses, new storm water infrastructure, such as pipes and culverts couldreplace the hydraulic function currently offered by the natural water courses. Thisinfrastructure should be designed for both hydraulic performance and environmentalfunctionality. A thorough assessment of the suitability of the new stormwaterinfrastructure must be made at preliminary design stage.The water quality of rivers and the proposed canals should be monitored on amonthly basis as described in the operational management plan.
Residual ImpactWith the implementation of the above mitigation, impact intensity and magnitude willbe reduced in the southern catchment during the construction phase. The impactsignificance would accordingly reduce to MINOR. The degree of confidence in thisassessment is HIGH.

(23)
Without MitigationResidual Impact(with Mitigation)
Construction PhaseDuration Permanent PermanentExtent On site On siteIntensity Medium MediumMagnitude Medium LowLikelihood Definite DefiniteSignificance Moderate Minor
Operational PhaseDuration Permanent PermanentExtent On site On siteIntensity Medium MediumMagnitude Medium LowLikelihood Definite DefiniteSignificance Moderate Minor
Decommissioning PhaseDuration Permanent PermanentExtent On site On siteIntensity Medium MediumMagnitude Medium LowLikelihood Definite DefiniteSignificance Moderate Minor
Table 12: Impact of the Removal and Alteration of Natural Water Courses on CatchmentResponse
6.2 Impact of Reduced Peak Runoff and Discharge Volumes on Water CoursesThe key issues related to this impact were described in Section 5.3. The findings of theimpact assessment are presented below and tabulated in Table 13.
Impact AssessmentThe proposed mining development at Gamsberg would require the excavation of a largeopen pit and the construction of a tailings dam, pollution control dams, process plantand ancillary infrastructure. Being classified as “dirty,” rain falling on this infrastructurewould be captured and contained. Consequently, the quantum of surface water runoffwould reduce. Post development storm peak flows and volumes have been calculatedand compared to baseline values, as can be seen in Graphs 4 to 7 (inclusive).

(24)
RecurrenceInterval, RI
(Years)
Probability ofExceedance,
PE (%)
100 1%50 2%20 5%10 10%5 20%2 50%1 100%
Table 13: Comparison between Recurrence Interval (RI) & Probability of Exceedance (PE)
A brief description of the relevance and applicability of the range of design rainfallevents in Table 13 was is provided in Section 3.2 of this report. As mentioned, the smallPE events typically cause flood damage, whilst the large PE storms do not. For thepurpose of this impact assessment, these contradictory outcomes will be consideredseparately. This section shall consider the reduction in small PE floods, whilst thesubsequent section will consider the impact of the reduction in Mean Annual Runoff.
In summary, the calculated reduction in small PE (ie large RI) floods is viewed as aPOSITIVE impact as the risk of damage to downstream communities, property,operations or infrastructure would be reduced. However, the concomitant reduction inMAR, is considered a NEGATIVE impact and is presented in Section 6.3 below.
The positive significance is therefore considered to be MODERATE during theconstruction phase of the project. The degree of confidence in this assessment isMEDIUM.
Mitigation MeasuresAs the impact is deemed POSITIVE, no mitigating measures are proposed.
Residual ImpactIt is unlikely that the ineffective areas giving rise to the reduction in flood peaks wouldbe removed in the closure phase. Consequently, the residual impact is MODERATE. Thedegree of confidence in this assessment is MEDIUM.
(25)
Without MitigationResidual Impact(with Mitigation)
Construction PhaseDuration Permanent N/AExtent Local N/AIntensity Medium N/AMagnitude Medium N/ALikelihood Likely N/ASignificance Moderate, Positive N/A
Operational PhaseDuration Permanent N/AExtent Local N/AIntensity Medium N/AMagnitude Medium N/ALikelihood Likely N/ASignificance Moderate, Positive N/A
Decommissioning PhaseDuration Permanent N/AExtent Local N/AIntensity Medium N/AMagnitude Medium N/ALikelihood Likely N/ASignificance Moderate, Positive N/A
Table 14: Impact of Reduced Peak Runoff and Discharge Volumes on Water Courses
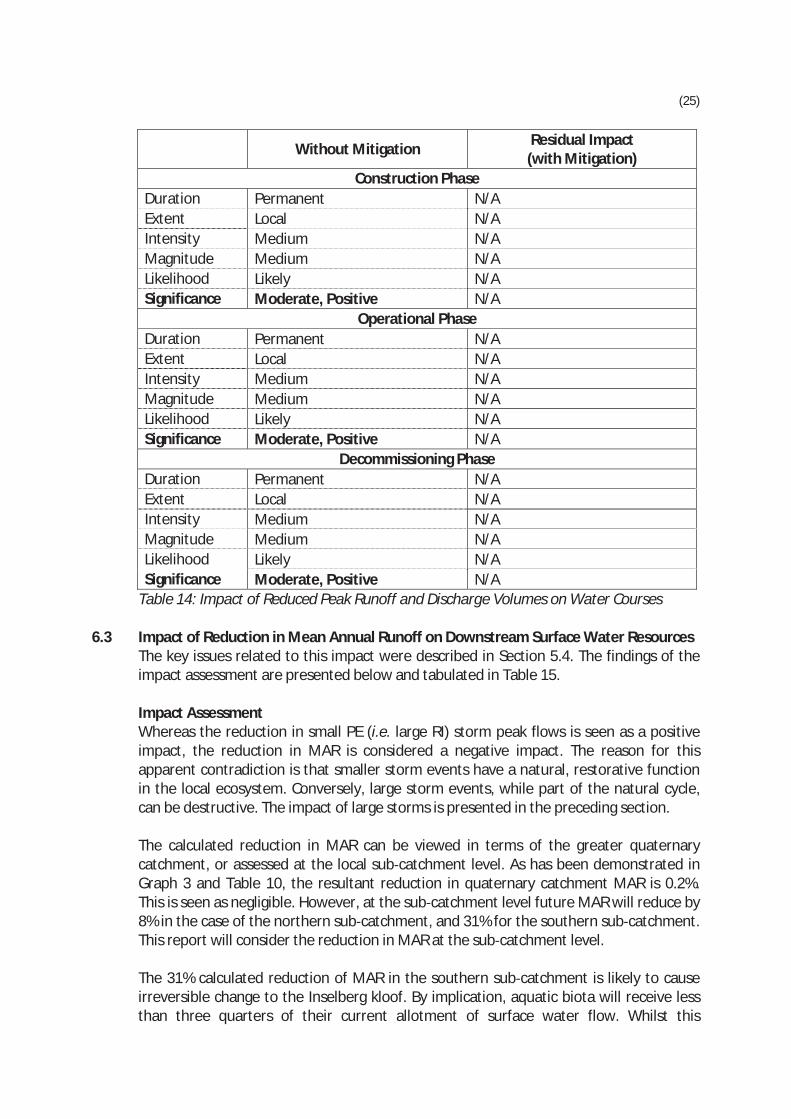
6.3 Impact of Reduction in Mean Annual Runoff on Downstream Surface Water ResourcesThe key issues related to this impact were described in Section 5.4. The findings of theimpact assessment are presented below and tabulated in Table 15.
Impact AssessmentWhereas the reduction in small PE (i.e. large RI) storm peak flows is seen as a positiveimpact, the reduction in MAR is considered a negative impact. The reason for thisapparent contradiction is that smaller storm events have a natural, restorative functionin the local ecosystem. Conversely, large storm events, while part of the natural cycle,can be destructive. The impact of large storms is presented in the preceding section.
The calculated reduction in MAR can be viewed in terms of the greater quaternarycatchment, or assessed at the local sub catchment level. As has been demonstrated inGraph 3 and Table 10, the resultant reduction in quaternary catchment MAR is 0.2%.This is seen as negligible. However, at the sub catchment level future MAR will reduce by8% in the case of the northern sub catchment, and 31% for the southern sub catchment.This report will consider the reduction in MAR at the sub catchment level.
The 31% calculated reduction of MAR in the southern sub catchment is likely to causeirreversible change to the Inselberg kloof. By implication, aquatic biota will receive lessthan three quarters of their current allotment of surface water flow. Whilst this

(26)
reduction could be seen as acceptable in the short term, the long term effect may besignificant. The anticipated reduction in MAR from the northern catchment is relativelyinsignificant.
The combined significance of this impact is therefore considered to be MODERATEduring the construction, operation and decommissioning phases of the project. Thedegree of confidence in this assessment is HIGH.
Mitigation MeasuresAs it is extremely unlikely that the open pit could be relocated or reduced in extent,other possible solutions must be found. One such suggestion could be to supply pipedfresh water of similar quantity and quality to the kloof watercourse. This water wouldreplace the lost MAR and provide artificial replenishment.
Residual ImpactShould the above mitigation measure be accepted, the ecological risk attributable todecreased MAR could be greatly reduced through judicious design and implementation.Accordingly, the impact significance on local downstream water resources could beclassified as MINOR during the all phases of the project. The degree of confidence in thisassessment is HIGH.
Without MitigationResidual Impact(with Mitigation)
Construction PhaseDuration Permanent TemporaryExtent Local On siteIntensity Low LowMagnitude Medium LowLikelihood Likely LikelySignificance Moderate Minor
Operational PhaseDuration Permanent TemporaryExtent Local On siteIntensity Low LowMagnitude Medium LowLikelihood Likely LikelySignificance Moderate Minor
Decommissioning PhaseDuration Permanent TemporaryExtent Local On siteIntensity Low LowMagnitude Medium LowLikelihood Likely LikelySignificance Moderate Minor
Table 15: Impact of Reduction in Mean Annual Runoff on Downstream Surface WaterResources
(27)
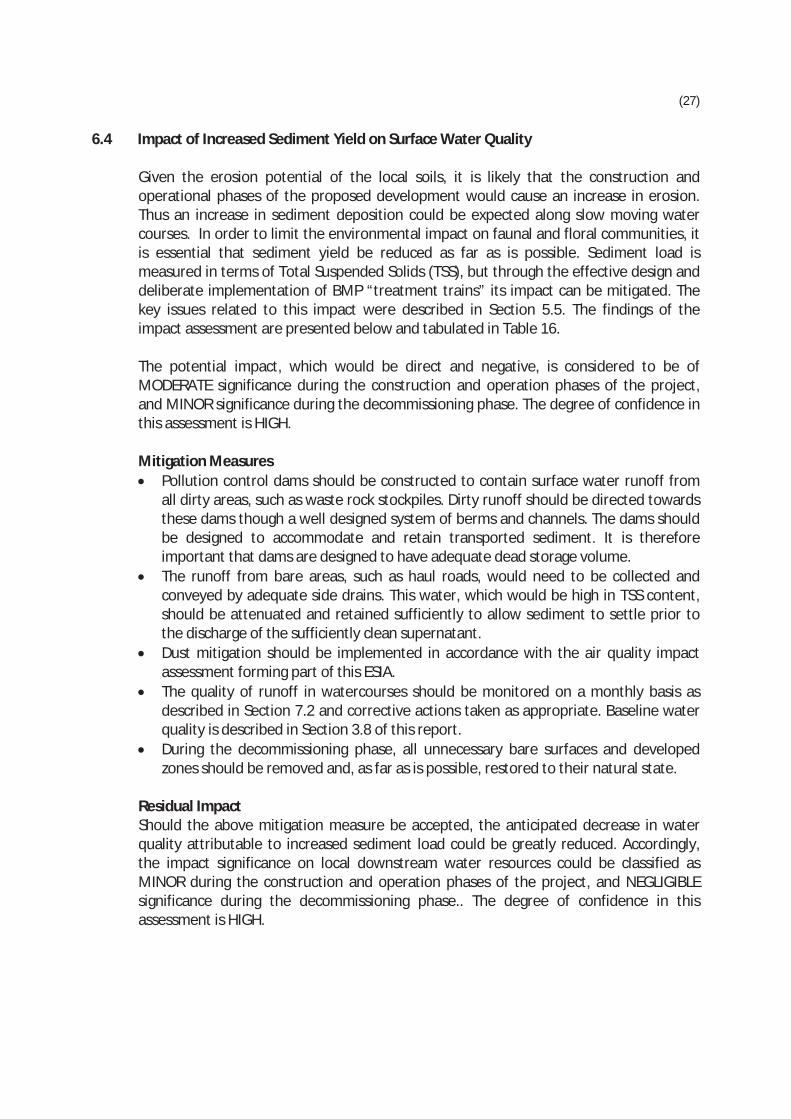
6.4 Impact of Increased Sediment Yield on Surface Water Quality
Given the erosion potential of the local soils, it is likely that the construction andoperational phases of the proposed development would cause an increase in erosion.Thus an increase in sediment deposition could be expected along slow moving watercourses. In order to limit the environmental impact on faunal and floral communities, itis essential that sediment yield be reduced as far as is possible. Sediment load ismeasured in terms of Total Suspended Solids (TSS), but through the effective design anddeliberate implementation of BMP “treatment trains” its impact can be mitigated. Thekey issues related to this impact were described in Section 5.5. The findings of theimpact assessment are presented below and tabulated in Table 16.
The potential impact, which would be direct and negative, is considered to be ofMODERATE significance during the construction and operation phases of the project,and MINOR significance during the decommissioning phase. The degree of confidence inthis assessment is HIGH.
Mitigation MeasuresPollution control dams should be constructed to contain surface water runoff fromall dirty areas, such as waste rock stockpiles. Dirty runoff should be directed towardsthese dams though a well designed system of berms and channels. The dams shouldbe designed to accommodate and retain transported sediment. It is thereforeimportant that dams are designed to have adequate dead storage volume.The runoff from bare areas, such as haul roads, would need to be collected andconveyed by adequate side drains. This water, which would be high in TSS content,should be attenuated and retained sufficiently to allow sediment to settle prior tothe discharge of the sufficiently clean supernatant.Dust mitigation should be implemented in accordance with the air quality impactassessment forming part of this ESIA.The quality of runoff in watercourses should be monitored on a monthly basis asdescribed in Section 7.2 and corrective actions taken as appropriate. Baseline waterquality is described in Section 3.8 of this report.During the decommissioning phase, all unnecessary bare surfaces and developedzones should be removed and, as far as is possible, restored to their natural state.
Residual ImpactShould the above mitigation measure be accepted, the anticipated decrease in waterquality attributable to increased sediment load could be greatly reduced. Accordingly,the impact significance on local downstream water resources could be classified asMINOR during the construction and operation phases of the project, and NEGLIGIBLEsignificance during the decommissioning phase.. The degree of confidence in thisassessment is HIGH.

(28)
Without MitigationResidual Impact(with Mitigation)
Construction PhaseDuration Short term Short termExtent Local LocalIntensity Medium LowMagnitude Medium LowLikelihood Likely LikelySignificance Moderate Minor
Operational PhaseDuration Long Term Long TermExtent Local LocalIntensity Low NegligibleMagnitude Medium LowLikelihood Likely LikelySignificance Moderate Minor
Decommissioning PhaseDuration Short term Short termExtent Local LocalIntensity Negligible NegligibleMagnitude Low NegligibleLikelihood Likely LikelySignificance Minor Negligible
Table 16: Impact of Increased Sediment Yield on Surface Water Quality
6.5 Impact of Increased Pollutant Load on Surface Water QualityThe key issues related to this impact were described in Section 5.6. The findings of theimpact assessment are presented below and tabulated in Table 17.
Mitigation MeasuresA thorough, regular inspection and maintenance regime should be implemented bythe operator of the proposed Waste Water Treatment Works (WWTW).Pump stations should be inspected, serviced and cleaned on a monthly basis, andmanholes and underground pipes inspected and cleaned every six months.The WWTW and all sewer pump stations should be equipped with emergencygenerators, or adequate emergency storage. Typically, four hours’ storage shouldsuffice.An emergency response unit should be established to undertake urgentmaintenance and repair work after hours.It is imperative that surface water runoff from the dirty areas (eg process plant,waste rock stockpiles, tailings dam) be captured and wherever possible, reused inthe mining process. Pollution control dams should be deployed as indicated onFigure 3. Dirty runoff should be directed towards these dams though a well designedsystem of berms and channels.Dirty water not used in the mining process should be adequately treated prior torelease. Treatment should be undertaken to as described in Section 7.2.
(29)
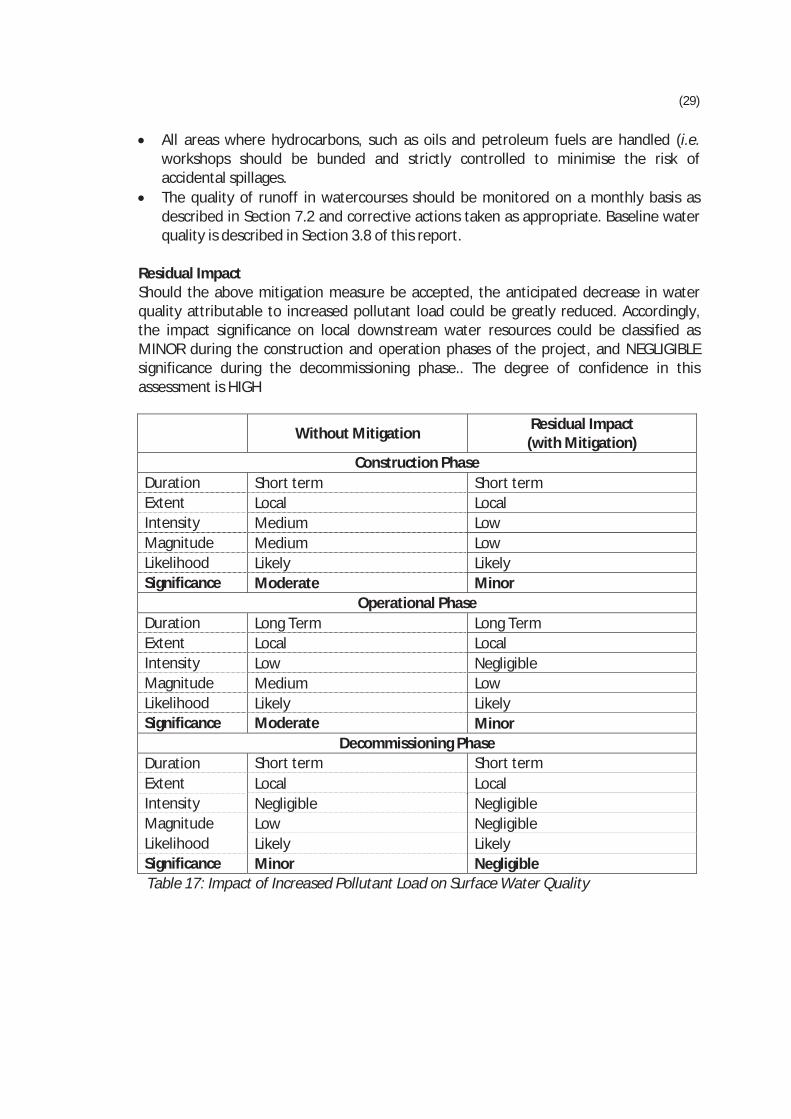
All areas where hydrocarbons, such as oils and petroleum fuels are handled (i.e.workshops should be bunded and strictly controlled to minimise the risk ofaccidental spillages.The quality of runoff in watercourses should be monitored on a monthly basis asdescribed in Section 7.2 and corrective actions taken as appropriate. Baseline waterquality is described in Section 3.8 of this report.
Residual ImpactShould the above mitigation measure be accepted, the anticipated decrease in waterquality attributable to increased pollutant load could be greatly reduced. Accordingly,the impact significance on local downstream water resources could be classified asMINOR during the construction and operation phases of the project, and NEGLIGIBLEsignificance during the decommissioning phase.. The degree of confidence in thisassessment is HIGH
Without MitigationResidual Impact(with Mitigation)
Construction PhaseDuration Short term Short termExtent Local LocalIntensity Medium LowMagnitude Medium LowLikelihood Likely LikelySignificance Moderate Minor
Operational PhaseDuration Long Term Long TermExtent Local LocalIntensity Low NegligibleMagnitude Medium LowLikelihood Likely LikelySignificance Moderate Minor
Decommissioning PhaseDuration Short term Short termExtent Local LocalIntensity Negligible NegligibleMagnitude Low NegligibleLikelihood Likely LikelySignificance Minor NegligibleTable 17: Impact of Increased Pollutant Load on Surface Water Quality

(30)
7.0 OPERATIONAL MANAGEMENT PLANThe legal requirements governing surface water are presented in Section 4 of thisreport. In order to assist Applicants achieve compliance, the DWA have compiled BestPractice Guidelines (BPG). The following sections reflect a few specific excerpts fromthe BPG, but are by no means a comprehensive summary. The Applicant is referred tothe full do
Storm water management and drainage planning are critical components of integratedwater and waste management (IWWM) at mining sites. While storm watermanagement is an integral part of the IWWM and is documented as part of theIntegrated Water and Waste Management Plan (IWWMP), for the purpose of thisdocument, the component of the IWWMP that refers to storm water management isreferred to separately as the storm water management plan (SWMP). A SWMP mustaddress the impact of:
Mining operations on the water flow and water quality processes of the hydrologicalcycle, and the associated upstream and downstream environmental impacts.The hydrological cycle on mining operations, including effects such as loss ofproduction, costs, and impacts of both floods and droughts on the miningoperations.
The objectives of a SWMP are site specific but some general objectives include:Protection of life (prevent loss of life) and property (reduce damage toinfrastructure) from flood hazards;Planning for drought periods in a mining operation;Prevention of land and watercourse erosion (especially during storm events);Protection of water resources from pollution;Ensuring continuous operation and production through different hydrological cycles;Maintaining the downstream water quantity and quality requirements;Minimizing the impact of mining operations on downstream users;Preservation of the natural environment (water courses and their ecosystems).
The SWMP must cover the life cycle of the mine from exploration, throughconstruction, operation, decommissioning, and up to post closure.
Potential adverse effects of inadequate storm water management include:Downstream contamination of natural watercourses due to runoff or spillage ofcontaminated storm water.Flooding, with the resultant damage to property, land and potentially loss of lifeLoss of catchment yield and addition of large volumes of water to the mine waterbalance when optimal runoff of clean storm water is not achieved.Erosion of beds and banks of waterways.Increased recharge through spoils or fracture zones, unnecessarily increasing thewater volume that comes into contact with contaminants.

(31)
7.1 Design PhaseA comprehensive Storm Water Management System (SWMS) should be created atthe design stage of the project.An Operation Manual is required for each Pollution Control Dams (PCD). Thepurpose of the manual is to provide guidelines to the owner for the safe operationand maintenance of the dam during its lifespan. Emergency and monitoringprocedures are suggested in the BPG.All Mine Residue Deposits (MRD), such as tailings (Fine Residue Deposits, FRD) andwaste rock dumps, and PCD should be situated outside the 100 year flood lines andmore than 100m away from any watercourse.Open cast mines should be situated outside the 50 year flood line, and a horizontaldistance of 100m from the centre line of the watercourse.All surface water runoff emanating outside MRD should be diverted away fromMRD. Diversion channels should be designed for the maximum precipitationexpected in 24 hours with a RI of 100 years. Freeboard of at least 0.5m should beprovided.Rain falling within MRD areas should be retained in those areas. Retention facilitiesshould be designed for the maximum precipitation expected in 24 hours with a RI of50 years. Freeboard of at least 0.8m is required above this maximum predictedwater level.A well designed system of sub surface drains is required for tailings dams. Theseensure that the stability of the structure is not compromised and that groundwateris not contaminated. Proper engineering drawings showing details, calculated flowvalues and water levels are required.Tailings and other PCD should be designed in accordance with the Dam SafetyRegulations.A comprehensive water balance model should be created. Surface water should beused in the mining process as far as is possible.PCD should be designed such that retained storm water is removed as soon aspracticable in order to swiftly restore design storage volumes.Evaporation dams should be avoided as far as possible as water cannot be reused.PCD and diversion berms should be designed to overtop not more than once in 50years (i.e. for storms with a PE of 2%).PCD should be designed in accordance with ICOLD and SANCOLD guidelines.Spillways should be designed to pass the RDF with the required freeboard. PCDshould withstand the SEF without failing.All open channels should be designed such that supercritical velocities are avoided,i.e. flow velocities should remain sub critical.
7.2 Operational PhaseInspection procedures must be clearly stipulated in the Storm Water ManagementPlan (SWMP) and records must be kept accordingly.FRD penstocks and outlets should be inspected on a monthly basis and cleared ofblockages or residue deposits.
(32)
Seepage through sub surface drains at MRD should be monitored monthly. TheOperations Manual should describe procedures in the event that flows or levels falloutside expected values. These could include the installation of piezometers todetermine the phreatic surface, inclinometers to monitor slope movements, orslope buttresses.Water quality and flows should be monitored in accordance with the SWMP. It isrecommended that such monitoring occurs at least once per month. Valuesobtained should be incorporated in the water and salt balance for the mine andcould serve as early warning indicators if potential malfunctions or mismanagement.Regular water management training should be provided by the mine.Samples should be taken at watercourses during the wet season and analysed forwater quality. Given the arid climate, samples should be taken when practicable (i.e.when watercourses flow). Pools in the Inselberg kloof should be sampled and testedon a monthly basis for the indicators listed in the Pre feasibility report.
7.3 Decommissioning PhaseA mine closure plan should be prepared in accordance with the provisions of theMPRDA and its Regulations. This closure plan will be incorporated into the closureEMP.All MRD should be left, at closure, in such a state where these facilities are able towithstand the effects resulting from the maximum probable precipitation withminimal detrimental consequences.All decommissioned MRD should have regular inspections as defined in the closureplan. These inspections should be carried out by a suitably qualified person andfindings presented in Aftercare Reports.The closure plan should describe the intended fate of PCD, which may bedemolished, retained for beneficial use, or capped.Penstocks and outfall pipes should be in a state at closure where these structures donot constitute a potential failure to risk and hence unacceptable impact to personsor the environment. All penstocks and outfall pipes should be in such a condition (orbe modified) so that these do not constitute a route whereby residue oruncontrolled water may discharge from the MRD.Filter drain outlets and solution trenches should be in a state where these structuresare able to function effectively on a long term basis and without deterioration.Solution trenches should be designed to discharge any seepage into suitableevaporation dams or sumps.

(33)
8.0 REFERENCES________________________________________________________________________
8.1 SRK Consulting, January 2010. Interim Baseline Report Hydrology and Surface WaterQuality
8.2 Anglo American Technical Services, April 2000. Surface Water Impact AssessmentRevision 1
8.3 Midgley DC, Pitman WV and Middleton BJ, Surface Water Resources of South Africa1990 Volume III, 1994, WRC Report No 298/3.1/94, First Edition
8.4 Department of Water Affairs and Forestry, 2006. Best Practice Guideline A2: WaterManagement for Surface Mines
8.5 Department of Water Affairs and Forestry, 2006. Best Practice Guideline A3: WaterManagement in Hydrometallurgical Plants
8.6 Department of Water Affairs and Forestry, 2006. Best Practice Guideline A4: PollutionControl Dams
8.7 Department of Water Affairs and Forestry, 2006. Best Practice Guideline A5: WaterManagement for Surface Mines
8.8 Department of Water Affairs and Forestry, 2006. Best Practice Guideline A5: WaterManagement for Surface Mines
8.9 Department of Water Affairs and Forestry, 2006. Best Practice Guideline G1: StormWater Management.
8.10 Department of Water Affairs and Forestry, 2006. Best Practice Guideline G3: WaterMonitoring Systems
8.11 Department of Water Affairs and Forestry, 2006. Best Practice Guideline G5: WaterManagement Aspects for Mine Closure
8.12 International Finance Corporation, Environmental, Health and Safety Guidelines forMining, December 2007
8.13 Debo, Thomas N., Reese, Andrew J., 2003. Municipal Stormwater Management, SecondEdition
8.14 The South African National Roads Agency Limited, 2007. Drainage Manual, 5th Edition

APPENDICES