supreme flour world wheat presentation (january 2014)
TRANSCRIPT

WORLD WHEATSource: US Wheat Associates monthly supply and demand report, found on
their website: http://www.uswheat.org/

The World Wheat Market
Year
Production
Consumption
Surplus (shortfall)
11/12 12/13 13/14
697 656 713
697 679 703
1 -23 10
0 2

World Production and Use
0 3
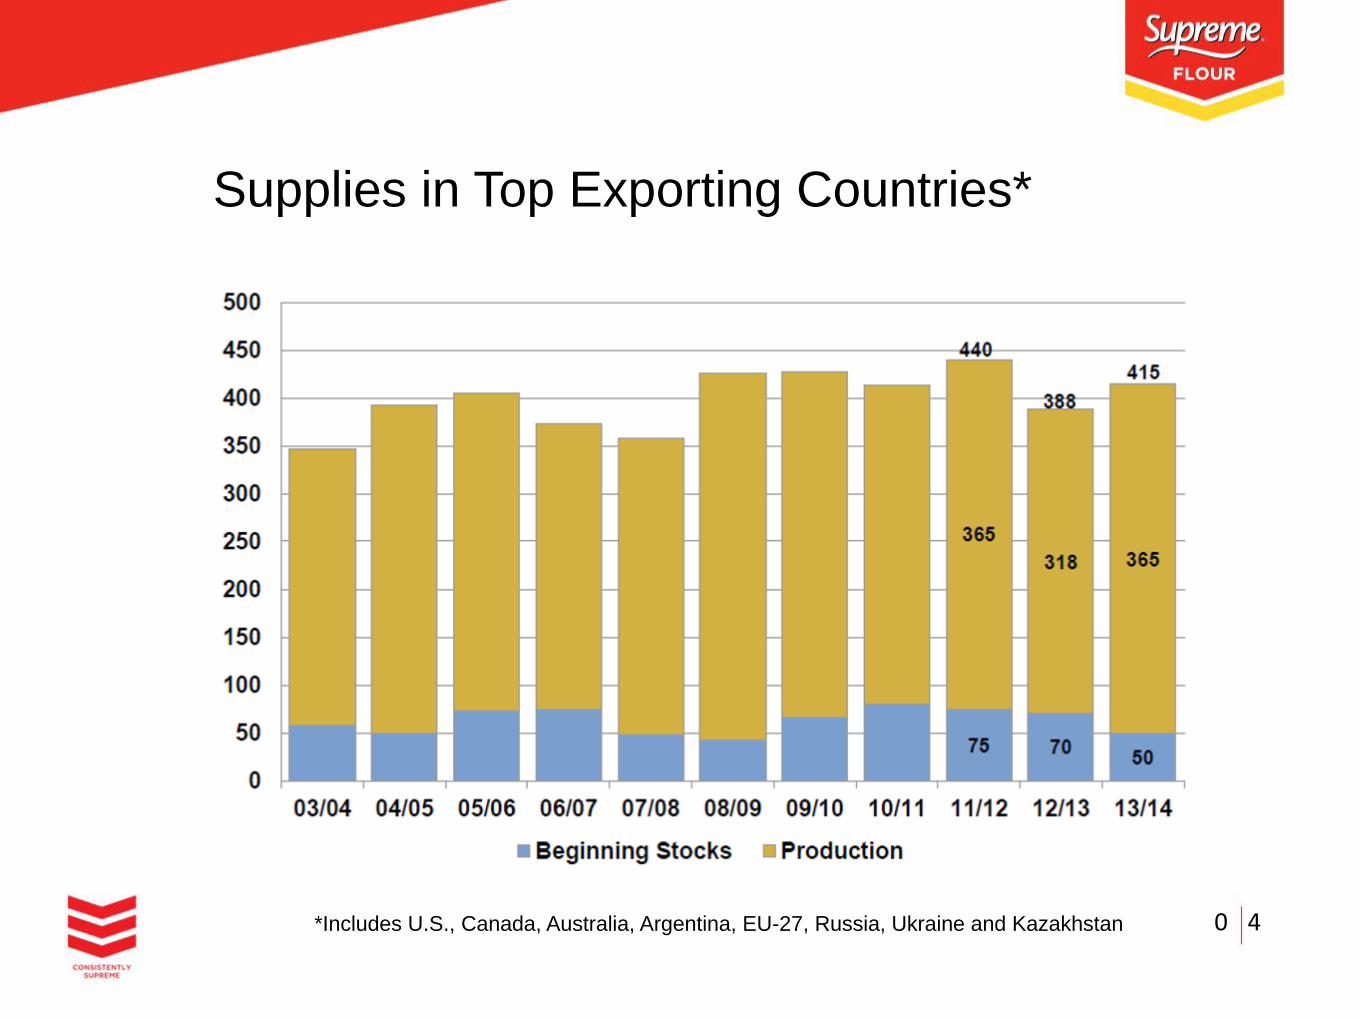
Supplies in Top Exporting Countries*
0 4*Includes U.S., Canada, Australia, Argentina, EU-27, Russia, Ukraine and Kazakhstan

World wheat supply & demand
Date 11/12 12/13 13/14
Supply
Trade
Demand
Ending
stocks
199 199 176
697 656 713
896 855 889
158 138 159
550 543 567
147 136 136
697 679 703
199 176 185
Exports/imports
Beginning stock
Production
Supply total
Food & seed
Feed & residual
Use tool
0 5

Global Stocks* -to-Use Ratio
0 6*Ending stocks

Global Ending Stocks and Price
0 7

Canada Situation
0 8

International Wheat Factors
Record 2013/14 world wheat crop – increase of 8.7% from last season, +57 million
tons.
Approximately 19.3% of all wheat globally goes into the feed market and resultantly the
Chicago corn / wheat spread has narrowed from US$2.30 / buschel to the current
US$1.49 / buschel.
India playing a larger role in export market – Indian production to reach 92.5 MMT, up
10% from 5-year average and second largest on record.
Black Sea exports to reach 35.3 MMT and represent 22% of world market, compared to
19% in 2012/13
0 9

Black Sea Exports
0 10

U.S. Situation
0 11

Australia Situation
0 12

Date
Opening stock
Production
Imports
489
Consumption
Exports
Closing stock
1751
1650*
3086
265
539
13/14*
Supply & demand of wheat in South Africa (‘000 tons)
0 13
Local Wheat Drivers
Limited small crop – 1,751 million tons (need to import 49% of requirement) = import
parity driven
With record world crop produced, fairly good export competition keeping a lid on prices
(quality milling wheat less abundant).
Single largest driver of local prices is the weakening currency (Rand).
0 14

0 15

0 16