supporting narrative guidance tool for coordinated
TRANSCRIPT

Supporting Narrative Guidance Tool for
Coordinated Visualisations
by
Chen Shen, B.Sc. (Hons)
Dissertation
Presented to the
University of Dublin, Trinity College
in fulfilment
of the requirement
for the degree of
Master of Science in Computer Science
University of Dublin, Trinity College
August 2014

i
Declaration
I, the undersigned, declare that this work has not previously been
submitted as an exercise for a degree at this or any other University,
and that, unless otherwise stated, it is entirely my own work.
Sign: ___________________________________
Chen Shen
Date: 26/08/2014

ii
Permission to lend and/or copy
I agree that Trinity College Library may lend or copy this dissertation
upon request.
Sign: ___________________________________
Chen Shen
Date: 26/08/2014

iii
Acknowledgements
I would like to thank my dissertation supervisor, for all his advice,
help guidance and encouragement throughout the progress of my
dissertation.
I would like to thank friends for their advice and help.

iv
Abstract
Coordinated visualizations are widely used within exploration of multi-dimensional datasets.
In this project, we perform research on web based coordinated visualization, and aim at
designing and developing supporting tool which is used to capture, replay the web events of
coordinated visualization as well as script these events with narrative guidance. In addition, a
system is designed to contain collaboration platform which is used to support data analyst to
facilitate the creation of script of visualization. Concept of version control is implemented
within system in order to handle multiple operations on same script. The outcome from this
project is a completed system which be used to help general user easily follow and retrace the
data exploration by using narrative guidance and support expert users to share exploration
process.
In this project, jQuery, JavaScript, HTML and AJAX are used as main client side
technologies. Combination of PHP and MySQL are used for supporting on the server side.
JSON is selected as data interchange format and HTTP is used as data communication
protocol.

v
Table of Figures
Figure 1 Example of D3.js ......................................................................................................... 7
Figure 2 Example of DC.js ........................................................................................................ 8
Figure 3 Distributed Version Control Diagram ....................................................................... 13
Figure 4 Centralized Version Control Diagram ....................................................................... 13
Figure 5 General User Cases Diagram ..................................................................................... 17
Figure 6 Experts Use Cases Diagram ...................................................................................... 18
Figure 7 Overview of System Architecture ............................................................................. 19
Figure 8 System Components Diagram ................................................................................... 20
Figure 9 Scripting Diagram ..................................................................................................... 22
Figure 10 Classes Diagram of Control and Model Layer ........................................................ 23
Figure 11 Structure of Database .............................................................................................. 24
Figure 12 Flow Chat of Version Control ................................................................................. 25
Figure 13 Version Linking Figure ........................................................................................... 26
Figure 14 PHP Framework Benchmark ................................................................................... 29
Figure 15 Expert User Interface ............................................................................................... 35
Figure 16 User Interfaces of Sidebars ...................................................................................... 36
Figure 17 Modal of Open Project ............................................................................................ 37
Figure 18 Server Side Architecture Diagram ........................................................................... 38
Figure 19 Evaluation Result of General User Scenario ........................................................... 45
Figure 20 Evaluation Result of Expert User Scenario ............................................................. 45
Figure 21 Evaluation Result of Collaboration Scenario .......................................................... 46
Figure 22 Evaluation Result of Usability of System ............................................................... 46

vi
Table of Tables
Table 1 Summary of sections in Chapter 2 ................................................................................ 5
Table 2 Taxonomy of interactive dynamics for visual analysis (Heer et al. 2012) ................... 9
Table 3 Similar Collaboration Applications Comparing ......................................................... 11
Table 4 JSON VS XML ........................................................................................................... 30
Table 5 Restful API Table ....................................................................................................... 39
Table 6 Detail of project Table ................................................................................................ 42
Table 7 Detail of version Table ............................................................................................... 42
Table 8 Detail of hasbasedversion Table ................................................................................. 42
Table 9 Detail of expert Table ................................................................................................. 42
Table 10 Detail of script Table ................................................................................................ 42

vii
Table of Contents
Declaration .................................................................................................................................. i
Permission to lend and/or copy .................................................................................................. ii
Acknowledgements .................................................................................................................. iii
Abstract ..................................................................................................................................... iv
Table of Figures ......................................................................................................................... v
Table of Tables ......................................................................................................................... vi
Table of Contents ..................................................................................................................... vii
Chapter 1. Introduction .......................................................................................................... 1
1.1. Background ................................................................................................................. 1
1.2. Motivation ................................................................................................................... 1
1.3. Research Questions ..................................................................................................... 2
1.4. Goal and Objective ...................................................................................................... 3
1.5. Outline of Thesis ......................................................................................................... 3
Chapter 2. State of Arts ......................................................................................................... 5
2.1. Introduction ................................................................................................................. 5
2.2. Web Based Coordination Visualizations..................................................................... 6
2.2.1. Visualization Libraries ......................................................................................... 7
2.2.2. Web Based Coordination Visualization Supporting ............................................ 9
2.3. Web Based Collaboration Tool ................................................................................. 10
2.3.1. Analysis of similar tools .................................................................................... 10
2.4. Version Control ......................................................................................................... 12
2.4.1. Version Control Concept ................................................................................... 12
2.4.2. Existing Version Systems .................................................................................. 12
2.5. Features Summary ..................................................................................................... 14
Chapter 3. Design ................................................................................................................ 15
3.1. Requirement Analysis ............................................................................................... 15

viii
3.1.1. Functional Requirement ..................................................................................... 15
3.1.2. Non Functional Requirement ............................................................................. 16
3.1.3. Use Case Diagram.............................................................................................. 17
3.2. System Architecture .................................................................................................. 18
3.3. System Components .................................................................................................. 19
3.4. Coordinated Visualization Supporting Design .......................................................... 21
3.4.1. Events Capture and Replay ................................................................................ 21
3.4.2. Narratives Creation ............................................................................................ 22
3.4.3. Scripting and Appending ................................................................................... 22
3.4.4. Storage ............................................................................................................... 22
3.5. Collaboration Platform Design.................................................................................. 23
3.5.1. Relational Database Design ............................................................................... 24
3.5.2. Version Control Design ..................................................................................... 25
3.6. Summary ................................................................................................................... 26
Chapter 4. Implementation .................................................................................................. 27
4.1. Technologies and languages...................................................................................... 27
4.1.1. Client Technologies ........................................................................................... 27
4.1.2. Server Technologies........................................................................................... 28
4.1.3. Other Technologies ............................................................................................ 29
4.2. Client Implantation .................................................................................................... 30
4.3.1. Events Capturing, Scripting and Appending ..................................................... 30
4.3.2. Events Replay and Further Exploration ............................................................. 32
4.3.3. Client-Server Interaction .................................................................................... 34
4.3.4. User Interface ..................................................................................................... 34
4.3. Server Implementation .............................................................................................. 38
4.4.1. Restful API Service............................................................................................ 38
4.4.2. Control Layer ..................................................................................................... 40
4.4.3. Model Layer ....................................................................................................... 41
4.4. Databases ................................................................................................................... 42
Chapter 5. Evaluation .......................................................................................................... 43
5.1. Evaluation Approach ................................................................................................. 43
5.2. Evaluation Analysis................................................................................................... 44
5.2.1. Observation ........................................................................................................ 44

ix
5.2.2. Questionnaire Feedback ..................................................................................... 45
5.2.3. Result Discussion ............................................................................................... 46
Chapter 6. Conclusions ........................................................................................................ 48
6.1. Conclusion ................................................................................................................. 48
6.2. Future work ............................................................................................................... 49
6.2.1. Availability of System ....................................................................................... 49
6.2.2. Scalability of System ......................................................................................... 49
6.2.3. Security of System ............................................................................................. 49
Chapter 7. Bibliography ...................................................................................................... 50
Chapter 8. Abbreviations ..................................................................................................... 53
Appendix A .............................................................................................................................. 54
Appendix B .............................................................................................................................. 55

1
Chapter 1. Introduction
1.1. Background
With development of big datasets in the industry, coordinated visualization systems, which
are used to visualize and explore these datasets, have become more important and powerful.
Nowadays, coordinated visualization systems are not only used for presenting sets of data but
also responsible for analysing and exploring from different points of views. A coordinated
visualization system has several visualization ways to format and present data sets based on
different variables. The main feature of coordinated visualization is to allow users to view
subset of one dataset by interacting with visualization. Once subset of data is changed, this
change will be propagated through other visualization of systems. Currently, more researches
of coordinated visualization have been lunched. One of most popular area is about
coordinated visualization supporting.
1.2. Motivation
Although, coordinated visualization systems have a powerful functionality for data analysing
and exploring, they still have quite few limitations. According to (Heijs 2007) mention, we
can conclude that firstly, took large size of multi-dimensional datasets into consideration, the
exploration process might be significantly complex especially for those general users who do
not fully understand linking between each visualization representation. Once the steps of
exploring datasets are complicated, it is easy to confuse general users to follow these steps.
Even users can follow these steps and obtain the analysis results, it is impossible let them
understand process.
Secondly, lack of supporting tools might be one of factors of against development of
coordinated visualization. Due to coordinated visualization systems develop rapidly in

2
recently time. It results in that only few supporting tools are developed to assist these systems.
As mentioned above, general users cannot explore and analyse data by coordinated
visualization system individually when exploration process is complex. Thus, it is necessary
to create powerful supporting tool which have abilities to help users track exploring events
and allow them retrace the exploration process.
Thirdly, most of current coordinated visualization systems are only the tools which are used
for data exploration. From view of data experts, systems, which only support data exploration,
cannot fully solve their problem in particular case. For example, assume that company
employ a group of new staffs which are responsible for data analysis every quarter. The data
experts or experienced staffs in the company have to demonstrate the exploration process to
new staffs and repeat this demonstration when new round of new staffs come in. Thus, it is
necessary to have an asynchronous tool which can help experts script coordinated
visualizations and facilitate them with narrative creation.
Fourthly, due to lack of collaboration on coordinated visualization system, poor abilities can
be supported for sharing of exploration process with narrative guidance. The basic reason
which causes this shortage is due to lack of an asynchronous collaboration system which is
running at backend to support the coordinated visualization system at frontend.
1.3. Research Questions
According to the background and motivations mentioned above, the aim of this project
focuses on supporting expert users to codify and represent a compelling narrative across a set
of complex data by using coordinated visualisations. In addition, visualisations will be
scripted and sequenced, yet will remain interactive, thus allowing the general user to further
explore the data via the visualisations offered. The research questions addressed in this
project can be divided into three areas:
Narrative Supporting for Coordinated Visualization: Compared with general visualization,
the concept of coordinated visualization is to build relationship between different
visualization of set of data, once one of these visualizations events is triggered by user, this
effect will be propagated to other visualization event. According to this concept, the research
question in this area can be defined to find out an approach which has ability to capture and

3
replay set of events of coordinated visualization meanwhile enable to script and sequence
these exploration events with corresponding narrative guidance. The narrative guidance is
responsible for giving brief explanation of relevant events.
Asynchronous Collaboration System: In this area, research question can be addressed that
constructs asynchronous approach which is used to directly support experts to publish and
share the visualization script with narrative guidance.
Version Control: The research question in this area can be defined that finds out an approach
which is used to handle issues when single visualization exploration script is manipulated by
multiple experts. Possible issues may involve data overwriting, and data recalling.
1.4. Goal and Objective
There are three main goals which need to be obtained by this project.
Firstly, create system which enables to record the events of coordinated visualization
exploration, script events with narrative guidance and replay offered visualization actions.
There are two possible ways to capture and record the event. One is capturing screen actions
as video record. The other one is to figure out method of triggering events, then capture
necessary parameters which are used for triggering. The latter is preferred method for this
project because:
Recording by video has lower flexibility and not allow users to further explore
Recording by video is not good idea that allows experts append new steps to script
Recording by video has poor ability to allow user to retrace specific step in the script.
Secondly, build a platform which is required to have ability to publish and share exploration
script. General idea is to construct collaborative platform which allows different types of
users to access. This platform is responsible for storing the exploration script with narrative
guidance, and providing interfaces for users to access data. Thirdly, add feature to the
collaborative platform so that make sure it allows multiple users operate and manipulate same
coordinated visualization script at same time.
1.5. Outline of Thesis
This chapter mainly give brief idea of current coordinated visualization system, and then
discusses the motivations based on limitations of system so that led to the proposal of

4
research questions. In addition, goals and contributions of this research are also described in
this chapter.
Chapter 2 introduces the state of art of narrative guidance system of coordinated visualization
system meanwhile discusses and analyse what features the system should have.
Chapter 3 discusses the requirement analysis of system including functional requirement and
technical requirement and system architecture. In addition, the system designs are covered in
this chapter. These designs involve coordinated visualization events capture and replay,
narrative creation, collaboration platform and version control.
Chapter 4 provides details about technologies which are used within implementation.
Meanwhile, discusses how each design can be implemented in the system.
Chapter 5 discusses details of evaluation of completed system with sample coordinated
visualization meanwhile outline design, plan and measurement of experiment. Furthermore,
analysis of feedback of evaluation is covered at the end of this chapter.
Chapter 6 concludes the features which are implemented in the system, analyse these features
whether satisfied with the goals. Meanwhile, discusses future works of system.

5
Chapter 2. State of Arts
In this chapter, we propose to discuss state of art study of coordinated visualization
supporting system and analyse how system is preforming. This study involves relevant
research about background knowledge of coordinative visualizations, collaboration platform
and version control concept. Approaches to face the main challenges of designing and
implementing system are also required to be covered in studies. In addition, performances of
existing approaches and relevant techniques, which may be used to deal with the challenges,
are also discussed in this chapter. A key outcome from this chapter is providing main features
of system. Moreover, the study concludes initial solution plan for addressing challenges
which will exist in system designing and implementing.
2.1 Introduction
2.2 Coordinated Visualization
2.3 Collaboration Platform
2.4 Version Control
2.5 Features Summary
Table 1 Summary of sections in Chapter 2
2.1. Introduction
With development of information technology, data has been created at large volumes. For
this reason, the exploration of large set of data is becoming big issue. In (Keim et al. 2002),
researchers mention that data visualization is one of efficient methods which can be used to
help users improve the efficiency of data exploration and analysis. The data visualizations
allow the users to view and learn data directly, without any understanding of complex
algorithms or parameters. As (Shneiderman 1996) discussed, general process of data

6
exploration involve three basic steps are. Firstly, users have to see the overview of data set.
Then, filter out interesting parts or areas, when subset of data is filtered, users enable to view
all changes of data visualization which are caused by filtering. Finally, users drill down and
drag more detail. Current visualizations system can be used to easily maintain an overview of
dataset meanwhile coordinated visualization allow users filter dataset due to propagated
feature. However, it is still difficult for users, who have little knowledge about data, to drill
down and handle complex further exploration of data set. Thus, key challenge is to find out
approaches to support both of expert users and general users to easier understand exploration
process when they are using visualization systems to drill down and access detail of dataset.
The aim of this project is developing web based tool which can be used to help expert users
codify a compelling narrative process across a set of complex data by using web based
coordinated visualisations. These visualisations will be scripted and shared, thus allowing the
general users to further explore the data via the visualisations offered. In order to achieve the
goal, a number of challenges are required to be addressed. We plan to divide the research
scope of key challenge into three areas. First area is web based coordinated visualization. In
this area, we analyse web based coordination visualization and research approaches of
supporting visualization. Second area is about research of collaboration platform. In this area,
we plan to analyse features of several existing collaboration tools, the analysis result will be
used as references to decide main features of system. Third area is version control. In this
area, we focus on analysing the mechanism of version control and discussing advantages and
disadvantages of existing source control systems. According to the result of analysis, we will
decide what features need to be added into system.
2.2. Web Based Coordination Visualizations
There are many projects covering coordinated visualization software. For example, snap-
together (North et al. 2000) is system which enables users to easily and quickly combine the
individual visualizations together and allows users select one individual view which may
result in the other related views changing. In addition, there are other nice software which can
be used to illustrate coordinated visualization such as IVEA(Thai et al. 2008), LSAView
(Crossno et al. 2009) and Improvise (Weaver 2004). However, with development of Internet
and data communication, the development trend of coordinated visualization is moving to
web based platform. VisGets (Dörk et al. 2008), WebPrisma (Almeida et al. 2009) and

7
(Matsui et al. 2011) are existing visualization framework based on web platform. There are
quite few motivation for using web based coordinated visualization system. Firstly, Internet is
widely used in the world. Secondly, as (Wide 1997) and (Almeida et al. 2009) mentioned,
web based system has high availability due to high frequent usage of web browser. Thirdly,
web based system has capability to handle collaboration working. Fourthly, compared with
PC software, web based system is easier to maintain most of web based applications are not
required to be installed.
2.2.1. Visualization Libraries
In this project, three JavaScript libraries, which are used to build coordinated visualization on
web browser, are used. They are D3.js, DC.js and Crossfilter.js respectively.
D3.js
Figure 1 Example of D3.js1
As (Bao et al. 2014) and (Bostock et al. 2011) mentioned, D3.js2, The Data Driven
Documents is a JavaScript library which provides users with efficiency and fast way to
manipulate the documents. D3 elements are presented by combination of HTML, CSS and
SVG. Within HTML web pages, an interactive element such as Figure 1 is created by SVG,
and then processed by CSS. Elements, which are created by D3.js library, are selectable and
transitional. Because data is bound to SVG, value of data can be directly presented by
1 Copy from: https://github.com/mbostock/d3/wiki/Gallery
2 D3.js- http://d3js.org/

8
element. For example, the length of bar can be determined by value of data. There is obvious
shortcoming of D3.js. Data is bound into each single D3 element, any transition would only
happen within single visualization but not be propagated through other visualizations. Thus,
D3.js cannot be individually used to implement multi-dimensional dataset and coordinated
visualization.
Crossfilter.js
Crossfilter.js3 (Zhu, N.Q., 2013) is JavaScript Library which is used to explore multi-
dimensional dataset. The main feature of this library is providing high speed of interaction
with coordinated views. According to API documentation provided, crossfilter can be
constructed by refereeing record. The format of record can be any array of JavaScript object.
Then, numbers of dimensions are created for classifying aspect of crossfilter data, usually,
dimensions are built by users. Filter can be implemented to dimensions in order to break
dimension into different parts. For example, Year data can be sliced 12 parts which represent
12 month or to be divided into 4 parts which represent 4 quarters.
DC.js
Figure 2 Example of DC.js
Dimensional Charting JavaScript library DC.js 4 (Zhu, N.Q., 2013) is combination of D3.js
and Crossfilter.js. This library is used to build coordinated visualization. DC.js provides
developers with numbers of charts which can be used to represent visualization on the web
3 Crossfilter.js-http://square.github.io/crossfilter/
4 DC.js-js.github.io/dc.js/

9
browser. Each chart can be defined as normal HTML element and linked to corresponding
DC object. All charts of DC are constructed by using D3.js, corssfilter constructs dataset and
dimensions for DC chart in order to make sure set of charts can be used to explore
coordinated visualization. Several types of charts can be supported by D3.js such as object of
bubble, pie, bar, geo and line. These sub-objects extend from other abstract objects which
contains methods of interacting chart object. One abstract object may have one trigger
method which is shared by more sub-objects, thus it is difficult to classify which type of
charts are triggered.
2.2.2. Web Based Coordination Visualization Supporting
According to (Heer et al. 2007) and (Heer et al. 2012), a taxonomy is provided for supporting
researchers to build visualization analysis system. As Figure 2 shown, development process
of visualization analysis tool is divided into three sections. They are Data $ View
Specification, View Manipulation and Process & Provenance respectively.
Table 2 Taxonomy of interactive dynamics for visual analysis (Heer et al. 2012)
In particular, Process & Provenance is section which we need reference for this project. As
Table 2 shown, this section is divided into four individual sub sections. They are Record,
Annotate, Share and Guide. Under record, Heer and Shneidrman mentioned that recording of
exploration process is very important. It can help users revisit or resume any steps of
exploration. This is necessary due to unexpected actions usually happened within further
exploration of visualization. Under annotate, communication is possible and necessary within
visualization exploration. Adding annotation is a efficiency way to document findings of

10
exploration. Under share, they discuss that exploration analysis is not only done by single
expert, but in real world, it must be processed collaboratively. Under guide, outline that how
the recorded exploration script can be used to guide other users and how narrative guidance
can be used to support users to further explore and analyse data.
In order to build supporting tool which can handle record, annotate, share and guide within
exploration of web based coordinated visualization, number of challenges need to be
addressed. Firstly, we need find out approach to record exploration events of elements which
is built by DC.js. Secondly, we need figure out the way of creating annotation and the
methods of scripting and sequencing exploration recordings with annotation. Thirdly, we
need to find out approach to share exploration visualization. Finally, we need to figure out
how to guide users to further explore data analysis by using web based coordinated
visualizations.
2.3. Web Based Collaboration Tool
What is Collaboration? According to explanation from dictionary, collaboration is working
with others to completed tasks and achieve goal. Collaboration frequently appears in process
of software development. According to (Kusumasari et al. n.d.), from software development
point of view, collaboration is concept of gathering experience, skill and knowledge from
multiple members to achieve development goal. However, currently, not only collaboration is
used for software development, but also is used in other area such as data analysis or data
visualization exploration.
2.3.1. Analysis of similar tools
In this section, we prepare to discuss two web based collaboration applications and analyse
the main features of each tool.
Together.js
Together.js 5 is an open source JavaScript library which is built on Node.js
6. It aims at
integrating collaboration tool to any web applications and supporting real time collaborative
5 Together.js- https://togetherjs.com/
6 Node.js- http://nodejs.org/

11
working on web browser. All action on document of web browser can be viewed by other
users in real time. The core of Together.js is hub. The hub is a server that everyone in a
session connects to, and it uses Web Sockets to transfer messages to all the participants. Hub
does not rewrite the messages, the only thing it does is passing the messages between the
participants.
The main features of Together.js:
Providing users with real time collaboration.
Providing users with annotations by chart.
Easy to be integrated in web application.
Google Documents
Google Documents 7 is web based documents editor. It allows users to collaboratively work
on document, spreadsheets, and presentation in real time or asynchronous time. All
documents, which are created on Google Documents, can be shared, opened and edited by
multiple users. In addition, Google Documents allows users to add comments or annotations
on any position of document sheet. Editors’ position can be marked and showed to other
editors when they are collaboratively working on same document.
Type Support
Saving
Support
Annotation
Support
Sharing
Together.js Real time No Yes Yes
Google Docs Real time/
asynchronously
Yes Yes Yes
Table 3 Similar Collaboration Applications Comparing
According to analysis of each web based collaboration tool, we can find that both of two
tools have capability to share and annotate the documents. Google Docs maintains a remote
storage so that documents can be saved and re-edited in different. Together.js can be
integrated into any web based application, and can be used to support real time guidance for
collaborative members. In addition, according to (Ba et al. 2013), we know that Google Docs
enables large scale of contributors work together and do not need consider the difference of
level of expertise.
7 Google Docs- https://docs.google.com/

12
2.4. Version Control
In this section, we focus on introducing basic concept of version system and presenting two
existing version control system. We analyse advantages and disadvantages of mechanism of
existing systems so that decide what features can be used within system.
2.4.1. Version Control Concept
Version control, also called source control, is use to manage the changes of document. Every
change is identified by ID or unique code in order to track it. Before any changes happen,
default repository need to be construct on host or any other remote server. Once users want to
track any changes of data in repository, they need check out or clone a whole repository or
specific version of data from remote server to local. As users make changes, those changes
would be tracked locally. The process always keeps transparent until users prepare to commit
those changes. When all changes have been done on local side, users can choose to commit
the collection of changes to remote repository. Once changes have been successfully
committed on remote side, collection of changes is regarded as new version and saved with
increased identification. According to this mechanism, overwriting issue can be avoided
when it comes to collaboration. In addition, contributors have ability to view past changes
which are made by other contributors.
2.4.2. Existing Version Systems
There are lots of version control systems existing in market such as Git, SVN (Subversion et
al. 2008) and so on. In this section, we introduce two popular version control system in the
market. One is git, one is SVN.
Git (Spinellis 2012), (Jon Loeliger 2009) is version control system based on distributed
concept. The main advantage of such type of system is that entire server repository is
mirrored to multiple servers. As such, clients do not need worry about data missing and serer
die. However, distributed servers are difficult to implemented and expensive to maintain.

13
Figure 3 Distributed Version Control Diagram8
SVN, also called Subversion, is centralized version control system. Such type of system
maintains central server on the remote side and contains all data in one place. Every client
needs checkout file from central server. The main advantages of this type of version control
system are that firstly, compare with local version control system, centralized version control
system can be used to handle collaboration working. Secondly, compared with distributed
version control system, it is cheap to implement and maintain. The obvious disadvantage of
centralized system is single point of failure. Once, centralized server crash, all clients cannot
collaborate.
Figure 4 Centralized Version Control Diagram8
8 Copy from; http://git-scm.com/book/en/Getting-Started-About-Version-Control

14
In addition, there is another type of version control system. However, because it cannot be
used for handling collaboration working, we would not discuss here.
Take scale and resource of this project into consideration, centralized version control system
such as SVN could be good option. However, such type of systems cannot be easily
integrated into web based system and to some extent, it will become complex if make them
handle coordinated visualization exploration data. Thus, the better solution is to implement a
customized and lightweight version control system that is especially used for collaborating
coordinated visualization exploration.
2.5. Features Summary
According to analysis of different research areas, we can briefly conclude main features of
this system. Firstly, according to analysis in section of 2, supporting system is designed to
targets on web based coordinated visualization which is built by DC.js. Secondly, according
to part of conclusion from (Heer et al. 2007) and (Heer et al. 2012), support system need have
ability to record, annotate, share and replay the exploration of coordinated visualizations.
Thirdly, through compare features of two existing collaboration tool. We can conclude that
system can be integrated to any web based coordinated visualizations, and system is required
to maintain remote storage so that allows multiple users to view and edit exploration script
asynchronously. Fourthly, due to current version control systems are complicated and most of
them cannot be easily integrated to system, we decide that system could have lightweight
version control system in order to handle possible collaboration issues such as data
overwriting and data recalling.
Here is list of main features we conclude:
Support for web based coordinated visualization
Can be integrated
Can capture, script exploration steps with narrative
Can share exploration script with other users
Can replay shared script
Allow multiple users to append/edit shared script
Handle issue of data overwriting and data recalling.

15
Chapter 3. Design
3.1. Requirement Analysis
In order to solve the research questions, the system is required to have ability to satisfy
specific requirements. In this chapter, we will discuss details of requirements from both of
functional point of view and non-functional point of view. Function requirements
demonstrate scenarios that the system enables to handle and how it would react and deal with.
Non function requirements present the criteria that are used to assess the operational feature
of system.
3.1.1. Functional Requirement
Coordinated Visualization Event Capture and Replay
Web based events of coordinated visualization, which is built by DC.js, are required to be
captured and replayed by system. The function of events capture is used for supporting
experts to record each exploration step on visualization so that enable to generate event script
in the future. The function of event replay is used for support general users to follow and
retrace the step(s) of visualization exploration.
Creation of Narrative Guidance
System allows expert users create narrative guidance for each corresponding exploration step.
Narrative guidance is required attached to its related exploration step and could be the format
of text. It is mainly used to provide general users with additional detail when they are
following or retracing visualization exploration.
Events Scripting and Sequencing

16
Once necessary exploration steps are all captured and corresponding narrative guidance are
created. System is required to script these steps with narrative guidance. All steps are
sequenced and scripted with order of recording. The completed script might be generated to
collaboration platform for sharing.
Construction of Collaboration Platform
System is required to perform a collaboration platform, which support to facilitate and share
exploration script. The main functionalities of this platform are storing script data remotely,
providing all users with interfaces and allow them read/write script data. In addition, platform
should have ability to grant privileges of data access for different type of users.
Version Control
In order to handle the issue of multiple operations on same script, simple version control
system needs to be implemented in the collaboration platform. It allows that script, which is
originally created by experts, can be re-edited by other experts without overwriting. In
addition, version control system can help user recall previous versions of script if it is
required.
3.1.2. Non Functional Requirement
Ability of Integration
In order to make sure supporting system can be applied to web based coordinated
visualizations that are built by dc.js. Tool should be easily integrated to those types of system.
One of existing example is together.js.
Asynchronous
Due to tool is designed to be integrated in an existing coordinated visualization and handle
function of capture and replay web events on current page, it should have ability to be
operated without interfering with the existing page. Any redirection or refreshing actions,
which may cause changes of current pages, are not allowed.
Data Storage

17
Data storage is an integral part of any application. Data are stored locally so that it can be
used later. In this system, we store data at both of client and server side. The data, which is
relevant for further processing, are stored in the persistence storage on server side. The data,
which is relevant for temporal processing, are stored in local storage of web browser. General
local storages of web browser include Session Storage, Local Storage and Cookie.
3.1.3. Use Case Diagram
According to requirement analysis mentioned above, user cases of system are concluded.
Scenarios have been divided into two types based on types of users. They are use cases of
general recipients and experts receptively. Two uses case diagrams are created for showing
exact tasks that are required to be deal with by system.
Figure 5 General User Cases Diagram

18
Figure 6 Experts Use Cases Diagram
3.2. System Architecture
According to requirement analysis mentioned above, a system is designed as shown in Figure
3. The architecture of system is based on the MVC pattern.. From the figure, we can see that
there are two main components/layers existing on client side. The models in the view layer
are responsible for presenting user interface for users to directly control tool. Under view
layer, we have other layer called control layer. The responsibility of this layer is providing
relevant functions to
Capture coordinated visualization events
Create narrative guidance
Script and sequence events with guidance
Replay script
Store local data
Send and retrieve data

19
On the server side, a restful API service is created as top layer. It is mainly responsible for
providing all clients with interface and allowing them access the data or service. Under that,
we have other control layer. All modal in this layer are used for obtaining different types of
requests from client side, then sending orders to model layer. The model layer is responsible
for accessing data based on the order which is sent from control layer. At the bottom, we
have persistent layer which is used for maintaining the data storage on the server side
Figure 7 Overview of System Architecture
3.3. System Components
There are three main components to compose the system. They are experts system, general
system and collaboration platform respectively. However, experts and general system are
usually seen as a one combined system because experts system also has same functionality of
general system. The following figure shows how three components can be worked within
entire system.

20
Figure 8 System Components Diagram
Experts System
This system is mainly used by expert users. It will help expert generate exploration script and
share it with other expert user or general users. Those shared script data will be sent to server,
and stored in the persistent storage. System also allows other experts assess any shared scripts,
and provide them with privilege to append new steps to the script. In addition, expert users
enable to use this system to view and replay any scripts just like a general user.
Collaboration Platform
In entire system, collaboration platform is mainly used to manage necessary data which are
used by both of expert users and general users. It is responsible for maintaining persistent
storage and supporting user to access data. In addition, it is used to handle the different
request from clients and enable to response corresponding data to users.
General System
This system can be seen as sub system of experts system, because it only provides general
users with function of script viewing and replying. This system is used by general users who
need assistance of exploration script and it can support general user to replay every
exploration step as well as narrative guidance.
Expert System General System
System

21
3.4. Coordinated Visualization Supporting Design
3.4.1. Events Capture and Replay
Before design function of event capture, we have to decide the mechanism and methods of
recording events. In this system, due to events capture and data exploration might be operated
within same user interface and normal process of visualization exploration cannot be
interfered. For this reason, we design system which enables to provide option which allows
users start capturing visualization events. If option is selected, system enables to record every
visualization event which user makes on the web browser. Otherwise, user can explore data
by using coordinated visualization as normal.
Now, we are talking about method of events capture. As we discussed in 1.4, video recording
cannot fully satisfy the requirements. We will design other approach to record user actions
from coordinated visualization. Take features of Integrity into consideration, we plan to
refactor DC.js library in order to make sure events of DC charts can be recorded. Firstly, we
need figure out what function are used to trigger events of charts. Then, we refactor that piece
of code so that make sure relevant parameters, which are used to trigger events, can be
recorded locally. However, as we discussed in section of 2.2.1, due to abstract objects, it is
difficult to classify the type of chart when it is triggering. The ideal solution for this problem
is to add identification for each chart. Once event is captured, the identification of triggered
chart is recorded as well.
The method of events replay is similar with events capture. It also requires us to drill down
DC.js, find out the functions of trigger events of chart, and then we can reuse function within
system. When the script is cloned from remote repository to local repository and loaded, we
make program to call that function and pass recorded parameters into it. However, before
passing parameters, system is required to parse identification in order to know which type of
chart need to be re-triggered. When events are replaying, the related narrative guidance needs
to be displayed on the screen as well. We design an area which is used for showing relevant
narrative. Once there is narrative guidance existing, the system atomically fills content of
narrative into that area. Otherwise, the area is hidden in order to avoid interfering on main
screen.

22
3.4.2. Narratives Creation
As we mentioned in requirement analysis 3.1, narrative guidance is required to be attached
with visualization step. For this reason, narrative creation will be followed by events capture.
We locate text area in suitable place of user interface so that user can feel free to enter
narrative guidance without any interfering.
3.4.3. Scripting and Appending
According to the requirement analysis 3.1, once recorded events are required to sequenced
and script with narrative guidance. In this system, the scripting is processed along with event
capture and narrative creation. We plan to declare an array, which is used for containing
several nodes with order. Each node in array represents an exploration step. The step contains
exploration event and corresponding narrative guidance. Once a new node (step) is created, it
will be put into end of array. If users want to append new steps into existing, system is
required to clone existing script and change it to array format, after that push appended step
into end of array. When appending or scripting completed, user need commit their creation or
changes to remote repository.
Figure 9 Scripting Diagram
3.4.4. Storage
In this system, we need local storage which is used for handling temporal processing data.
Several types of local storage are supported within currently web browsers such as session
storage, local storage and cookie. These storages are all based on key-value pairs. On the
server side, we need maintain a relational database which is used to handling further
processing data. Due to system has feature about version control, we need clone data from
remote repository to local repository. After appending or merging, the new data is sent from
local repository to remote repository.

23
3.5. Collaboration Platform Design
In order to support users to publish and share their exploration script, we need a remote
server and database which allow users store or access data asynchronously. For this purpose,
we design two main components on the server side. One component is a persistent storage,
which is used for storing any further processing data. The other component is a server
application which allows clients write/read data from remote database. Database is designed
based on relational tables. Five tables are created. Details of databases are discussed in
section of. The server application is designed based on MVC pattern, but we do not really
need to implement full MVC. We need restful API layer, instead of view.
Figure 10 Classes Diagram of Control and Model Layer
Figure 10 shows the class structures of control and model layer. We plan to create five
models based on the tables of database. Then, design corresponding controllers in control
layer in order to handle relevant models. The main responsibilities of controllers are
obtaining requests from clients, calling corresponding functions of models in order to access
data, then sending the responses back to clients. We design a based controller class which is
used for retrieving and sending data, this controller will be extended by other classes so that
we do not need overwrite functions of retrieving and responding on each controller. The other
controllers are designed to calling query functions of models based on different requests. In
addition, we design an error controller which is used for handling all routing errors of system.

24
All classes of model layer are responsible for accessing data by using SQL Once queries are
completed, queried data will be sent to control layer. Then, controllers are responsible for
sending queried data back to clients. Furthermore, as we mentioned in section of 3.2, we
design a restful API service on top layer in order to provide clients with interfaces to access
methods of controllers.
3.5.1. Relational Database Design
Figure 11 Structure of Database
Above diagram shows the structure of relation database on server side. The tables in database
are responsible for storing data of author, visualization project, visualization version,
visualization script and based version of project receptively. From the diagram, we can see
that one user could be allowed to own or create many projects or versions of project. One
user also enables to create or own many versions of single project. Those versions could
belong to one project, but one project could only have one original version of script. In

25
addition, each version could only have one script. This design has several advantages. Firstly,
users enable to create many different branches/versions of project. When experts desire to
append or edit new exploration step to existing version of script. They do not need overwrite
that script. They just need clone that version from remote storage to local storage, then
append or edit that script, finally store it into remote database as new version. Secondly,
every version of script has been linked to its original version and extended version. Thus,
users enable search out the original and extended scripts.
3.5.2. Version Control Design
The figure 12 shows version control flow chart. The whole process can be divided into six
steps. When users want to create new version or append/edit existing version of visualization
of script. Firstly, system need clone data from remote side to local data side. Secondly,
cloned visualization data is loaded and illustrated on coordinated visualization. Then, user
can start editing. Once edition finished, new data will be committed to remote storage.
Remote server would not overwrite old data of visualization of script. The ideal approach is
to save data as new version under same project.
Figure 12 Flow Chat of Version Control

26
As we mentioned in section of 3.5.1, remote database allows one single visualization project
contains many versions of scripts. In order to make sure user can easily checkout any
versions as well as their related versions. We propose to link version to its original, as figure
13 shown. Then, we can simply use SQL to query of original and extended versions of script
data. Here are two type query statements which will be implemented in order to find out
extended and original version of script.
SQL of listing original version:
SELECT ov.* FROM version ov
JOIN version v ON v. original_version_id = ov.version_id
WHERE v.version_id = '$vid';"
SQL of listing extended versions
"SELECT ev.* FROM version ev
JOIN version v ON v.version_id= ev. original_version_id
WHERE v. version_id = '$vid';"
Figure 13 Version Linking Figure
3.6. Summary
In this chapter, we define the functional and non-functional requirements of system based on
and briefly give methods of recording, annotating, sharing and relaying the exploration of
visualization. In addition, we outline the structure of front system and collaboration system
including their application layer and persistent layer and introduce the mechanism of version
control for this system.

27
Chapter 4. Implementation
4.1. Technologies and languages
In this section, we focus on discussing technologies and languages which are used within
implementation for both of client and server sides. We will not only provide introduction of
each technologies but also mention reasons of choosing these technologies.
4.1.1. Client Technologies
jQuery
jQuery 9
is JavaScript library with rich features. It can be used to manipulate HTML
document, trigger events and so on. The advantage of using jQuery is firstly, jQuery provide
developer with simpler API to control the element in HTML document. For example, get
element function in jQuery can be written as $(“#id”) or $(“.class). Secondly, jQuery has
strong API which allows application works across multiple web browsers. Thirdly, jQuery
makes AJAX implementation easier. Due to asynchronous collaboration needs be handled by
system, AJAX has to be used for supporting asynchronous data communication. Thus,
Contemplating all this, jQuery is better option for this project.
Bootstraps
Bootstrap 10
is front-end framework which is based on HTML and CSS. It beautifies all basic
HTML elements by using defined stylesheet so that modern web UI can be easily developed.
In addition, it improves HTM elements and JavaScript components with advance features
such as drop-down option, button group, dialog box, tooltips and horizontal tabs. Due to user
9 jQuery- http://jquery.com/
10 Bootstrap- http://getbootstrap.com/

28
interfaces of system consists of several sidebars, those advance features will be used within
implementation.
AJAX
AJAX11
is a group of web development technologies. It is mainly used on client-side to build
asynchronous system. The main features of this technology is allowing data sending and
retrieving can be processed in the background without interfering with current web page, In
this project, due to we need develop a integration tool for web based coordinated
visualization, tool may not to be allowed to redirect or change current pages. In addition,
system has responsibility to handle collaboration. Necessary data need to be communicated
asynchronously. In conclusion, AJAX is selected as part of technologies which is used for
client side.
4.1.2. Server Technologies
PHP with Phalcon framework
PHP 12
is one of widely used server side scripting language It provide developers with
efficiency and fast way to help server handle client request, query data and response.
Currently, PHP is used on 2.1 million web servers (Ide, 2013). Facebook13
is one of famous
website which is implemented by PHP. In addition, there are lots of frameworks available for
supporting PHP. Phaclon 14
is one of commonly used framework, which is implemented on
MVC pattern. It can support different size of MVC applications such as single module and
multi-module. Take size of this system into consideration, Phalcom can be good option. In
addition, the other reason push me use Phalcon is speed of performance. Here is a figure
showing Performance benchmark of PHP frameworks.
11 AJAX- http://www.w3schools.com/ajax/default.ASP
12 PHP- http://php.net/
13 Facebook: www.facebook.com
14 Phaclon- http://phalconphp.com/en/

29
Figure 14 PHP Framework Benchmark15
MySQL16
As we design in section of 3.5.1, system is required to maintain a persistent storage on server
side in order to store data for further processing. Due to requirements of collaboration and
version control, we decide to build a relational database on server for maintain necessary data.
MySQL is one of commonly used management system for relational database. There are
several reasons motivating me to choose MySQL. Firstly, it can be applied to different
operating system such as UNIX/LINUX and Windows. Secondly, it can be scalable, small,
medium or large amount of data can be handled. Thirdly, due to we select PHP as server
scripting language, MySQL has good performance to support PHP development interface.
4.1.3. Other Technologies
HTTP
HTTP (Fielding, 1999) is short for Hypertext Transfer Protocol, which is mainly used for
data communication between distributed and collaboration systems. In this project, system is
design based on client-server model, thus, data communication handing is required for both
15 Copy from- http://systemsarchitect.net/performance-benchmark-of-popular-php-frameworks/
16 MySQL- http://www.mysql.com/

30
of client and server side. The HTTP defined several methods for different purposes such as
GET, POST, PUT, DELETE and so on. GET method is mainly used for retrieving data,
POST method is mainly for creating data, PUT is used for updating data and DELETE is
mainly used for deleting data.
JSON
JSON 17
is one of widely used data interchange format. Generally, two main forms are used
by JSON to present data. One is array, the other one is object. Data, which is stored in array
form, need to be kept orders, but on the contrary, object keeps data disordered. Here is a table
to illustrate a Con and Pros of JSON and XML. It is an important reference for selecting
suitable data-interchange format for system (Lin et al. 2012).
Cons Pros
JSON Lightweight, less verbose, fast, Simple syntax, not easily
extendable
XML Flexibility, Name-spacing and
extendibility
Slow, Verbosity, Hard to
read by human.
Table 4 JSON VS XML
Due to system has responsibility to script exploration step in order and format parsing is
heavy for web browser. Contemplating all this, JSON is the better choice.
4.2. Client Implantation
In this section, we focus on discussing the implementation of client side. We split section into
subsections of events capture and script, events replay, client and server interaction and user
interface. Several code snippets will be provided to support idea of implementation of each
section.
4.3.1. Events Capturing, Scripting and Appending
The method of capture visualization event has been mentioned in section of 3.4. General idea
of method is drilling down to DC.js library and injecting function to DC chart listener and
capture necessary parameters which are used to trigger visualization events. According to
research on DC.js library, we find out key parameters of triggering events involve value of
17JSON- http://json.org/

31
filtering and the chart object. Thus, firstly, we inject function into DC chart listener, once
users open recording model and click any charts on the screen, the chart identification, filter
value and created narrative are captured. Chart identification is an array which contains chart
type and chart element id of html. The parameters of chart identification, filter value and
narrative are bound and added into an array. We call this combination as step or node. We
prepare other array in order to script these steps. Once step is generated, it will be push into
end of script array. When recording completed, the script array is stored in the cookie for
temporal processing.
In addition, we should mention here, due to recording may be required in scenarios of
creating and appending exploration of visualization. We have to implement different
solutions. If user prepare create new exploration script, system is required to record steps and
store in the cookie. Once users click submit button, the original version of exploration script
is committed to remote storage (repository). If users want to append existing script, system
needs to clone existing script from remote storage (repository) to local storage (repository),
load data into array, then push new step into that loaded script array.
Here are code snippets showing how recording and scripting function implemented.
In Step.js
Step.prototype.add = function() {
var data = JSON.parse(new cookie().read(scriptName));
var expert = new cookie().read("userID");
if(expert != null && expert !="") {
if(data == null) {
….. var params = addParameters(_chartName, _toFilter,comment);
var steps = new Array();
steps.push(params);
setSteps(scriptName, steps);
…..
} else {
….. var steps = JSON.parse(new cookie().read(scriptName));
var params = addParameters(_chartName, _toFilter,comment);
steps.push(params);
setSteps(scriptName,steps);
…..
}
}
}

32
function setSteps(storageName,value) {
if(_isRecord) {
new cookie().create(storageName, JSON.stringify(value), 365);
}
}
function addParameters(_chartName, _toFilter,_comment) {
if(_chartName != null && _toFilter != null) {
var _paramaters = {};
_paramaters['chartName'] = _chartName;
_paramaters['toFilter'] = _toFilter;
_paramaters['comment'] = _comment;
}
In DC.js
dc.bubbleChart = function(parent, chartGroup) {
……. var _chart = dc.abstractBubbleChart(dc.coordinateGridChart({}), ["Bubble",parent]);
……..
}
dc.abstractBubbleChart = function (_chart, _chartName) {
….
_chart.onClick = function (d) {
var toFilter = d.key;
if (toFilter != _chart.filter()) {
dc.events.trigger(function () {
new Step(_chartName, toFilter).add();
_chart.filter(toFilter);
dc.redrawAll(_chart.chartGroup());
});
}
};
….
}
4.3.2. Events Replay and Further Exploration
The design of visualization replay is discussed in section of 3.4.1. General idea of
visualization replay is to re-trigger chart by using recorded parameters. Due to coordinated
visualization may consist of different type of charts such as bar chart and bubble chart.
Before re-trigger chart, system is required to parse identification of chart, then call triggering
function of corresponding chart. Before replay exploration, users need to open an existing
visualization project (clone repository data from remote server to local storage), then users
can start replaying exploration script. In this system, visualization can be replayed step by

33
step or replayed like slide show. We provide users with three buttons to control replay
function. Forward button allows users view each individual step of exploration, play button
allows users see changes of visualization within script running. Pause button allows script
users at specific steps. If users want to further explore visualization, they have to wait until
script is run at last step. Once replay finishes, users are allowed to do further exploration.
Here is piece of code show methods of re-triggering chart.
function trigger(chart) {
showNarrative();
dc.events.trigger(function () {
chart.filter(toFilter);
dc.redrawAll(chart.chartGroup());
});
function triggerChart(chart) {
var chartTitle = chart[0];
var chart = chart[1];
switch(chartTitle) {
case 'Line':
trigger(objLineChart[chart]);
break; case 'Bubble':
trigger(objBubbleChart[chart]);
break; case 'Pie':
trigger(objPieChart[chart]);
break; case 'Row':
trigger(objRowChart[chart]);
break; case 'Bar':
trigger(objVolumeChart[chart]);
break; case 'Geo':
break;
default:
break;
}
}

34
4.3.3. Client-Server Interaction
In this section, the implementation focuses on methods of interaction between client and
server. AJAX is used for data communication. The main reason of choosing it is because that
AJAX can handle data communication between client and server without interfering with
current page. This is very important especially for integration tool. All HTTP methods (Get,
Post, Delete, Put, etc...) can be supported within AJAX request. URL and different format of
data can also be defined in AJAX. In this system, client is responsible for sending data by
using AJAX request to API which is defined by Phalcon framework. Once server obtained
requests from clients, the data are queried and sent back to client side. Then, AJAX enables
users handle response no matter the responses from server is error or not. Here is code
example of AJXA which has been implemented in system.
$.ajax({
url: 'php/project/version/getAll',
contentType: 'application/json',
dataType: 'json',
type: 'get',
data: 'projectID=' + $(this).find('option:selected').val(),
success: function(data){
}, error: function(data){
}
})
4.3.4. User Interface
All user interfaces of this system consist of sidebars and overlay modal dialogs. According to
system design, we split system into two different types of models. One model is created for
expert users. The other one is built for general users. General users model only provide user
with interface to control script viewing function. Expert model provide user with several
interfaces to control script generating, sharing and reviewing functions. Figure 10 shows one
of user interfaces of expert model

35
Figure 15 Expert User Interface
In order to make sure the ability of integrating, user interfaces of system are required to
locate at overlay of coordinated visualization system. Here is snippet code showing how
overlay of UI can be handled in jQuery and CSS.
$(_defaultControl).appendTo($("body"))
.attr('id', 'main-control')
.css({position: "fixed", top: "20%", left: "0%", "z-index": "10"});
“position:fixed” is used to make sure elements are always located at fix position of screen,
“z-index:10” is used to make sure elements are overlay on the based web pages. In this
system, we build four main sidebars with different purposes, theses sidebars are used to
support use cases of recording and replaying visualization script, creating narrative guidance
and triggering modals. The user interface of four sidebars are shown below, the player project
sidebar is used by both of expert users and general users. It is mainly responsible for
controlling visualization replay operation. The other three sidebars are mainly used for
supporting expert users to create, share and edit exploration of visualizations. The main
control sidebar provides general navigation for users and allow them open available
visualization project. The sidebars of creating and editing are similar. These two bars are
mainly responsible for creating and manipulating the script of exploration visualization.
About narrative guidance creation and replaying, as discussed in deign section, we locate two
text areas in corresponding sidebars. One is used for allowing users enter annotations, the
other one is used for displaying the annotations within replaying.

36
Figure 16 User Interfaces of Sidebars
Except sidebars, we build overlay modal dialogs based on bootstraps. These overlay modal
dialogs provide user with additional user interface to enter data. Any input html elements
such as text area, selection and checkbox can be contained in modal. In this system, overlay
modal is used to support use cases of:
Login
Open visualization
View detail of visualization project
Create visualization project
Append new steps to visualization project
One of models is shown below. This modal is used to handle the operation of project open.
Except shown model, we also build three additional modals which are used to handle login as
well as operations of creating, viewing and appending of visualization. In this system, model
dialog is created by JavaScript function document.createElement<’div’>, and then append
bootstrap model <div> into created <div>. All model dialogs initially keep being hidden as
default and they can be triggered to show. Here is code snippets provided to show example of
modal dialog:
Adding and loading modal dialog
var _openForm = document.createElement('div');
$(_openForm).attr('id', 'openForm').appendTo($("body"));
$('#'openForm').load('./project_open_modal.html').hide();

37
project_open_modal.html
<div class="modal fade" id="projctOpenModal" tabindex="-1" role="dialog" aria-
labelledby="projctOpenModalLabel" aria-hidden="true">
<div class="modal-dialog">
<div class="modal-content">
<div class="modal-header">
<h4 class="modal-title" id="projctOpenModalLabel">Open Project</h4>
</div>
<div class="modal-body">
…….
</div>
</div>
</div>
</div>
Modal Dialog Trigger
$(document).ready(function() {
$('#'openForm').show();
$('#projctOpenModal').modal();
});
Figure 17 Modal of Open Project

38
4.3. Server Implementation
In this section, we focus on discussing the implementation on server side. The server of this
system is implemented based on PHP and Phlacon framework. This framework is built based
MVC Pattern and provides developer fast and efficiency way to build small or medium size
of server application. Detail of Phalcon is discussed in section of 4.1.2. The section is divided
into several areas based the architecture of server. These areas are related to Restful API
Layer, Control Layer and Model Layer. Several code snippets will be provided to support
idea of implementation of layers.
Figure 18 Server Side Architecture Diagram
4.4.1. Restful API Service
In a server application, Restful API is used within HTTP methods which consist of several
types such as GET, POST, PUT and DELETE. GET means method of retrieving and
obtaining data, POST represent the method of adding data, DELETE is the method of
removing data and PUT means the method of updating data. In this system, system is
required to query, add and update data about script of exploration visualization. Thus, the

39
methods we need focus on are GET, PUT and POST. PHP Phalcon provides developer with
“Micro-Framework” which is suitable for handing small or medium size of application. Take
scale of this project into consideration, we do not need to implement full MVC environment.
Thus, using micro-framework is better choice for system. Several steps are required to
complete in order to implement Restful API within Phalcon micro-framework. Firstly, we
need edit all rules to rewrite the URLs to index page. Then we create router which is used for
pointing requests to corresponding controller. Here is piece of PHP code as examples to show
how routes are created:
$app = new Phalcon\Mvc\Micro($di);
$app->get('/user', array(new LoginController(), "loginAction"));
$app->get('/user/getAll', array(new ExpertuserController(), "getAllAction"));
$app->post('/project/create', array(new ProjectController(), "createAction"));
$app->get('/project/getAll', array(new ProjectController(), "getAllAction"));
$app->get('/project/get', array(new ProjectController(), "getAction"));
$app->post('/project/save', array(new ProjectController(), "saveAction"));
$app->get('/project/version/get', array(new VersionController(), "getAction"));
$app->get('/project/version/getAll', array(new VersionController(), "getAllAction"));
$app->post('/project/version/save', array(new VersionController(), "saveVersionAction"));
$app->notFound(array(new ErrorController(), "notFoundAction"));
First parameter of get or post function mean the route of application, second parameter is an
array which represents responsible controller and action. In addition, we defined notFound
route In order to handle all invalid URLs. When invalid URLs are entered, notFound action
in ErrorControl will responsible for sending error message back to client. We listed all
created API with explanations below:
API Explanation
/user User login
/user/getAll Get all users Name
/project/create Create new project
/project/getAll Get list of project
/project/get Get single project by project ID
/project/getByExpertID Get single project by author ID
/project/save Save project
/project/version/get Get single version of project by version ID
/project/version/getAll Get all version of project
/project/version/save Save new version of project
Table 5 Restful API Table

40
4.4.2. Control Layer
Requests, which come from clients, are assigned to corresponding controllers by routing.
Control layer is mainly responsible for obtaining and parsing these requests. Then call the
relevant functions from model layer. Once model layer finishes data querying, controllers
format those data and send response back to clients. Each controller has several actions and
these actions can be directly access by routing. In control layer of this system, we build a
based controller which is called ControllerBase.php. ControlerBased.php is extended by the
other controllers. Due to all controllers are required to obtain, parse the requests from client
and send response back to client. We decide locate the function of obtaining and parsing into
ControllerBase.php so that functions can be inherited by other controllers. Here are code
snippets for showing how requests and responses are handled by based controller.
public function sendHttpResponse($statusCode, $status, $content)
{
$this->view->disable();
$this->_isJsonResponse = true;
$this->response->setContentType('application/json', 'UTF-8');
$this->response->setStatusCode($statusCode, $status);
$this->response->setJsonContent($content);
$this->response->send();
}
public function getHttpRequest()
{
if($this->request->isPost()||$this->request->isGet()||$this->request->isDelete()||$this-
>request->isPut())
{
return $this->request->getJsonRawBody();
}
else {
return null;
}
}
Within control layer, we built seven controllers. Each controller has their own responsibility.
ControllerBase and ErrorController has already discussed in previous paragraph. Now, we
will talk about the other controllers. Expertusercontroller and LoginController are mainly
used for handling expert user login and expert user data querying. ProjectController is used to
control the creation of visualization project as well as query relevant data of
project.VersionController is mainly responsible for controlling the features of adding, saving
versions of visualization of project meanwhile handle any data query about version of project.

41
4.4.3. Model Layer
All classes in model layer are built based on table of databases. These classes are responsible
for running corresponding SQL statement and querying data from databases. The functions of
model layer class can be directly called in control layer. Once controllers obtain request from
client, they will call those functions which are defined in the model layer. Before creating
model, we have to make sure that connection of database is set up already. In Phalcon,
databases connection is generally set up at index page. Here are code snippets showing how
connection can be set up.
$di = new Phalcon\DI\FactoryDefault();
$di->set('db', function(){
return new \Phalcon\Db\Adapter\Pdo\Mysql(array(
"host" => "localhost",
"username" => "root",
"password" => "shen900824",
"dbname" => "db"
));
});
Once database connection has been set up, we can build models based on the database. As we
discussed in section of 3.5.1, five tables are created in database. It means that five
corresponding models are required to build in model layer. We should notice that if we use
Phalcon to build model, the name of model has to be same with the name of table. About
method of creating query statement in model layer, Phalcon provide developers with PHQL,
which allows us to write queries based on object-oriented SQL. In this system, all queries are
written based on PHQL. We will provide another piece of code to illustrate how PHQL works
for querying all version data.
public function getAllVersions($pid)
{
$version= new Version();
$query = "SELECT version.* from version WHERE version.PROJECT_ID= '$pid';";
$result = new Resultset(null, $version, $version->getReadConnection()-
>query($query));
if($result)
{
return $result->toArray();
}
else {
return null;
}

42
}
4.4. Databases
In this system, a relational database is maintained on server. In this section, we focus on
illustrating the detail of each table.
Table 6 Detail of project Table
Table 7 Detail of version Table
Table 8 Detail of hasbasedversion Table
Table 9 Detail of expert Table
Table 10 Detail of script Table

43
Chapter 5. Evaluation
This chapter mainly outlines the evaluation of implemented system. Visualisation of Kaggle
Yelp Test Business Data Set, which is made by Dublin Data Visualisation Meetup Group (),
is selected as tested coordinated visualization. Several participants are recruited to attend
experiment. In the experiment, and require to complete tasks by using implemented system.
Tasks are defined based three scenarios, single general user scenario, single expert scenario
and collaboration scenario. Once experiment is done, we need collect feedback about
functionality and usability of system from participants. According to feedback, we can
determine whether system can met the requirements.
5.1. Evaluation Approach
Evaluation of implemented system is based on task driven experiment. Participants are
required to complete tasks which are listed in Appendix A. Main goal of tasks are determine
if system:
1. Enable expert users to explore coordinated visualization while record exploration steps,
add corresponding narrative guidance and script steps.
2. Enable expert users to share the script with others users
3. Enable general users to replay exploration steps and allow them further exploration
4. Enable expert users to replay exploration steps which are shared by other expert, and
append any further exploration steps with new narrative guidance to existing exploration
script.
5. Enable visualization author to pause creation of exploration steps, then resume where
they left off.
6. Enable other expert users to append further steps on existing exploration of visualization.
7. Enable users to find out original and extended version of visualization script.
Five participants attended in these experiments. Due to tasks relate to collaboration working
all participants are organised together to complete the task. Participants are recruited by email

44
and phone call. Duration of experiment is about 30 minutes. All of five participants use their
laptops and any web browser to access tested visualization pages. The IP address of tested
web page is mentioned to participants before experiment. In addition, quick video tutorial is
provided in order to make sure tester understand how to operate system. In the experiment,
each participant is required to act the roles of general user and expert and complete single and
collaboration tasks. The expert user’s accounts are prepared for all percipients in advance.
Whole process of testing is observed by organiser. At the end of experiment, each participant
is required to fill in a paper based questionnaire. The questionnaire provides us with feedback
about functionality and usability of system. The detail of questionnaire is mentioned in
Appendix B. The result of observation and questionnaire are analyse and discussed in the
next section.
5.2. Evaluation Analysis
In this section, we focus on analysing and discussing the results of experiment. The analysis
of result is divided into two parts. One focuses on discussing the outcome of observation.
One focuses on analysing the feedback of questionnaire.
5.2.1. Observation
According to results of observation, system can be used to complete all tasks as required.
System does not appear any obvious crash when participants are doing test tasks. Data
communication between client and server works normally without latency. When participants
are doing general users tasks, they can quickly open existing exploration script and replay it
step by step. The narrative guidance for each step is displayed and participants can easily find
out the narrative on the screen. Once replay is done, participants can do further exploration
on visualization. When participants are doing expert user task, they can normally create
visualization exploration script with narrative guidance. Then, data can be sent to server and
web browser can give proper reactions to users. When users prepare reconstruct exploration,
visualization script is run to the step where author left off, and then users are allowed to
append further exploration based on the original one. When participants are doing
collaboration tasks, the participants, who act role of expert, can normally append new
exploration step and save as new version. In addition, as we observed, system works well
when multiple users append to one original script.
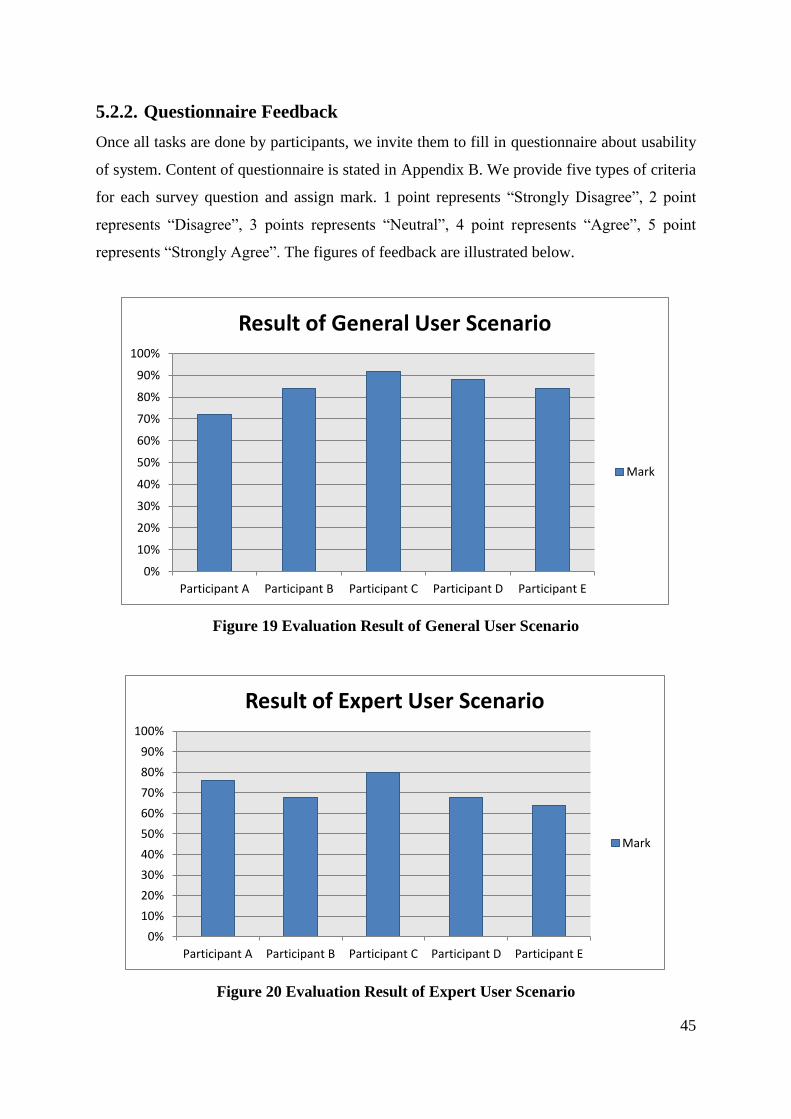
45
5.2.2. Questionnaire Feedback
Once all tasks are done by participants, we invite them to fill in questionnaire about usability
of system. Content of questionnaire is stated in Appendix B. We provide five types of criteria
for each survey question and assign mark. 1 point represents “Strongly Disagree”, 2 point
represents “Disagree”, 3 points represents “Neutral”, 4 point represents “Agree”, 5 point
represents “Strongly Agree”. The figures of feedback are illustrated below.
Figure 19 Evaluation Result of General User Scenario
Figure 20 Evaluation Result of Expert User Scenario
0%
10%
20%
30%
40%
50%
60%
70%
80%
90%
100%
Participant A Participant B Participant C Participant D Participant E
Result of General User Scenario
Mark
0%
10%
20%
30%
40%
50%
60%
70%
80%
90%
100%
Participant A Participant B Participant C Participant D Participant E
Result of Expert User Scenario
Mark

46
Figure 21 Evaluation Result of Collaboration Scenario
Figure 22 Evaluation Result of Usability of System
5.2.3. Result Discussion
The aim of this project is to find out approach to support both of expert users and general
users and enable them to understand exploration process when they are using coordinated
visualization systems to drill down detail of dataset. Based on approach which is concluded
0%
10%
20%
30%
40%
50%
60%
70%
80%
90%
100%
Participant A Participant B Participant C
Result of Collboration Scenario
Mark
0%
10%
20%
30%
40%
50%
60%
70%
80%
90%
100%
Participant A Participant B Participant C Participant D Participant E
Result of Usability of System
Mark

47
by (Heer et al. 2012), we design and implement web based supporting system which allow
user to record, annotate, share , replay and re-append exploration steps of visualization.
According the observation, we can see that implemented system enables to normally
complete all tasks from three scenarios. All tasks in scenarios based on requirements analysis
of system. Thus, we can consider that system enable to satisfied requirements which enable
users to capture events of coordinated visualization, script and sequence captured events with
narrative annotation, share scripts with other users and replay and append scripts of
exploration. According to feedback figure from questionnaires, we notice that five
participants satisfied with functionality and usability of system when they act role of general
user. The average mark in that scenario is around 84%. When participants are acting as
experts and doing collaboration tasks, one of participants feel little difficult to use system
especially the function of recording visualization steps and appending new steps to existing
script. On the whole, all participants feel that system is easy to use and the speed of reaction
of system is accepted. In addition, they feel that error prevention and error notification work
well in system. However, one of participant feels that system has fewer hints on the user
interface. Whole process of experiment works well, but one shortcoming of this evaluation is
size of participants. Due to this project related to collaboration working environment. Large
scale of participants can persuasively prove that system has scalability to handle more users
and more data.

48
Chapter 6. Conclusions
6.1. Conclusion
This project focuses on research, design, implementation and evaluation of system which is
mainly used for assisting users to drill down coordinated visualization. According to (Heer et
al. 2012), the challenges of developing a supporting tool for visualization system can be
divided into four parts. Firstly, supporting system is required to record and capture
exploration steps of coordinated visualization. Secondly, system enables to add annotations.
Thirdly, system allows users publish and share their finding and exploration. Fourthly,
system is required to replay exploration steps in order to guide other users. According to
conclusion of challenges and research questions of this project, we start researching
background knowledge and trying to find out possible approaches to address challenges. We
decide main features of system though comparing similar systems with desire system. At the
stage of design, we start analysing detail of functional and non-functional requirements of
system. Then we design architecture of system which based on client-server model and
outline methods of recording and scripting exploration steps, creating narrative guidance,
sharing exploration script and replaying exploration script. In order to support the feature of
sharing and publishing exploration script, we also design persistent storage on the server for
maintaining all shared data. According to the design, a completed system is implemented.
Then, we define two types of use cases scenarios based on the role of users in order to prove
that system enables to record, script steps of exploration of coordinated visualization, add
annotation, sharing script of exploration and replaying script with annotation. According to
the analysis result of experiment, we can make sure that the implemented system enables to
handle functionalities of recording, replaying, scripting, annotating and sharing. And not only
that, system allows expert append new steps with narrative guidance to existing exploration
script without losing original data and support expert to stop recording exploration step, then

49
resume recording where authors left off. In addition, system has capability to allow user to
find out original and extended version of visualization project.
6.2. Future work
6.2.1. Availability of System
This system aims at supporting the coordinated visualizations which are built on web
platform and DC.js library. we refactor DC.js in order to make sure the events of DC charts
become recordable. In other words, this system is only used for supporting coordinated
visualizations which are built by DC.js. In order to improve the availability of system o that
make it can be used to support more coordinated visualization, we can follow part of concepts
from (Heer et al. 2012). Firstly, we need drill down more coordinated visualization system
not only based on web but also based on other platforms then try to find out approaches to
record and replay exploration steps. Secondly, we need standardize the data format of
exporting and importing in order to make sure server can easily adapted for more front
systems.
6.2.2. Scalability of System
Except availability, we also can improve system in other ways such as scalability. In a scale
of functionality ways, current system is only used to support activities on web based
coordinated visualization after all. We can enhance the functionality of supporting so than
system can be used to support general activities on the general website. For example,
enhanced system enables to guide users to process complex of online payment. Once system
is opened for supporting general website, the number of users will be rapidly increased. Thus,
we also need enhance the scalability of server so that guarantee server and databases can
handle large scale of users.
6.2.3. Security of System
Although, most of data, which is used within currents system, are not privacy, once system
prepares to extend like above section mentioned, security is an inevitable problem. Especially,
when interactive data involve user privacy such as password, bank account number and
identification number, we have to enhance system so that make it has capability to encrypt
and decrypt any sensitive data.

50
Chapter 7. Bibliography
Almeida, L.H., Lourenço, R. a. D.M., Meiguins, B.S., & Meiguins, A.S.G. 2009. WebPrisma:
An Interactive Web-Based Tool for Exploratory Visualization Using Multiple
Coordinated Views. 2009 13th International Conference Information Visualisation:
p.645–650.
Ba, M.L., Senellart, P., & Paristech, T. 2013. Uncertain Version Control in Open
Collaborative Editing of Tree-Structured Documents. : p.27–36.
Bao, F., & Chen, J. 2014. Visual framework for big data in d3.js. 2014 IEEE Workshop on
Electronics, Computer and Applications: p.47–50.
Bostock, M., Ogievetsky, V., & Heer, J. 2011. D3: Data-Driven Documents. IEEE
transactions on visualization and computer graphics 17(12): p.2301–9.
Crossno, P.J., Dunlavy, D.M., & Shead, T.M. 2009. LSAView: A tool for visual exploration
of latent semantic modeling. 2009 IEEE Symposium on Visual Analytics Science and
Technology: p.83–90.
Dörk, M., Carpendale, S., Collins, C., & Williamson, C. 2008. VisGets: coordinated
visualizations for web-based information exploration and discovery. IEEE transactions
on visualization and computer graphics 14(6): p.1205–12.
Heer, B.J., Viégas, F.B., & Wattenberg, M. 2007. Voyagers and Voyeurs : Supporting
Asynchronous Collaborative Visualization. (April): p.87–97.
Heer, J., Shneiderman, B., & Park, C. 2012. Interactive Dynamics for Visual Analysis A
taxonomy of tools that support the fluent and flexible use of visualizations. : p.1–26.

51
Heijs, A. 2007. Requirements for coordinated multiple view visualization systems for
industrial applications. … and Multiple Views in Exploratory Visualization, 2007. …
(Cmv): p.6–9.
Jon Loeliger. 2009. Version Control with Git First Edit. Andy Oram (ed). O’Reilly Media, In.
Keim, D.A., & Society, I.C. 2002. Information Visualization and Visual Data Mining. IEEE
transactions on visualization and computer graphics 8(1): p.1–8.
Kusumasari, T.F., Supriana, I., Surendro, K., & Sastramihardja, H. Collaboration Model of
Software Development. 2011 International Conference on Electrical Engineering and
Informatics 17-19 July 2011, Bandung, Indonesia.
Lin, B., Chen, Y., Chen, X., & Yu, Y. 2012. Comparison between JSON and XML in
Applications Based on AJAX. 2012 International Conference on Computer Science and
Service System (February 1998): p.1174–1177.
Matsui, K., Yamanouchi, M., & Sunahara, H. 2011. A Proposal of Framework for
Information Visualization in Developing of Web Application. 2011 IEEE/IPSJ
International Symposium on Applications and the Internet: p.457–462.
North, C., & Shneiderman, B. 2000. Snap-together visualization: Evaluating coordination
usage and construction. International Journal of Human Computer Studies 26(99):
p.715–739.
Shneiderman, B. 1996. The eyes have it: a task by data type taxonomy for information
visualizations. Proceedings 1996 IEEE Symposium on Visual Languages: p.336–343.
Spinellis, D. 2012. Git. Software, IEEE 29(3): p.100–101.
Subversion, F., Collins-sussman, B., Fitzpatrick, B.W., & Pilato, C.M. 2008. Version Control
with Subversion ( Compiled from r4879 ).
Thai, V., Handschuh, S., & Decker, S. 2008. IVEA : An Information Visualization Tool for
Personalized Exploratory Document Collection Analysis. : p.139–153.

52
Weaver, C. 2004. Building Highly-Coordinated Visualizations in Improvise. IEEE
Symposium on Information Visualization: p.159–166.
Wide, W. 1997. Web-Based Information Visualization. (August): p.52–59.
Ide, Andy. 2013. "PHP just grows & grows" [Accessed May 20, 2014]
Fielding, Roy T.; Gettys, James; Mogul, Jeffrey C.; Nielsen, Henrik Frystyk; Masinter, Larry;
Paul J.; Berners-Lee (June 1999). Hypertext Transfer Protocol -- HTTP/1.1. IETF, RFC
2616.
Zhu, N.Q., 2013. Data Visualization with D3.js Cookbook. Packt Publishing Ltd. Appendix
p:305-313

53
Chapter 8. Abbreviations
Short Term Expanded Term
API Application Programming Interface
MVC Model View Controller
SVG Scaled Vector Graphic
DOM Document Object Model
HTML Hyper Text Markup Language
CSS Cascading Style Sheets
URL Uniform resource locator
RCS Revision Control System

54
Appendix A
Task Description
General User Tasks:
Task 1: Find out the project you want to explore.
Task 2: Replay visualization, and find out the narrative of each step if it exists.
Task 5: Pause visualization at any step
Task 6: Do further exploration
Expert User Tasks:
Task 1: Login
Task 2: Construct new visualization project
Task 3: Share Project
Task 4: Re-open this visualization project and append new exploration step.
Task 5: Replay visualization project (same with general user tasks)
Collaboration Task one (required two participants, one act expert user and the other act
general user)
First step: Expert user creates new visualization project and shares this project
Second step: General user finds out that project based on the name and replay it
Collaboration Task two (required three participants, all of them act expert users)
First step: First expert user one creates new visualization project and shares project
Second step: Second expert user finds out based version project which is created by first
expert and opens it, then appends new steps to this version of project and saves as new
version.
Third step: Third expert user finds out based version project which is created by second
expert and opens it, then appends new steps to this version of project and saves as new
version.
Forth step: First expert user finds out versions which are created by second and third expert
respectively, then replays these versions of project respectively.

55
Appendix B
Questionnaire
General user
Strongly
Disagree(1)
Disagree
(2)
Neutral
(3)
Agree
(4)
Strongly
Agree(5)
Is easy to open different versions of project
Is easy to play project step by step
Is easy to start, stop and restart the play of
project
Is easy to find out the narratives for each step
Is easy to refresh visualization
Expert user
Strongly
Disagree(1)
Disagree
(2)
Neutral
(3)
Agree
(4)
Strongly
Agree(5)
Is easy to record events with narrative
Is easy to create and save based version
project
Is easy to share project
Is easy to open different versions of project
Is easy to append new step and save
Collaboration
Strongly
Disagree(1)
Disagree
(2)
Neutral
(3)
Agree
(4)
Strongly
Agree(5)
Can easily find out the versions of project
that are just created and shared by expert
users
Is this project replayed
Can new created and shared version of
project be seen by general users

56
Can new created and shared version of
project be seen by expert user
Can new created and shared version of
project be re-edited and re-saved by expert
user
Usability of System
Strongly
Disagree(1)
Disagree
(2)
Neutral
(3)
Agree
(4)
Strongly
Agree(5)
This system responds too slowly to inputs
The system is easy to control
It takes too long to learn the system
The instructions and prompts are helpful
Error prevention messages are not adequate
I can understand and act on the information
provided by this system.