supporting information targeted eradication of pseudomonas
TRANSCRIPT

1
Supporting Information
A Glycoconjugate-Based Gold Nanoparticle Approach for the
Targeted Eradication of Pseudomonas aeruginosa Biofilms
Chao Zhang,a‡ De-Tai Shi,b,f‡ Kai-Cheng Yan,b,d‡ Adam C. Sedgwick,e Guo-Rong Chen,b
Xiao-Peng He,b Tony D James,d Bing Ye,a* Xi-Le Hub* and Daijie Chenc*
aEmergency Department, Jinan Children’s Hospital, No. 23976 Jingshi Road, Jinan City,
Shandong Province, Jinan, China.
bKey Laboratory for Advanced Materials and Joint International Research Laboratory
of Precision Chemistry and Molecular Engineering, Feringa Nobel Prize Scientist Joint
Research Center, School of Chemistry and Molecular Engineering, East China
University of Science and Technology, 130 Meilong Rd., Shanghai 200237, China.
cSchool of Pharmacy, Shanghai Jiao Tong University, 800 Dongchuan RD. Minhang
District, Shanghai 200240, China.
dDepartment of Chemistry, University of Bath, Bath, BA2 7AY, U.K.
eDepartment of Chemistry, The University of Texas at Austin, 105 E 24th street A5300,
Austin, TX 78712-1224, United States.
fSchool of Materials Science and Engineering, Jingdezhen Ceramic Institute,
Jingdezhen, 333403, China.
‡These authors contributed equally.
Electronic Supplementary Material (ESI) for Nanoscale.This journal is © The Royal Society of Chemistry 2020

2
Table of Contents
1. Experimental ..............................................................................................S3
2. Additional Figures and Tables .....................................................................S7
3. Additional References ...............................................................................S12

3
S1. Experimental
General Information and Protocols. All purchased reagents were analytical grade and
used as received. Hydrogen tetrachloroaurate (III) hydrate (HAuCl4·XH2O, 99.9%-Au)
was purchased from J&K Chemical. Trisodium citrate was purchased from J&K
Chemical. Ceftazidime was purchased from J&K Chemical. Proteins including UEA-1
(Ulex European Agglutinin 1), PNA (Peanut Agglutinin), LcA (Lens culinaris Lectin), SBA
(Soybean Agglutinin), Con A (Conconvalin A), WGA (Wheat Germ Agglutinin), BSA
(Bovine Serum Albumin) and PeP (Phospholipid Exchange Protein) were purchased
from Sigma-Aldrich P. aeruginosa strain (ATCC 27853, ATCC BAA2110), E. coli (ATCC
25922) and MRSA (ATCC 43300) were obtained from the American Type Culture
Collection (ATCC). UV-Vis absorption measurements were performed on a Varian Cary
500 UV−Vis spectrophotometer. Fluorescence analysis was performed using a Varian
Cary Eclipse fluorescence spectrophotometer. Dynamic Light Scattering (DLS) analysis
was carried out using a Horiba LB-550 Dynamic Light Scattering nano-analyzer.
Fluorescence bacteria imaging was achieved using a Nikon AIR Confocal Laser-
Scanning Microscope equipped with a 100x oil-immersion objective lens.
Synthetic procedure of Fuc-AuNP/Gal-AuNP. Cyclooctyne disulfide Cyc-S, azido
fucoside (Fuc-N), and azido galactoside (Gal-N) were obtained using a previously
reported procedure.1 AuNPs were prepared by adding trisodium citrate solution (38.8
mM, 5 mL) to an aqueous solution of HAuCl4 (0.29 mM, 50 mL) that was stirring under
reflux at 140 °C. The mixture was stirred under reflux for an additional 10 min and
then cooled to room temperature, to obtain a red solution (AuNP). Subsequently, 10
mL of the freshly prepared AuNP solution was added to an aqueous solution of
cyclooctyne disulfide Cyc-S (100 μM, 100 μL) and an aqueous solution of Fuc-N (100
μM, 100 μL) or Gal-N (100 μM, 100 μL). The mixture was stirred at 40 °C for 4 h, then
centrifuged at 8000 rpm for 15 min. The supernatant was removed to afford a residual
solid product, which was re-dispersed in Tris-HCl buffer solution (20 mL, 0.01 M, pH
7.4). This process was repeated for three times to remove excessive reactants. The
concentration of Fuc-AuNP or Gal-AuNP was determined as 0.8 nM via a previously
established method (Anal. Chem. 2007, 79, 4215-4221). Finally, Fuc-AuNP and Gal-
AuNP were used directly in the following experiments.

4
Lectin Binding and Dynamic Light Scattering analysis. Freshly prepared Fuc-AuNP (0.2
nM) solution was added to a cuvette for UV-Vis absorption and Dynamic Light
Scattering (DLS) measurements. Then, different amounts of UEA-1 (Ulex European
Agglutinin 1, (0.01, 0.03, 0.05, 0.1, 0.2 μM)) dissolved in Tris-HCl buffer solution (0.01
M, pH 7.4) was added to the Fuc-AuNP solution and the UV-Vis absorption and DLS
measurements were conducted. Similarly, the freshly prepared Gal-AuNP solution
(0.2 nM) was measured UV-Vis absorption with the addition of PNA (Peanut
Agglutinin). For confirming protein-selectivity, UEA-1, PNA, and several common
proteins including LcA (Lens culinaris Lectin), SBA (Soybean Agglutinin), Con A
(Conconvalin A), WGA (Wheat Germ Agglutinin), BSA (Bovine Serum Albumin), and
PeP (Phospholipid Exchange Protein) (0.05 μM), were dissolved in Tris-HCl buffer
solution (0.01 M, pH 7.4) and added to 0.2 nM Fuc-AuNP/Gal-AuNP respectively, and
UV-Vis changes before and after protein addition were obtained.
High-Resolution Transmission Electron Microscope. A drop of the sample was placed onto 200 mesh holey carbon copper grids. Then, the images were recorded with JEOL 2100 equipped with a Gatan Orius charged-coupled device camera and Tridiem energy filter operating at 200 kV. The three samples: AuNP (0.02 nM), Fuc-AuNP (0.02 nM), and Fuc-AuNP + UEA-1 (Fuc-AuNP = 0.02 nM, UEA-1 = 0.02 μM). Gal-AuNP and Gal-AuNP + PNA were tested using the same procedure.
Procedures for CAZ loading onto Fuc-AuNP/Gal-AuNP and the evaluation of Reactive Oxygen Species (ROS) production. A solution of either Fuc-AuNP or Gal-AuNP (0.8 nM) was added to an aqueous solution of Ceftazidime (32 μg/mL). The combined mixture was stirred at room temperature for 4 h and centrifuged at 10000 rpm for 5 min. The supernatant was removed to afford residual solid products, which were washed with Tris-HCl buffer. After washing, the products were respectively re-dispersed in Tris-HCl buffer (0.01 M, pH 7.4) to obtain Fuc-AuNP@CAZ and Gal-AuNP@CAZ (Fuc-AuNP/Gal-AuNP = 0.8 nM, CAZ = 8 μg/mL). For ROS testing, dihydrorhodamine-123 (DHR123) was used as the ROS fluorescent probe. Fuc-AuNP (0.2 nM) was accumulated by UEA-1 (0.2 μM), and then DHR123 (6 μM) was added. The sample was subjected to light irradiation (600 nm, 1 W cm-2) for 90 min, and the fluorescence was measured every 15 minutes with an excitation of 485 nm.
Raman Spectroscopy. Raman spectra of each sample was obtained using a Renishaw In Via Reflex Raman system (Renishaw plc, Wotton-under-Edge, UK) equipped with a
5
grating spectrometer, Peltier-cooled charge-coupled device detector coupled to a confocal microscope. The raw data was then processed with Renishaw WiRE 3.2 software. The Raman scattering was excited by an argon ion laser (I = 514.5 nm). Samples tested: AuNP (0.2 nM), Fuc-AuNP (0.2 nM), and Fuc-AuNP@CAZ (0.2 nM and 2 μg/mL). Gal-AuNP and Gal-AuNP@CAZ were tested using the same procedure.
Bacteria Culture. A monocolony of P. aeruginosa strain (ATCC 27853, ATCC BAA2110)
E. coli (ATCC 25922) and MRSA (ATCC 43300) on Luria-Bertani (LB) agar plate were
transferred to LB culture medium (20 mL) and grown at 37°C for 12 h, followed by the
dilution using LB medium to a density of 106 cfu/mL. The bacteria sample was used in
the following procedures.
Fluorophore-Loading of Fuc-AuNP/Gal-AuNP and Fluorescence imaging by Confocal
Laser-Scanning Microscope (CLSM). Fuc-AuNP or Gal-AuNP (0.8 nM) was mixed with
a solution of dicyanomethylene 4H-pyran (DCM)2 (10 μM) for 4 h, then centrifuged at
10000 rpm for 5 min, washed with Tris-HCl buffer, re-dispersed, to obtain Fuc-
AuNP@DCM or Gal-AuNP@DCM (Fuc-AuNP/Gal-AuNP = 0.8 nM, DCM = 4 μM). 106
cfu/mL P. aeruginosa fluid was incubated with Fuc-AuNP@DCM (0.2 nM and 1 μM)
for 30 min. For the competition assay, free L-fucose (10 mM) was pre-incubated with
P. aeruginosa fluid at 37 °C for 30 min, before the incubation of Fuc-AuNP@DCM.
After incubation, the suspensions of the two groups were centrifuged at 8000 rpm for
5 min, and the supernatants were removed. The bacteria of two groups were washed
for three times by PBS buffer, suspended in pure water, placed (100 μL each) onto two
microscope slides and dried at room temperature, respectively. CLSM images were
obtained using a Nikon AIR Confocal Laser-Scanning Microscope equipped with a 100x
oil-immersion objective lens. The excitation and emission wavelengths are at 460 nm
and 600-640 nm, respectively. Then, Gal-AuNP@DCM was similarly used for imaging
P. aeruginosa with or without pre-incubation of free D-galactose as discussed above.
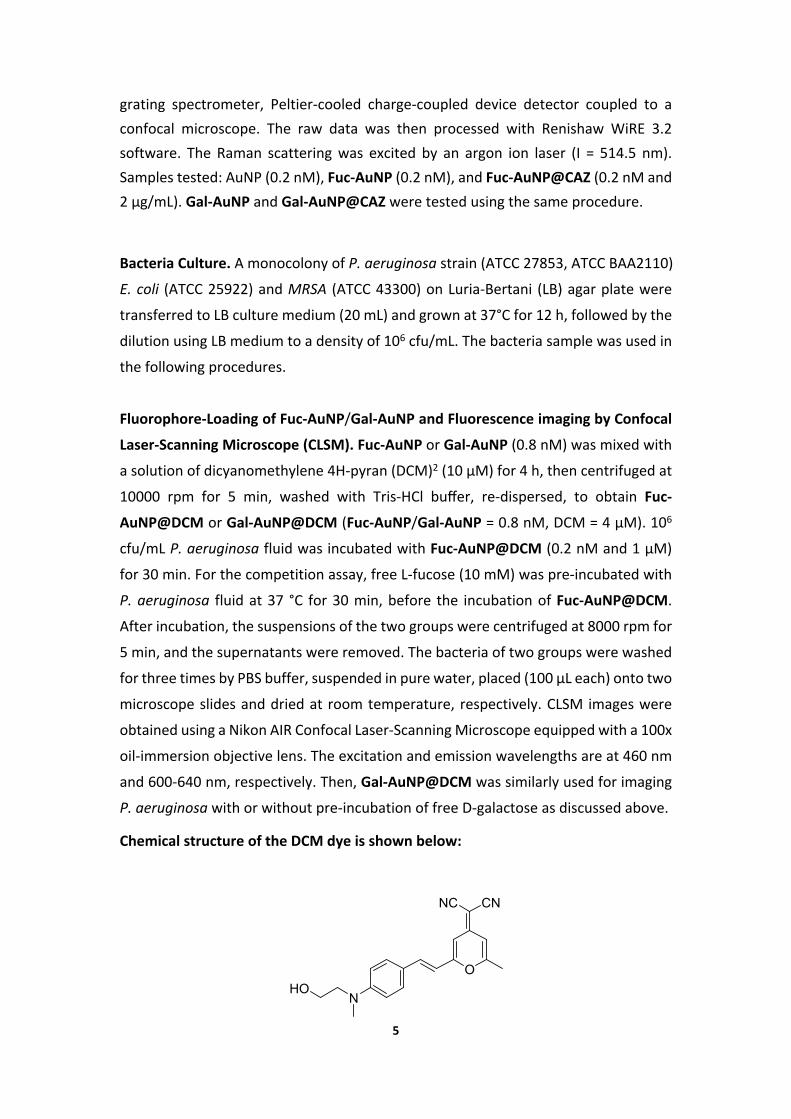
Chemical structure of the DCM dye is shown below:
O
CNNC
NHO

6
In vitro Bacteria Viability Test. In two 96-well plates, 106 cfu/mL P. aeruginosa strain
(ATCC 27853, ATCC BAA2110), E. coli (ATCC 25922) or MRSA (ATCC 43300) fluid was
added to each well and treated with: Fuc-AuNP@CAZ (0.2 nM and 2 μg/mL), Fuc-
AuNP (0.2 nM), Ceftazidime (2 μg/mL), and sterile water (control). One 96-well plate
was irradiated under 600 nm light (1 W cm-2) for 30 min, and another plate was placed
in the dark for 30 min. Both plates were put in an incubator (37°C) in dark for 3 h. After
incubation, the mixtures were further diluted to 101, 102, 103, 104, and 105 times by
sterile water. For viability testing, diluents of each group with different diluting times
(103, 104, and 105) were all dropped on one LB (Luria-Bertani) agar plate for three
times (5 μL for each drop), and incubated at 37°C for 18 h. Then, the numbers of
average colony forming units (CFUs) and the standard deviations (between three
repetitions) of 104 dilution groups were counted and calculated. Defining negative
control group as 100% viability, average CFUs of all groups were transferred to relative
bacterial viabilities, along with errors calculated from standard deviations. Other
drops of 103 or 105 dilution groups were used to confirm result accuracy. For whole-
plate culturing, the above diluent (104 dilution times, 100 μL) of each group was
respectively spread onto one individual LB agar plate by spread plate method, then all
the plates were incubated at 37°C for 18 h. Photographs of the plates were taken. Gal-
AuNP@CAZ and Gal-AuNP were tested using the same procedure.
The Inhibition of Biofilms Formation.
PROCEDURE:
(1) Preparation of Precultures and Biofilms Growth.3
(2) Treatment of Biofilms. To the established P. aeruginosa biofilms on glass slides,
sterile water (100 μL, control), Ceftazidime (32 μg/mL),1 Fuc-AuNP@CAZ (0.2 nM and
32 μg/mL), and Gal-AuNP@CAZ (0.2 nM and 32 μg/mL) were added. Slides treated
with Fuc-AuNP@CAZ or Gal-AuNP@CAZ were subjected to continuous light
irradiation (600 nm, 1 W cm-2) for 30 min, the additional slides were placed into dark
for 30 min along with control and Ceftazidime groups. After this procedure, each slice
was further incubated for 24 h at 37 °C. To the established P. aeruginosa biofilms on
steel surface, Fuc-AuNP@CAZ (0.2 nM and 32 μg/mL) and Gal-AuNP@CAZ (0.2 nM
and 32 μg/mL) were added respectively. The two groups were then subjected to the
same procedure as above.
(3) Staining of Biofilms. For each group, 20 μL of staining solution (Syto9: 14 μM and
PI: 83 μM) was added onto the glass/steel slice directly to achieve a final concentration
7
of 1.4 μM of Syto9 and 8.3 μM of PI. Each slice was placed inside the wells of a well-
plate and the well-plates were covered with a fresh air-permeable foil, then the well-
plates were placed into the incubator and incubated for 12 h at 37 °C before imaging.
(4) Microscopy.2
(5) Data Analysis. The different proportions of blue (live bacteria) and yellow (dead
bacteria) biovolumes were calculated from the analyzed imaging stacks.
S2. Additional Figures and Tables
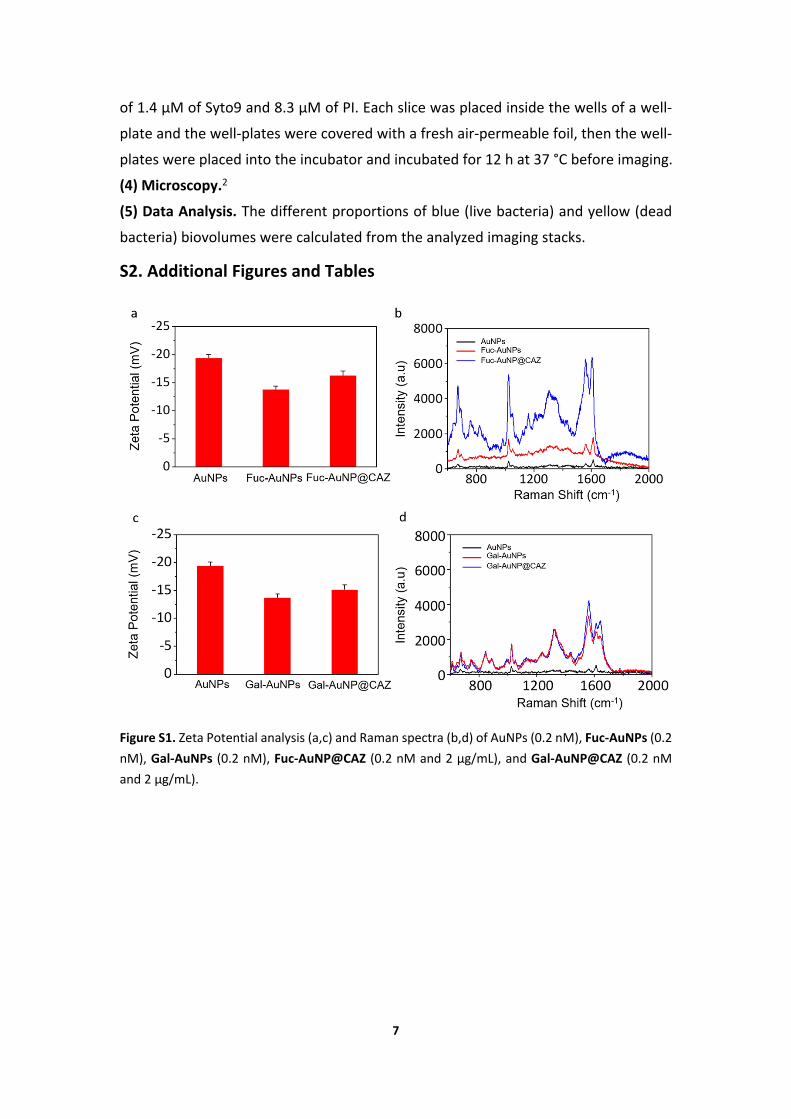
Figure S1. Zeta Potential analysis (a,c) and Raman spectra (b,d) of AuNPs (0.2 nM), Fuc-AuNPs (0.2 nM), Gal-AuNPs (0.2 nM), Fuc-AuNP@CAZ (0.2 nM and 2 μg/mL), and Gal-AuNP@CAZ (0.2 nM and 2 μg/mL).

8
Figure S2. Plotting the UV-vis absorbance changes of 0.2 nM Fuc-AuNPs (a) and Gal-AuNPs (b) as a function of UEA-1 (0-0.05 μM) and PNA (0-0.05 μM) concentration for the determination of the limit of detection (3σ/k).
Figure S3. High-Resolution Transmission Electron Microscope (HR-TEM) images: (a) AuNPs (0.02 nM) (b) Gal-AuNPs (0.02 nM) (c) Gal-AuNPs (0.02 nM) + PNA (0.02 μM). Dynamic Light Scattering (DLS): (d) AuNPs (0.2 nM) (e) Gal-AuNPs (0.2 nM) (f) Gal-AuNPs (0.2 nM) + PNA (0.05 μM).

9
Figure S4. Dynamic Light Scattering (DLS) analysis: (a) AuNPs (0.2 nM), Fuc-AuNPs (0.2 nM), and Fuc-AuNPs (0.2 nM) with the addition of different concentrations of UEA-1 (0.01-0.2 μM). (b) AuNPs (0.2 nM), Gal-AuNPs (0.2 nM), and Gal-AuNPs (0.2 nM) with the addition of different concentrations of PNA (0.01-0.2 μM).
Figure S5. Plotting the Zeta Potential (a) and Dynamic Light Scattering (DLS) (b) analysis of Fuc-AuNP@CAZ (0.2 nM and 2 μg/mL) or Gal-AuNP@CAZ (0.2 nM and 2 μg/mL) stored in dark during 8-day period.

10
Figure S6. The change in fluorescence emission intensity at 540 nm (dihydrorhodamine, 6 μM) with increasing light irradiation time (600 nm, 0-90 min, 1 W cm-2). (a) Fuc-AuNPs (0.2 nM) with and without UEA-1 (0.2 μM) (b) Gal-AuNPs (0.2 nM) with and without PNA (0.2 μM) . Change in UV-Vis absorbance at 650 nm (c) pH; (d) Temperature. Experiments were carried out using 0.2 nM Fuc-AuNPs or Gal-AuNPs and 0.5 mM TMB in Tris-HCl buffer solution (0.01 M, pH 4) and the resultant solution was irradiated with light (30 min, 600 nm, 1 W cm-2).
Figure S7. (a) IR thermal images of EP tube solutions of AuNPs (0.2 nM), Fuc-AuNP@CAZ (0.2 nM and 2 μg/mL), and Fuc-AuNP@CAZ + UEA-I (Fuc-AuNP@CAZ = 0.2 nM and 2 μg/mL, UEA-I = 0.1 μM) under light irradiation (600 nm, 1 W cm-2, 4 min). (b) Temperature changes of the EP tube solutions monitored by the IR thermal camera during irradiation.

11
0 50 100 150 200 250 300 350 40020
25
30
35
40
45
50
55 Fuc-AuNP@UEA-1 Gal-AuNP@PNA
Tem
pert
ure
(o C)
Time (s)
Figure S8. Temperatures of Fuc-AuNP@UEA-1 and Gal-AuNP@PNA solutions as a function of laser irradiation time. The photothermal conversion efficiency of Fuc-AuNP and Gal-AuNP at 600 nm were calculated to be 26.2% and 25.7% respectively.
Figure S9. (a) IR thermal images of EP tube solutions of UEA-1 (0.1 μM) and Fuc-AuNP@CAZ (0.2 nM and 2 μg/mL) bound to P. aeruginosa (ATCC 27853) (b) Overall temperature changes of the EP tube solutions that were monitored by the IR thermal camera during light irradiation.
12
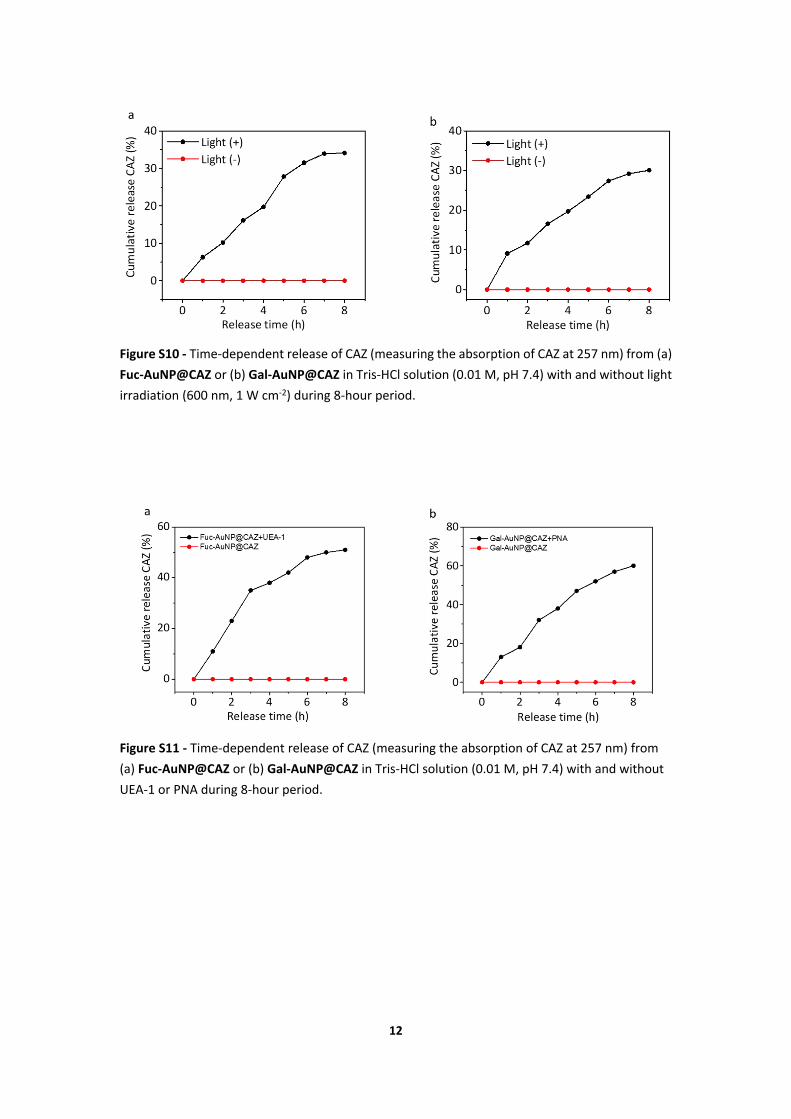
Figure S10 - Time-dependent release of CAZ (measuring the absorption of CAZ at 257 nm) from (a) Fuc-AuNP@CAZ or (b) Gal-AuNP@CAZ in Tris-HCl solution (0.01 M, pH 7.4) with and without light irradiation (600 nm, 1 W cm-2) during 8-hour period.
Figure S11 - Time-dependent release of CAZ (measuring the absorption of CAZ at 257 nm) from (a) Fuc-AuNP@CAZ or (b) Gal-AuNP@CAZ in Tris-HCl solution (0.01 M, pH 7.4) with and without UEA-1 or PNA during 8-hour period.
13
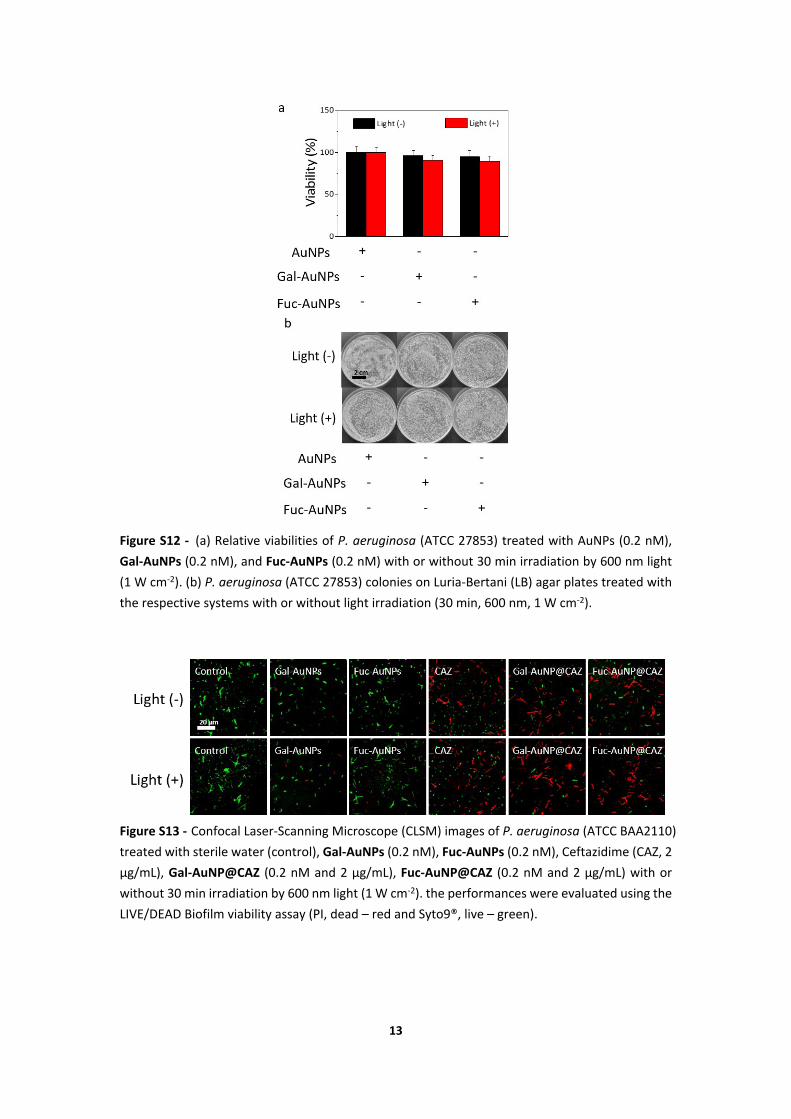
Figure S12 - (a) Relative viabilities of P. aeruginosa (ATCC 27853) treated with AuNPs (0.2 nM), Gal-AuNPs (0.2 nM), and Fuc-AuNPs (0.2 nM) with or without 30 min irradiation by 600 nm light (1 W cm-2). (b) P. aeruginosa (ATCC 27853) colonies on Luria-Bertani (LB) agar plates treated with the respective systems with or without light irradiation (30 min, 600 nm, 1 W cm-2).
Figure S13 - Confocal Laser-Scanning Microscope (CLSM) images of P. aeruginosa (ATCC BAA2110) treated with sterile water (control), Gal-AuNPs (0.2 nM), Fuc-AuNPs (0.2 nM), Ceftazidime (CAZ, 2 μg/mL), Gal-AuNP@CAZ (0.2 nM and 2 μg/mL), Fuc-AuNP@CAZ (0.2 nM and 2 μg/mL) with or without 30 min irradiation by 600 nm light (1 W cm-2). the performances were evaluated using the LIVE/DEAD Biofilm viability assay (PI, dead – red and Syto9®, live – green).

14
Figure S14 - HR-TEM images of P. aeruginosa: (a) untreated, (b) Fuc-AuNPs (0.2 nM) incubated for 3 h, (c) Fuc-AuNP@CAZ (0.2 nM and 2 μg/mL) with 30 min irradiation by 600 nm light and incubated for 3 h. Arrows indicate AuNPs.
Figure S15 - Relative viabilities of (a) E. coli (ATCC 25922) and (b) Methicillin-Resistant S. aureus (ATCC 43300) treated with sterile water (control), Ceftazidime (CAZ, 2 μg/mL), Fuc-AuNPs (0.2 nM), Gal-AuNPs (0.2 nM), Fuc-AuNP@CAZ (0.2 nM and 2 μg/mL), and Gal-AuNP@CAZ (0.2 nM and 2 μg/mL) with or without 30 min irradiation by 600 nm light (1 W cm-2). (c) E. coli (ATCC 25922) and (d) Methicillin-Resistant S. aureus (ATCC 43300) colonies on Luria-Bertani (LB) agar plates treated with the respective systems with or without light irradiation (30 min, 600 nm, 1 W cm-2).

15
Figure S16 - Viability of MDA-MB-231 and 293T cell lines in the absence and presence of (a) Fuc-AuNPs (0.2-1.0 nM) or (b) Gal-AuNPs (0.2-1.0 nM).
S3. Additional References
1. X.-L. Hu, L. Chu, X. Dong, G.-R. Chen, T. Tang, D. Chen, X.-P. He and H. Tian, Adv.
Funct. Mater., 2019, 29, 1806986.
2. H.-Y. Yang, J.-J. Zhang, Y. Zang, H.-Y. Zhang, J. Li, G.-R. Chen, X.-P. He, Dyes Pigm.
2017, 136, 224-228
3. M. Mathias, D.-F. Stefano, R. Ute, H. Susanne, Nat. Protoc., 2010, 8, 1461.