supporting information€¦ · strychnine salts, in particular, the strychnine free base,...
TRANSCRIPT
1
Supporting Information
Desktop NMR for structure elucidation and identification of strychnine adulteration
Kawarpal Singh and Bernhard Blümich
Institute for Technical Chemistry and Macromolecular Chemistry, RWTH Aachen University, Worringerweg 2, D-52074, Aachen, Germany
Corresponding Author:
Kawarpal Singh
Email: [email protected]
Tel: +49 24180 26447
Fax: +49 24180 22185
Abstract:Elucidating the structure of complex molecules is difficult at low magnetic fields due to
the overlap of different peak multiplets and second-order coupling effects. This is even
more challenging for rigid molecules with small chemical shift differences and with
prochiral centers. Since low-field NMR spectroscopy is sometimes presumed as
restricted to the analysis of only small and simple molecules, this paper aims to counter
this misconception: It demonstrates the use of low-field NMR spectroscopy in chemical
forensics for identifying strychnine and its counterions by exploring the chemical shift as
a signature in different 1D 1H and 13C experiments. Hereby the applied methodologies
combined various 1D and 2D experiments such as 1D 1H, 13C, DEPT, and 2D COSY,
HETCOR, HSQC, HMBC and J-resolved spectroscopy to elucidate the molecular
structure and skeleton of strychnine at 1 Tesla. Strychnine was exemplified here,
because it is a basic precursor in the chemistry of natural products and is employed as
a chemical weapon and as a doping agent in sports such as the Olympics. In our study,
the molecular structure of the compound could be identified either with a 1D experiment
at high magnetic field or with HMBC and HSQC experiments at 1 T. In conclusion, low-
field NMR spectroscopy enables the chemical elucidation of the strychnine structure
Electronic Supplementary Material (ESI) for Analyst.This journal is © The Royal Society of Chemistry 2017

2
through a simple click of the computer mouse. In situations where a high-field NMR
spectrometer is unavailable, compact NMR spectrometers can nevertheless generate
knowledge of the structure, important for identifying the different chemical reaction
mechanisms associated with the molecule. Desktop NMR is a cost-effective viable
option in chemical forensics. It can prove adulteration and identify the origin of different
strychnine salts, in particular, the strychnine free base, strychnine hemisulphate and
strychnine hydrochloride. The chemical shift signatures help to look into the chemical
structure of the molecules because of the impact of counterions in the chemical shift of
the protons adjacent to the heteroatoms. This can serve as the methodology for
structure elucidation of complex molecules at lower-magnetic fields.
3
Table of Contents1. Experimental Procedures.....................................................................................................6Results and Discussion ............................................................................................................72. 1D NMR spectroscopy of strychnine ................................................................................72.1. 1D 1H NMR spectrum of strychnine at 9.4 Tesla.........................................................72.2. 1D 13C NMR spectrum of strychnine and strychnine hydrochloride at 9.4 Tesla.........................................................................................................................................................83. 2D NMR spectroscopy of strychnine ................................................................................83.1. 2D HETCOR (Heteronuclear Correlation) spectroscopy ..........................................83.2. 2D HSQC (Homo-nuclear Single Quantum Correlation) Spectroscopy ...............93.3. 2D HMBC (Homo-nuclear Multiple Bond Correlation) Spectroscopy ...................93.4. 2D 1H-1H COSY (Correlation Spectroscopy) ................................................................94. Counterion identification of strychnine with chemical shift as a signature ........164.1. Distinction of strychnine and its counterions in CDCl3..........................................164.1.1. 1D 1H NMR spectroscopy of strychnine and its salts ......................................174.1.2. 1D 13C NMR spectroscopy of strychnine and its salts .....................................184.2. Distinction of strychnine and its salts in CD3OD .....................................................204.2.1. 1D 1H NMR spectroscopy of strychnine and its salts ......................................204.2.2. 1D 13C NMR spectroscopy of strychnine and its salts .....................................234.3. Analysis of strychnine salts dissolved in D2O ..........................................................254.3.1. 1D 1H NMR spectroscopy.........................................................................................254.3.2. 1D 13C NMR spectroscopy .......................................................................................26
4
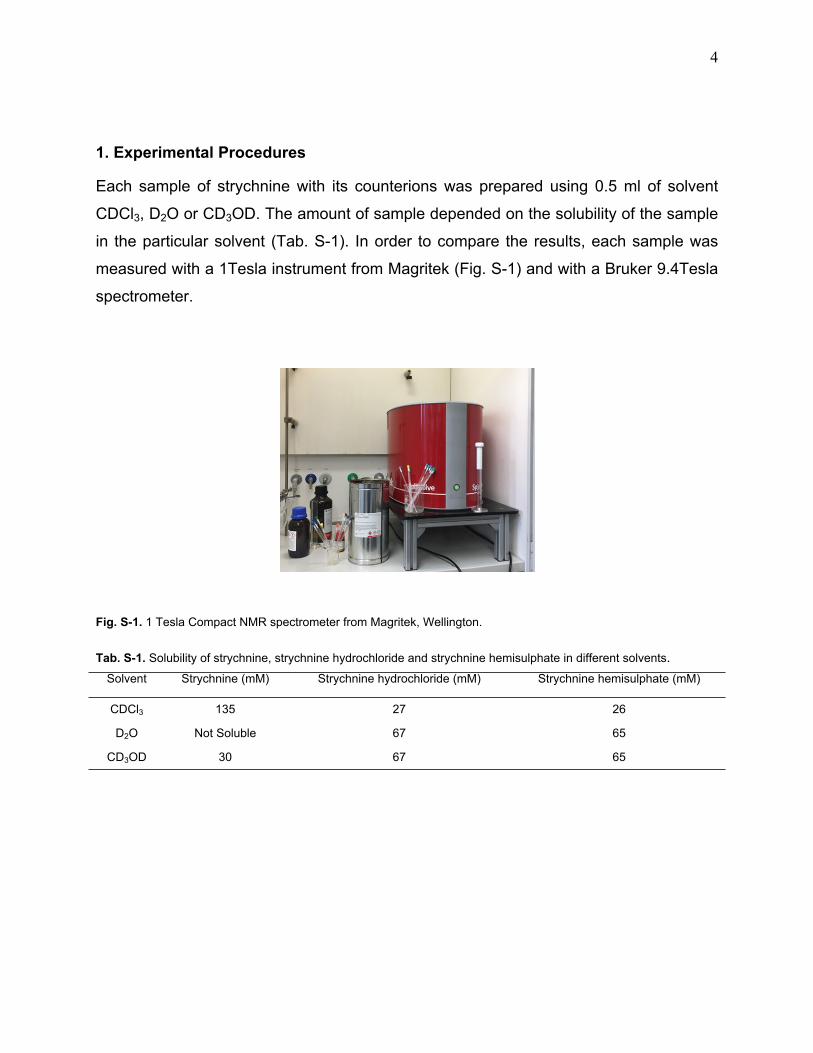
1. Experimental Procedures
Each sample of strychnine with its counterions was prepared using 0.5 ml of solvent
CDCl3, D2O or CD3OD. The amount of sample depended on the solubility of the sample
in the particular solvent (Tab. S-1). In order to compare the results, each sample was
measured with a 1Tesla instrument from Magritek (Fig. S-1) and with a Bruker 9.4Tesla
spectrometer.
Fig. S-1. 1 Tesla Compact NMR spectrometer from Magritek, Wellington.
Tab. S-1. Solubility of strychnine, strychnine hydrochloride and strychnine hemisulphate in different solvents.Solvent Strychnine (mM) Strychnine hydrochloride (mM) Strychnine hemisulphate (mM)
CDCl3 135 27 26
D2O Not Soluble 67 65
CD3OD 30 67 65

5
Results and Discussion
2. 1D NMR spectroscopy of strychnine
2.1. 1D 1H NMR spectrum of strychnine at 9.4 Tesla
A 135 mM solution of strychnine was prepared in CDCl3 and measured at 9.4 Tesla with
16 scans and a repetition time of 5.6 seconds for obtaining a 1D 1H NMR spectrum (Fig.
S-2). All proton peaks were assigned according to the literature.1 Since peaks 17a, 17b,
18a, 18b did not show any clear multiplet structure, it was not possible to find the
coupling constants for these.
Fig. S-2. 1D 1H NMR spectrum of 135 mM of strychnine in CDCl3 obtained at 9.4 Tesla with 16 scans and a repetition time of 5.6 seconds.
2.2. 1D 13C NMR spectrum of strychnine and strychnine hydrochloride at 9.4 Tesla
A 135 mM solution of strychnine and a 27 mM solution of strychnine hydrochloride were
prepared in CDCl3 and measured at 9.4 Tesla with 1024 scans and a repetition time of
1.75 seconds for obtaining a 1D 13C NMR spectrum (Fig. S-3a). All peaks were
assigned according to the literature.1 Clear differences in the chemical shifts of the
peaks belonging to carbons 3, 6, 10, 15, 16, 17, 21 and 22 (Tab. S-2) can be seen.
These differences agree with those determined from the 1D 13C spectrum obtained at 1
Tesla.

6
3. 2D NMR spectroscopy of strychnine
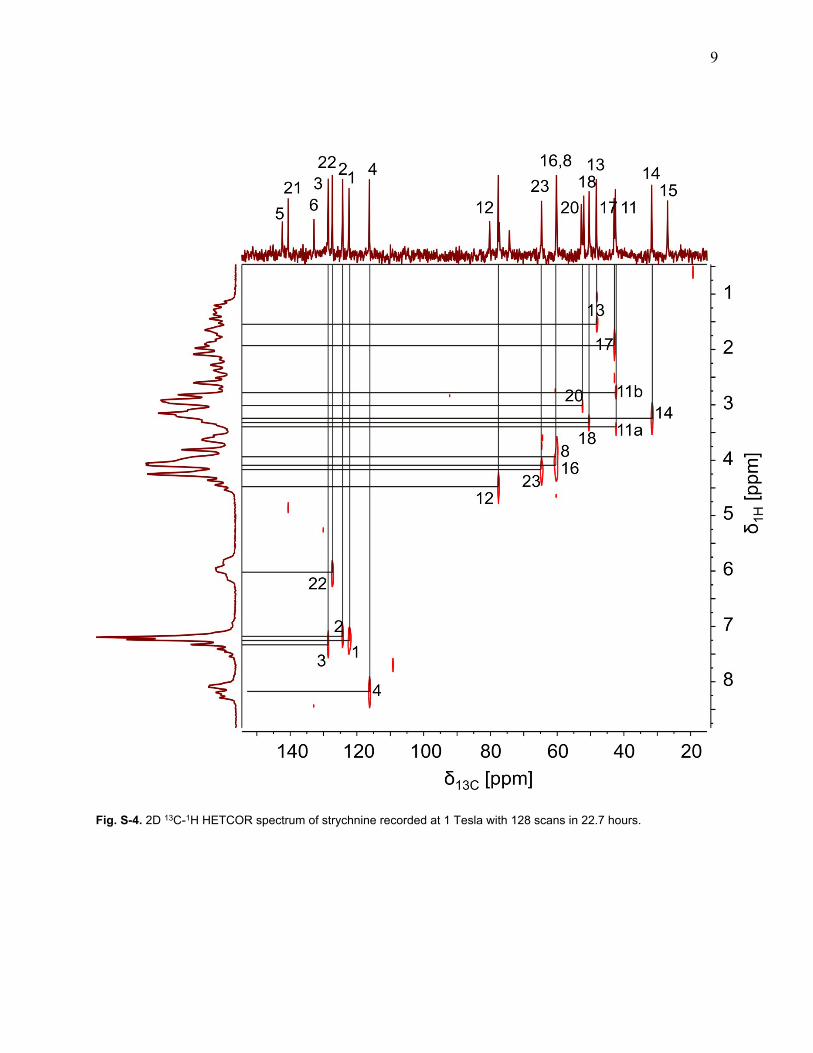
3.1. 2D HETCOR (Heteronuclear Correlation) spectroscopy
In the 2D 13C-1H HETCOR experiment, the transverse 1H magnetization is generated
and transferred to 13C after the evolution time. Thus, 1H-modulated 13C magnetization is
detected. This experiment unravels the resonances of a complex second-order 1D 1H
spectrum by correlating them with the directly attached 13C nucleus. The 2D HETCOR
spectrum (Fig. S-4) of strychnine (135 mM) in CDCl3 was recorded at 1 Tesla with 128
scans for each of the 64 steps in 22.7 hours. Each carbon coupled to protons can be
identified by cross peaks, simplifying the peak assignment in the 1D 1H spectrum. The
peaks of the aromatic protons 1, 2, 3, 4 can be easily correlated with their
corresponding carbon atoms and visualized directly without cumbersome analysis of the
1D 1H spectrum. The diastereomeric protons 11a and 11b can also be distinguished.
The peaks 16 and 8 at the very close chemical shift of 3.94 and 3.86 ppm (Fig. S-2) can
be distinguished although they slightly overlap in the 2D spectrum. Similarly, the other
carbon resonances can be correlated with the corresponding resonances in the proton
spectrum on the other axis.
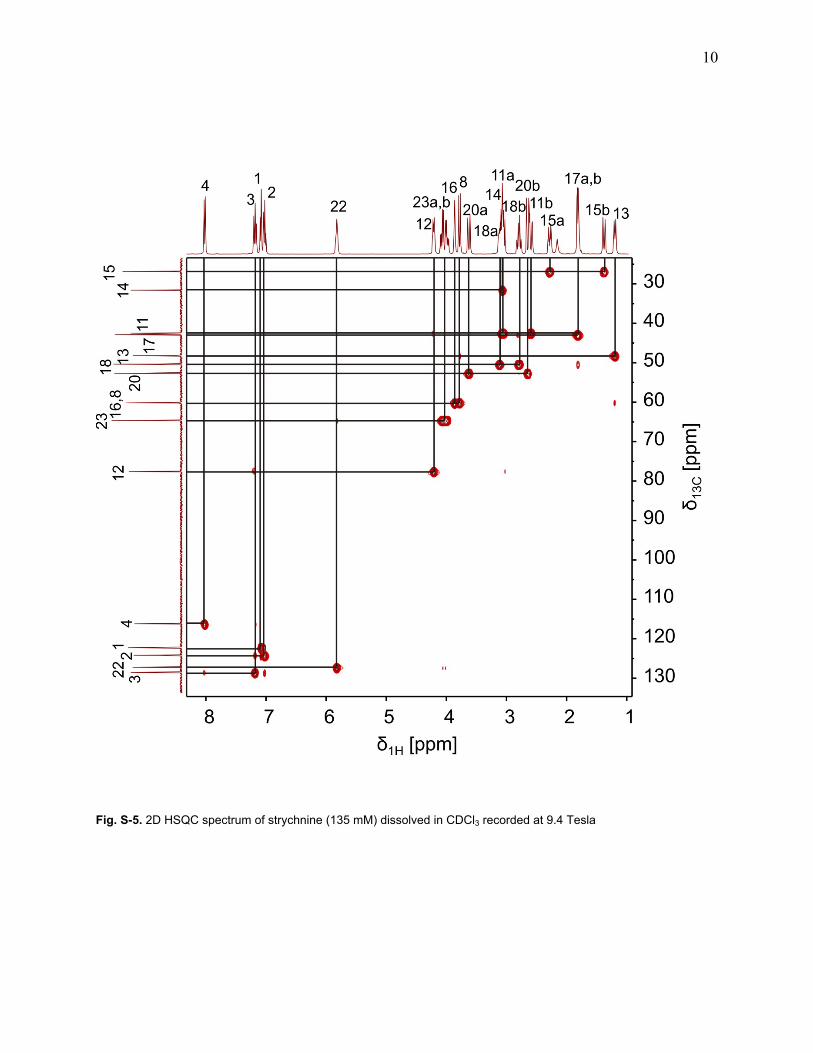
3.2. 2D HSQC (Homo-nuclear Single Quantum Correlation) Spectroscopy
The signal intensity of the 13C-1H HETCOR spectrum is lower than that of the HSQC
spectrum, because 1H-modulated 13C magnetization is detected in the HETCOR
experiment whereas in the HSQC experiment, 13C magnetization is transferred to 1H
and detected indirectly via 1H. The 2D HSQC NMR spectrum of strychnine (Fig. S-5)
was recorded at 9.4 T. The correlation between the different protons and carbons were
observed which confirms the resonance of the nuclei in the 2D HSQC spectrum
obtained at 1 T.

7
3.3. 2D HMBC (Homo-nuclear Multiple Bond Correlation) Spectroscopy
The 2D HMBC experiment provides long-range correlations with non-protonated carbon
atoms. It has the benefit of better elucidating the structures of the chemical groups.
One-bond correlations can provide useful structural information by proton assignments
along with long-range 1H-13C correlations across carbon-carbon linkages, which define
the molecular skeleton. The 2D HMBC NMR spectrum of strychnine (Fig. S-6) was
recorded at 9.4 T. The correlation between the different protons and carbons confirms
the resonances of the nuclei in the 2D HMBC spectrum obtained at 1 T.
3.4. 2D 1H-1H COSY (Correlation Spectroscopy)
In the homonuclear COSY spectrum, both frequency axes contain the same chemical
shift information, and cross peaks arise between coupled spins. The 1H-1H COSY
spectrum of strychnine (Fig. S-7) was measured at 1 Tesla within 38 minutes. The
assignment of resonances based on cross peaks in the COSY spectrum of strychnine
is challenging, generally due to resonance overlap but can be readily accomplished for
the aromatic protons 1,2,3 and 4 because their chemical shifts are in the less crowded
region between 8.5 and 7 ppm. The couplings of proton 22 are distinct because of the
sp2 hybridized carbon atom and its neighboring protons 23a and 23b. They are easy to
identify by means of cross and diagonal peaks. The couplings of proton 12 with protons
11a and 11b were assigned with the aid of the HETCOR experiment in agreement with
the 1H-1H COSY spectrum. Proton 12 has the highest chemical shift followed by proton
22, due to its neighboring electronegative oxygen atom, which deshields proton 12,
shifting its resonance to higher ppm value. The chemical shifts of protons 16 and 8 are
near to those of protons 23a and 23b because of the adjacent N atom. The spin-spin
couplings of proton 16 with protons 15b and 15a lead to the assignment of the latter.
Moreover, the coupling of protons 8 and 13 was found by the spin-spin correlation
revealed in the COSY spectrum. Subsequently, the couplings of proton 15a and 15b
with proton14 were identified. The couplings of protons 18a and 18b with protons 17a
and 17b as well as of 20a with 20b were identified by means of HETCOR and HSQC
spectra. The 1H-1H COSY spectrum recorded at 9.4 Tesla (Fig. S-8) correlates well with

8
the COSY spectrum recorded at 1 Tesla. The combination of HETCOR and HSQC
spectra gives the single-bond correlations, which can be further confirmed and identified
with COSY experiments, whereas multiple bond correlations from the HMBC spectrum
give the linkages of the molecular skeleton.
Fig. S-3. a) 1D 13C NMR spectrum of a) Strychnine (135 mM) b) Strychnine hydrochloride (27 mM) in CDCl3 obtained at 9.4 Tesla with 1024 scans and a repetition time of 1.75 seconds.
9
Fig. S-4. 2D 13C-1H HETCOR spectrum of strychnine recorded at 1 Tesla with 128 scans in 22.7 hours.
10
Fig. S-5. 2D HSQC spectrum of strychnine (135 mM) dissolved in CDCl3 recorded at 9.4 Tesla

11
Fig. S-6. 2D HMBC NMR spectrum of strychnine measured at 9.4 Tesla.

12
Fig. S-7. 2D 1H-1H COSY spectrum of strychnine measured in 38 minutes at 1 Tesla.

13
Fig. S-8. 2D 1H-1H COSY spectrum of strychnine measured at 9.4 Tesla.
4. Counterion identification of strychnine with chemical shift as a signature
4.1. Distinction of strychnine and its counterions in CDCl3

14
4.1.1. 1D 1H NMR spectroscopy of strychnine and its salts
1H NMR spectra of strychnine, strychnine hydrochloride and strychnine hemisulphate
recorded at 1 (Fig. S-9) and 9.4 Tesla (Fig. S-10). Solutions of strychnine free base and
of its two salts, strychnine hemisulphate and strychnine hydrochloride, were prepared
by dissolving 135 mM of strychnine and approximately 26 mM concentrations of the
other two salts in 0.5 ml of CDCl3.
Fig. S-9. 1D 1H NMR spectra of the different samples in CDCl3 obtained at 1 Tesla. a) Strychnine (135 mM), 16 scans. b) Strychnine hydrochloride (26 mM), 256 scans. c) Strychnine hemisulphate (26 mM), 256 scans.

15
Fig. S-10. 1D 1H NMR spectra of the different samples in CDCl3 obtained at 9.4 Tesla. a) Strychnine (135 mM), 16 scans. b) Strychnine hydrochloride (26 mM), 256 scans. c) Strychnine hemisulphate (26 mM), 256 scans.

16
4.1.2. 1D 13C NMR spectroscopy of strychnine and its salts
The same solutions which were used for obtaining the 1D 1H NMR spectra were used
for obtaining the 1D 13C NMR spectra at 9.4 Tesla (Fig. S-3).
Tab. S-2. 13C chemical shifts [ppm] of strychnine (135 mM) and strychnine hydrochloride (27 mM), dissolved in CDCl3, measured at 1 Tesla. The red peaks show significant differences in the chemical shifts of both compounds.
Carbon Strychnine Strychnine Hydrochloride
1 122.50 122.84
2 124.43 125.48
3 128.76 130.65
4 116.43 117.14
5 142.47 142.61
6 133.00 129.85
7 52.16 52.51
8 60.41 59.46
10 169.50 166.68
11 42.68 42.56
12 77.42 77.94
13 48.41 47.52
14 31.80 31.10
15 27.05 25.70
16 60.41 61.46
17 43.08 41.40
18 50.55 50.75
20 52.88 52.51
21 140.73 133.09
22 127.52 136.24
23 64.82 64.46

17
Tab. S-3. 1H chemical shifts [ppm] of strychnine (135 mM), strychnine hydrochloride (27 mM) and strychnine hemisulphate (26 mM) in CDCl3 measured at 1 Tesla
Proton Strychnine Strychnine hydrochloride Strychnine hemisulphate
22 5.82 6.34 6.25
16 3.93 4.65 4.74
8 3.65 3.83 3.81
2 7.08 7.16 7.13
12 4.28 4.39 4.39
23a 4.09 4.22 4.18
Tab. S-4. 1H chemical shifts [ppm] of strychnine (135 mM), strychnine and strychnine hydrochloride (10 mM), and strychnine and strychnine hemisulphate (10 mM) in CDCl3 measured at 1 TeslaProton Strychnine Strychnine + Strychnine hydrochloride Strychnine + Strychnine hemisulphate
22 5.82 5.93 5.86
20a 3.48 3.62 3.54
20b 2.46 2.57 2.50
8 3.65 3.68 3.66
2 7.08 7.08 7.08
12 4.28 4.31 4.29
23a 4.09 4.11 4.10
4.2. Distinction of strychnine and its salts in CD3OD
4.2.1. 1D 1H NMR spectroscopy of strychnine and its salts
Solutions of the strychnine free base (30 mM) and the two salts, strychnine
hemisulphate (65 mM) and strychnine hydrochloride (67 mM), were prepared in 0.5 ml
of CD3OD. Each salt was measured with 4 scans at 1 Tesla and the strychnine base
with 64 scans. The 1D 1H NMR spectra of strychnine (Fig. S-11) and its salts show the
chemical differences in terms of chemical shift (Table S-5).The results were compared
with the spectra for the same samples obtained at 9.4 T (Fig. S-12).

18
Fig. S-11. 1D 1H NMR spectra obtained at 1 Tesla in 0.5 ml of CD3OD. a) Strychnine (30 mM). b) Strychnine hydrochloride (67 mM), 4 scans c) Strychnine hemisulphate (65 mM), 4 scans

19
Fig. S-12. 1D 1H NMR spectra of the different samples in CD3OD obtained at 9.4 Tesla with 16 scans. a) Strychnine (27 mM). b) Strychnine hydrochloride (65 mM). c) Strychnine hemisulphate (65 mM).

20
4.2.2. 1D 13C NMR spectroscopy of strychnine and its salts
The same solutions which were used for obtaining the 1D 1H NMR spectra were used
for obtaining the 1D 13C NMR spectra at 1 (Fig. S-13) and 9.4 Tesla (Fig. S-14).The
results showed the differences in the chemical shift of certain carbon atoms
summarized in the Tab. S-6.
Fig. S-13. 1D 13C NMR spectra obtained at 1 Tesla in 0.5 ml of CD3OD. a) Strychnine hydrochloride (67 mM), 4096 scans. b) Strychnine hemisulphate (65 mM), 4096 scans.

21
Fig. S-14. 1D 13C NMR spectra of a) Strychnine hydrochloride (67 mM) and b) Strychnine hemisulpahte (65 mM) in 0.5 ml of CD3OD obtained at 9.4 Tesla with 1024 scans and a repetition time of 1.75 seconds.
Tab. S-5. 1H chemical shifts [ppm] of strychnine (30 mM) and strychnine hydrochloride (67 mM) and strychnine hemisulphate (65 mM) in CD3OD measured at 1 Tesla
Proton Strychnine Strychnine hydrochloride Strychnine hemisulphate
22 5.98 6.44 6.39
8 3.84 4.20 4.20
16 3.80 4.56 4.56
23a 4.21 4.31 4.28

22
Tab. S-6. 13C chemical shifts of strychnine hydrochloride and strychnine hemisulphate, dissolved in CD3OD, measured at 1 Tesla. The red peaks depict significant differences in the chemical shifts of both compounds. The blue peaks show alternate chemical shifts in both compounds.
Carbon Strychnine hydrochloride Strychnine hemisulphate
1 123.96 124.39
2 126.26 126.23
3 131.03 130.87
4 117.57 117.49
5 143.47 143.40
6 130.84 131.36
7 53.17 53.36
8 60.48 60.55
10 171.70 171.70
11 42.93 42.99
12 78.19 78.29
13 48.34 48.51
14 31.81 31.91
15 26.08 26.19
16 63.92 63.46
17 42.21 42.23
18 52.47 52.19
20 53.45 53.18
21 133.95 134.66
22 137.55 136.97
23 65.19 65.22
4.3. Analysis of strychnine salts dissolved in D2O
4.3.1. 1D 1H NMR spectroscopy
As strychnine is insoluble in D2O, solutions of the two salts strychnine hemisulphate (65
mM) and strychnine hydrochloride (67 mM) were prepared in 0.5 ml D2O. For each
sample 1H spectrum was measured with 4 scans at 1 Tesla. The 1D 1H NMR spectra

23
(Fig. S-15) do not show any differences. This was confirmed by recording the 1D 1H
(Fig. S-16) NMR spectra of strychnine hydrochloride and strychnine hemisulphate at 9.4
Tesla.
4.3.2. 1D 13C NMR spectroscopy
The same samples studied by 1H NMR spectroscopy were measured with 4096 scans
to record their 13C spectra at 1 Tesla (Fig. S-17). The 13C spectra of both salts do not
show significant differences (Tab. S-7) even at high field (Fig. S-18). This is due to the
fact that the solvation of the cations and anions in the salts of strychnine by D2O
molecules reduces the electrostatic interactions of the cations with the anions.

24
Fig. S-15. 1D 1H NMR spectrum obtained at 1 Tesla in 0.5 ml of D2O. a) Strychnine hydrochloride (67 mM). b) Strychnine hemisulphate (65 mM).

25
Fig. S-16. 1D 1H NMR spectra of a) Strychnine hydrochloride (65 mM) and b) Strychnine hemisulphate (65 mM) obtained at 9.4 Tesla in 0.5 ml of D2O.

26
Fig. S-17. 1D 13C NMR spectra of strychnine salts dissolved in D2O and measured at 1 Tesla. a) Strychnine hydrochloride (67 mM), 4096 scans. b) Strychnine hemisulpahte (65 mM), 4096 scans.

27
Fig. S-18.. 1D 13C NMR spectra of a) Strychnine hydrochloride (65 mM) b) Strychnine hemisulphate (65 mM) obtained at 9.4 Tesla in 0.5 ml of D2O.

28
Tab.S-7. 13C chemical shifts measured at 1 Tesla for strychnine hydrochloride and strychnine hemisulphate in D2O.
Carbon Strychnine hydrochloride Strychnine hemisulphate
1 125.72 125.75
2 128.26 128.24
3 132.62 132.58
4 118.61 118.60
5 143.59 143.64
6 132.27 132.35
7 54.31 54.27
8 61.57 61.54
10 174.27 174.29
11 43.45 43.45
12 79.20 79.20
13 48.88 48.86
14 32.41 32.40
15 27.09 27.03
16 65.07 64.97
17 43.18 43.14
18 53.82 53.73
20 54.90 54.87
21 135.09 135.20
22 138.04 137.95
23 66.51 66.49
References
1. A. E. Metaxas, J. R. Cort, Magn. Reson. Chem. 2013, 51, 292-298.